Local Elevation Surface Modeling using GPS Derived Point Clouds. John G. Whitman, Jr.
|
|
|
- Virginia Caldwell
- 5 years ago
- Views:
Transcription

1 Local Elevation Surface Modeling using GPS Derived Point Clouds


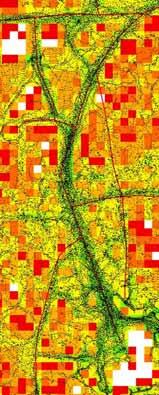
2 Study Area Overview Topographic Background NAIP with Roads and Streams

3 Public DEM Models of Study Area National Elevation Dataset DEM24

4 NED Hill Topography Detail

5 DEM24 Hill Topography Detail
6 Surprising DEM Metadata National Elevation Dataset RMS: 2.44 meters (8.0 feet) NMAS: 3.99 m ( % confidence NSSDA: 4.75 m ( % confidence (Absolute vertical accuracy measured against 13,000 National Geodetic Survey benchmarks across US and given by confidence level) VCGI DEM24 Metadata Desired RMS: 7 meters (23 feet) Allowable RMS: 15 meters (49 feet) (These figures are believed to be conservatively based on the production goals for USGS 7.5 minute DEMs)
7 Equipment and Software Employed Trimble GPS Resources GeoExplorer XT Handheld Field Computer (2008 Series) Hurricane External Antenna Terrasync Field Software Pathfinder Office Desktop Software ESRI GIS Software ArcGIS Desktop (ArcEditor Level) Spatial Analyst Extension 3D Analyst Extension
8 Overview of Methodology GPS Data Collection/Export Walk the area of interest, randomly or systematically, collecting Not in Feature GPS positions at 1 second intervals Correct positions by postprocessing and export as a point shapefile Repeat as needed to achieve full area coverage GIS Processing/Presentation Select a suitable data structure and parameters for surface representation (TIN, raster, terrain) Merge data from multiple days of collection and convert to chosen format Display, analyze and evaluate the resulting elevation surface
9 Necessary Conditions for Success Good Horizontal Positions NED s 10 meter post spacing represents the horizontal spatial resolution we seek to improve upon We should check how well the nominally sub meter GPS hardware/software system performs under the field conditions actually experienced Not Too Bad Elevations NED elevation absolute accuracy is 8 feet RMS, 16 feet with 95% confidence DEM based elevation contours are generally drawn at 20 foot intervals Averaging of individual GPS elevation values will be needed to improve upon a NED elevation surface

10 Data Collection Focus Areas Copyright John G. Whitman, Jr


11 1 st GPS Data Capture Illustration North Pasture Data Capture Position Detail with Elevations


12 2 nd GPS Data Capture Illustration Spruce Grove Data Capture Position Detail with Elevations

13 Spruce Grove Route Detail


14 Further Look at Spruce Grove Data Spruce Grove GPS Positions Track with Precision Circles


15 Horizontal Positional Uncertainty Best Day Estimate Best Day Detail

16 Horizontal Positional Uncertainty Accuracy Estimate Statistics Cumulative Data Collection Estimated accuracies for 367,989 corrected positions Range % Cum % 0 15cm cm cm m m m >5m

17 Elevation Data Range Comparison

18 Elevation Data SD Comparison

19 West Slopes Elevation SDs

20 Example Red Cell Elevation Stats
21 Averaging Noisy Values in Raster Cells Law of Large Numbers Sample means become more concentrated about the universe (true) mean as the sample size grows. Central Limit Theorem The expected value of a sample mean is the true mean. The standard deviation of sample means decreases with the square root of sample size. Tchebycheff s Inequality The probability that a randomly sampled value differs from the true mean by more than K standard deviations will not exceed 1/K 2 (regardless of the shape of the distribution).

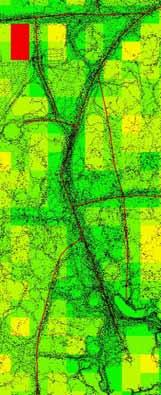
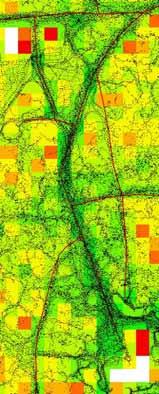
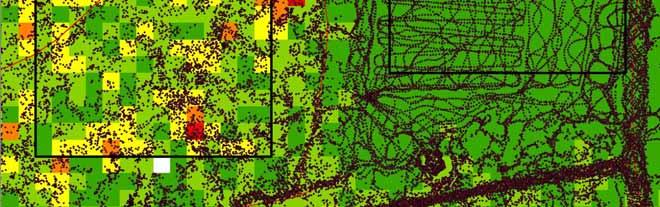
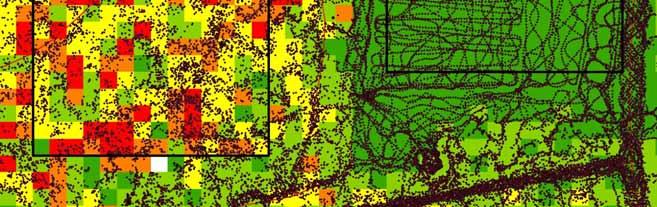
22 Cell Size vs. Point Count Sufficiency 10m Cells 7m Cells 5m Cells 3m Cells

23 Unavoidable GPS Data Gaps Copyright John G. Whitman, Jr
 Original Image Low Pass Filter 3X Larger")
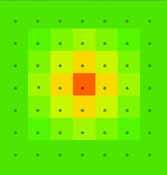
24 Low Pass Spatial Filtering (is not equivalent to resampling) Original Image Low Pass Filter 3X Larger Cells


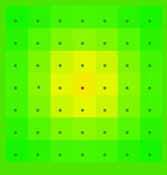
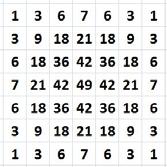
25 Single Cell Spatial Filtering Unfiltered First Pass Second Pass Third Pass

26 Noisy Image Low Pass Spatial Filtering First Pass Second Pass Third Pass


27 Validating an Elevation Surface North Pasture South Flats

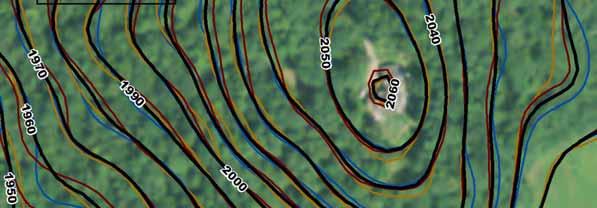
28 Hilltop Area Contours
")
29 Expanded Area Validation (Method 1) View encompasses all four focus areas (~40 acres) Colored 10 foot contours were developed using two fully independent data subsets odd days magenta even days orange Heavy black contours were developed using combined (odd + even) data

30 Expanded Area Validation (Method 2) Colored and black 10 foot contours as before odd days magenta even days orange odd + even black Background colors indicate magnitude of odd even MSL differences feet dark green feet light green feet yellow

31 GPS NED Elevation Differences 40 acre extent as before GPS surface believed reliable to plus/minus 5 feet Colors indicate magnitude of GPS and NED MSL differences feet dark green feet light green feet yellow feet orange feet red


32 GPS NED Contour Comparison GPS Surface NED Surface
33 Reflection and Conclusions Field methods GPS equipment/software performance GIS processing and tools Practicality General satisfaction What s next? Copyright John G. Whitman, Jr

34 Contact Information Copyright John G. Whitman, Jr
ROCKY FORK TRACT: VIEWSHED ANALYSIS REPORT
 ROCKY FORK TRACT: VIEWSHED ANALYSIS REPORT Prepared for: The Conservation Fund Prepared by: A Carroll GIS 3711 Skylark Trail Chattanoga, TN 37416 INTRODUCTION This report documents methods and results
Lecture 21 - Chapter 8 (Raster Analysis, part2)
") GEOL 452/552 - GIS for Geoscientists I Lecture 21 - Chapter 8 (Raster Analysis, part2) Today: Digital Elevation Models (DEMs), Topographic functions (surface analysis): slope, aspect hillshade, viewshed,
GEOL 452/552 - GIS for Geoscientists I Lecture 21 - Chapter 8 (Raster Analysis, part2) Today: Digital Elevation Models (DEMs), Topographic functions (surface analysis): slope, aspect hillshade, viewshed,
Final project: Lecture 21 - Chapter 8 (Raster Analysis, part2) GEOL 452/552 - GIS for Geoscientists I
 GEOL 452/552 - GIS for Geoscientists I") GEOL 452/552 - GIS for Geoscientists I Lecture 21 - Chapter 8 (Raster Analysis, part2) Talk about class project (copy follow_along_data\ch8a_class_ex into U:\ArcGIS\ if needed) Catch up with lecture 20
GEOL 452/552 - GIS for Geoscientists I Lecture 21 - Chapter 8 (Raster Analysis, part2) Talk about class project (copy follow_along_data\ch8a_class_ex into U:\ArcGIS\ if needed) Catch up with lecture 20
Applied Cartography and Introduction to GIS GEOG 2017 EL. Lecture-7 Chapters 13 and 14
 Applied Cartography and Introduction to GIS GEOG 2017 EL Lecture-7 Chapters 13 and 14 Data for Terrain Mapping and Analysis DEM (digital elevation model) and TIN (triangulated irregular network) are two
Copyright The McGraw-Hill Companies, Inc. Permission required for reproduction or display.
 Chapter 13. TERRAIN MAPPING AND ANALYSIS 13.1 Data for Terrain Mapping and Analysis 13.1.1 DEM 13.1.2 TIN Box 13.1 Terrain Data Format 13.2 Terrain Mapping 13.2.1 Contouring 13.2.2 Vertical Profiling 13.2.3
Report: Comparison of Methods to Produce Digital Terrain Models
 Report: Comparison of Methods to Produce Digital Terrain Models Evan J Fedorko West Virginia GIS Technical Center 27 April 2005 Introduction This report compares Digital Terrain Models (DTM) created through
Alaska Department of Transportation Roads to Resources Project LiDAR & Imagery Quality Assurance Report Juneau Access South Corridor
 Alaska Department of Transportation Roads to Resources Project LiDAR & Imagery Quality Assurance Report Juneau Access South Corridor Written by Rick Guritz Alaska Satellite Facility Nov. 24, 2015 Contents
GY461 GIS 1: Environmental Campus Topography Project with ArcGIS 9.x
 I. Introduction GY461 GIS 1: Environmental In this project you will use data from a topographic survey of the USA campus to generate 2 separate maps: 1. A color-coded 2-dimensional topographic contour
LiDAR Derived Contours
 LiDAR Derived Contours Final Delivery June 10, 2009 Prepared for: Prepared by: Metro 600 NE Grand Avenue Portland, OR 97232 Watershed Sciences, Inc. 529 SW Third Avenue, Suite 300 Portland, OR 97204 Metro
Wednesday, July 15, Author: Eldris Ferrer Gonzalez, M.Sc. Engineering CSA Group
 Twenty ninth Annual ESRI International User Conference Wednesday, July 15, 2009 Author: Eldris Ferrer Gonzalez, M.Sc. Engineering CSA Group Introduction to Valenciano Project LIDAR Survey for Valenciano
Purpose: To explore the raster grid and vector map element concepts in GIS.
 GIS INTRODUCTION TO RASTER GRIDS AND VECTOR MAP ELEMENTS c:wou:nssi:vecrasex.wpd Purpose: To explore the raster grid and vector map element concepts in GIS. PART A. RASTER GRID NETWORKS Task A- Examine
2. POINT CLOUD DATA PROCESSING
 Point Cloud Generation from suas-mounted iphone Imagery: Performance Analysis A. D. Ladai, J. Miller Towill, Inc., 2300 Clayton Road, Suite 1200, Concord, CA 94520-2176, USA - (andras.ladai, jeffrey.miller)@towill.com
GIS LAB 8. Raster Data Applications Watershed Delineation
 GIS LAB 8 Raster Data Applications Watershed Delineation This lab will require you to further your familiarity with raster data structures and the Spatial Analyst. The data for this lab are drawn from
LORI COLLINS, RESEARCH ASSOCIATE PROFESSOR CONTRIBUTIONS BY: RICHARD MCKENZIE AND GARRETT SPEED, DHHC USF L IBRARIES
 LORI COLLINS, RESEARCH ASSOCIATE PROFESSOR CONTRIBUTIONS BY: RICHARD MCKENZIE AND GARRETT SPEED, DHHC USF L IBRARIES AERIAL AND TERRESTRIAL SURVEY WORKFLOWS Workflow from project planning applications
Central Coast LIDAR Project, 2011 Delivery 1 QC Analysis LIDAR QC Report February 17 th, 2012
 O R E G O N D E P A R T M E N T O F G E O L O G Y A N D M I N E R A L I N D U S T R I E S OLC Central Coast Delivery 1 Acceptance Report. Department of Geology & Mineral Industries 800 NE Oregon St, Suite
Windstorm Simulation & Modeling Project
 Windstorm Simulation & Modeling Project Airborne LIDAR Data and Digital Elevation Models in Broward County, Florida Data Quality Report and Description of Deliverable Datasets Prepared for: The Broward
Contents of Lecture. Surface (Terrain) Data Models. Terrain Surface Representation. Sampling in Surface Model DEM
 Data Models. Terrain Surface Representation. Sampling in Surface Model DEM") Lecture 13: Advanced Data Models: Terrain mapping and Analysis Contents of Lecture Surface Data Models DEM GRID Model TIN Model Visibility Analysis Geography 373 Spring, 2006 Changjoo Kim 11/29/2006 1
Lecture 13: Advanced Data Models: Terrain mapping and Analysis Contents of Lecture Surface Data Models DEM GRID Model TIN Model Visibility Analysis Geography 373 Spring, 2006 Changjoo Kim 11/29/2006 1
The Reference Library Generating Low Confidence Polygons
 GeoCue Support Team In the new ASPRS Positional Accuracy Standards for Digital Geospatial Data, low confidence areas within LIDAR data are defined to be where the bare earth model might not meet the overall
Sedimentation in Aquilla Lake Hill County, Texas
 Sedimentation in Aquilla Lake Hill County, Texas by Lorena Roque Martinez, GIS and GPS Applications in Earth Sciences (GEO 327G) Introduction The Texas Water Development Board (TWDB) is in charge of offering
Using LiDAR (Light Distancing And Ranging) data to more accurately describe avalanche terrain
 data to more accurately describe avalanche terrain") International Snow Science Workshop, Davos 009, Proceedings Using LiDAR (Light Distancing And Ranging) data to more accurately describe avalanche terrain Christopher M. McCollister, and Robert H. Comey,
International Snow Science Workshop, Davos 009, Proceedings Using LiDAR (Light Distancing And Ranging) data to more accurately describe avalanche terrain Christopher M. McCollister, and Robert H. Comey,
Introduction to GIS 2011
 Introduction to GIS 2011 Digital Elevation Models CREATING A TIN SURFACE FROM CONTOUR LINES 1. Start ArcCatalog from either Desktop or Start Menu. 2. In ArcCatalog, create a new folder dem under your c:\introgis_2011
BLM Fire Project, 2013 QC Analysis Lidar and Orthophoto QC Report November 25th, 2013
 O R E G O N D E P A R T M E N T O F G E O L O G Y 1937 A N D M I N E R A L I N D U S T R I E S Department of Geology & Mineral Industries 800 NE Oregon St, Suite 965 Portland, OR 97232 BLM Fire Project,
Sandy River, OR Bathymetric Lidar Project, 2012 Delivery QC Analysis Lidar QC Report March 26 th, 2013
 O R E G O N D E P A R T M E N T O F G E O L O G Y A N D M I N E R A L I N D U S T R I E S OLC Sandy River, OR Bathymetric Lidar Project Delivery Acceptance Report. Department of Geology & Mineral Industries
Lecture 9. Raster Data Analysis. Tomislav Sapic GIS Technologist Faculty of Natural Resources Management Lakehead University
 Lecture 9 Raster Data Analysis Tomislav Sapic GIS Technologist Faculty of Natural Resources Management Lakehead University Raster Data Model The GIS raster data model represents datasets in which square
Rogue River LIDAR Project, 2012 Delivery 1 QC Analysis LIDAR QC Report September 6 th, 2012
 O R E G O N D E P A R T M E N T O F G E O L O G Y A N D M I N E R A L I N D U S T R I E S OLC Rogue River Delivery 1 Acceptance Report. Department of Geology & Mineral Industries 800 NE Oregon St, Suite
GIS Tools for Hydrology and Hydraulics
 1 OUTLINE GIS Tools for Hydrology and Hydraulics INTRODUCTION Good afternoon! Welcome and thanks for coming. I once heard GIS described as a high-end Swiss Army knife: lots of tools in one little package
A Second Look at DEM s
 A Second Look at DEM s Overview Detailed topographic data is available for the U.S. from several sources and in several formats. Perhaps the most readily available and easy to use is the National Elevation
Lecture 23 - LiDAR. GEOL 452/552 - GIS for Geoscientists I. Scanning Lidar. 30 m DEM. Lidar representations:
 GEOL 452/552 - GIS for Geoscientists I Lecture 23 - LiDAR LiDAR - some background (thanks to Chris Kahle, DNR) Converting Lidar point data to a raster Look at online lidar data for Iowa (1m hillshaded)
GEON Points2Grid Utility Instructions By: Christopher Crosby OpenTopography Facility, San Diego Supercomputer Center
 GEON Points2Grid Utility Instructions By: Christopher Crosby (ccrosby@sdsc.edu) OpenTopography Facility, San Diego Supercomputer Center (Formerly: GEON / Active Tectonics Research Group School of Earth
MassCEC Rooftop Solar Map
 MassCEC Rooftop Solar Map Data and Methods Summary Critigen, LLC Overview The detailed analysis of solar rooftop potential is a multi-step workflow with many facets and input parameters to the analysis
Creating Contours using ArcMap
 Creating Contours with ArcMap and ArcScene Digital elevation models (DEMs) are geospatial datasets that contain elevation values sampled according to a regularly spaced rectangular grid. They can be used
Topographic Survey. Topographic Survey. Topographic Survey. Topographic Survey. CIVL 1101 Surveying - Introduction to Topographic Mapping 1/7
 IVL 1101 Surveying - Introduction to Topographic Mapping 1/7 Introduction Topography - defined as the shape or configuration or relief or three dimensional quality of a surface Topography maps are very
Burns, OR LIDAR Project, 2011 Delivery QC Analysis LIDAR QC Report February 13th, 2012
 O R E G O N D E P A R T M E N T O F G E O L O G Y A N D M I N E R A L I N D U S T R I E S OLC Burns, OR Delivery Acceptance Report. Department of Geology & Mineral Industries 800 NE Oregon St, Suite 965
Files Used in this Tutorial
 RPC Orthorectification Tutorial In this tutorial, you will use ground control points (GCPs), an orthorectified reference image, and a digital elevation model (DEM) to orthorectify an OrbView-3 scene that
Files Used in this Tutorial
 RPC Orthorectification Tutorial In this tutorial, you will use ground control points (GCPs), an orthorectified reference image, and a digital elevation model (DEM) to orthorectify an OrbView-3 scene that
GEOGRAPHIC INFORMATION SYSTEMS Lecture 24: Spatial Analyst Continued
 GEOGRAPHIC INFORMATION SYSTEMS Lecture 24: Spatial Analyst Continued Spatial Analyst - Spatial Analyst is an ArcGIS extension designed to work with raster data - in lecture I went through a series of demonstrations
Workshops funded by the Minnesota Environment and Natural Resources Trust Fund
 Workshops funded by the Minnesota Environment and Natural Resources Trust Fund Conservation Applications of LiDAR Data Workshops funded by: Minnesota Environment and Natural Resources Trust Fund Presented
Digital Elevation Models
 Digital Elevation Models National Elevation Dataset 1 Data Sets US DEM series 7.5, 30, 1 o for conterminous US 7.5, 15 for Alaska US National Elevation Data (NED) GTOPO30 Global Land One-kilometer Base
BRIEF EXAMPLES OF PRACTICAL USES OF LIDAR
 BRIEF EXAMPLES OF PRACTICAL USES OF LIDAR PURDUE ROAD SCHOOL - 3/9/2016 CHRIS MORSE USDA-NRCS, STATE GIS COORDINATOR LIDAR/DEM SOURCE DATES LiDAR and its derivatives (DEMs) have a collection date for data
UAV Surveying II. Precision. Accuracy. Reliability
 UAV Surveying II Precision. Accuracy. Reliability Part One: Project Lifecycle Deliverables Part Two: Evaluation of UAV Data Accuracy and Examples of Error Part Three: AGENDA Review of Results Examples
Copyright The McGraw-Hill Companies, Inc. Permission required for reproduction or display.
 Chapter 8. ATTRIBUTE DATA INPUT AND MANAGEMENT 8.1 Attribute Data in GIS 8.1.1 Type of Attribute Table 8.1.2 Database Management 8.1.3 Type of Attribute Data Box 8.1 Categorical and Numeric Data 8.2 The
GEO 465/565 - Lab 7 Working with GTOPO30 Data in ArcGIS 9
 GEO 465/565 - Lab 7 Working with GTOPO30 Data in ArcGIS 9 This lab explains how work with a Global 30-Arc-Second (GTOPO30) digital elevation model (DEM) from the U.S. Geological Survey. This dataset can
GIS Workshop Spring 2016
 1/ 14 GIS Geographic Information System. An integrated collection of computer software and data used to view and manage information about geographic places, analyze spatial relationships, and model spatial
Soil and Water Conservation Laboratory Standard Operating Procedure
 Soil and Water Conservation Laboratory Standard Operating Procedure Sherman 230, Soil and Water Conservation Laboratory, UH Mānoa Collecting GPS data with the Trimble handheld through ArcGIS & related
STUDENT PAGES GIS Tutorial Treasure in the Treasure State
 STUDENT PAGES GIS Tutorial Treasure in the Treasure State Copyright 2015 Bear Trust International GIS Tutorial 1 Exercise 1: Make a Hand Drawn Map of the School Yard and Playground Your teacher will provide
Improved Applications with SAMB Derived 3 meter DTMs
 Improved Applications with SAMB Derived 3 meter DTMs Evan J Fedorko West Virginia GIS Technical Center 20 April 2005 This report sums up the processes used to create several products from the Lorado 7
Assimilation of Break line and LiDAR Data within ESRI s Terrain Data Structure (TDS) for creating a Multi-Resolution Terrain Model
 for creating a Multi-Resolution Terrain Model") Assimilation of Break line and LiDAR Data within ESRI s Terrain Data Structure (TDS) for creating a Multi-Resolution Terrain Model Tarig A. Ali Department of Civil Engineering American University of Sharjah,
Assimilation of Break line and LiDAR Data within ESRI s Terrain Data Structure (TDS) for creating a Multi-Resolution Terrain Model Tarig A. Ali Department of Civil Engineering American University of Sharjah,
P. O. Box 31, Jerome, ID Ph: (208) Fax: (208)
 Fax: (208)") This document describes the new features included in versions of the Trimble Positions Mobile Extension software since version 3.1.0 was released. The new features are reported relative to the previous
This document describes the new features included in versions of the Trimble Positions Mobile Extension software since version 3.1.0 was released. The new features are reported relative to the previous
Welcome to NR402 GIS Applications in Natural Resources. This course consists of 9 lessons, including Power point presentations, demonstrations,
 Welcome to NR402 GIS Applications in Natural Resources. This course consists of 9 lessons, including Power point presentations, demonstrations, readings, and hands on GIS lab exercises. Following the last
Steps for Modeling a Proposed New Reservoir in GIS
 Steps for Modeling a Proposed New Reservoir in GIS Requirements: ArcGIS ArcMap, ArcScene, Spatial Analyst, and 3D Analyst There s a new reservoir proposed for Right Hand Fork in Logan Canyon. I wanted
UAV Flight Operations for Mapping. Precision. Accuracy. Reliability
 UAV Flight Operations for Mapping Precision. Accuracy. Reliability Part One: Why is Mapping different? Part Two: What about accuracy and precision? Part Three: What is the Workflow? Part Four: AGENDA What
Vector Data Analysis Working with Topographic Data. Vector data analysis working with topographic data.
 Vector Data Analysis Working with Topographic Data Vector data analysis working with topographic data. 1 Triangulated Irregular Network Triangulated Irregular Network 2 Triangulated Irregular Networks
Field-Scale Watershed Analysis
 Conservation Applications of LiDAR Field-Scale Watershed Analysis A Supplemental Exercise for the Hydrologic Applications Module Andy Jenks, University of Minnesota Department of Forest Resources 2013
Drone2Map for ArcGIS: Bring Drone Imagery into ArcGIS. Will
 Drone2Map for ArcGIS: Bring Drone Imagery into ArcGIS Will Meyers @MeyersMaps A New Window on the World Personal Mapping for Micro-Geographies Accurate High Quality Simple Low-Cost Drone2Map for ArcGIS
Import, view, edit, convert, and digitize triangulated irregular networks
 v. 10.1 WMS 10.1 Tutorial Import, view, edit, convert, and digitize triangulated irregular networks Objectives Import survey data in an XYZ format. Digitize elevation points using contour imagery. Edit
CRC Website and Online Book Materials Page 1 of 16
 Page 1 of 16 Appendix 2.3 Terrain Analysis with USGS DEMs OBJECTIVES The objectives of this exercise are to teach readers to: Calculate terrain attributes and create hillshade maps and contour maps. use,
Esri International User Conference. July San Diego Convention Center. Lidar Solutions. Clayton Crawford
 Esri International User Conference July 23 27 San Diego Convention Center Lidar Solutions Clayton Crawford Outline Data structures, tools, and workflows Assessing lidar point coverage and sample density
Trimble GPS Analyst extension for ESRI ArcGIS software Customer FAQs
 23 April 2007 Trimble GPS Analyst extension for ESRI ArcGIS software Customer FAQs What is the GPS Analyst extension? Trimble GPS Analyst is an extension to the ESRI ArcGIS software that allows you to
Lewis County Public Works Department (County) GIS Mapping Division 350 N. Market Blvd. Chehalis, WA Phone: Fax:
 GIS Mapping Division 350 N. Market Blvd. Chehalis, WA Phone: Fax:") March 31, 2005 Project Report Lewis County, WA Contract #2262-H Report Presented to: Lewis County Public Works Department (County) GIS Mapping Division 350 N. Market Blvd. Chehalis, WA 98532-2626 Phone:
March 31, 2005 Project Report Lewis County, WA Contract #2262-H Report Presented to: Lewis County Public Works Department (County) GIS Mapping Division 350 N. Market Blvd. Chehalis, WA 98532-2626 Phone:
ArcGIS for Server Imagery Update. Cody A. Benkelman Technical Product Manager, Imagery
 ArcGIS for Server Imagery Update Cody A. Benkelman Technical Product Manager, Imagery Outline Mosaic dataset Management and dissemination of imagery - Dynamic image services, Tiled Cache Visualization
Learn how to delineate a watershed using the hydrologic modeling wizard
 v. 10.1 WMS 10.1 Tutorial Learn how to delineate a watershed using the hydrologic modeling wizard Objectives Import a digital elevation model, compute flow directions, and delineate a watershed and sub-basins
2017 OLC Silver Creek
 2017 OLC Silver Creek December 15, 2017 www.quantumspatial.com Data collected for: Oregon Department of Geology and Mineral Industries 800 NE Oregon Street Suite 965 Portland, OR 97232 Prepared by: Quantum
Surface Analysis with 3D Analyst
 2013 Esri International User Conference July 8 12, 2013 San Diego, California Technical Workshop Surface Analysis with 3D Analyst Khalid H. Duri Esri UC2013. Technical Workshop. Why use 3D GIS? Because
The Volume and Extent of the Lake Created by the Bridge of the Gods, Colombia River
 Rachel Markoff 12/1/2011 GEO 327G/386G Term Project The Volume and Extent of the Lake Created by the Bridge of the Gods, Colombia River 1. Introduction The Bonneville Landslide occurred on the Colombia
What is a Topographic Map?
 Topographic Maps Topography From Greek topos, place and grapho, write the study of surface shape and features of the Earth and other planetary bodies. Depiction in maps. Person whom makes maps is called
ArcGIS Pro: Image Segmentation, Classification, and Machine Learning. Jeff Liedtke and Han Hu
 ArcGIS Pro: Image Segmentation, Classification, and Machine Learning Jeff Liedtke and Han Hu Overview of Image Classification in ArcGIS Pro Overview of the classification workflow Classification tools
Creating Surfaces. Steve Kopp Steve Lynch
 Steve Kopp Steve Lynch Overview Learn the types of surfaces and the data structures used to store them Emphasis on surface interpolation Learn the interpolation workflow Understand how interpolators work
Using rasters for interpolation and visualization in GMS
 v. 10.3 GMS 10.3 Tutorial Using rasters for interpolation and visualization in GMS Objectives This tutorial teaches how GMS uses rasters to support all kinds of digital elevation models and how rasters
Buckskin Detachment Surface Interpolation, Southern Lincoln Ranch Basin, Buckskin Mountains, Western Arizona Hal Hundley
 Buckskin Detachment Surface Interpolation, Southern Lincoln Ranch Basin, Buckskin Mountains, Western Arizona Hal Hundley Introduction The Lincoln Ranch basin in Buckskin Mountains in west-central Arizona
Lesson 5 overview. Concepts. Interpolators. Assessing accuracy Exercise 5
 Interpolation Tools Lesson 5 overview Concepts Sampling methods Creating continuous surfaces Interpolation Density surfaces in GIS Interpolators IDW, Spline,Trend, Kriging,Natural neighbors TopoToRaster
Municipal Projects in Cambridge Using a LiDAR Dataset. NEURISA Day 2012 Sturbridge, MA
 Municipal Projects in Cambridge Using a LiDAR Dataset NEURISA Day 2012 Sturbridge, MA October 15, 2012 Jeff Amero, GIS Manager, City of Cambridge Presentation Overview Background on the LiDAR dataset Solar
Channel Conditions in the Onion Creek Watershed. Integrating High Resolution Elevation Data in Flood Forecasting
 Channel Conditions in the Onion Creek Watershed Integrating High Resolution Elevation Data in Flood Forecasting Lukas Godbout GIS in Water Resources CE394K Fall 2016 Introduction Motivation Flooding is
Overview. 1. Aerial LiDAR in Wisconsin (20 minutes) 2. Demonstration of data in CAD (30 minutes) 3. High Density LiDAR (20 minutes)
 2. Demonstration of data in CAD (30 minutes) 3. High Density LiDAR (20 minutes)") Overview 1. Aerial LiDAR in Wisconsin (20 minutes) 2. Demonstration of data in CAD (30 minutes) 3. High Density LiDAR (20 minutes) 4. Aerial lidar technology advancements (15 minutes) 5. Q & A 1. Aerial
Overview 1. Aerial LiDAR in Wisconsin (20 minutes) 2. Demonstration of data in CAD (30 minutes) 3. High Density LiDAR (20 minutes) 4. Aerial lidar technology advancements (15 minutes) 5. Q & A 1. Aerial
Geometric Rectification of Remote Sensing Images
 Geometric Rectification of Remote Sensing Images Airborne TerrestriaL Applications Sensor (ATLAS) Nine flight paths were recorded over the city of Providence. 1 True color ATLAS image (bands 4, 2, 1 in
N.J.P.L.S. An Introduction to LiDAR Concepts and Applications
 N.J.P.L.S. An Introduction to LiDAR Concepts and Applications Presentation Outline LIDAR Data Capture Advantages of Lidar Technology Basics Intensity and Multiple Returns Lidar Accuracy Airborne Laser
Learn how to delineate a watershed using the hydrologic modeling wizard
 v. 11.0 WMS 11.0 Tutorial Learn how to delineate a watershed using the hydrologic modeling wizard Objectives Import a digital elevation model, compute flow directions, and delineate a watershed and sub-basins
An Introduction to Lidar & Forestry May 2013
 An Introduction to Lidar & Forestry May 2013 Introduction to Lidar & Forestry Lidar technology Derivatives from point clouds Applied to forestry Publish & Share Futures Lidar Light Detection And Ranging
FOR Save the Poudre: Poudre Waterkeeper BY PetersonGIS. Inputs, Methods, Results. June 15, 2012
 W e t l a n d s A n a l y s i s FOR Save the Poudre: Poudre Waterkeeper BY PetersonGIS Inputs, Methods, Results June 15, 2012 PROJECT GOALS The project goals were 1) create variable width buffers along
Section G. POSITIONAL ACCURACY DEFINITIONS AND PROCEDURES Approved 3/12/02
 Section G POSITIONAL ACCURACY DEFINITIONS AND PROCEDURES Approved 3/12/02 1. INTRODUCTION Modern surveying standards use the concept of positional accuracy instead of error of closure. Although the concepts
Reality Check: Processing LiDAR Data. A story of data, more data and some more data
 Reality Check: Processing LiDAR Data A story of data, more data and some more data Red River of the North Red River of the North Red River of the North Red River of the North Introduction and Background
v. 8.4 Prerequisite Tutorials Watershed Modeling Advanced DEM Delineation Techniques Time minutes
 v. 8.4 WMS 8.4 Tutorial Modeling Orange County Rational Method GIS Learn how to define a rational method hydrologic model for Orange County (California) from GIS data Objectives This tutorial shows you
Project Report Nooksack South Fork Lummi Indian Nation. Report Presented to:
 June 5, 2005 Project Report Nooksack South Fork Lummi Indian Nation Contract #2291-H Report Presented to: Lummi Indian Nation Natural Resources Department 2616 Kwina Road Bellingham, WA 98226 Point of
Using GIS to Site Minimal Excavation Helicopter Landings
 Using GIS to Site Minimal Excavation Helicopter Landings The objective of this analysis is to develop a suitability map for aid in locating helicopter landings in mountainous terrain. The tutorial uses
Objectives Learn how GMS uses rasters to support all kinds of digital elevation models and how rasters can be used for interpolation in GMS.
 v. 9.1 GMS 9.1 Tutorial Using rasters for interpolation and visualization in GMS Objectives Learn how GMS uses rasters to support all kinds of digital elevation models and how rasters can be used for interpolation
UNDERSTAND HOW TO SET UP AND RUN A HYDRAULIC MODEL IN HEC-RAS CREATE A FLOOD INUNDATION MAP IN ARCGIS.
 CE 412/512, Spring 2017 HW9: Introduction to HEC-RAS and Floodplain Mapping Due: end of class, print and hand in. HEC-RAS is a Hydrologic Modeling System that is designed to describe the physical properties
Georeferencing & Spatial Adjustment
 Georeferencing & Spatial Adjustment Aligning Raster and Vector Data to the Real World Rotation Differential Scaling Distortion Skew Translation 1 The Problem How are geographically unregistered data, either
DIGITAL ROAD PROFILE USING KINEMATIC GPS
 ARTIFICIAL SATELLITES, Vol. 44, No. 3 2009 DOI: 10.2478/v10018-009-0023-6 DIGITAL ROAD PROFILE USING KINEMATIC GPS Ashraf Farah Assistant Professor, Aswan-Faculty of Engineering, South Valley University,
Tutorial 1: Downloading elevation data
 Tutorial 1: Downloading elevation data Objectives In this exercise you will learn how to acquire elevation data from the website OpenTopography.org, project the dataset into a UTM coordinate system, and
Making Yield Contour Maps Using John Deere Data
 Making Yield Contour Maps Using John Deere Data Exporting the Yield Data Using JDOffice 1. Data Format On Hard Drive 2. Start program JD Office. a. From the PC Card menu on the left of the screen choose
L7 Raster Algorithms
 L7 Raster Algorithms NGEN6(TEK23) Algorithms in Geographical Information Systems by: Abdulghani Hasan, updated Nov 216 by Per-Ola Olsson Background Store and analyze the geographic information: Raster
DEM Artifacts: Layering or pancake effects
 Outcomes DEM Artifacts: Stream networks & watersheds derived using ArcGIS s HYDROLOGY routines are only as good as the DEMs used. - Both DEM examples below have problems - Lidar and SRTM DEM products are
v SMS Tutorials Working with Rasters Prerequisites Requirements Time Objectives
 v. 12.2 SMS 12.2 Tutorial Objectives Learn how to import a Raster, view elevations at individual points, change display options for multiple views of the data, show the 2D profile plots, and interpolate
Lab 12: Sampling and Interpolation
 Lab 12: Sampling and Interpolation What You ll Learn: -Systematic and random sampling -Majority filtering -Stratified sampling -A few basic interpolation methods Data for the exercise are in the L12 subdirectory.
GEOGRAPHIC INFORMATION SYSTEMS Lecture 25: 3D Analyst
 GEOGRAPHIC INFORMATION SYSTEMS Lecture 25: 3D Analyst 3D Analyst - 3D Analyst is an ArcGIS extension designed to work with TIN data (triangulated irregular network) - many of the tools in 3D Analyst also
Topographic Lidar Data Employed to Map, Preserve U.S. History
 OCTOBER 11, 2016 Topographic Lidar Data Employed to Map, Preserve U.S. History In August 2015, the National Park Service (NPS) contracted Woolpert for the Little Bighorn National Monument Mapping Project
Lab 11: Terrain Analyses
 Lab 11: Terrain Analyses What You ll Learn: Basic terrain analysis functions, including watershed, viewshed, and profile processing. There is a mix of old and new functions used in this lab. We ll explain
GISC9312- Geospatial Visualization
 GISC9312- Geospatial Visualization Assignment#D1 Ibeabuchi Nkemakolam April 17, 2013 Janet Finlay BA,.BSc. GIS-GM Program Professor Niagara College 135 Taylor Road Niagara-On-The-Lake, ON L0S 1J0 Dear
Image Services for Elevation Data
 Image Services for Elevation Data Peter Becker Need for Elevation Using Image Services for Elevation Data sources Creating Elevation Service Requirement: GIS and Imagery, Integrated and Accessible Field
Raster: The Other GIS Data
 Raster_The_Other_GIS_Data.Docx Page 1 of 11 Raster: The Other GIS Data Objectives Understand the raster format and how it is used to model continuous geographic phenomena. Understand how projections &
Georeferencing & Spatial Adjustment 2/13/2018
 Georeferencing & Spatial Adjustment The Problem Aligning Raster and Vector Data to the Real World How are geographically unregistered data, either raster or vector, made to align with data that exist in