Reconnaissance Survey for Hydroelectric Turbine Sites
|
|
|
- Shavonne Flowers
- 5 years ago
- Views:
Transcription

1 Reconnaissance Survey for Hydroelectric Turbine Sites YUKON RIVER AT RUBY, ALASKA May 20, 2009 Version 3.1 Prepared for The Yukon River Inter-Tribal Watershed Council Prepared by: TerraSond Ltd S. Industrial Way, Suite 3 Palmer, AK Phone: (907) Web Site:
2
3 TABLE OF CONTENTS 1.0 GEODESY & NAVIGATION GEODETIC NETWORK Monument H Monument H Monument RBY A NAVIGATION TERRESTRIAL SURVEY HYDROGRAPHY ACQUISITION OF HYDROGRAPHIC DATA Acquisition of Multibeam data Acquisition of Side Scan Sonar HYDROGRAPHIC PROCESSING Application of Control Information Multibeam Echosounder Processing Vessel Editor Raw Data Conversion Navigation Editor Attitude Editor Sound Velocity Editor GPS Tide Computation and Merge Subset Editor Caris BASE Surfaces Processing of Side Scan Sonar HYDROGRAPHIC PRODUCTS Bathymetric DEM gridded dataset and imagery Acoustic Intensity Mosaic Hazard for Construction and Danger to Navigation List IMPORTANT NOTE HYDROKINETICS ACQUISITION AND PROCESSING OF DISCHARGE MEASUREMENT ACQUISITION AND PROCESSING OF CURRENT MAGNITUDE IMAGERY PLANNING INFRASTRUCTURE DEVELOPMENT CONCLUSIONS AND RECOMMENDATIONS i MAY 2010
4 TABLE OF APPENDICES A B C D E GEODETIC INFORMATION CURRENT MAGNITUDE IMAGES DVD PROCESSED DATA FLEDERMAUS DIGITAL PRESENTATION 2009 TURBINE PLACEMENT POSTER LIST OF TABLES Table One Monument H Table Two Monument H Table Three Monument RBY A 1 4 Table Four List of Terrestrial Survey Points 1 6 Table Five Technical information for the Teledyne Odom ES3 MBES 2 9 Table Six Technical information for the Imagenix Yellowfin Side Scan Sonar 2 12 Table Seven List of Obstructions interpreted from the MBES and SSS data sets 2 25 LIST OF GRAPHICS Graphic A Project area, vicinity of Ruby, AK 1 1 Graphic B Location of H Graphic C Monument H Graphic D Location of H Graphic E Monument H Graphic F Location of RBY A 1 4 Graphic G Monument RBY A 1 4 Graphic H Bathymetric contours generated from the MBES survey 2 7 Graphic I Teledyne Odom ES3 Multibeam Echosounder Sonar 2 8 Graphic J Preprocessed MBES Matrix as acquired in the field 2 9 Graphic K Acquisition of Sound Velocity Profile measurement 2 10 Graphic L Navigation tower requiring innovative solutions for remote survey operations 2 10 Graphic M Ruby Tribal Council Jon Boat as survey vessel of opportunity 2 11 Graphic N Imagenix Side Scan Sonar 2 11 Graphic O Side scan sonar coverage area 2 12 Graphic P Image of Bathymetric Surface (scaled by depth) 2 20 Graphic Q Acoustic Intensity Mosaic Image 2 21 Graphic R Geologic Interpretation of the Riverbed near the project site 2 22 Graphic S Charted vs. Uncharted boundary for Dangers and Hazards 2 23 Graphic T Average discharge behavior on the Yukon River (Water Resources Investigations Report ) 2 24 Graphic U Obstruction locations over project area 2 25 Graphic V Zone of Avoidance due to Danger to Navigation obstructions in the vicinity of the 2008 deployment site 2 25 Graphic W ADCP Transect lines for current velocity measurements across the Yukon River 3 27 Graphic X Ship track line from the ADCP referencing both the geodetic navigation and the bottom tracking navigation 3 28 Graphic Y Current Magnitude for Transect G illustrating the current distribution across the alveus 3 30 Graphic Z Processed current magnitude images for the nearest three transects to the Power Junction Box 4 31 Graphic AA Processed current magnitude for Line A as it flows into the project area of interest 4 31 Graphic BB Original choice for 2009 Turbine Site A while in the field 4 33 Graphic CC Processed Bathymetry showing locations of infrastructure positions 4 33 Graphic DD Slope Analysis with Anchor Sites and Zone of Caution 4 34 Graphic EE Image from the Fledermaus Presentation for the profile demonstrated in Graphic CC 4 34 Graphic FF Drawing of the TerraSond recommendation for positioning of the anchors and turbine 4 35 Graphic GG Image from ESRI Presentation for the river including general geomorphology 4 35 ii MAY 2010
5 PROJECT SUMMARY On May 20, 2009, TerraSond Ltd. (TerraSond) mobilized under contract for Yukon River Inter- Tribal Watershed Council (YRITWC) to Ruby, Alaska. The contract specified the recording, processing, analysis, and presentation of remotely sensed data for the purpose of interpreting the physical characteristics for an In-river Hydrokinetic Power Conversion Proof-of-Concept Project. TerraSond acquired measurements along a 350 m (288,301 m 2 ) stretch of Yukon River. The purpose of this project was to identify optimum candidate sites for turbine placement. The scope of the field effort included establishing a local terrestrial geodetic network, measuring discharge flow, measuring current velocity, measuring bathymetric, and subsurface riverbed reflectivity. TerraSond calculated a Minimally Controlled Geodetic Network for Ruby. Two new monuments were established in the vicinity of the survey area. Simultaneous static GPS measurements were acquired on each monument and incorporated into the control network (H , H , and RBY A). The Geodetic network was originally measured in WGS84 space and controlled by holding RBY A fixed as the published NGS value. The values initially used for H and H were an average of multiple OPUS solutions, however, these values were slightly deformed in the final computation of the relationships of the Geodetic Network. The primary monument used as the base station transmitting real time kinematic (RTK) corrections is H River elevation was measured each day with RTK corrected GPS receivers in order to measure river stage and to calculate the gradient of the river. The river level receded 68 cm during the acquisition period of this project. The river elevation at the start of project was established as the project datum. All depth values in this report reference this datum, all elevations reference the WGS84 ellipsoid. The relationship of the project vertical datum is m above the WGS84 ellipsoid. The final calculated position for H is: LAT: N " LONG: W " ELEVATION: 61.1 m (WGS84 Ellipsoid) TerraSond relied heavily upon the infrastructure of Ruby and the support of the Ruby Tribal Council in order to accomplish our project goals. TerraSond surveyed a Jon Boat owned by the Ruby Tribal Council and established a precision survey vessel of opportunity. TerraSond deployed a roving pole mounted Acoustic Doppler Current Profiler, a pole mounted Multibeam Echosounder, a towed Side Scan Sonar, and various Global Positioning System Equipment. The compass and the heading of the ADCP were calibrated and the moving bottom of the Yukon River was measured. Four across river current velocity profiles were measured along the primary line (Line D) and TerraSond computed a discharge value (11,300 m³/s) at the beginning of the project. Seven across-river roving transects were acquired for with the ADCP at an interval distance of m separation. iii MAY 2010
6 The bathymetric survey yielded an interpolated surface with consistent and predictable topology across the entire alveus. Only the southern portion of this surface was interpreted for Dangers to Navigation (DtoN) or Hazards for Construction (HforC). The area south of the thalweg was acquired with significant overlap and can be considered to be a fully ensonified riverbed. The portion north of the Thalweg was acquired without overlap and approximately 75% of the surface area was ensonified. Although obstructions were identified in this zone, the portion north of the thalweg has not been interpreted for DtoN nor HforC. The minimum depth measured of the alveus was 2.8 m with a maximum depth in the thalweg was of 13.7 m. The Side Scan Sonar (SSS) acoustic imagery yielded a mosaic image of the river bed. The area acquired for this project is coincident with the contiguous bathymetric data and includes the southern portion of the survey area. Individual records from the SSS were analysis for obstructions and were used in the interpretation of the riverbed geology. A normalized composite of the SSS records was assembled to produce a mosaic image of the riverbed. This composite imagery demonstrates more motion artifact then desired due to the instability of the towed fish in the turbulent environment of the Yukon at this site. Although of low aesthetic quality, the mosaic and the products from the SSS were critical for the identification of DtoN, HforC, and for the geologic interpretation. The confidence associated with targets and geologic interpretation was very high when correlated with the bathymetric geomorphology surface. The delivered products from this effort included: Terrestrial Survey Monuments (Three) Discharge Computation Current Transect Images (Seven) Sound Velocity Measurements River Temperature Measurements Digital Elevation Model Side Scan Mosaic Image Obstruction List Interpretation of the above products resulted in: Generalized Geologic Interpretation for Turbine Riverbed Anchor Infrastructure Hazards for Construction Obstruction List Danger to Navigation Obstruction list Optimum Siting for each Riverbed Anchor Optimum Siting for the Turbine Placement Slope Analysis for Turbine Riverbed Anchor Infrastructure and Cable Placement (pending) Significant obstructions were interpreted from the various datasets and their characteristics were correlated. Both DtoN and HforC were identified and charted. Obstruction classification was beyond the scope of this work, however, all sub-surface obstructions are assumed to be natural. TerraSond recommends avoidance for all obstructions identified during this survey. TerraSond finds significant hydrokinetic power available in the Yukon River at Ruby, Alaska and recommends future development of this resource. We find no significant man-made infrastructure, geographic, or geologic obstruction which would preclude this site from future development for hydrokinetic power conversion activity. Although obstructions exist within the project boundaries, it is the opinion of TerraSond that no obstacles were identified that cannot be avoided, remediated, or otherwise overcome through skillful engineering. iv MAY 2010
7 This page intentionally left blank.
8 This page intentionally left blank.

9 1.0 GEODESY & NAVIGATION Graphic A - Project area, vicinity of Ruby, AK TerraSond was contracted to establish a persistent geodetic network in the vicinity of the Ruby, AK. TerraSond was tasked with identifying the most advantageous space for repeatable measurements as well as identifying the best space for communicating the physical characteristic information regarding this survey area. TerraSond used a minimally constrained solution which included three monuments. The position of those monuments was first referenced against CORS GPS sites within an OPUS solution. The final network solution held the NGS airport monument RBY A constant while calculating a best fit solution for the newly established monuments. TerraSond indentified insignificant shift between the spatial references and ultimately migrated the positions by sub-decimeter quantities. TerraSond recovered one existing monument (RBY A) and established two new survey monuments (H , H ). The horizontal project datum is UTM, zone 5, meters, in projection NAD83. The river elevation at the start of project was established as the project datum. All depth values in this report reference this datum, all elevations reference the WGS84 ellipsoid. The relationship of the project vertical datum is m above the WGS84 ellipsoid. 1.1 Geodetic Network TerraSond calculated a Minimally Controlled Geodetic Network for the Ruby area. Simultaneous static GPS measurements were acquired on each monument and incorporated into the control network (H , H , and RBY A). The Geodetic network was measured with GPS receivers in WGS84 space and each monument was originally assigned an assumed value. 1-1 MAY 2010


10 The measured values were later recalculated and the assumed values were replaced with the final network calculated positions. The Minimally Controlled Geodetic Network was controlled by holding RBY A fixed as the published NGS value. The values used for H and H in the network were an average of multiple OPUS solutions. The relationships between the monuments were calculated and corrected to best conform with the static GPS measurements in order to establish the final Geodetic Network positions Monument H The primary monument for this project used as the base station transmitting real time kinematic (RTK) corrections is H H was used as the source for all positional RTK corrections distributed by the base station GPS receiver. H was located within the boundary of a public park area adjacent to the river along River Rd. Graphic B - Location of H Graphic C - Monument H TerraSond Survey Monument H Horizontal Vertical Geodetic UTM Zone 5 (NAD83) WGS84 Local (m) Latitude Longitude Northing (m) Easting (m) Ellipsoid (m) Local (m) N 64 44' " W ' " Description: 3 1/4" Aluminum domed cap on 3/4 rebar. Set fluch with grade. Powerline support pole bearing N40W@9.4 ft. Cap ~19 ft N NW of road shoulder. Table One Monument H MAY 2010

 Vertical WGS84 Local (m) Latitude Longitude Northing (m)")

11 1.1.2 Monument H TerraSond established survey monument H in the proximity of a power pole at the tee intersection of River Rd. and Yuki St. within the Town of Ruby. Graphic D - Location of H Geodetic Graphic E - Monument H TerraSond Survey Monument H Horizontal UTM Zone 5 (NAD83) Vertical WGS84 Local (m) Latitude Longitude Northing (m) Easting (m) Ellipsoid (m) Local (m) N 64 44' " W ' " Description: 3" Aluminum domed cap on 3/4 rebar set ~0.1 ft below grade. Table Two Monument H MAY 2010
 Vertical WGS84 USGS Latitude")
 DIAMETER BY 0.914. m (3.0 ft) LONG STAINLESS STEEL PIPE FLARED AT THE BASE.")
 166 DEGREES MAGNETIC AZIMUTH FROM THE AWAS STRUCTURE, AND 45.4 m (149.")
12 1.1.3 Monument RBY A RBY A is located near the northeast portion of the Ruby Airport on the North side of the runway. Graphic F - Location of RBY A Graphic G - Monument RBY A Geodetic NGS Monument RBY A Horizontal UTM Zone 6 (NAD83) Vertical WGS84 USGS Latitude Longitude Northing (m) Easting (m) Ellipsoid (m) Local (m) N 64 43' " W ' " Description: THE STATION IS A NONSTANDARD NGS m (0.271 ft) DIAMETER BY m (3.0 ft) LONG STAINLESS STEEL PIPE FLARED AT THE BASE. THE STATION IS LOCATED 39.2 m (128.5 ft) 206 DEGREES MAGNETIC AZIMUTH FROM A WIND SOCK, 63.1 m (207.0 ft) 166 DEGREES MAGNETIC AZIMUTH FROM THE AWAS STRUCTURE, AND 45.4 m (149.0 ft) 271 DEGREES MAGNETIC AZIMUTH FROM THE SECOND RUNWAY LIGHT SOUTHWEST OF THE TAXIWAY ON THE NORTH SIDE OF THE RUNWAY. Table Three Monument RBY A 1-4 MAY 2010
13 1.2 Navigation All vessel navigation was processed and distributed by Coda F-185 (F-185). The F-185 measures GPS position, heading, orientation and distributes a processed vessel trajectory. The vessel navigation and orientation was recorded in Hysweep Acquisition software during operations. Real Time Kinematic (RTK) corrections were used for vessel navigation and recorded as the positioning for all sensors utilized during this survey. This can be a more precise system of measurement than uncorrected GPS and is expected to significantly increase accuracy. This system utilizes the additional information of the carrier signal, and, when properly processed, will include the Carrier-Phase Enhancement in the final position. RTK uses the GPS satellite's carrier as its signal, not the messages contained within. The improvement possible using this signal is over a thousand times as fast as a typical GPS receiver. This corresponds to a 1% accuracy of 19 cm using the L1 signal, and 24 cm using the lower frequency L2 signal. When the two signals are correctly aligned, the generally accepted error estimation is 20 cm. RTK corrections were transmitted to the vessel navigation and recorded by the acquisition software during all survey activity. TerraSond used a temporary value for the base station location during the broadcasting of the RTK correctors. This base station value evaluated in post processing and TerraSond accounted for the migration of the measurements positions for all products distributed with this report. 1.3 Terrestrial Survey The terrestrial survey measurements were accomplished utilizing a Trimble SPS881 GPS receiver fixed to a variable-height staff. All data acquisition was accomplished while receiving RTK position corrections from the base station. The positions were evaluated and processed with Trimble Geomatics Office Ver A perspective modeler for the YRITWC requested that TerraSond measure the river gradient and a single transect on each bank of the river for future modeling purposes. The river gradient was measured to be m over the river distance of 10,525 m. River elevation was measured each day with RTK corrected GPS receivers in order to measure river stage and to calculate the gradient of the river. The river level receded 40 cm (1.3 ft) over the 4 day period of MBES acquisition. 1-5 MAY 2010
14 Ruby Terrestial Survey Shots UTM zone 5 (NAD83) Vertical Point Northing (m) Easting (m) Ellipsoid (m) Discription H WS WS WS WS CHK H WS WS WS CHK H WS WS WS WS CHK H WS WS WS WS WS WS WS WS WS H2O RND RND RND OH RND RND BRK HW WS WS WS WS WS WS PO PO PO PO PO PO PO PO PO PO PO ANCHOR J BOX Table Four List of Terrestrial Survey Points 1-6 MAY 2010

15 2.0 HYDROGRAPHY Graphic H - Bathymetric contours generated from the MBES survey TerraSond was tasked with the responsibility of acquiring, processing, and presenting remotely sensed geophysical measurements of the YRITWC Hydrokinetic Power Conversion project at Ruby, AK. The survey area included 288,301 m 2 of the Yukon River. Data acquisition methodology was designed to better describe the physical character of the site for the purpose of evaluating Hydrokinetic Power Conversion, planning future development, and assessing potential hazards during development of the site. The vessel used for all operations was the Ruby Tribal Council 18 ft aluminum Jon Boat. The geophysical instrumentation deployed during this project included a pole mounted Teledyne Odom ES3 multibeam echosounder (MBES), a pole mounted Imagenix Yellowfin side scan sonar (SSS), and all navigation was recorded using positions from RTK corrected F-185 Inertial Navigation System. The mobilization crew consisted of the project Geophysicist and a Survey Technician. The vessel mobilization took place at on the shore of the Yukon River in the Village of Ruby. The Hydrographic data set includes both the Multibeam and the Side Scan Sonar products. The mapping effort of the MBES establishes the precision and accurate foundation for which the Side Scan mosaic can be draped. Both surveys were controlled through the use of RTK corrected GPS as described in Section 1.2. The precision of the MBES which utilizes a raytracing algorithm is far superior for across track measurements then the Side Scan Sonar which only controls the nadir position at ping transmission. For this reason, the Side Scan Sonar which presents a continuous analog record of the acoustic magnitude may have some error in the position of identified objects. Side Scan Sonar products may have been spatially shifted reasonable distances in order to match with the multibeam bathymetry. 2-7 MAY 2010

16 TerraSond acquired a precise high density bathymetric data set that was be used as a base DEM surface for multiple products. The project goals for the MBES data were geomorphology of the riverbed baseline, a reference surface acquired prior to development, and for numerical modeling purposes. Object detection and geologic interpretation < 2 m 2 was beyond the scope of this project. Side Scan Sonar imagery was acquired for this project in order to collaborate with bathymetric data and to image the riverbed. Terrasond acquired high scan imagery of the riverbed in the southern portion of the project area. The acquisition area included a contiguous ensonification of the thalweg south to the cliff face. This is the area described by YRITWC to be the area of interest for construction of the Hydrokinetic Power Conversion project. The area of overlap between the Sides Scan Sonar and the Multibeam Echosounder defines the area that TerraSond interpreted HforC and DtoN, all areas outside this zone did not undergo the rigorous investigation for obstructions. The hydrographic data did identify objects, geologic features, and obstructions both within the area defined for interpretation as well as the area excluded from the interpretation. TerraSond produced a normalized mosaic image of the Side Scan Sonar data for an overall image of the riverbed. 2.1 Acquisition of Hydrographic data Graphic I - Teledyne Odom ES3 Multibeam Echosounder Sonar Acquisition of Multibeam data The Multibeam Echosounder (MBES) calibration and acquisition of main scheme MBES data occurred May 23-25, TerraSond acquired bathymetric point data with Teledyne Odom ES3 Multibeam Echosounder sonar and recorded that information using HySweep Integrated Acquisition Software. An Odom Digibar Pro acoustic velocimeter was used to measure the near field speed of sound at the sonar face. An additional Odom Digibar Pro acoustic velocimeter was used to measure the speed of sound throughout the water column via manual casts performed intermittently throughout the survey effort. 2-8 MAY 2010

17 The MBES calibration test accounts and corrects for electronic timing errors, roll, pitch, and yaw bias. TerraSond accomplished the MBES calibration acquisition according to the industry standards. Multibeam Echosounder S P E C I F I C A T I O N S Sonar Type Teledyne Odom ES3 Sonar Operation Frequency 240Khz Beam Width, Across Track 0.75, 1.5, and 3.0 degrees Beam Width, Along Track 0.75, 1.5, and 3.0 degrees Number of Beams 120, 240, 480 Swath Coverage 120 degrees Max Ping Rate m Range Table Five Technical information for the Teledyne Odom ES3 MBES TerraSond performed a calibration of the MBES using radio corrections broadcast from the H RTK base station over a subsurface river bed feature. The 240 khz acoustic data was acquired parallel to the topography throughout the main scheme survey area as regular line spacing resulting in 66 main scheme survey lines. An additional 2 cross lines were recorded as part of the quality control procedure exercised by TerraSond to ensure limited directional bias in our data. This bathymetric project resulted in a full ensonification of the river bed for the area south of and including the thalweg. The area north of the thalweg was not fully ensonified and a non-overlap 50% coverage methodology was exercised. The area where infrastructure was being considered for the project development was fully ensonified and products and interpretations applicable for riverine construction were fully ensonified. The remaining cross river section was acquired only for modeling purposes, general information, and a holistic understanding of the water body. Graphic J - Preprocessed MBES Matrix as acquired in the field 2-9 MAY 2010


18 The southern zone was acquired with significant swath overlap which allowed for a confident interpretation of the riverbed. Sound velocity measurements were acquired at 1 Hz at the face of the MBES transducer face in order to allow for proper beam forming. Sound velocity measurements were accomplished by manual cast and measured the entire water column during MBES operations in order to ensure accurate depth measurements. Graphic K - Acquisition of Sound Velocity Profile measurement Non-systematic line acquisition was exercised in the shallow portions of the river in an attempt to achieve maximum coverage and reduce holidays (gaps) as the swath area geometry decreased. Similar strategy was used along the cliff face in order to safely approach near the cliff face without striking sub-surface obstructions. Graphic L - Navigation tower requiring innovative solutions for remote survey operations 2-10 MAY 2010
 antenna and an additional secondary antenna (L1) co-located no less than 1 m apart creating a fine baseline.")

19 All vessel position and attitude were calculated with a Coda Octopus F-185. The F-185 consists of two GPS antenna and an inertial motion unit (IMU). The GPS antennas have a primary (L1/L2) antenna and an additional secondary antenna (L1) co-located no less than 1 m apart creating a fine baseline. The F-185 IMU was co-located on the pole arm attached to the Ruby Tribal Council vessel. The trajectory of the vessel was computed by the F-185 and recorded by the acquisition software. The RTK corrected GPS navigation was recorded and displayed in Hypack during vessel operations. The offsets and lever arms associated with the primary GPS phase center and the IMU were computed within HySweep and referenced to the CRP of survey vessel. Graphic M - Ruby Tribal Council Jon Boat as survey vessel of opportunity Offsets from CRP to Sonar Acoustic Center of the MBES were computed in Hysweep and a real-time acoustic coverage was computed and displayed for the survey crew Acquisition of Side Scan Sonar Graphic N - Imagenix Side Scan Sonar On May 26, 2009, the Ruby Tribal Council Jon Boat was mobilized for side scan sonar operations. An Imagenix Yellowfin model 372 was towed on the starboard side of the vessel MAY 2010

20 The side scan sonar acquisition frequency was 330 khz nominal, 50 m range, resulting in an across-track resolution of 10 cm (4 in). Navigation was corrected by real-time kinematic broadcast from the H base station. Data was acquired using Hysweep 2009 software. Imagenix Yellowfin Side-Scan Sonar S P E C I F I C A T I O N S Frequency (dual simultaneous) Choice of either 260 khz / 330 khz / 770 khz nominal Horizontal Beam Width (HDM) 260 khz: 2.2 x 75, 330 khz: 1.8 x 60, 770 khz: 0.7 x 30 Range Resolution Range Scale/1000 Interface Analog Telemetry Towing Speed (max safe) 3 knots Towfish Material Aluminum Aluminum Maximum Operating Depth 300 m Tow Cable Type Coaxial * Does not meet NOAA Shallow Water Survey Specification Min 3 pings on a 1 meter target at 100 meters range. Table Six Technical information for the Imagenix Yellowfin Side-Scan Sonar The Side Scan Sonar data was acquired parallel to the river channel geomorphology resulting in 300% coverage. Nine main scheme lines were acquired within the survey area. Cross lines were not possible due to the maneuverability of the vessel under the influence of the flow of the river and the orientation of the side scan sonar. Graphic O - Side scan sonar coverage area 2-12 MAY 2010
21 2.2 Hydrographic Processing TerraSond exercises a systematic methodology regarding data transfer from the field, processing, editing, and the development of hydrographic products. This rigorous protocol ensures product integrity throughout the processing path. Prior to processing, the entire field project was uploaded to our server system and included in the regular twice/day backup and daily replication scheme. The data was distributed and organized by the Processing Department prior to further development Application of Control Information On June, , the TerraSond Survey Department in Palmer, AK received the raw Terrestrial Survey data. The Base station established on H utilized a temporary assumed position (based off of a preliminary Ultra-Rapid OPUS Solution) during the broadcast of GPS corrections (reference Section 1.2). For this reason all raw data acquired under RTK conditions was assumed to be inaccurate as recorded by the acquisition software once the geodetic network reference space was established. This methodology is a commonly practiced technique and resulted in no loss of final processed data precision. The associated navigational error was consistent, systematic, and recoverable. All survey records require the assumed position error to be compensated for through a global position shift for all points measured. The temporary horizontal (WGS84) and vertical (WGS84) position was shifted from the temporary assumed space measurement to the processed network position computed by TerraSond. The 3-dimensional shift was applied to the terrestrial survey in Trimble Geomatics Office suite. The vertical position for each point in the Bathymetric DEM surface was adjusted in Caris HIPS. The Horizontal shift for each point in the Bathymetric DEM surface was accomplished in Trimble Terramodel. The Acoustic Intensity Mosaic image was shifted using Chesapeake Technologies SonarWiz. Ultimately, precise ephemeris calculated a trivial variation for the H monument from the Ultra-Rapid OPUS solution used to record the data for this project. The value for the data migration was within the allowable error for our measurement systems. For this reason, no migration of the MBES, SSS, or ADCP data was necessary for this project Multibeam Echosounder Processing The MBES calibration (commonly called a Patch Test ) acquired on May 23, 2009 was processed for the identification of temporal latency and MBES orientation errors. This effort was accomplished using the Caris HIPS and SIPS calibration tool and the correction values were entered into vessel configuration file for CARIS Hydrographic Information Processing System (HIPS) version MAY 2010
22 On June 5, 2009, the TerraSond Processing Department in Palmer, AK received the raw MBES data and associated acquisition records for final processing. HIPS version 6.1 was used for all data processing and adjustments necessary to produce final bathymetric products. The Caris HIPS workflow is designed to ensure that all edits and corrections made to the raw data, and all computations performed with the data followed a specific order and were saved separately from the raw data to maintain the integrity of the raw acquisition data. TerraSond uses well defined procedures during HIPS processing; all actions are tracked to ensure that no steps are omitted or performed out of sequence Vessel Editor The first component of the HIPS processing workflow requires establishment of a framework in which recorded navigation, vessel motion, raw (unprocessed) depths and vessel draft are referenced to a common position. The HIPS Vessel Editor is an application used for viewing and editing the position and calibration of sensors installed on the vessel. This information is stored in the HIPS Vessel File (HVF). The HVF is divided into a number of distinct sections, each describing one type of sensor. The sections are time-tagged and multiple entries can be defined for different time periods. The HVF is based on a three-dimensional coordinate system which locates equipment within an X-Y-Z axis using a reference point on the vessel as the point of origin. The reference point for this survey is co-located with the motion sensor which is installed at the vessel s approximate center of gravity; the point at which the least amount of motion is experienced. The position of the multibeam echosounder transducer as well as the static draft (waterline) of the vessel is recorded in the HVF with respect to the reference point. Static draft values were measured on a daily basis for entry in the HVF to track changes in vessel draft caused by loading and fuel consumption. During data acquisition, RTK GPS positioning was referenced from the X-Y-Z coordinate of the GPS antenna phase center to the motion sensor within the vessel coordinate system. All recorded navigation data is referenced to the RP. Therefore, the X-Y-Z coordinates of the GPS antenna phase center need not be entered in the HVF Raw Data Conversion CARIS HIPS was used to create a folder structure organized by the project, vessel, and Julian day to store data. Raw MBES data was converted from its native Hypack format, *.hsx files, into CARIS HIPS using the CARIS conversion wizard module. The wizard was used to create a directory for each line separating the *.hsx files into sub-files which contain individual sensor information. All data entries were referenced using the time associated with the *.hsx file to relate the navigation, azimuth, heave, pitch, roll, and slant range sensor files Navigation Editor Navigation data was reviewed using the CARIS Navigation Editor. The review consists of a visual inspection of plotted fixes noting any navigation gaps in the data. Additionally, vessel speed, distance between navigation fixes and course made good are examined for anomalies. If 2-14 MAY 2010
23 any anomalies are detected, the processor may choose to reject or interpolate the affected areas. The data in this project displayed no anomalies with respect to navigation Attitude Editor Attitude data was reviewed using the HIPS Attitude Editor. The review consists of a visual inspection of the heave, pitch, roll and GPS (ellipsoidal) height which are displayed simultaneously in a graphical representation using a common x-axis scaled by time. The Attitude Editor, like the Navigation Editor, is used to identify anomalies and has the ability to interpolate or reject the affected areas. The data in this project displayed no anomalies with respect to attitude Sound Velocity Editor Each sound velocity profile, or cast, was examined using the HIPS Sound Velocity Editor for potential outliers prior to its application in HIPS. Erroneous sound velocity changes will cause a concave or convex distribution of soundings. This artifact is caused by the sound velocity correction required for the outer beam forming computation. The data in this project displayed no anomalies with respect to sound velocity. The sound speed adjustment in HIPS uses slant range data, applies motion correctors to determine launch angles, and adjusts for range and ray-bending resulting in a sound speedcorrected observed-depths file. It is recommended that sound velocity correction be executed before cleaning the data GPS Tide Computation and Merge Upon review of navigation, attitude, and sound velocity, the vessel positioning was converted from local datum heights to water level and subsequently to the final project datum. In our case, the tide and GPS tide was the variation of the vessel vertical motion from the position of the base station offset. These processes are referred to as the computation of GPS Tide and Merge. The full formula for GPS Tide is shown below. GPS Tide = GPS (ellipsoidal) Height - Datum Height - Heave - Waterline Offset Where: GPS height = RTK ellipsoidal heights referenced to the vessel RP Heave = time-tagged measurements of the vessel s vertical motion recorded by the motion sensor and referenced to the vessel RP Waterline offset = time-tagged waterline levels referenced to the vessel RP and measured daily by the Hydrographer 2-15 MAY 2010
24 Datum Height: The distance from the ellipsoid to project datum (USGS Stream Gage Datum). Once post-processing of the static GPS network was completed (as described in Section 1.1), a trivial value of mm was calculated as the shift from assumed position to the post processed geodetic network height. An additional and cumulative shift of m was applied to bring the surface from WGS84 Ellipsoid to the local river surface datum. Finally, the HIPS Merge process was conducted on the dataset. Merge is the process of calculating final positions and depths for soundings, based on all relevant inputs such as observed depths, navigation information, vessel dynamics such as gyro, heave, pitch and roll, and tide Subset Editor Following final processing and quality assurance of draft and GPS tide applications, several area-based editing processes in CARIS HIPS Subset Editor were performed during the office review of survey soundings. During subset editing (cleaning), the processor was presented with two and three-dimensional views of the soundings and a moveable bounding box to restrict the number of soundings being reviewed. Using the two-dimensional window, soundings were viewed from the south (looking north), from the west (looking east) and in plan view (looking down). These perspectives, as well as controlling the size and position of the bounding box, allowed the operator to compare lines, view features from different angles, measure features, query soundings and change sounding status flags. Soundings were also examined in the three-dimensional window that could be rotated on any plane. Vertical exaggeration was increased as required to amplify trends or features. While HIPS does not allow for the deletion of any sounding, spurious soundings (noise) were flagged as rejected during subset editing. Soundings flagged as rejected are excluded from any final bathymetric product Caris BASE Surfaces The CARIS HIPS Bathymetry Associated with Statistical Error (BASE) Surface is a 3D, georeferenced image of a multi-attributed, digital terrain model. To build a BASE surface, HIPS assigns a set of gridded nodes at user-defined spacing and bounding coordinates. Each grid node is assigned a depth value based on nearby sounding values. All BASE Surfaces use range weighting to determine how a sounding is applied to a node. Range weighting is based on distance; soundings close to a node are given greater weight than soundings further away. Additionally, all BASE surfaces created for this project use a weighting scheme based on a beam s intersection with the river bed; soundings formed by the outer beams are weighted less in the algorithm than more reliable nadir beams. BASE surfaces can be used to identify areas requiring further cleaning as well as comprise the final bathymetric product. Once the sounding dataset was cleaned and all corrections were applied, a 1.0 meter resolution BASE surface was created for use in development of bathymetric products. Points identified to be the shoal point of an object above the ambient river bed interpreted to be rocks or other anomalous features were designated, exported, and appended to the gridded DEM surface in order to minimize the height attenuation of obstructions common to surface generation MAY 2010
25 Processing of Side Scan Sonar All main scheme lines were processed and evaluated for Danger to Navigation and Hazard for Construction obstructions. Select lines were used during mosaic production based upon aesthetic qualities and the needs of interpretation. The software used to process this data was Chesapeake Technologies SonarWiz Map (SonarWiz). SonarWiz.MAP software was used to create a folder structure organized by Julian day to store data. Side scan raw data (.hsx) files were imported into SonarWiz.MAP using the SonarWiz.MAP Import Side Scan Files function, which converted the sonar files into SonarWiz.MAP compatible *.csf format. SonarWiz.MAP does not permit raw data manipulation during processing. All raw data is maintained in the original, unmodified, format to ensure data integrity. TerraSond uses well defined procedures during side scan data processing and all actions are tracked to ensure that no steps are omitted or performed out of sequence. After conversion, vessel navigation data was visually evaluated for inconsistent, erratic, or unrealistic changes in speed, distance, and course made good. The side scan lines were opened in the SonarWiz.MAP Bottom Track Editor where towfish altitude was manually digitized; this is the process of digitizing the floor or removing the water column from the record. The final process applied to the side scan sonar data was the application of XY offsets to represent the tow point with respect to the central reference point (CRP) of the vessel to correctly position the data geographically. The side scan record was carefully examined for significant obstructions and classified as contacts in the slant-range corrected record. Significant contacts included, but were not limited to, contacts with a shadow length indicating a contact height of 1.0 m or greater. Contacts were digitized using the contact tool in SonarWiz.MAP Side Scan Digitizer View. Each contact was automatically assigned a unique identifier based on the date, time, and channel (port or starboard). Once identified, the contact s length and width were measured with the Measure Length and Measure Width tools and the contact shadow length was measured using the Measure Shadow tool. SonarWiz.MAP automatically calculates contact height once the shadow length is measured. SonarWiz.MAP generated an image of each digitized target and included a corresponding text file containing all recorded information specific to the contact and placed the contact in the project folder. Contacts were then exported as targets to an ESRI shape file. This information was then spatially referenced with MBES data for evaluation and reporting. The product of target classification was obstacle detection, identification, and positioning in the form of an Obstruction List. Select lines with the best representation of river bed coverage and meaningful albedo were selected to contribute to the acoustic intensity mosaic image MAY 2010
26 2.3 Hydrographic Products While the HIPS workflow allows for application of vertical changes in order to perform datum transformations and adjustments, the software does not allow for horizontal migration. The horizontal projection of the dataset is UTM, NAD83, Zone 5 and all soundings are vertically referenced to local river height during 11,300 m³/s discharge conditions. All units are expressed in meters. The horizontal shift of the mosaic and the bathymetric MBES surface (DEM) by the processed Geodetic Network space correction factor was the final processing step in the processing flow Bathymetric DEM gridded dataset and imagery The regular gridded Digital Elevation Model surface is a critical product. This surface is the foundation for all charting and positioning, and it is the reference surface for the obstruction list as well as the Side Scan Sonar deliverables. This surface was considered in each interpretation and during the generation of all location positions. The sole origin for this digital DEM is the Multibeam Echosounder point file. The high density data from the MBES is often too large to manage by most software suites. TerraSond reduces the data through the process of surface generation in Caris HIPS software. The number of points in the original post processed and post edited surface that was used to generate the DEM was 32,002,560 points. The number of points in the final DEM product distributed with this report is 695,113 points (produced as a regular grid with 1m resolution). There is a small loss of detail that develops as we reduce the data that makes up the surface of the DEM product. This loss is directly related to the node spacing established in the final surface. The exact location of loss is not known nor controlled. During regular gridding, TerraSond will not have control of the data that is reduced. We will not be able to confirm that the most shoal depth of an obstruction is the exported grid point nor if it is properly represented in the DEM. For this reason all values for shoal height are conservative and were exported as a shoal biased grid. For the reasons stated above, we cannot verify more vertical precision in the DEM obstructions depths finer than sub meter precision. The horizontal precision is accurate to 1.0 m and obstruction identification resolution is 2 m 3. The DEM surface was generated from referencing a maximum footprint size 5x5 grid cells with a minimum of 6 nearest neighbors. The DEM product grid spacing was 1.0 meter distance. This surface was interpolated in order to maintain the high level of detail necessary for obstruction detection and interpretation. TerraSond filled the holidays present in the 1.0 m surface grid with information by applying a Triangular Interpolated Network function contained in the Caris processing software. This process allowed for the generation of a contiguous image MAY 2010
27 This process was particularly vital for the northern portion of the MBES information, however, several trivial holidays were identified in the post processing data after the editing of the data had been accomplished. The geodetics for the output file are UTM zone 5 projected as NAD83 and the units are meters for the horizontal dimension. The vertical dimension (positive axis up) is also in units of meters and is based upon the datum of the Yukon River stage at the start of project (11,300 m³/s discharge). This surface was included in the Fledermaus Digital Product bundle and distributed on both the TerraSond FTP site and included in the DVD data distribution which accompanies this report. Two images with different color scales have been generated from this DEM. Both are the same except for the inclusion of the color purple in the spectrum. All images which do not include the purple in the color scale spectrum are suitable visualization with common 3D glasses for an enhanced visualization and interpretation by the viewer. The files that included purple in the color scale spectrum are intended for finer differentiation of depth and digital distributions, but do not visualize well through 3D glasses MAY 2010
 2-20 MAY")
28 Graphic P - Image of Bathymetric Surface (scaled by depth) 2-20 MAY 2010
29 2.3.2 Acoustic Intensity Mosaic The Acoustic Intensity Mosaic is a compilation of selected Side Scan Sonar lines which best visualize the riverbed spatially and through the albedo spectrum. The lines are assembled as a stack of linear image files processed with Automatic Gain Control algorithm. The compilation was digitally compiled in SonarWiz.MAP and the seams were digitally muted through the coverup software option. There are lineations in the mosaic which can be attributed to the image boundaries and should be recognized as artifacts of the images when viewing this mosaic. Two sources of lineation artifacts are present in the mosaic; image boundaries and nadir stitching. Graphic Q - Acoustic Intensity Mosaic Image 2-21 MAY 2010


30 TerraSond used the products from each geophysical sensor to production interpretations of the physical characteristics of the Yukon River and the Riverbed within the project site. These interpretations enabled TerraSond to make educated recommendations to the YRITWC about the project site when planning for the installation and deployment of the Hydrokinetic Instream Turbine. TerraSond evaluated the geomorphology of the alveus, albedo of the side scan intensities, analyzed the moving bottom information, and referenced the current flow regime when interpreting the geologic substructure needed for the deployment of the 2009 Turbine Anchors. Graphic R - Geologic Interpretation of the Riverbed near the project site Hazard for Construction and Danger to Navigation List TerraSond referenced the side scan sonar imagery of the river bed for obstruction targets. These targets were processed and recorded in Chesapeake SonarWiz Software and displayed in ESRI ArcMap for correlation with other geophysical sensor data. Classification of the targets was beyond the scope of the project. All obstructions are assumed to be naturally occurring and TerraSond recommends avoidance as the coping strategy. The Obstruction Target List is a composite table from multiple surveys and the interpretation of obstructions from those data. The terminology of the obstructions list is not consistent with the terminology found in NOS Hydrographic Surveys Specifications and Deliverables, NOAA, Dept. of Commerce, The criteria were modified by the Project Hydrographer to a more stringent project specific standard. One criterion stated in the NOS Hydrographic Surveys Specifications and Deliverables regarding Danger to Navigation is stated as: Depths from the present survey which are found to be significantly shoaler then the charted depths or features, and are navigationally significant (typically depths of 11 fathoms (fms) (66ft) or less) MAY 2010

31 A typical standard for obstruction interpretation for navigation charting is: 1.0 m proud of the seafloor in depths < 11 fms or 10% of depth in depths >11 fms The standard used for this project only considered the project area from the thalweg south to the cliff shore (left bank). Obstructions were identified in the more northern zone, however, complete coverage was not obtained through the sonar activity and TerraSond could not clear any portion of that northern zone for DtoN and HforC. TerraSond recommends that the entire zone north of the thalweg be treated as uncharted and to contain Dangers to Navigation and Hazards for Construction. Graphic S - Charted vs. Uncharted boundary for Dangers and Hazards The specific criteria used to classify and differentiate between Danger to Navigation and Hazard for Construction obstructions were not easily determined for this project area. Typically, for Alaskan Rivers, the United States Geologic Survey (USGS) has established a well documented yearly average for a river and TerraSond references that information when assessing the probability of a vessel encountering an obstruction under the river surface. That information was not available without a direct tie to the historic USGS activity datum for the project area in Ruby. TerraSond estimated that the water level for the 2009 Survey event was accomplished as a high water event as depicted in Graphic T. The expectation is that the water level will drop significantly at various times during the summer season. TerraSond allowed for a 3 m drop in river stage at the Ruby site to define a low flow water line level. TerraSond estimated an additional maximum keel depth of 4m for river traffic. The distinction depth between a designation of Danger to Navigation is any obstruction within 7 m depth of the project datum MAY 2010
32 Any obstruction below that datum has been classified as a Hazard for Construction and does not necessarily need to be avoided during vessel operations. Graphic T - Average discharge behavior on the Yukon River (Water-Resources Investigations Report ) The criteria used for obstruction classification for this project: Obstructions 1.0 m proud of the seafloor in depths < 7 m are classified as Dangers to Navigation. The obstructions 1.0 m proud of the seafloor in depths > 7 m are classified as Hazards for Construction. The Obstruction List is a combination of targets and contacts identified in data from: Multibeam Echosounder Sonar Survey Side Scan Sonar Survey 2-24 MAY 2010

33 Obstruction List Contact ID SSS Target Discovery Northing m Easting m Latitude Longitude Depth m Hazard Classification Volume m 3 Description HfoC Sidescan N/A Hazard for Construction N/A Obstruction Area, Possible Rocks. HforC Sidescan N/A Hazard for Construction N/A Obstruction Area, Possible Rocks. HforC _0452 Sidescan N/A Hazard for Construction N/A Obstruction Area, Possible Rocks. HforC Sidescan N/A Hazard for Construction N/A Obstruction HforC 05 Not Seen in SSS Multibeam Hazard for Construction Obstruction HforC Both Hazard for Construction Obstruction Area, Possible Rocks. HforC Both Hazard for Construction Obstruction Area, Possible Rocks. DtoN 08 Not Seen in SSS Multibeam Danger to Navigation Obstruction HforC _0452 Both Hazard for Construction Obstruction HforC 10 Not Seen in SSS Multibeam Hazard for Construction Obstruction HforC 11 Not Seen in SSS Multibeam Hazard for Construction Obstruction HforC Both Hazard for Construction Possibly sandbags HforC 13 Not Seen in SSS Multibeam Hazard for Construction Obstruction HforC 14 Not Seen in SSS Multibeam Hazard for Construction Obstruction HforC 15 Not Seen in SSS Multibeam Hazard for Construction Obstruction HforC 16 Not Seen in SSS Multibeam Hazard for Construction Obstruction HforC 17 Not Seen in SSS Multibeam Hazard for Construction Obstruction HforC 18 Not Seen in SSS Multibeam Hazard for Construction Obstruction DtoN Both Danger to Navigation Obstruction Area, Possible Rocks. DtoN 20 Not Seen in SSS Multibeam Danger to Navigation Obstruction Area, Possible Rocks. DtoN Both Danger to Navigation Obstruction Area, Possible Rocks. DtoN 22 Part of large outcrop Both Danger to Navigation Obstruction Area, Possible Rocks. Table Seven List of Obstructions interpreted from the MBES and SSS data sets Graphic U - Obstruction locations over project area Graphic V - Zone of Avoidance due to Danger to Navigation obstructions in the vicinity of the 2008 deployment site 2-25 MAY 2010
34 2.4 Important note TerraSond understands that the information gathered for this project is intended to facilitate the planning of river construction projects and that our data may contribute to safe river operations. This data is not to be used for navigational purposes. This data should not be used to replace any publication distributed by NOAA or the Department of Transportation nor does TerraSond assume any responsibility for safe navigation or safe marine operations. The distributions of any obstruction data recorded during May, 2009 may or may not contain valuable information regarding vessel navigation. For that reason, TerraSond recommends avoiding contact locations where navigation may be at risk, but does not guarantee that additional unobserved or uninterpreted hazards are within the boundaries of this project. TerraSond does not guarantee that interpreted obstructions are persistent or that potential obstructions will be present at a future date. Natural/manmade hazards in this project area are dynamic and are known to be spatially transitory. The use of products provided by TerraSond is only valid for the moment of acquisition and all forecasts, assumptions, or logical conclusions are wholly the responsibility of the user. The use of such products in conjunction with the products of agencies which are responsible for safe navigation (i.e. NOAA, DOT, USACE, USCG, etc.) is highly recommended MAY 2010
35 3.0 HYDROKINETICS Graphic W - ADCP Transect lines for current velocity measurements across the Yukon River TerraSond was tasked with the responsibility of acquiring, processing, and presenting remotely sensed hydrokinetic measurements at the YRITWC Hydrokinetic Power Conversion Project Site at Ruby, AK. The survey area included seven transect sites across the Yukon River. TerraSond selected a primary line (Line D) in the vicinity of the historical 2008 turbine deployment site and planned three additional lines upriver and three lines down river m (150 ft) distance apart. Two types of data were gathered to better describe the hydrokinetic character of the river for the purpose of evaluating Hydrokinetic Power Conversion. The primary line (0 m offset), Line D, was used to measure the discharge. All lines were measured with the intention of evaluating the across profile current velocity and flow regime. Terrestrial survey extension of the primary transect continued up onto the shore in order to enable future modeling of the channel under various water levels. The vessel used for all operations was the Ruby Tribal Council Jon Boat after it was measured as a survey vessel of opportunity. The geophysical instrument deployed during this project included a pole mounted Teledyne RDI 1200kHz Sentinel Workhorse Acoustic Doppler Current Profiler (ADCP). All navigation was distributed as RTK corrected from a Trimble SPS881GPS Receiver and heading was distributed by the Coda Octopus F-185 Inertial Navigation System MAY 2010

36 The mobilization crew consisted of a Geophysicist and a Survey Technician. The vessel mobilization took place on the Yukon River bank. On May 22, 2009, TerraSond acquired QAQC files measuring moving bed and magnetic heading calibrations. The heading required an offset of (between GPS and ADCP orientation) and the moving bed test was positive. Graphic X - Ship track line from the ADCP referencing both the geodetic navigation and the bottom tracking navigation Graphic above demonstrates the moving bottom impact in the thalweg portion of the river during the record of an ADCP transect. Both the south (left) shore and the north (right) shore have slower river current speeds and the riverbed does not demonstrate a rate of change from the geodetic navigation. Only in the thalweg does the data reveal deviation from the geodetic transect. This information was acquired for reference of future modeling efforts and in order to support future sediment transport studies. 3.1 Acquisition and processing of Discharge Measurement TerraSond acquired four transect measurements along the Primary Transect Line (Line D) in compliance with USGS methodology for discharge measurements using ADCP sensors. All measurements were within acceptable tolerance. The software used to acquire and compute the discharge measurement was WinRiver II. The four transects measured by TerraSond to be used for the discharge computation had a standard deviation of 1.94%. The discharge value computed by WinRiver II from those measurements reported a Total Q of 11, m 3 /s. TerraSond referenced published data in order to verify our measurements while in the field MAY 2010
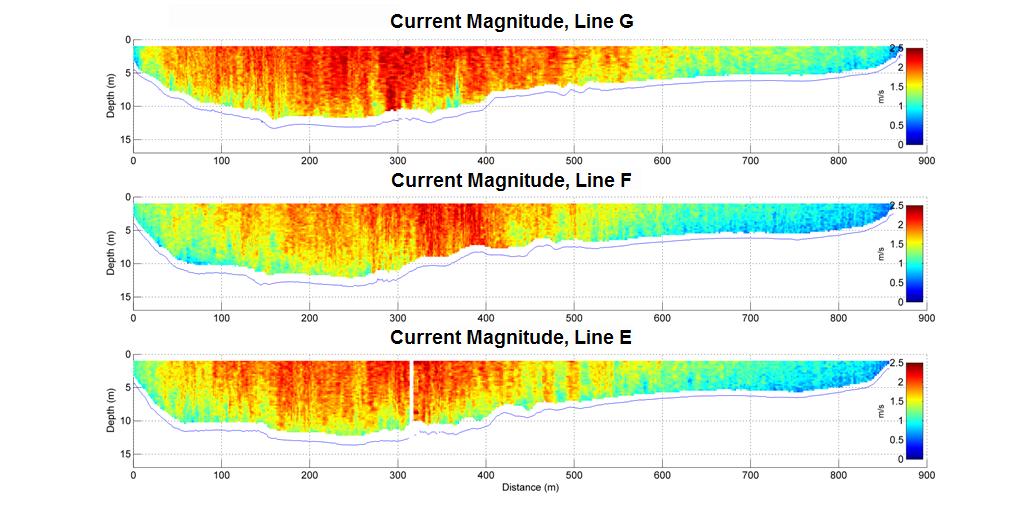
37 Station Number: 0 Station Name: YRITWC Party: DSO, ZM Boat/Motor: Gage Height: m Area Method: Avg. Course Nav. Method: DGPS MagVar Method: Model (0.0 ) Depth Sounder: Not Used Performed Diag. Test: YES Performed Moving Bed Test: NO (recorded in a different file) Performed Compass Test: NO (recorded in a different file) Meas. Location: Ruby, AK Width: m Area: m² G.H.Change: m ADCP Depth: m Shore Ens.:10 Bottom Est: Power (0.1667) Top Est: Power (0.1667) Meas. No: 1 Date: 05/22/2009 Processed by: DSO Mean Velocity: 1.47 m/s Discharge: 11,300 m³/s Index Vel.: 0.00 m/s Rating No.: 1 Project Name: ruby_test_0-0degmagtrian.mmt Software: 2.05 Screening Thresholds: BT 3-Beam Solution: YES Max. Vel.: 2.84 m/s Type/Freq.: Broadband/1200 khz WT 3-Beam Solution: NO Max. Depth: 13.8 m Serial #: Firmware: BT Error Vel.: 0.10 m/s Mean Depth: 9.12 m Bin Size: 25 cm Blank: 50 cm WT Error Vel.: 1.07 m/s* % Meas.: BT Mode: 5 BT Pings: 1 BT Up Vel.: 0.30 m/s* Water Temp.: None WT Mode: 1 WT Pings: 1 WT Up Vel.: 2.57 m/s* ADCP Temp.: 7.4 C WV : 254 Use Weighted Mean Depth: YES 3.2 Acquisition and processing of Current Magnitude Imagery TerraSond acquired a single transect across the river at 7 locations throughout the project site at intervals of m. This data was intended to display the flow distribution and help characterize the flow behavior. The data was processed while in the field and evaluated to target turbine candidate sites (reference section 4.0) MAY 2010

38 The current measurements were acquired while under vessel power and velocity standards maintained vessel at course made good < 50% of the river current velocity. Heading was distributed by the Coda F-185 while the navigation was distributed by Trimble SPS881 corrected by RTK radio signal. Bottom tracking was acquired to help correlate with bathymetry and allow for alternative navigation comparisons. The extent of each transect was limited by the river bank slope. Of particular note, the north (right) bank had a very gentle slope and limited the length of each measurement as we approached the right shore. Each transect measured the current velocity across as much of the alveus as possible and captured the entire thalweg. The processing of the ADCP transect information was initially filtered in WinRiver II software. The current magnitude presentation was later processed with MATLab numerical processing software at the TerraSond Processing Center in Palmer, AK. The products presented in this report have a horizontal three cell moving average applied to the data. Graphic Y - Current Magnitude for Transect G illustrating the current distribution across the alveus This transect is a good representation of the characteristic flow behavior in the Yukon River at Ruby. The thalweg is interpreted to hold a heavy concentration of the river s power and the flow distribution is mostly contiguous and predictable with river bed geomorphology. The peak flow is focused at the range of 300 m from the start of line near the cliff which makes up the left shore MAY 2010
39 4.0 PLANNING INFRASTRUCTURE DEVELOPMENT The primary goal for this project was to help identify candidate sites for the deployment of the YRITWC hydrokinetic turbine. After the acquisition of the geophysical data, but while still in the field, TerraSond presented minimally processed products to YRITWC project manager for resources assessment. The primary consideration was where was the nearest persistent high energy current regime to the junction box. Graphic Z - Processed current magnitude images for the nearest three transects to the Power Junction Box TerraSond interpreted the river to have a significant zone of reduced velocity in the zone nearest to the Junction Box. As the flow of the river approaches the cliff face a zone of resistant flow is encountered in the river which slows the near shore current at the left bank. This zone experiences two conflicting forces, first originates from a small tributary effluent just upriver of the cliff face, and the second is the impact with that constriction point of the cliff structure. The cliff is acts as a significant redirection, and Line B (of the lines measured) is a very good example of current attenuation at the left bank. The river rebounds and quickly and recovers from the left bank retardation of the current force as is presented in the Graphic Z presentation. Graphic AA - Processed current magnitude for Line A as it flows into the project area of interest 4-31 MAY 2010


40 In Graphics Z and AA, the highest energy can be found in the 300 to 400 m range across the river. The YRITWC was not targeting this zone for the placement of the 2009 turbine deployment. This zone was perceived to have significant river use conflicts and the highest energy zone was a possible hazard for the turbine infrastructure. TerraSond was directed to target energy sources of 2.0 m/s or higher which were persistent and near the Junction Box Infrastructure and outside of the primary traffic areas for vessel transit. Although the 2.0 m/s surface current contour was expected to migrate with river stage, TerraSond s interpretation of the river dynamic was that the upriver portion of this compression zone be highly mobile and would be strongly dependent upon river stage. The down river portion of the compression zone would infill with a more predictable consistent contour due to the dispersed flow. TerraSond used the discharge measurements to develop a description of the persistence for the 2.0 m/s contour along Primary ADCP transect line (Line D). This analysis of the persistence of the surface flow was disappointing; there was a significant laterally migration range between the 2.0m/s contour along this line even with consistent discharge. Terrasond selected a target turbine site that was consistently at 2.0 m/s contour. The location for the Turbine Site A was selected to be located at N , W and the riverbed site for the Sandbag Anchor deployment was selected to be located at N , W MAY 2010
41 Graphic BB - Original choice for 2009 Turbine Site A while in the field TerraSond participated in the deployment of the Sandbag Anchor and establishing the Debris Diversion Device on that anchor system. TerraSond provided vessel piloting and navigation services to the YRITWC during these operations. The hydrokinetic turbine was not installed while TerraSond personnel were on site. TerraSond was notified in the July, 2009 that the Turbine Site A location was outside of the radius of the power cable infrastructure available to YRITWC project.terrasond was asked to reevaluate data for an equivalent site more near the Power Junction Box. No equivalent site was identified within the radius constraints of the power cable, however, 2009 Turbine Site B was selected based upon the processed data from the May expedition. The power difference between Site A and Site B was ~ 0.20 m/s velocity reduction (from ~2.1 m/s to ~1.9 m\s).the 2009 Turbine Site B was placed 153 m along ADCP Line C from the start of line. The location was 180m from the Electrical Junction Box (2D distance). Graphic CC - Processed Bathymetry showing locations of infrastructure positions The 2009 Turbine site was selected upon the power potential and the vicinity from the junction box, however, this site also needed to be acceptable for the placement of riverine anchors. The YRITWC requested an analysis of the river that would be adequate for two large concrete anchors. YRITWC provided TerraSond with the length of sub-river tether from the anchor to the turbine barge. TerraSond referenced the HforC and the DtoN list for obstructions in the vicinity of the anchor proposed locations. TerraSond identified that the geologic substrate for both the Left and the right anchor location was solid rock separated by acoustically absorptive 4-33 MAY 2010


42 unconsolidated sediment. A slope analysis was conducted over the proposed anchor sites and both locations demonstrated slope < 5%. Graphic DD - Slope Analysis with Anchor Sites and Zone of Caution Graphic EE - Image from the Fledermaus Presentation for the profile demonstrated in Graphic CC TerraSond computed the positions for each anchor location as would be referenced from a GPS antenna on the bridge of the barge vessel that was intended to deploy the anchors and distributed those positions to the YRITWC along with a series of maps and charts for reference. TerraSond assembled the information from this project into a static model for YRITWC in order to help facilitate project planning and as a communication device for the public. This model is presented as a Digital 3D presentation in Fledermaus and IView4D. This work has also been 4-34 MAY 2010


43 translated into Google Earth Files and is available in that medium for presentation and dissemination. Graphic FF - Drawing of the TerraSond recommendation for positioning of the anchors and turbine Graphic GG - Image from ESRI Presentation for the river including general geomorphology 4-35 MAY 2010
44 This page intentionally left blank MAY 2010
45 5.0 CONCLUSIONS AND RECOMMENDATIONS TerraSond believes that the Yukon River Inter-Tribal Watershed Council (YRITWC) In-river Hydrokinetic Power Conversion Proof-of-Concept Project at Ruby has significant potential to produce seasonal power for the community through contribution to the existing power grid infrastructure. Not only has the development of this project lead the nation s effort to include non-traditional hydrokinetic power conversation into existing power infrastructure, but the YRITWC has exercised significant discipline in accomplishing this installation utilizing only readily accessible equipment available to isolated village populations. This project has mastered many of the challenges associated with deploying the hydrokinetic power conversion technology in remote Alaskan communities. Onsite innovation, overcoming infield problems, and experiencing the tribulations of this project has the YRITWC informed the remaining hydrokinetic community for future projects of this nature. This effort has displayed an opportunity for the vibrant hydrokinetic community of Alaska to observe, appreciate, and avoid future issues when dealing with the natural river systems and remote locations similar to Ruby, AK. The success of this project and dynamic understanding of the resource available for power generation has not yet been fully described nor quantified. Much of the necessary data accomplished during the 2009 data acquisition effort described in this report was accomplished with the effort described in this report in mind. A significant effort remains to be accomplished in the form of products which will describe and quantify the potential for hydrokinetic conversion opportunity at Ruby. The project described within this report accomplished the primary goal; the acquisition, processing and interpretation necessary to best site a surface mounted turbine with connection to the Ruby power infrastructure. During the 2009 effort, TerraSond acquired information that was intended to be used to inform a Kinetic Flow Model of the Yukon River resource. This modeling exercise was intended to be applicable beyond the measurement event of the acquisition survey. The information that can be extracted from existing data for this purpose is: Riverbed Roughage Geomorphology (Bathymetry and DEM) Discrete Current Measurements Riverbank Transect River Gradient All measurements are associated with a specific River Discharge In addition to the discrete current measurements accomplished during the project described in this report, TerraSond is aware of a long term current velocity record of the entire water column at the Turbine site (acquired during much of the 2009 field season). TerraSond recommends continuing this effort through 2010 in order to capture an entire season s energy measurement MAY 2010
46 TerraSond recommends the processing of this a power record for both seasons in order to quantify the velocity information, and ultimately, the natural power potential for the project site. TerraSond believes that the resource potential for the 2009 and 2010 field season could be processed and used to model the Yukon behavior under a diverse range of model conditions. A comparison of the natural resource with the electric power production that is available to the community grid at Ruby has yet to be accomplished. The continuation of the measurement described above would be a component in this comparison This effort would require a simultaneous measurement of the resource in phase (as described in the previous paragraph) with the electric power-received record. TerraSond understands that this goal was attempted during the field season of 2009, however, cable transmission integrity issues developed in this unique high energy environment. TerraSond recommends a cable easement evaluation and planning strategy which will inform the YRITWC about options for submerged power transmission cable routing, protective shielding strategies, and anchoring methodologies. Terrasond believes that his effort will not require additional data acquisition, but will require professional software and personnel with expertise in cable route planning. The YRITWC project considered surface turbine infrastructure, however, a thorough resource assessment may consider the generation of the electric power under variations in the technology and the seasonal scenarios. TerraSond recommends extending the same moored ADCP measurement of the Yukon River resource through a winter season. Information has been acquired, but not evaluated for submerged turbine power production for this project site. Nor does the current YRITWC project include subsurface technology deployment methodologies in its proof-of-concept project. In conjunction with the work mentioned above, TerraSond believes that an evaluation of this site for extended season and winter power conversion could be accomplished through the modeling efforts described above. TerraSond is not recommending this site for winter power production, not enough information exists to support or discourage this concept. TerraSond does believe that a measurement of the river current velocities through a winter season would inform and quantify the power production potential for the site and appropriately complete the evaluation. Alaska academic researchers are currently leading efforts in the Instream Hydrokinetic Industry in pursuit of processing methodologies and quantify turbulent current indicators and variables from ADCP information. TerraSond does believe that the Yukon River at Ruby would provide a unique and non-similar environment (to other turbulence research sites) for the efforts pursued by this Alaska Research Group. If desired, TerraSond would acquire information with the ADCP instrumentation listed above under the direction, standards, and criteria of the turbulence research. This accomplishment would have benefit for the State of Alaska as it would continue and diversify the body of knowledge for turbulent behavior in the power generating river systems of Alaska. This information will be used to increase the meaningfulness of river models projecting the life expectancy and survivability, and ultimately, contribute to the evaluations of overall cost benefit of Hydrokinetic Projects in Alaskan Riverine systems. In conclusion, if each of the recommendations listed above were funded and supported, TerraSond believes that the Yukon River Inter-Tribal Watershed Council In-river Power Conversion Proof-of-Concept Project at Ruby would be able to be evaluated in quantifiable 5-38 MAY 2010
47 terms as a comparison of natural resource per the power generation cost benefit over variations in season length, extreme river conditions, and for turbine technologies. This recommended effort would primarily be a processing and modeling effort with several long term data acquisition programs with minimal infield man power expectations. The foundation for the products has already been accomplished through the 2009 survey, however, additional resource assessment measurements will be required in order to accomplish and deepen the understanding of the resource and identify its relationship with power generation. For long term or permanent and persistent hydrokinetic power conversion site, TerraSond recommends a reconnaissance of the vicinity of Ruby for sites that present with additional natural power, quality substrate for anchoring, and areas that are conducive for bottom lay cables. TerraSond has not accomplished this investigation, however, our supplemental information does indicate that sites with this description may exist in the immediate vicinity of Ruby. The Proof of concept site may not be the most ideal for low infrastructure deployment areas or as a site for peak performance MAY 2010
48 This page intentionally left blank MAY 2010
49 APPENDIX A GEODETIC INFORMATION
50
51 DATASHEETS of 2 5/8/2010 2:56 PM The NGS Data Sheet See file dsdata.txt for more information about the datasheet. DATABASE =,PROGRAM = datasheet, VERSION = National Geodetic Survey, Retrieval Date = MAY 8, 2010 DH9335 *********************************************************************** DH9335 PACS - This is a Primary Airport Control Station. DH9335 DESIGNATION - RBY A DH9335 PID - DH9335 DH9335 STATE/COUNTY- AK/YUKON-KOYUKUK CENSUS DH9335 USGS QUAD - RUBY C-5 DH9335 DH9335 *CURRENT SURVEY CONTROL DH9335 DH9335* NAD 83(1992) (N) (W) ADJUSTED DH9335* NAVD (meters) (feet) GPS OBS DH9335 DH9335 X - -2,483, (meters) COMP DH9335 Y - -1,133, (meters) COMP DH9335 Z - 5,745, (meters) COMP DH9335 LAPLACE CORR (seconds) DEFLEC09 DH9335 ELLIP HEIGHT (meters) (05/04/06) ADJUSTED DH9335 GEOID HEIGHT (meters) GEOID09 DH9335 HORZ ORDER - B DH9335 ELLP ORDER - THIRD CLASS I DH9335 DH9335.This mark is at Ruby Airport (RBY) DH9335 DH9335.The horizontal coordinates were established by GPS observations DH9335.and adjusted by the R + M CONSULTANTS INCORPORATED in May DH9335 DH9335.The orthometric height was determined by GPS observations and a DH9335.high-resolution geoid model. DH9335 DH9335.GPS derived orthometric heights for airport stations designated as DH9335.PACS or SACS are published to 2 decimal places. This maintains DH9335.centimeter relative accuracy between the PACS and SACS. It does DH9335.not indicate centimeter accuracy relative to other marks which are DH9335.part of the NAVD 88 network. DH9335 DH9335.The X, Y, and Z were computed from the position and the ellipsoidal ht. DH9335 DH9335.The Laplace correction was computed from DEFLEC09 derived deflections. DH9335 DH9335.The ellipsoidal height was determined by GPS observations DH9335.and is referenced to NAD 83. DH9335 DH9335.The geoid height was determined by GEOID09. DH9335 DH9335; North East Units Scale Factor Converg. DH9335;SPC AK 5-1,196, , MT DH9335;UTM 05-7,180, , MT DH9335 DH9335! - Elev Factor x Scale Factor = Combined Factor DH9335!SPC AK x = DH9335!UTM x = DH9335 DH
52 DATASHEETS of 2 5/8/2010 2:56 PM DH9335 PID Reference Object Distance Geod. Az DH9335 dddmmss.s DH9335 DH9337 RBY C METERS DH DH9335 DH9335 SUPERSEDED SURVEY CONTROL DH9335 DH9335.No superseded survey control is available for this station. DH9335 DH9335_U.S. NATIONAL GRID SPATIAL ADDRESS: 5WLM (NAD 83) DH9335_MARKER: DD = SURVEY DISK DH9335_SETTING: 17 = SET INTO TOP OF METAL PIPE DRIVEN INTO GROUND DH9335_STAMPING: RBY A-2005 DH9335_MARK LOGO: NGS DH9335_PROJECTION: RECESSED 6 CENTIMETERS DH9335_MAGNETIC: B = BAR MAGNET IMBEDDED IN MONUMENT DH9335_STABILITY: C = MAY HOLD, BUT OF TYPE COMMONLY SUBJECT TO DH9335+STABILITY: SURFACE MOTION DH9335_SATELLITE: THE SITE LOCATION WAS REPORTED AS SUITABLE FOR DH9335+SATELLITE: SATELLITE OBSERVATIONS - March 12, 2005 DH9335_ROD/PIPE-DEPTH: 0.8 meters DH9335 DH9335 HISTORY - Date Condition Report By DH9335 HISTORY MONUMENTED R+MCON DH9335 DH9335 STATION DESCRIPTION DH9335 DH9335'DESCRIBED BY R + M CONSULTANTS INCORPORATED 2005 (DCH) DH9335'THE STATION IS LOCATED ALONG THE NORTH SIDE OF THE RUNWAY AT THE RUBY DH9335'AIRPORT IN RUBY, ALASKA. OWNERSHIP -- STATE OF ALASKA, C/O BILL DH9335'O'HALLORAN AIRPORT MANAGER, 2301 PEGER ROAD, FAIRBANKS AK 99709, DH9335'PHONE NUMBER , FAX NUMBER THE AIRPORT IS DH9335'UNRESTRICTED. THE VILLAGE HAS TRANSPORTATION AND LODGING LOCALLY. DH9335' DH9335'TO REACH THE STATION FROM THE MERRELINE A. KANGAS ELEMENTARY AND DH9335'SECONDARY SCHOOL IN RUBY, ALASKA, FOLLOW THE AIRPORT ROAD SOUTHERLY DH9335'FOR 0.6 MILES TO THE EDGE OF THE AIRPORT APRON, PROCEED SOUTHWESTERLY DH9335'ALONG THE TAXIWAY TO THE RUNWAY, AND FOLLOW A DIRT ROAD THAT DH9335'PARALLELS THE RUNWAY ON THE NORTH SIDE, WESTERLY FOR 0.05 MILES TO THE DH9335'STATION WHICH LAY APPOXIMATELY 200' NORTH OF THE NORTH EDGE OF THE DH9335'RUNWAY. DH9335' DH9335'THE STATION IS A NONSTANDARD NGS M (0.271 FT) DIAMETER BY DH9335'M (3.0 FT) LONG STAINLESS STEEL PIPE FLARED AT THE BASE. THE STATION DH9335'IS LOCATED 39.2 M (128.5 FT) 206 DEGREES MAGNETIC AZIMUTH FROM A WIND DH9335'SOCK, 63.1 M (207.0 FT) 166 DEGREES MAGNETIC AZIMUTH FROM THE AWAS DH9335'STRUCTURE, AND 45.4 M (149.0 FT) 271 DEGREES MAGNETIC AZIMUTH FROM DH9335'THE SECOND RUNWAY LIGHT SOUTHWEST OF THE TAXIWAY ON THE NORTH SIDE OF DH9335'THE RUNWAY. THIS STATION IS DESIGNATED AS THE PRIMARY AIRPORT CONTROL DH9335'STATION. *** retrieval complete. Elapsed Time = 00:00:01
53 APPENDIX B CURRENT MAGNITUDE IMAGES
54
55
56
57
58

59
GEOACOUSTICS GEOSWATH PLUS DATA PROCESSING WITH CARIS HIPS 8.1
 GEOACOUSTICS GEOSWATH PLUS DATA PROCESSING WITH CARIS HIPS 8.1 IN SUPPORT OF SANDY SUPPLEMENTAL RESEARCH Val Schmidt and Kevin Jerram University of New Hampshire Center for Coastal and Ocean Mapping Sunken
Software for Hydrographic Data Processing
 Software for Hydrographic Data Processing Data courtesy of Dr. T. Komatsu, Tokyo University Ocean Research Institute CleanSweep provides a fast, user friendly environment for processing hydrographic survey
Prepared for: CALIFORNIA COAST COMMISSION c/o Dr. Stephen Schroeter 45 Fremont Street, Suite 2000 San Francisco, CA
 REVIEW OF MULTIBEAM SONAR SURVEYS WHEELER REEF NORTH, SAN CLEMENTE, CALIFORNIA TO EVALUATE ACCURACY AND PRECISION OF REEF FOOTPRINT DETERMINATIONS AND CHANGES BETWEEN 2008 AND 2009 SURVEYS Prepared for:
Geometric Rectification of Remote Sensing Images
 Geometric Rectification of Remote Sensing Images Airborne TerrestriaL Applications Sensor (ATLAS) Nine flight paths were recorded over the city of Providence. 1 True color ATLAS image (bands 4, 2, 1 in
CARIS HIPS & SIPS 8.0 Manual
 MGEO 2014 CARIS HIPS & SIPS 8.0 Manual For Hydrography & Survey Use. 0 Tiffany Schnare www.geo-tiff.com MGEO 2014 Brian Pyke May 30, 2013 Foreward The following document was produced with the Marine Geomatics
SHALLOW SOUNDING BATHYMETRIC USING MULTIBEAM ECHOSOUNDER AND TOPOGRAPHIC LASER SCANNER
 SHALLOW SOUNDING BATHYMETRIC USING MULTIBEAM ECHOSOUNDER AND TOPOGRAPHIC LASER SCANNER BY : NURSUGI, TRI PATMASARI & KHAFID GEOSPASIAL INFORMATION AGENCY AMSTERDAM, 11-14 NOVEMBER 2014 Indonesia coastline
LiDAR & Orthophoto Data Report
 LiDAR & Orthophoto Data Report Tofino Flood Plain Mapping Data collected and prepared for: District of Tofino, BC 121 3 rd Street Tofino, BC V0R 2Z0 Eagle Mapping Ltd. #201 2071 Kingsway Ave Port Coquitlam,
Checking the values using backscatter data
 A Technique for using Backscatter Imagery to Calibrate your Multibeam sonar Harold Orlinsky Harold@Hypack.com Checking the values using backscatter data The collection of Backscatter is co located with
Central Coast LIDAR Project, 2011 Delivery 1 QC Analysis LIDAR QC Report February 17 th, 2012
 O R E G O N D E P A R T M E N T O F G E O L O G Y A N D M I N E R A L I N D U S T R I E S OLC Central Coast Delivery 1 Acceptance Report. Department of Geology & Mineral Industries 800 NE Oregon St, Suite
W D-0049/004 EN
 September 21, 2011 Contact Ground Survey Report, Lidar Accuracy Report, & Project Report New Madrid Seismic Zone Northeast of Memphis, Tennessee Contract Number: W91278-09D-0049/004 EN Project: C-10-026
Patch Test & Stability Check Report
 Patch Test & Stability Check Report Storebælt, 2009 SB Cable Project CT Offshore Final Report November, 2009 SB Cable Project November 2009 8-10 Teglbaekvej DK-8361 Hasselager Aarhus, Denmark Tel: +45
2. POINT CLOUD DATA PROCESSING
 Point Cloud Generation from suas-mounted iphone Imagery: Performance Analysis A. D. Ladai, J. Miller Towill, Inc., 2300 Clayton Road, Suite 1200, Concord, CA 94520-2176, USA - (andras.ladai, jeffrey.miller)@towill.com
Evaluating the Performance of a Vehicle Pose Measurement System
 Evaluating the Performance of a Vehicle Pose Measurement System Harry Scott Sandor Szabo National Institute of Standards and Technology Abstract A method is presented for evaluating the performance of
Delph. Seabed Mapping Software Suite FEATURES ABOUT DELPH SOFTWARE SUITE BENEFITS APPLICATIONS
 Delph Seabed Mapping Software Suite Delph Seismic, Delph Sonar and Delph Mag are complete software packages with dedicated acquisition, processing and interpretation components. They operate with any sidescan
Sandy River, OR Bathymetric Lidar Project, 2012 Delivery QC Analysis Lidar QC Report March 26 th, 2013
 O R E G O N D E P A R T M E N T O F G E O L O G Y A N D M I N E R A L I N D U S T R I E S OLC Sandy River, OR Bathymetric Lidar Project Delivery Acceptance Report. Department of Geology & Mineral Industries
Latest Developments in Bathymetric Data Processing and its Application to Sandwave Detection
 Latest Developments in Bathymetric Data Processing and its Application to Sandwave Detection Ottokarl Büchsenschütz-Nothdurft (1), Mark J. Pronk (1), and L. Hans van Opstal (1) (1) CARIS Geographic Information
1. LiDAR System Description and Specifications
 High Point Density LiDAR Survey of Mayapan, MX PI: Timothy S. Hare, Ph.D. Timothy S. Hare, Ph.D. Associate Professor of Anthropology Institute for Regional Analysis and Public Policy Morehead State University
LiDAR Remote Sensing Data Collection: Yaquina and Elk Creek Watershed, Leaf-On Acquisition
 LiDAR Remote Sensing Data Collection: Yaquina and Elk Creek Watershed, Leaf-On Acquisition Submitted by: 4605 NE Fremont, Suite 211 Portland, Oregon 97213 April, 2006 Table of Contents LIGHT DETECTION
Project Report Nooksack South Fork Lummi Indian Nation. Report Presented to:
 June 5, 2005 Project Report Nooksack South Fork Lummi Indian Nation Contract #2291-H Report Presented to: Lummi Indian Nation Natural Resources Department 2616 Kwina Road Bellingham, WA 98226 Point of
William E. Dietrich Professor 313 McCone Phone Fax (fax)
") February 13, 2007. Contact information William E. Dietrich Professor 313 McCone Phone 510-642-2633 Fax 510-643-9980 (fax) bill@eps.berkeley.edu Project location: Northwest of the Golden Gate Bridge, San
February 13, 2007. Contact information William E. Dietrich Professor 313 McCone Phone 510-642-2633 Fax 510-643-9980 (fax) bill@eps.berkeley.edu Project location: Northwest of the Golden Gate Bridge, San
High-Precision Positioning Unit 2.2 Student Exercise: Calculating Topographic Change
 High-Precision Positioning Unit 2.2 Student Exercise: Calculating Topographic Change Ian Lauer and Ben Crosby (Idaho State University) Change is an inevitable part of our natural world and varies as a
Real time 3D display of hydrographic data for QA and QC.
 Real time 3D display of hydrographic data for QA and QC. Roland Arsenault Center for Coastal and Ocean Mapping & Joint Hydrographic Center University of New Hampshire roland@ccom.unh.edu Figure 1 Data
Rogue River LIDAR Project, 2012 Delivery 1 QC Analysis LIDAR QC Report September 6 th, 2012
 O R E G O N D E P A R T M E N T O F G E O L O G Y A N D M I N E R A L I N D U S T R I E S OLC Rogue River Delivery 1 Acceptance Report. Department of Geology & Mineral Industries 800 NE Oregon St, Suite
CODEVINTEC. Caris Hydrographic Survey. CARIS HIPS and SIPS CARIS Onboard. Bathy DataBASE 4.4. Bathy DataBASE Server 4.3. BASE Editor 4.
 45 27 39.384 N 9 07 30.145 E Caris Hydrographic Survey Photo: João Ventura da Cruz CARIS HIPS and SIPS 10.4 page 2 CARIS Onboard page 4 Bathy DataBASE 4.4 page 6 Bathy DataBASE Server 4.3 page 7 BASE Editor
HYPACK HYPACK SURVEY DESIGN: HYPACK SURVEY: HYPACK EDITING: FINAL PRODUCTS: HYPACK HYPACK
 HYPACK HYPACK is one of the most widely used hydrographic surveying packages in the world, with over 3,000 users. It provides the surveyor with all of the tools needed to design their survey, collect data,
Teledyne PDS. Cutter Dredge. Version March Teledyne RESON B.V. Stuttgartstraat AS Rotterdam The Netherlands
 Cutter Dredge Teledyne PDS Version 2.1.1 March 2017 Teledyne RESON B.V. Stuttgartstraat 42-44 3047 AS Rotterdam The Netherlands Tel.: +31 (0)10 245 15 00 www.teledyne-reson.com Teledyne RESON has made
Teledyne PDS. Trailing Suction Hopper. Version April Teledyne RESON B.V. Stuttgartstraat AS Rotterdam The Netherlands
 Trailing Suction Hopper Teledyne PDS Version 1.1.0 April 2017 Teledyne RESON B.V. Stuttgartstraat 42-44 3047 AS Rotterdam The Netherlands Tel.: +31 (0)10 245 15 00 www.teledyne-reson.com Teledyne RESON
OLC Wasco County: Delivery One.
 OLC Wasco County: Delivery One www.quantumspatial.com January 2, 2014 Trimble R7 Receiver set up over GPS monument WASCO_02. Data collected for: Oregon Department of Geology and Mineral Industries 800
8. Dredgepack. I. Overview. II. Running DREDGEPACK
 8. Dredgepack I. Overview DREDGEPACK enables you to monitor and track digging operations for hopper, cutter, and other dredge types. DREDGEPACK monitors the position and depth of the cutting tool on the
Mapping Project Report Table of Contents
 LiDAR Estimation of Forest Leaf Structure, Terrain, and Hydrophysiology Airborne Mapping Project Report Principal Investigator: Katherine Windfeldt University of Minnesota-Twin cities 115 Green Hall 1530
An Introduction to Lidar & Forestry May 2013
 An Introduction to Lidar & Forestry May 2013 Introduction to Lidar & Forestry Lidar technology Derivatives from point clouds Applied to forestry Publish & Share Futures Lidar Light Detection And Ranging
Lewis County Public Works Department (County) GIS Mapping Division 350 N. Market Blvd. Chehalis, WA Phone: Fax:
 GIS Mapping Division 350 N. Market Blvd. Chehalis, WA Phone: Fax:") March 31, 2005 Project Report Lewis County, WA Contract #2262-H Report Presented to: Lewis County Public Works Department (County) GIS Mapping Division 350 N. Market Blvd. Chehalis, WA 98532-2626 Phone:
March 31, 2005 Project Report Lewis County, WA Contract #2262-H Report Presented to: Lewis County Public Works Department (County) GIS Mapping Division 350 N. Market Blvd. Chehalis, WA 98532-2626 Phone:
Third Rock from the Sun
 Geodesy 101 AHD LiDAR Best Practice The Mystery of LiDAR Best Practice Glenn Jones SSSi GIS in the Coastal Environment Batemans Bay November 9, 2010 Light Detection and Ranging (LiDAR) Basic principles
LiDAR REMOTE SENSING DATA COLLECTION BISCUIT FIRE STUDY AREA, OREGON
 LiDAR REMOTE SENSING DATA COLLECTION BISCUIT FIRE STUDY AREA, OREGON Oblique view in the Biscuit Fire Study Area: Above Ground ESRI Grid (1-meter resolution) derived from all LiDAR points Submitted to:
5. Side Scan. I. Side Scan Hardware. A. Specifying Devices in Side Scan Hardware
 5. Side Scan I. Side Scan Hardware The SIDE SCAN HARDWARE program is used to install those devices that are specific to side scan surveys. HYPACK MAX collects analog and digital side scan data through
Phone: Fax: Table of Contents
 Geomorphic Characterization of Precarious Rock Zones LIDAR Mapping Project Report Principal Investigator: David E. Haddad Arizona State University ASU School of Earth and Space
EM 120 Multibeam Echosounder
 EM 120 Multibeam Echosounder The EM 120 multibeam echosounder from Kongsberg was used for bathymetric surveying. The system has an operating frequency of 12 khz, suitable for deep ocean waters, and 191
Navigational Aids 1 st Semester/2007/TF 7:30 PM -9:00 PM
 Glossary of Navigation Terms accelerometer. A device that senses inertial reaction to measure linear or angular acceleration. In its simplest form, it consists of a case-mounted spring and mass arrangement
LIDAR MAPPING FACT SHEET
 1. LIDAR THEORY What is lidar? Lidar is an acronym for light detection and ranging. In the mapping industry, this term is used to describe an airborne laser profiling system that produces location and
Alaska Department of Transportation Roads to Resources Project LiDAR & Imagery Quality Assurance Report Juneau Access South Corridor
 Alaska Department of Transportation Roads to Resources Project LiDAR & Imagery Quality Assurance Report Juneau Access South Corridor Written by Rick Guritz Alaska Satellite Facility Nov. 24, 2015 Contents
Quick Start: GeoDAS-LT with Single Beam Echo Sounder
 Quick Start: GeoDAS-LT with Single Beam Echo Sounder I. Setting up GeoDAS-LT for Single Beam Echo Sounder Survey 1. Connect your single beam echo sounder, GPS receiver and other sensors (e.g. gyro and
INS aided subsurface positioning for ROV surveys
 INS aided subsurface positioning for ROV surveys M. van de Munt, Allseas Engineering B.V., The Netherlands R van der Velden, Allseas Engineering B.V., The Netherlands K. Epke, Allseas Engineering B.V.,
Stitching Fine Resolution DEMs
 18 th World IMACS / MODSIM Congress, Cairns, Australia 13-17 July 2009 http://mssanz.org.au/modsim09 Stitching Fine Resolution DEMs Gallant, J.C. 1 and J.M. Austin 1 1 CSIRO Land and Water, Black Mountain
LiDAR Remote Sensing Data Collection: Salmon River Study Area, Oregon
 LiDAR Remote Sensing Data Collection: Salmon River Study Area, Oregon Submitted to: Barbara Ellis-Sugai USDA Forest Service Siuslaw National Forest 4077 SW Research Way Corvallis, Oregon 541.750.7056 Submitted
LIDAR REMOTE SENSING DATA COLLECTION: DOGAMI, CAMP CREEK PROJECT AREA
 LIDAR REMOTE SENSING DATA COLLECTION DEPARTMENT OF GEOLOGY AND MINERAL INDUSTRIES CAMP CREEK, OREGON NOVEMBER 26, 2008 Submitted to: Department of Geology and Mineral Industries 800 NE Oregon Street, Suite
Teledyne PDS. Multibeam Calibration. Version January Teledyne RESON B.V. Stuttgartstraat AS Rotterdam The Netherlands
 Multibeam Calibration Teledyne PDS Version 2.0.4 January 2017 Teledyne RESON B.V. Stuttgartstraat 42-44 3047 AS Rotterdam The Netherlands Tel.: +31 (0)10 245 15 00 www.teledyne-reson.com Teledyne RESON
Project Report Lower Columbia River. Report Presented to:
 December 29, 2005 Project Report Lower Columbia River Contract #2265-H Report Presented to: Puget Sound Lidar Consortium 1011 Western Avenue, Suite 500 Seattle, WA 98104 Phone: (206) 464-7090 Fax: (206)
Perspective-MB. -- Bathymetry Processing Guide. Kongsberg.ALL Addendum
 Perspective-MB -- Bathymetry Processing Guide Kongsberg.ALL Addendum By: Tony M. Ramirez November, 2013 Triton Imaging Inc. Engineering Office 2121 41 st Avenue, Suite 211 Capitola, CA 95010 USA +1-831-722-7373
Chapters 1 9: Overview
 Chapters 1 9: Overview Chapter 1: Introduction Chapters 2 4: Data acquisition Chapters 5 9: Data manipulation Chapter 5: Vertical imagery Chapter 6: Image coordinate measurements and refinements Chapters
Airborne Laser Scanning: Remote Sensing with LiDAR
 Airborne Laser Scanning: Remote Sensing with LiDAR ALS / LIDAR OUTLINE Laser remote sensing background Basic components of an ALS/LIDAR system Two distinct families of ALS systems Waveform Discrete Return
Three-Dimensional Laser Scanner. Field Evaluation Specifications
 Stanford University June 27, 2004 Stanford Linear Accelerator Center P.O. Box 20450 Stanford, California 94309, USA Three-Dimensional Laser Scanner Field Evaluation Specifications Metrology Department
Aerial and Mobile LiDAR Data Fusion
 Creating Value Delivering Solutions Aerial and Mobile LiDAR Data Fusion Dr. Srini Dharmapuri, CP, PMP What You Will Learn About LiDAR Fusion Mobile and Aerial LiDAR Technology Components & Parameters Project
WMS 9.0 Tutorial Hydraulics and Floodplain Modeling HEC-RAS Analysis Learn how to setup a basic HEC-RAS analysis using WMS
 v. 9.0 WMS 9.0 Tutorial Hydraulics and Floodplain Modeling HEC-RAS Analysis Learn how to setup a basic HEC-RAS analysis using WMS Objectives Learn how to build cross sections, stream centerlines, and bank
TLS Parameters, Workflows and Field Methods
 TLS Parameters, Workflows and Field Methods Marianne Okal, UNAVCO June 20 th, 2014 How a Lidar instrument works (Recap) Transmits laser signals and measures the reflected light to create 3D point clouds.
Advancements in Area-Based Imagery Processing
 Advancements in Area-Based Imagery Processing An integrated Geocoder delivers a streamlined workflow and new capabilities Alexander MacDonald, CARIS, Canada Corey Collins, CARIS, Canada For many years
NOAA Integrated Ocean and Coastal Mapping Using Hurricane Sandy Response Data to Help Build a Bridge Between Lidar Bathymetry and The Chart
 NOAA Integrated Ocean and Coastal Mapping Using Hurricane Sandy Response Data to Help Build a Bridge Between Lidar Bathymetry and The Chart JALBTCX Airborne Coastal Mapping and Charting Workshop July 19-21
WMS 10.1 Tutorial Hydraulics and Floodplain Modeling HEC-RAS Analysis Learn how to setup a basic HEC-RAS analysis using WMS
 v. 10.1 WMS 10.1 Tutorial Hydraulics and Floodplain Modeling HEC-RAS Analysis Learn how to setup a basic HEC-RAS analysis using WMS Objectives Learn how to build cross sections, stream centerlines, and
Project Report Sauk-Suiattle Indian Tribe. Report Presented to:
 July 28, 2005 Project Report Sauk-Suiattle Indian Tribe Contract #2294-H Report Presented to: Sauk-Suiattle Indian Tribe 5318 Chief Brown Lane Darrington, WA 98241 Phone: (360) 436-0738 Fax: (360) 436-1092
Burns, OR LIDAR Project, 2011 Delivery QC Analysis LIDAR QC Report February 13th, 2012
 O R E G O N D E P A R T M E N T O F G E O L O G Y A N D M I N E R A L I N D U S T R I E S OLC Burns, OR Delivery Acceptance Report. Department of Geology & Mineral Industries 800 NE Oregon St, Suite 965
Feature Detection Performance of a Bathymetric Lidar in Saipan
 Feature Detection Performance of a Bathymetric Lidar in Saipan LTJG Russell Quintero NOAA National Geodetic Survey - JALBTCX, Kiln, MS russell.quintero@noaa.gov Jerry Mills NOAA Office of Coast Survey
Appendix E. HEC-RAS and HEC-Ecosystem Functions Models
 Appendix E HEC-RAS and HEC-Ecosystem Functions Models 1 Appendix E: Modeled Reaches for the Connecticut River Watershed application of HEC-RAS Separate from the report for the Decision Support System of
Contents of Lecture. Surface (Terrain) Data Models. Terrain Surface Representation. Sampling in Surface Model DEM
 Data Models. Terrain Surface Representation. Sampling in Surface Model DEM") Lecture 13: Advanced Data Models: Terrain mapping and Analysis Contents of Lecture Surface Data Models DEM GRID Model TIN Model Visibility Analysis Geography 373 Spring, 2006 Changjoo Kim 11/29/2006 1
Lecture 13: Advanced Data Models: Terrain mapping and Analysis Contents of Lecture Surface Data Models DEM GRID Model TIN Model Visibility Analysis Geography 373 Spring, 2006 Changjoo Kim 11/29/2006 1
A SENSOR FUSION APPROACH TO COASTAL MAPPING
 A SENSOR FUSION APPROACH TO COASTAL MAPPING Maryellen Sault, NOAA, National Ocean Service, National Geodetic Survey Christopher Parrish, NOAA, National Ocean Service, National Geodetic Survey Stephen White,
Lidar Technical Report
 Lidar Technical Report Oregon Department of Forestry Sites Presented to: Oregon Department of Forestry 2600 State Street, Building E Salem, OR 97310 Submitted by: 3410 West 11st Ave. Eugene, OR 97402 April
Phone: (603) Fax: (603) Table of Contents
 Fax: (603) Table of Contents") Hydrologic and topographic controls on the distribution of organic carbon in forest Soils LIDAR Mapping Project Report Principal Investigator: Adam Finkelman Plumouth State University Plymouth State University,
Hydrologic and topographic controls on the distribution of organic carbon in forest Soils LIDAR Mapping Project Report Principal Investigator: Adam Finkelman Plumouth State University Plymouth State University,
Ocean High Technology Institute, Inc. Tadahiko Katsura Japan Hydrographic Association
 Technical Aspects of Marine Scientific Research for Continental Shelf Outer Limits: Advanced Method of Multi-beam Data Processing to Obtain Detailed and Precise Bathymetry Yasutaka Yokoi Ocean High Technology
Airborne LiDAR Data Acquisition for Forestry Applications. Mischa Hey WSI (Corvallis, OR)
") Airborne LiDAR Data Acquisition for Forestry Applications Mischa Hey WSI (Corvallis, OR) WSI Services Corvallis, OR Airborne Mapping: Light Detection and Ranging (LiDAR) Thermal Infrared Imagery 4-Band
Airborne LiDAR Data Acquisition for Forestry Applications Mischa Hey WSI (Corvallis, OR) WSI Services Corvallis, OR Airborne Mapping: Light Detection and Ranging (LiDAR) Thermal Infrared Imagery 4-Band
ifp Universität Stuttgart Performance of IGI AEROcontrol-IId GPS/Inertial System Final Report
 Universität Stuttgart Performance of IGI AEROcontrol-IId GPS/Inertial System Final Report Institute for Photogrammetry (ifp) University of Stuttgart ifp Geschwister-Scholl-Str. 24 D M. Cramer: Final report
The Results of Limiting MRU Updates In Multibeam Data by Pat Sanders, HYPACK, Inc.
 The Results of Limiting MRU Updates In Multibeam Data by Pat Sanders, HYPACK, Inc. Abstract: Some Motion Reference Units (MRUs) can deliver heave- pitch- roll data at rates up to 100Hz. This paper investigates
NAVIPAC/NAVISCAN WITH EDGETECH 6205
 NAVIPAC/NAVISCAN WITH EDGETECH 6205 Last update: 19/11/2015 Version: 1.0 Contents 1 Scope of the document... 3 2 NaviScan Configuration... 3 2.1 Configuring the instruments from EdgeTech... 3 2.1.1 Configuring
Gemini Profiler with Survey Software
 0695-SOM-00008, Issue: 02 1 Tritech International Ltd. QPS QINSy 0695-SOM-00008, Issue: 02 Tritech International Ltd The copyright in this document is the property of Tritech International Ltd. The document
BLM Fire Project, 2013 QC Analysis Lidar and Orthophoto QC Report November 25th, 2013
 O R E G O N D E P A R T M E N T O F G E O L O G Y 1937 A N D M I N E R A L I N D U S T R I E S Department of Geology & Mineral Industries 800 NE Oregon St, Suite 965 Portland, OR 97232 BLM Fire Project,
Data Integration in Building Virtual Models
 Data Integration in Building Virtual Models Erik Singels, Geospatial Information Sciences Program Brent Vollmar, Department of Geosciences Adewale Okunoren, Department of Geosciences Carlos L. V. Aiken,
Whittier, Alaska LiDAR
 January 17, 2013 Whittier, Alaska LiDAR Technical Data Report Revision 3 Rod Combellick Alaska DNR Division of Geological & Geophysical Surveys 3354 College Road Fairbanks, Alaska 99709 Phone 907-451-5007
v Prerequisite Tutorials GSSHA Modeling Basics Stream Flow GSSHA WMS Basics Creating Feature Objects and Mapping their Attributes to the 2D Grid
 v. 10.1 WMS 10.1 Tutorial GSSHA Modeling Basics Developing a GSSHA Model Using the Hydrologic Modeling Wizard in WMS Learn how to setup a basic GSSHA model using the hydrologic modeling wizard Objectives
The Applanix Approach to GPS/INS Integration
 Lithopoulos 53 The Applanix Approach to GPS/INS Integration ERIK LITHOPOULOS, Markham ABSTRACT The Position and Orientation System for Direct Georeferencing (POS/DG) is an off-the-shelf integrated GPS/inertial
2017 OLC Silver Creek
 2017 OLC Silver Creek December 15, 2017 www.quantumspatial.com Data collected for: Oregon Department of Geology and Mineral Industries 800 NE Oregon Street Suite 965 Portland, OR 97232 Prepared by: Quantum
NAVIPAC 4 INTRODUCTION AND WORKFLOW
 NAVIPAC 4 INTRODUCTION AND WORKFLOW Contents 1 Introduction to NaviPac... 3 2 Program Environment... 4 3 Hardware environment... 7 4 Workflow example... 8 4.1 Workflow: Creating a configuration... 9 4.1.1
BATHYELLI Project. Set-up of CD using spatial altimetry and GPS. kinematic GPS
 BATHYELLI Project Set-up of CD using spatial altimetry and kinematic GPS Lucia Pineau-Guillou, SHOM Lucia Pineau-Guillou 30/03/09 Aims of BATHYELLI project Why computing CD in ITRS? Methodology Spatial
Geocoder: An Efficient Backscatter Map Constructor
 Geocoder: An Efficient Backscatter Map Constructor Luciano Fonseca, Brian Calder Center for Coastal and Ocean Mapping, University of New Hampshire Durham, NH 03824 ABSTRACT: The acoustic backscatter acquired
LiDAR Technical Report NE Washington LiDAR Production 2017
 LiDAR Technical Report NE Washington LiDAR Production 2017 Presented to: Washington DNR 1111 Washington Street SE Olympia, Washington 98504 Submitted by: 860 McKinley St Eugene, OR 97402 July 26, 2017
Terrain Analysis. Using QGIS and SAGA
 Terrain Analysis Using QGIS and SAGA Tutorial ID: IGET_RS_010 This tutorial has been developed by BVIEER as part of the IGET web portal intended to provide easy access to geospatial education. This tutorial
GEOMETRIC AND RADIOMETRIC CORRECTION OF MULTIBEAM BACKSCATTER DERIVED FROM RESON 8101 SYSTEMS
 GEOMETRIC AND RADIOMETRIC CORRECTION OF MULTIBEAM BACKSCATTER DERIVED FROM RESON 8101 SYSTEMS Beaudoin, J.D. 1, Hughes Clarke, J.E. 1, Van Den Ameele, E.J. 2 and Gardner, J.V. 3 1: Ocean Mapping Group
TRAINING MATERIAL HOW TO OPTIMIZE ACCURACY WITH CORRELATOR3D
 TRAINING MATERIAL WITH CORRELATOR3D Page2 Contents 1. UNDERSTANDING INPUT DATA REQUIREMENTS... 4 1.1 What is Aerial Triangulation?... 4 1.2 Recommended Flight Configuration... 4 1.3 Data Requirements for
Qinertia THE NEXT GENERATION INS/GNSS POST-PROCESSING SOFTWARE. For all mobile surveying applications
 Qinertia THE NEXT GENERATION /GNSS POST-PROCESSING SOFTWARE For all mobile surveying applications Survey Efficiently, Survey Anywhere, Survey Serenely. QINERTIA has been designed to help surveyors get
3D modeling of the Quest Projects Geophysical Datasets. Nigel Phillips
 3D modeling of the Quest Projects Geophysical Datasets Nigel Phillips Advanced Geophysical Interpretation Centre Undercover Exploration workshop KEG-25 April 2012 Mineral Physical Properties: density sus.
COMBINING MULTIPLE GEOPHYSICAL DATA SETS INTO A SINGLE 3D IMAGE. Abstract
 COMBINING MULTIPLE GEOPHYSICAL DATA SETS INTO A SINGLE 3D IMAGE Jeffrey J. Daniels*, Mark Vendl+, Jennifer Holt*, and Erich Guy* *OSU, Columbus, OH +USEPA, Chicago, IL Abstract Traditional geophysical
Quinnipiac Post Flight Aerial Acquisition Report
 Quinnipiac Post Flight Aerial Acquisition Report August 2011 Post-Flight Aerial Acquisition and Calibration Report FEMA REGION 1 Quinnipiac Watershed, Connecticut, Massachusesetts FEDERAL EMERGENCY MANAGEMENT
v Creating a Size Function SMS 12.2 Tutorial Prerequisites Requirements Time Objectives
 v. 12.2 SMS 12.2 Tutorial Creating a Size Function Objectives This lesson will instruct how to create and apply a size function to a 2d mesh model. Size functions can be created using various data. This
PSLC King County LiDAR
 June 23, 2017 PSLC King County 2016-2017 LiDAR Final Technical Data Report Andy Norton Puget Sound LiDAR Consortium 1011 Western Avenue, Suite 500 Seattle, WA 98104 PH: 206-971-3283 QSI Corvallis 517 SW
v CMS-Wave Analysis SMS 12.2 Tutorial Prerequisites Requirements Time Objectives
 v. 12.2 SMS 12.2 Tutorial Objectives This workshop gives a brief introduction to the CMS-Wave interface and model. This model is similar to STWAVE and the tutorial for the models is similar. As with the
PSLC King County LiDAR. July 18, Technical Data Report.
 July 18, 2016 PSLC King County LiDAR Technical Data Report Andy Norton Puget Sound LiDAR Consortium 1011 Western Avenue, Suite 500 Seattle, WA 98104 PH: 206-971-3283 QSI Corvallis 517 SW 2 nd St., Suite
3 Dimensional modeling of shelf margin clinoforms of the southwest Karoo Basin, South Africa.
 3 Dimensional modeling of shelf margin clinoforms of the southwest Karoo Basin, South Africa. Joshua F Dixon A. Introduction The Karoo Basin of South Africa contains some of the best exposed shelf margin
Updating Autonomous Start to an RTK Field Survey (Part II)
") Updating Autonomous Start to an RTK Field Survey (Part II) Oscar R. Cantu Topcon University FTP Site For access to previously offered webinars and supporting documentation, please go to: ftp://tulive+topconuniversity.com:tulive@ftp.topconuniversity.com
Updating Autonomous Start to an RTK Field Survey (Part II) Oscar R. Cantu Topcon University FTP Site For access to previously offered webinars and supporting documentation, please go to: ftp://tulive+topconuniversity.com:tulive@ftp.topconuniversity.com
1.1.1 Orientation Coordinate Systems
 1.1.1 Orientation 1.1.1.1 Coordinate Systems The velocity measurement is a vector in the direction of the transducer beam, which we refer to as beam coordinates. Beam coordinates can be converted to a
LIDAR an Introduction and Overview
 LIDAR an Introduction and Overview Rooster Rock State Park & Crown Point. Oregon DOGAMI Lidar Project Presented by Keith Marcoe GEOG581, Fall 2007. Portland State University. Light Detection And Ranging
HAWAII KAUAI Survey Report. LIDAR System Description and Specifications
 HAWAII KAUAI Survey Report LIDAR System Description and Specifications This survey used an Optech GEMINI Airborne Laser Terrain Mapper (ALTM) serial number 06SEN195 mounted in a twin-engine Navajo Piper
WinH-ADCP User s Guide
 WinH-ADCP User s Guide P/N 95B-6000-00 (January 2005) RD Instruments Acoustic Doppler Solutions Table of Contents 1 Introduction... 1 1.1 System Requirements...1 1.2 Software Installation...2 1.3 Conventions
Project Report Snohomish County Floodplains LiDAR Survey. Report Presented to:
 August 22, 2005 Project Report Snohomish County Floodplains LiDAR Survey Contract #2295-H Report Presented to: David Evans and Associates, Inc. (DEA) 1620 W. Marine View Drive, Suite 200 Everett, WA 98201
Initial Analysis of Natural and Anthropogenic Adjustments in the Lower Mississippi River since 1880
 Richard Knox CE 394K Fall 2011 Initial Analysis of Natural and Anthropogenic Adjustments in the Lower Mississippi River since 1880 Objective: The objective of this term project is to use ArcGIS to evaluate