NEW INDICATORS OF RIDING COMFORT BASED ON VEHICLE DYNAMICS. Pertti Virtala & Juho Meriläinen
|
|
|
- Mary Dennis
- 5 years ago
- Views:
Transcription


1 NEW INDICATORS OF RIDING COMFORT BASED ON VEHICLE DYNAMICS Pertti Virtala & Juho Meriläinen
2 CONTENT Background Problem statement Methods Results Conclusions 2
3 BACKGROUND & PROBLEM Longitudinal unevenness of a road is one of key condition variables included in the Finnish RAMS since late 1980 s IRI (International Roughness Index) calculated into 100 m intervals has been the index representing the longitudinal unevenness Many studies propose that IRI is not the best index concerning riding comfort (Loizos 2007, Kim et a. 2011, Nair et al 2011, Múčka et al 2016) The practical experiences in the Finnish Transport Agency support those statements. 1. Rutting (60%) 2. Cracks (30%) 3. IRI (10%) 3
4 BACKGROUND & PROBLEM Typical statements have been that it does not represent the riding comfort of pavements well enough and it cannot show where the bad sections locate or what the type of roughness is. A need/wish to a better index exists. 4
5 METHODS Root Cause Analysis What could be the problem? Improving indexes (Simulations) Improving the simulation model by increasing the DOF of the model and calculating new indexes Validation of results (MPR & ROC) Analysing the goodness of an index by comparing the simulated outcomes to information from Mean Panel Rating Recommending better indicators if any to represent the riding comfort on a road 5
6 ROOT CAUSE ANALYSIS A. Road: 1. Road is represented by one longitudinal profile only. 2. The wavelength of longitudinal profile data is filtered to cover wavelengths between 0.5 and 50 m. 3. Simulated using a constant speed 80 km/h. B. Model: 1. Quarter car model can handle only one dimension of movement. 2. Different suspension parameters than a typical European or Japanese car or a truck. 3. The suspension system of the driver s seat is not included in the quarter car simulation model. 6
7 ROOT CAUSE ANALYSIS C. Outcome: 1. IRI represents the vertical movement of a car chassis which is not the best source for searching factors causing discomfort. ISO 2631 uses vertical accelerations 2. The reporting interval of 100 m is too long to locate poor road sections accurately. 3. It also averages the outcome too much and important transients in roughness cannot be recognized. 7


8 IMPROVEMENTS Source data Model Outcome = IRI = A1, A2 A3 B1 C1, C2

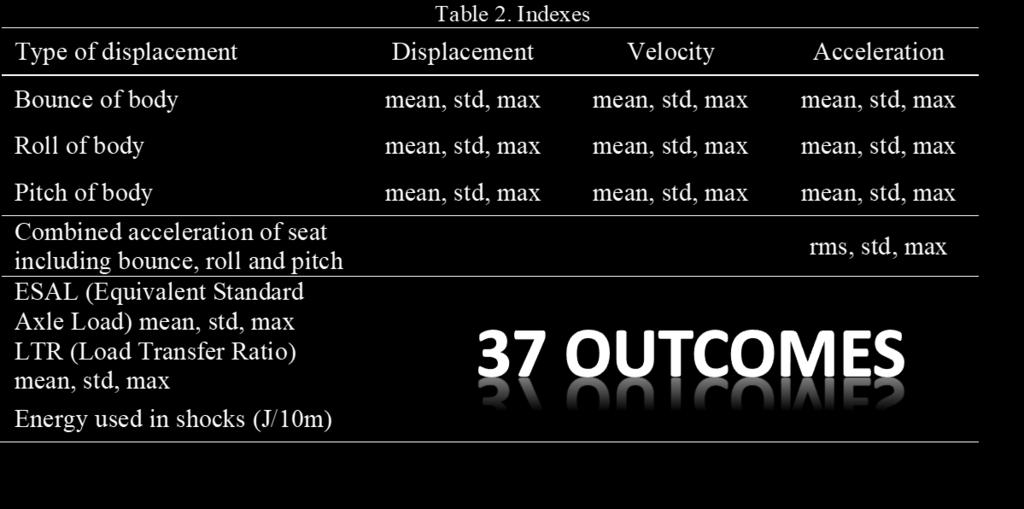
9 LOTS OF OUTCOMES 9

10 METHODS SIMULATIONS MPR - VALIDATION 10

11 vt 1 osa 6 vt 1 osa 7 vt 1 osa 8 vt2 osa 1 vt2 osa 2 vt 25 osa 24 vt 25 osa 25 mt 120 osa 7 mt 120 osa 6 mt 120 osa 5 yt osa 2 yt osa 1 METHODS VALIDATION Mean Panel Rating 11 passengers in a car one by one 9 passengers in a truck one by one Car The average number of bad sections varied according to the site from 1 to 14. Truck The average number of bad sections varied according to the site from 2 to 21. Raters in truck gave 60 % more bad (uncomfortable) sections than raters in car b) Number of bad sections rated in truck min, max and average Site 11
12 VALIDATION GRAPHICAL SELECTION 12
13 COMPARISON OF MPR-DATA & SIMULATED DATA Preliminary selection of indicators according to graphs Best indicators were selected as bounce, roll and pitch, comb acc Best statistical indicators were selected as std of accelerations 13
14 VALIDATION GRAPHICAL SELECTION 14
")
15 (correct not-uncomfortable) RECEIVER OPERATION CHARASTERISTIC CURVE (ROC) Receiver operating characteristic curve, i.e. ROCcurve, Is a graphical plot that illustrates the diagnostic ability of a binary classifier system as its discrimination threshold is varied Horizontal axis = true positive Vertical axis = true negative Curves produced by varying threshold values from min to max Area under curve => goodness of indicator Minimize distance from upper right corner (correct uncomfortable) 15
16 ROC-CURVES BEST INDEXES Index Road VERT_A_STD ROLL_A_STD PITCH_A_STD COMB_A_RMS COM_A_STD IRI_ Average
17 RESULTS The riding comfort was rated more critically in a truck (than in a car). The best indexes able to distinguish poor sections from not poor sections were RMS and STD of combined acceleration. The STD of vertical acceleration, roll acceleration, and pitch acceleration (for a 10 m section) were also good indexes and additionally they gave information about what type of roughness caused the discomfort. The indexes worked best for high standard roads. For a low standard poor condition road it didn t matter so much what index was used. The IRI-index was the worst among selected 6 indexes to distinguish poor sections from not poor sections. 17
18 CONCLUSIONS High speed monitoring produces 3D data of the road pavement which is not very effectively used in IRI-model. Full car model uses 3D data and gives more information of the driving comfort on a road than IRI. Riding comfort is lower in a truck than in a car. Simulated accelerations correlate better with the riding comfort than simulated displacements do. Simulated variation of acceleration or RMS (on a 10 m section) locate the mileposts in poor condition better than simulated averages do. Simulation speeds should be taken from actual speed limits. 18
19 FURTHER ACTIONS New indexes are calculated and added to the data delivered from high speed monitoring. IRI + RIDE-sim. (RIDE definition available) Truck: STD s of vertical accelerations, roll accelerations, pitch accelerations STD & RMS of combined accelerations (ISO 2631) STD of ESALS & LTR, Energy used in shock absorbers Car: Energy used in shock absorbers Several field surveys give promising results Classification of indexes ongoing 19
Profilograph. Changes in Profiling Technology
 Profilograph Changes in Profiling Technology Lightweight Profiler High Speed Profiler 1 How Does It Work? Lightweight Profiler Laser Sensor 2 The Laser Sensor! Laser samples the pavement 16,000/sec! Samples
Detection and Classification of Vehicles
 Detection and Classification of Vehicles Gupte et al. 2002 Zeeshan Mohammad ECG 782 Dr. Brendan Morris. Introduction Previously, magnetic loop detectors were used to count vehicles passing over them. Advantages
Engineering Tool Development
 Engineering Tool Development Codification of Legacy Three critical challenges for Indian engineering industry today Dr. R. S. Prabakar and Dr. M. Sathya Prasad Advanced Engineering 21 st August 2013 Three
Measuring and Assessing Road Profile by Employing Accelerometers and IRI Assessment Tools
 American Journal of Traffic and Transportation Engineering 218; 3(2): 24-4 http://www.sciencepublishinggroup.com/j/ajtte doi: 1.11648/j.ajtte.21832.12 Measuring and Assessing Road Profile by Employing
Comparative Analysis Of Vehicle Suspension System in Matlab-SIMULINK and MSc- ADAMS with the help of Quarter Car Model
 Comparative Analysis Of Vehicle Suspension System in Matlab-SIMULINK and MSc- ADAMS with the help of Quarter Car Model S. J. Chikhale 1, Dr. S. P. Deshmukh 2 PG student, Dept. of Mechanical Engineering,
THE EXPERIENCE WITH OPTIMISATION OF HIGHLY NON-LINEAR DYNAMIC SYSTEMS BY GENETIC ALGORITHMS IN MATLAB ENVIRONMENT
 THE EXPERIENCE WITH OPTIMISATION OF HIGHLY NON-LINEAR DYNAMIC SYSTEMS BY GENETIC ALGORITHMS IN MATLAB ENVIRONMENT Zbynek Šika, Pavel Steinbauer, Michael Valášek, 1 Abstract: The paper summarises experience
COSMOS. Vehicle Suspension Analysis ---- SolidWorks Corporation. Introduction 1. Role of vehicle suspension 2. Motion analysis 2
 ---- WHITE PAPER Vehicle Suspension Analysis CONTENTS Introduction 1 Role of vehicle suspension 2 Motion analysis 2 Motion analysis using COSMOSMotion 3 Real-life example 4-5 Exporting loads to COSMOSWorks
Removing Drift from Inertial Navigation System Measurements RPUG Robert Binns Mechanical Engineering Vehicle Terrain Performance Lab
 Removing Drift from Inertial Navigation System Measurements RPUG 2009 Mechanical Engineering Vehicle Terrain Performance Lab December 10, 2009 Outline Laboratory Overview Vehicle Terrain Measurement System
POSITIONING IN REAL-TIME PUBLIC TRANSPORT NAVIGATION
 POSITIONING IN REAL-TIME PUBLIC TRANSPORT NAVIGATION DRESDEN Comparison Of Vehicle-based And Smart-phone Generated Acceleration Data To Determine Motion States Of Passengers Dipl.-Ing. Ina Partzsch (Fraunhofer
3D laser road profiling for the automated measurement of road surface conditions and geometry.
 3D laser road profiling for the automated measurement of road surface conditions and geometry. John Laurent 1, Jean François Hébert 1, Daniel Lefebvre 2, Yves Savard 3 1 Pavemetrics Systems inc., Canada
Recent Innovations in the Management of Irish National Roads
 Recent Innovations in the Management of Irish National Roads Dr. Kieran Feighan PMS Ray McGowan PMS Tom Casey NRA (Ireland) Andrew O Sullivan NRA (Ireland) NRA Pavement Management System dtims version
Advisory Circular. Measurement and Evaluation of Runway Roughness
 Advisory Circular Subject: Measurement and Evaluation of Runway Roughness Issuing Office: Civil Aviation, Standards Document No.: AC 302-023 File Classification No.: Z 5000-34 Issue No.: 02 RDIMS No.:
Future Federal Aviation Administration (FAA) Developments of Roughness Evaluation for In-Service Airport Pavement
 Developments of Roughness Evaluation for In-Service Airport Pavement") Future (FAA) Developments of Roughness Evaluation for In-Service Airport Pavement Presented to: 2018 European Road Profile Users Group Madrid, Spain By: Albert Larkin, FAA Airport Pavement R & D, Dr. B.
Future (FAA) Developments of Roughness Evaluation for In-Service Airport Pavement Presented to: 2018 European Road Profile Users Group Madrid, Spain By: Albert Larkin, FAA Airport Pavement R & D, Dr. B.
Statistical and Econometric Methods for Transportation Data Analysis
 Statistical and Econometric Methods for Transportation Data Analysis Chapter 14 Ordered Probability Models Example 14.2 Ordered Discrete Data Ordered Probit with Random Effects A survey of 56 subjects
Development and evaluation of an inertial based pavement roughness measuring system
 University of South Florida Scholar Commons Graduate Theses and Dissertations Graduate School 2006 Development and evaluation of an inertial based pavement roughness measuring system Fengxuan Hu University
Essentials for professional use
 Road Surveys using smartphones Essentials for professional use June 2016 - App version 2.1.8- This guide gives a short introduction and briefly describes how to: 1. Collect road roughness data + auto photos
ROAD SURFACE STRUCTURE MONITORING AND ANALYSIS USING HIGH PRECISION GPS MOBILE MEASUREMENT SYSTEMS (MMS)
") ROAD SURFACE STRUCTURE MONITORING AND ANALYSIS USING HIGH PRECISION GPS MOBILE MEASUREMENT SYSTEMS (MMS) Bonifacio R. Prieto PASCO Philippines Corporation, Pasig City, 1605, Philippines Email: bonifacio_prieto@pascoph.com
ROAD SURFACE STRUCTURE MONITORING AND ANALYSIS USING HIGH PRECISION GPS MOBILE MEASUREMENT SYSTEMS (MMS) Bonifacio R. Prieto PASCO Philippines Corporation, Pasig City, 1605, Philippines Email: bonifacio_prieto@pascoph.com
Controllable Suspension Design Using Magnetorheological Fluid
 Controllable Suspension Design Using Magnetorheological Fluid Public Defence October 213 Student: Supervisor: Co-Supervisor: Anria Strydom Prof Schalk Els Dr Sudhir Kaul 1 Outline Project background MR
AN APPROACH TO DEVELOPING A REFERENCE PROFILER
 AN APPROACH TO DEVELOPING A REFERENCE PROFILER John B. Ferris TREY Associate SMITH Professor Graduate Mechanical Research Engineering Assistant Virginia Tech RPUG October Meeting 08 October 28, 2008 Overview
New Technologies for Pavement Evaluation
 New Technologies for Pavement Evaluation TxDOT 3-D Pavement Survey Technology For 86 th Annual Transportation Short Course at Texas A&M University, 2012 Dr. Yaxiong (Robin) Huang, Robin.Huang@txdot.gov
Distress Image Library for Precision and Bias of Fully Automated Pavement Cracking Survey
 Distress Image Library for Precision and Bias of Fully Automated Pavement Cracking Survey Kelvin C.P. Wang, Ran Ji, and Cheng Chen kelvin.wang@okstate.edu Oklahoma State University/WayLink School of Civil
RECTILINEAR MOVEMENT
 RECTILINEAR MOVEMENT This teaching unit continues the study of movement which we began in these two previous units: Moving bodies and Trajectory and Displacement In this one we look separately at Uniform
Research on Suspension System Based on Genetic Algorithm and Neural Network Control
 72 The Open Mechanical Engineering Journal, 2009, 3, 72-79 Open Access Research on Suspension System Based on Genetic Algorithm and Neural Network Control Chuan-Yin Tang and Li-Xin Guo * School of Mechanical
For continuous responses: the Actual by Predicted plot how well the model fits the models. For a perfect fit, all the points would be on the diagonal.
 1 ROC Curve and Lift Curve : GRAPHS F0R GOODNESS OF FIT Reference 1. StatSoft, Inc. (2011). STATISTICA (data analysis software system), version 10. www.statsoft.com. 2. JMP, Version 9. SAS Institute Inc.,
Squirm and lateral Wander in Certain Textures
 Squirm and lateral Wander in Certain Textures A Case Study of Diagnosis and Mitigation Bernard Igbafen Izevbekhai, P.E., Ph.D. MnDOT Research Operations Engineer Research Pays Off Seminar Series March
To Measure a Constant Velocity. Enter.
 To Measure a Constant Velocity Apparatus calculator, black lead, calculator based ranger (cbr, shown), Physics application this text, the use of the program becomes second nature. At the Vernier Software
Product information. Hi-Tech Electronics Pte Ltd
 Product information Introduction TEMA Motion is the world leading software for advanced motion analysis. Starting with digital image sequences the operator uses TEMA Motion to track objects in images,
Modelling of Torsion Beam Rear Suspension by Using Multibody Method
 Multibody System Dynamics 12: 303 316, 2004. C 2004 Kluwer Academic Publishers. Printed in the Netherlands. 303 Modelling of Torsion Beam Rear Suspension by Using Multibody Method G. FICHERA, M. LACAGNINA
Silent Tyre Technology db (a unit measurement for sound or noise level) The design concept for Yokohama s db decibel products was conceived by
 The design concept for Yokohama s db decibel products was conceived by") Silent Tyre Technology db (a unit measurement for sound or noise level) The design concept for Yokohama s db decibel products was conceived by engineers focusing on producing one of the lowest cabin noise
Silent Tyre Technology db (a unit measurement for sound or noise level) The design concept for Yokohama s db decibel products was conceived by engineers focusing on producing one of the lowest cabin noise
Windows 7 Testing. NUCARS Bugs. Attention NUCARS Users, CP LATERAL SHIFT. Wheel Flat Example. Release Number
 Transportation Technology Center, Inc 55500 DOT Road Pueblo, CO 81001 +1 8002653184 wwwttciaarcom/nucars October 12, 2011 Attention NUCARS Users, In our continuing effort to keep our customers informed
Algorithm evaluation for road anomaly detection and wear estimation on trucks using an accelerometer
 Algorithm evaluation for road anomaly detection and wear estimation on trucks using an accelerometer Goran Spiric Master Thesis in Vehicle Engineering Department of Aeronautical and Vehicle Engineering
Pavement Preservation and the Role of Bituminous Surface Treatments A Washington State View. Minnesota Pavement Conference February 14, 2008
 Pavement Preservation and the Role of Bituminous Surface Treatments A Washington State View Minnesota Pavement Conference February 14, 2008 1 The Situation 2 WSDOT policy, in essence, mandated use of BSTs
Example 1: Give the coordinates of the points on the graph.
 Ordered Pairs Often, to get an idea of the behavior of an equation, we will make a picture that represents the solutions to the equation. A graph gives us that picture. The rectangular coordinate plane,
Railway car dynamic response to track transition curve and single standard turnout
 Computers in Railways X 849 Railway car dynamic response to track transition curve and single standard turnout J. Droździel & B. Sowiński Warsaw University of Technology, Poland Abstract In this paper
Ride Analysis of Three Wheeled Vehicle Using MATLAB/Simulink
 Ride Analysis of Three Wheeled Vehicle Using MATLAB/Simulink M K Naidu 1, S Srinivasa Rao 2 and T Tejesh 3 1, 2 Asso.Profs., Mechanical Dept., M V G R College of Engineering Email: mknaidu99@gmail.com
Introduction.
 Product information Image Systems AB Main office: Ågatan 40, SE-582 22 Linköping Phone +46 13 200 100, fax +46 13 200 150 info@imagesystems.se, Introduction TEMA Automotive is the world leading system
APPLICATION OF AERIAL VIDEO FOR TRAFFIC FLOW MONITORING AND MANAGEMENT
 Pitu Mirchandani, Professor, Department of Systems and Industrial Engineering Mark Hickman, Assistant Professor, Department of Civil Engineering Alejandro Angel, Graduate Researcher Dinesh Chandnani, Graduate
The Influence of Yaw Movements on the Rating of the Subjective Impression of Driving
 The Influence of Yaw Movements on the Rating of the Subjective Impression of Driving Thomas Fortmüller, Martin Meywerk Automotive and Powertrain Engineering Helmut-Schmidt-University / University of the
Roughness measuring systems m rail trolley m rail m wheel
 Precision measuring systems for the determination of rail and wheel roughness Roughness measuring systems m rail trolley m rail m wheel www.muellerbbm-rail.com High-precision measuring systems for rough
Smoothness of Pavement in Weighin-Motion
 Standard Specification for Smoothness of Pavement in Weighin-Motion (WIM) Systems AASHTO Designation: MP 14-05 American Association of State Highway and Transportation Officials 444 North Capitol Street
3D Laser Imaging for Pavement Survey at 60 mph and True 1mm Resolution
 3D Laser Imaging for Pavement Survey at 60 mph and True 1mm Resolution Kelvin C. P. Wang Oklahoma State University & WayLink kelvin.wang@okstate.edu 2013 Arizona Pavements/Materials Conference ASU MU,
Development of a Spatial Track Module in SIMPACK and Application to a Simple Roller Coaster Example
 SIMPACK User Meeting 2004 Wartburg, Eisenach, November 2004 Development of a Spatial Track Module in SIMPACK and Application to a Simple Roller Coaster Example Klaus Schott, Jakub Tobolář klaus.schott@dlr.de,
1.4.3 OPERATING SPEED CONSISTENCY
 Geometric Design Guide for Canadian oads 1.4.3 OPEATING SPEED CONSISTENCY The safety of a road is closely linked to variations in the speed of vehicles travelling on it. These variations are of two kinds:
International Symposium Non-Destructive Testing in Civil Engineering (NDT-CE) September 15-17, 2015, Berlin, Germany
 September 15-17, 2015, Berlin, Germany") More Info at Open Access Database www.ndt.net/?id=18355 Effect of Surface Unevenness on In Situ Measurements and Theoretical Simulation in Non-Contact Surface Wave Measurements Using a Rolling Microphone
More Info at Open Access Database www.ndt.net/?id=18355 Effect of Surface Unevenness on In Situ Measurements and Theoretical Simulation in Non-Contact Surface Wave Measurements Using a Rolling Microphone
Online estimation of vehicle load and mass distribution for ground vehicles
 Preprints of the 9th World Congress The International Federation of Automatic Control Cape Town, South Africa. August 4-9, 4 Online estimation of vehicle load and mass distribution for ground vehicles
Finite Element Models for Dynamic Analysis of Vehicles and Bridges under Traffic Loads
 Finite Element Models for Dynamic Analysis of Vehicles and Bridges under Traffic Loads Javier Oliva, Pablo Antolín, José M. Goicolea and Miguel Á. Astiz Department Of Mechanincs And Structures. School
EVALUATION OF TRUCK CABIN VIBRATION BY THE USE OF A DRIVING SIMULATOR. Keywords: Road model, Driving simulator, vibrations, front axle vibrations, HGV
 EVALUATION OF TRUCK CABIN VIBRATION BY THE USE OF A DRIVING SIMULATOR Mattias Hjort Researcher VTI Linköping, Sweden mattias.hjort@vti.se Laban Källgren Research Engineer VTI Linköping, Sweden laban.kallgren@vti.se
4 Leg Air +Hydraulic Leveling System
 4 Leg Air +Hydraulic Leveling System Setup & Configuration Guide Operation Guide Air/Hydraulic FIRMWARE VERSIONS: CONTROLLER 2.18 FRONT SENSOR 2.6 REAR SENSOR 2.9 PNEUMATIC I/O MODULE 2.4 FIRMWARE VERSIONS:
Real-time Stereo Vision for Urban Traffic Scene Understanding
 Proceedings of the IEEE Intelligent Vehicles Symposium 2000 Dearborn (MI), USA October 3-5, 2000 Real-time Stereo Vision for Urban Traffic Scene Understanding U. Franke, A. Joos DaimlerChrylser AG D-70546
The Optimized Physical Model for Real Rover Vehicle
 모 The Optimized Physical Model for Real Rover Vehicle Jun-young Kwak The Robotics Institute Carnegie Mellon University Pittsburgh, PA 15213 junyoung.kwak@cs.cmu.edu Abstract This paper presents the way
A parabolic curve that is applied to make a smooth and safe transition between two grades on a roadway or a highway.
 A parabolic curve that is applied to make a smooth and safe transition between two grades on a roadway or a highway. VPC: Vertical Point of Curvature VPI: Vertical Point of Intersection VPT: Vertical Point
Tracking driver actions and guiding phone usage for safer driving. Hongyu Li Jan 25, 2018
 Tracking driver actions and guiding phone usage for safer driving Hongyu Li Jan 25, 2018 1 Smart devices risks and opportunities Phone in use 14% Other distractions 86% Distraction-Affected Fatalities
Weka VotedPerceptron & Attribute Transformation (1)
") Weka VotedPerceptron & Attribute Transformation (1) Lab6 (in- class): 5 DIC 2016-13:15-15:00 (CHOMSKY) ACKNOWLEDGEMENTS: INFORMATION, EXAMPLES AND TASKS IN THIS LAB COME FROM SEVERAL WEB SOURCES. Learning
Weka VotedPerceptron & Attribute Transformation (1) Lab6 (in- class): 5 DIC 2016-13:15-15:00 (CHOMSKY) ACKNOWLEDGEMENTS: INFORMATION, EXAMPLES AND TASKS IN THIS LAB COME FROM SEVERAL WEB SOURCES. Learning
UNL Professional Math and Science Institute Lesson Plan Using Logger Pro to Analyze Crash Test Video
 UNL Professional Math and Science Institute Lesson Plan Using Logger Pro to Analyze Crash Test Video The lesson plan is designed to allow students to learn to use Logger Pro to analyze video with the end
Multi-Speed Deflectometer. An innovative tool for local authority network asset management
 Multi-Speed Deflectometer An innovative tool for local authority network asset management What is the MSD? Falling Weight Deflectometer The Multi-Speed Deflectometer (MSD) is a new, innovative technique
A successor for the Visibility program for the visibility distance to longitudinal road markings Kai Sørensen; 16 May 2017
 A successor for the Visibility program for the visibility distance to longitudinal road markings Kai Sørensen; 16 May 2017 1. Background in the COST Action 331 COST Action 331: 1999 Requirements for horizontal
Motion Graphs. Plotting position against time can tell you a lot about motion. Let's look at the axes:
 Motion Graphs 1 Name Motion Graphs Describing the motion of an object is occasionally hard to do with words. Sometimes graphs help make motion easier to picture, and therefore understand. Remember: Motion
Sight Distance on Vertical Curves
 Iowa Department of Transportation Office of Design Sight Distance on Vertical Curves 6D-5 Design Manual Chapter 6 Geometric Design Originally Issued: 01-04-0 Stopping sight distance is an important factor
Reliability of Results Depends On:
 HDM-4 Calibration Reliability of Results Depends On: How well the available data represent the real conditions to HDM How well the model s predictions fit the real behaviour and respond to prevailing conditions
Bi-directional seismic vibration control of spatial structures using passive mass damper consisting of compliant mechanism
 Bi-directional seismic vibration control of spatial structures using passive mass damper consisting of compliant mechanism Seita TSUDA 1 and Makoto OHSAKI 2 1 Department of Design, Okayama Prefectural
DASYLab Techniques. Usage- Chart Recorder, Y/t Chart, X/Y Chart. Using Cursors in the Display Modules
 DASYLab Techniques Using Cursors in the Display Modules Updated to include DASYLab 2016 features The DASYLab graphical display modules render the data into a graphical chart display in the following DASYLab
THE BENEFIT OF ANSA TOOLS IN THE DALLARA CFD PROCESS. Simona Invernizzi, Dallara Engineering, Italy,
 THE BENEFIT OF ANSA TOOLS IN THE DALLARA CFD PROCESS Simona Invernizzi, Dallara Engineering, Italy, KEYWORDS automatic tools, batch mesh, DFM, morphing, ride height maps ABSTRACT In the last few years,
Mobile Laser Scanning Technology in Road Depression Measurements
 Mobile Laser Scanning Technology in Road Depression Measurements J. Leinonen, M. Jaakkola, H. Onninen 2 Destia Ltd., Veteraanikatu 9, P.O. Box 444, Oulu, Finland-9 2 Destia Ltd., Heidehofintie 2, P.O.
The Transition Curves (Spiral Curves)
") The Transition Curves (Spiral Curves) The transition curve (spiral) is a curve that has a varying radius. It is used on railroads and most modem highways. It has the following purposes: 1- Provide a gradual
The Transition Curves (Spiral Curves) The transition curve (spiral) is a curve that has a varying radius. It is used on railroads and most modem highways. It has the following purposes: 1- Provide a gradual
Designing for Reliability and Robustness
 MATLAB Digest Designing for Reliability and Robustness By Stuart Kozola No design is free from uncertainty or natural variation. For example, how will the design be used? How will it respond to environmental
Vertical and Horizontal Translations
 SECTION 4.3 Vertical and Horizontal Translations Copyright Cengage Learning. All rights reserved. Learning Objectives 1 2 3 4 Find the vertical translation of a sine or cosine function. Find the horizontal
2. On classification and related tasks
 2. On classification and related tasks In this part of the course we take a concise bird s-eye view of different central tasks and concepts involved in machine learning and classification particularly.
Creating transportation system intelligence using PeMS. Pravin Varaiya PeMS Development Group
 Creating transportation system intelligence using PeMS Pravin Varaiya PeMS Development Group Summary Conclusion System overview Routine reports: Congestion monitoring, LOS Finding bottlenecks Max flow
Evaluation of a laser-based reference system for ADAS
 23 rd ITS World Congress, Melbourne, Australia, 10 14 October 2016 Paper number ITS- EU-TP0045 Evaluation of a laser-based reference system for ADAS N. Steinhardt 1*, S. Kaufmann 2, S. Rebhan 1, U. Lages
Optimization to Reduce Automobile Cabin Noise
 EngOpt 2008 - International Conference on Engineering Optimization Rio de Janeiro, Brazil, 01-05 June 2008. Optimization to Reduce Automobile Cabin Noise Harold Thomas, Dilip Mandal, and Narayanan Pagaldipti
In math, the rate of change is called the slope and is often described by the ratio rise
 Chapter 3 Equations of Lines Sec. Slope The idea of slope is used quite often in our lives, however outside of school, it goes by different names. People involved in home construction might talk about
POINT CLOUD ANALYSIS FOR ROAD PAVEMENTS IN BAD CONDITIONS INTRODUCTION
 POINT CLOUD ANALYSIS FOR ROAD PAVEMENTS IN BAD CONDITIONS Yoshiyuki Yamamoto, Associate Professor Yasuhiro Shimizu, Doctoral Student Eiji Nakamura, Professor Masayuki Okugawa, Associate Professor Aichi
DATA ACQUISITION KIT DESCRIPTION INSTALLATION LAYOUT. Wirings connections
 DATA ACQUISITION KIT DESCRIPTION EVO 3 data logger (8 or 13 channels version) Interface Junction Box Aim Infrared transmitter 12 Volts power cable for infrared transmitter Infrared receiver Wirings to
A NEW METHOD FOR ALIGNING AND SYNCHRONISING ROAD PROFILE DATA FOR BETTER ROAD ROUGHNESS GROWTH ANALYSIS. Robert P. Evans 1* and Arul Arulrajah 1
 A NEW METHOD FOR ALIGNING AND SYNCHRONISING ROAD PROFILE DATA FOR BETTER ROAD ROUGHNESS GROWTH ANALYSIS Robert P. Evans 1* and Arul Arulrajah 1 1 Faculty of Engineering and Industrial Sciences, Swinburne
A Study on the Use of Smartphones for Road Roughness Condition Estimation
 A Study on the Use of Smartphones for Road Roughness Condition Estimation Viengnam DOUANGPHACHANH a, Hiroyuki ONEYAMA b a,b Graduate School of Civil and Environmental Engineering, Tokyo Metropolitan University,
8. Find Service Manuals in TurboDoc.
 8. Find Service Manuals in TurboDoc. We want to access service information relating to diagnostics and testing of the fan clutch for a 1996 Ford F150 vehicle. To access TurboDoc, click the TurboDoc icon
Polymer-Modified Asphalts Enhancing HMA Performance. New Orleans, Louisiana January 28, 2003
 Polymer-Modified Asphalts Enhancing HMA Performance New Orleans, Louisiana January 28, 2003 Presentation Overview 1. Introduction 2. Phase I Overview 3. Summary of Interim Results & Findings Study Objectives
Evaluating Classifiers
 Evaluating Classifiers Reading for this topic: T. Fawcett, An introduction to ROC analysis, Sections 1-4, 7 (linked from class website) Evaluating Classifiers What we want: Classifier that best predicts
ProVAL. User s Guide Version 2.73
 ProVAL User s Guide Version 2.73 ProVAL User s Guide Version 2.73 Manual Revision: 1.30 (2.73) Written by Dr. George K. Chang, P.E.; Mr. Jason C. Dick; and Dr. Robert Otto Rasmussen, P.E. Copyright 2001-2007
Simulation of shock absorbers behavior during a 9m drop test
 Simulation of shock absorbers behavior during a 9m drop test Fabien Collin (TN International) Abstract TN International designs, manufactures and licenses packages for the transportation of radioactive
Vehicle s Kinematics Measurement with IMU
 536441 Vehicle dnamics and control laborator Vehicle s Kinematics Measurement with IMU This laborator is design to introduce ou to understand and acquire the inertia properties for using in the vehicle
Automotive Testing: Optical 3D Metrology Improves Safety and Comfort
 Automotive Testing: Optical 3D Metrology Improves Safety and Comfort GOM Measuring System: ARAMIS, TRITOP, GOM Touch Probe Keywords: Automotive, Crash Testing, Static and Dynamic Deformation, Simulation
OPTIMIZING 3D SURFACE CHARACTERISTICS DATA COLLECTION BY RE-USING THE DATA FOR PROJECT LEVEL ROAD DESIGN
 OPTIMIZING 3D SURFACE CHARACTERISTICS DATA COLLECTION BY RE-USING THE DATA FOR PROJECT LEVEL ROAD DESIGN Benoit Petitclerc, P.E. John Laurent, M. Sc Richard Habel, M. Sc., Pavemetrics Systems Inc., Canada
Supplementary Material
 Supplementary Material 1. Human annotation user interfaces Supplementary Figure 1 shows a screenshot of the frame-level classification tool. The segment-level tool was very similar. Supplementary Figure
Quantification of the characteristics that influence the monitoring of crimping operations of electric terminals for use in the automotive industry
 Quantification of the characteristics that influence the monitoring of crimping operations of electric terminals for use in the automotive industry Vasco A. van Zeller vascovanzeller@ist.utl.pt Instituto
List of Exercises: Data Mining 1 December 12th, 2015
 List of Exercises: Data Mining 1 December 12th, 2015 1. We trained a model on a two-class balanced dataset using five-fold cross validation. One person calculated the performance of the classifier by measuring
Vehicle Suspension Optimization. J. Michael Gray Jacob Wronski Friday May 9 th, 2003
 Vehicle Suspension Optimization J. Michael Gray Jacob Wronski Friday May 9 th, 2003 Presentation Outline Project introduction Simulation model description Trade space exploration Single objective optimization
NX Response Simulation: Structural dynamic response
 Response Simulation: Structural dynamic response NX CAE Benefits Reduce costly physical prototypes by using response simulation to improve product performance Gain insight into the dynamic response of
Transportation Engineering - II Dr.Rajat Rastogi Department of Civil Engineering Indian Institute of Technology - Roorkee
 Transportation Engineering - II Dr.Rajat Rastogi Department of Civil Engineering Indian Institute of Technology - Roorkee Lecture 18 Vertical Curves and Gradients Dear students, I welcome you back to the
A Simplified Vehicle and Driver Model for Vehicle Systems Development
 A Simplified Vehicle and Driver Model for Vehicle Systems Development Martin Bayliss Cranfield University School of Engineering Bedfordshire MK43 0AL UK Abstract For the purposes of vehicle systems controller
MAJOR DIFFERENCES IN BEHAVIORS AND FUNCTIONS. Features ProVAL 2.7 ProVAL 3.0* Separated project analysis file (*.pv2) and imported data files
 and imported data files") PROVAL 3.0 VS 2.7 MAJOR DIFFERENCES IN BEHAVIORS AND FUNCTIONS 1 Features ProVAL 2.7 ProVAL 3.0* Separated project analysis file (*.pv2) and imported data files File and Project (*.ppf) are used to store
PROVAL 3.0 VS 2.7 MAJOR DIFFERENCES IN BEHAVIORS AND FUNCTIONS 1 Features ProVAL 2.7 ProVAL 3.0* Separated project analysis file (*.pv2) and imported data files File and Project (*.ppf) are used to store
CAR BLACK BOX. Beyond Security. User Manual
 CAR BLACK BOX Beyond Security User Manual Camera can be rotated 180 degrees only to the direction of driver's seat. This user manual can be modified for the function enhancement of product without prior
WEEKS 1-2 MECHANISMS
 References WEEKS 1-2 MECHANISMS (METU, Department of Mechanical Engineering) Text Book: Mechanisms Web Page: http://www.me.metu.edu.tr/people/eres/me301/in dex.ht Analitik Çözümlü Örneklerle Mekanizma
CDR File Information. Comments Toyota 86 Registration 1ETM870 Speedometer Reading Kms. Data Limitations CDR Record Information:
 IMPORTANT NOTICE: Robert Bosch LLC and the manufacturers whose vehicles are accessible using the CDR System urge end users to use the latest production release of the Crash Data Retrieval system software
Analysis of Test Methods for Texture Depth Evaluation Applied in Portugal
 Analysis of Test Methods for Texture Depth Evaluation Applied in Portugal E. Freitas and P. Pereira Department of Civil Engineering, University of Minho, Portugal M. L. Antunes and P. Domingos National
20. Security Classification.(of this page) Unclassified
 Unclassified") Technical Report Documentation Page 1. Report No. FHWA/TX-09/0-6004-1 2. Government Accession No. 3. Recipient's Catalog No. 4. Title and Subtitle A PORTABLE PROFILER FOR PAVEMENT PROFILE MEASUREMENTS
Technical Report Documentation Page 1. Report No. FHWA/TX-09/0-6004-1 2. Government Accession No. 3. Recipient's Catalog No. 4. Title and Subtitle A PORTABLE PROFILER FOR PAVEMENT PROFILE MEASUREMENTS
Conference Dynamic Simulation in Vehicle Engineering Realtime Simulation of Vehicles Containing Detailed Components
 General Conference Dynamic Simulation in Vehicle Engineering Realtime Simulation of Vehicles Containing Detailed Components SIMPACK AG 2014, All rights reserved. SIMPACK Introduction Agenda SIMPACK AG
Evaluating Classifiers
 Evaluating Classifiers Reading for this topic: T. Fawcett, An introduction to ROC analysis, Sections 1-4, 7 (linked from class website) Evaluating Classifiers What we want: Classifier that best predicts
WRIGHT-PATTERSON AIR FORCE BASE
 WRIGHT-PATTERSON AIR FORCE BASE DYNAMIC TERRAIN INPUTS TO PREDICT STRUCTURAL INTEGRITY OF GROUND VEHICLES M. W. Sayers April 1988 UMTRI The University of Michigan Transportation Research Institute Technical
1.4. Comparing Graphs of Linear Motion. Acceleration Time Graphs
 Comparing Graphs of Linear Motion Cheetahs are adapted for speed they are the fastest land animals. They can accelerate at faster rates than most sports cars (Figure 1). Cheetahs have been measured accelerating