Creating transportation system intelligence using PeMS. Pravin Varaiya PeMS Development Group
|
|
|
- Hilary Marion Alexander
- 6 years ago
- Views:
Transcription

1 Creating transportation system intelligence using PeMS Pravin Varaiya PeMS Development Group
2 Summary Conclusion System overview Routine reports: Congestion monitoring, LOS Finding bottlenecks Max flow occurs at 60 mph Potential gains from ramp-metering Inefficiency of freeway operations Mobility measures: Predicting travel times Appendices 1
3 Conclusion The integration of IT at all levels of the transportation system greatly enhance freeway systems productivity Examples from Los Angeles illustrate opportunities to improve system management and assist travelers Integration of IT requires reengineering the operations, planning, and investment procedures constituting today s transportation system 2
4 What is PeMS (Performance Measurement System)? PeMS collects and stores Caltrans loop detector data from traffic management centers (TMCs) throughout the state PeMS is accessed via a standard internet browser and contains a series of built-in analytical capabilities to support a variety of uses PeMS supports freeway operations, planning, travelers, and researchers 3
5 Communications architecture PeMS collects and stores data captured by loop detectors in the State s freeways in a central database. PeMS also obtains and stores CHP-published incident data The central database is currently located on the UC Berkeley campus, but it can be accessed from anywhere via the Internet Data are sent from the TMCs to UC Berkeley over the Caltrans wide area network (WAN) PeMS users have different levels of access to the data, depending on needs 4
6 Software architecture Bottom layer is database administration: disk management, crash recovery, table configuration Middle layer comprises software that works in real time. It Aggregates 30-second flow and occupancy values into lane-by-lane, 5-minute values; Calculates the g-factor for each loop at each time, and then the speed for each lane; Aggregates lane-by-lane values of flow, occupancy, and speed across all lanes at each detector station. At this point, PeMS has flow, occupancy, and speed for each 5-minute interval for each detector station; Computes basic performance measures such as congestion delay, vehicle-miles-traveled, vehicle-hours-traveled, and travel times Top layer comprises many built-in applications. 5
7 Status of PeMS PeMS is a functioning Internet application Real-time data from District 3,4,7,8,11 (pending bugs),12 are sent to and stored in PeMS The system will be deployed in July
8 Routine reports (congestion) Many monthly and annual reports and programs can be improved with PeMS The HICOMP report presents location, magnitude, and duration of congestion for California freeways Information used to identify problem areas and establish priorities for operational and air quality improvement projects Data for the report are obtained from floating cars PeMS chart of min, max, avg congestion shows HICOMP report is unreliable 7
9 LOS determination LoS (Level of Service) is used in planning, air quality, and other studies Table gives HCM 2000 relation between LoS and density (passenger cars/mile/lane) PeMS data used to calculate density LOS A B C D E F Density (pc/mi/ln) 0-11 >11-18 >18-26 >26-35 >35-45 >45 8

10 Density contour plot 9
11 LoS for LA (am peak) 10
12 LoS for LA (midday) 11
13 LoS D7 vs D8 (all hours) 12
14 Identifying bottlnecks Select freeway section, time, and variable (eg speed) Plot shows average speed on I-10W from pm20 to 50 at 7.30 am on September 14, 2000 Bottlenecks? Two potential bottlenecks at pm 23 and 32 where speed drops sharply I-10W 13
 and measures to alleviate bottleneck")
15 Identifying bottlnecks (contd) Bottleneck confirmed from PeMS contour map application Repeat confirmation from other days Engineer can focus on causes (geometry, interchanges, demand) and measures to alleviate bottleneck 14
16 Maximum flow occurs at 60 mph Highway Capacity Manual gives speedflow curve with max flow between mph Max flow at 3,363 detectors on Sept 1, 2000, between midnight and noon shows max flow at 60 mph So congestion should be defined as extra delay driving below 60 mph 15
17 Maximum flow occurs at 60 mph (contd) Ramp-metering will be effective only if it maintains free flow Speed below 50 mph cannot be sustained 4:00 5:10 6:00 6:10 5:25 5:30 7:00 16
18 Potential gains from ramp metering Select freeway section I-10W, pm 22 to 38, Jan 11, 2001, 4.00 am to noon Hypothesis: if flow is maintained below max observed flow (less 3%), then speed will be 60 mph Ramp-metering imposes this policy Application calculates total delay, and delay at ramps Congestion delay Excess demand Calculates ramp queues For LA, annual congestion delay estimated at 75 million vehicle-hours of which 50 million is eliminated by this policy 17
19 Inefficiency of traffic operations Previous figure shows at 7.00 am flow is 1300 v/h/ln and speed is 15 mph. So efficiency is Flow Speed η = = 13% MaxFlow SpeedAtMaxFlow(60) Formula based on queuing system. Customer is vehicle, service is transport across segment, service time is SegmentLength Flow customers served in parallel, so throughput Speed is Max throughput is Speed SegmentLength Flow Efficiency is throughput/max throughput SpeedAtMax Flow(60) MaxFlow SegmentLength 18
20 Inefficiency of traffic operations (contd) Estimate efficiency of all 291 segments of I-10W at time of worst congestion on Oct 1, 2000, midnight to noon 78 segments have efficiency under 40%, 65 between 40 and 80%, 46 have efficiency larger than 100 (speed at max flow larger than 60 mph) $1 trillion dollar freeway system has very poor efficiency at time of greatest demand 19
21 Travel time variation Travel times for 20 days in October, 2000, on I-10E, between pm 1.3 and 48.5, starting every 5-min, between 5 am and 8 pm Unconditional distribution shows large variation 90% confidence interval for trip starting at 5 pm is between 55 and 110 min Travel time distribution, conditioned on current and past values, shows much smaller variation Permits prediction of travel time 20
22 Travel time prediction 21
23 Travel time prediction algorithm Given V(d,x,t), velocity at location x on day d at time t Estimate TT e (a, b, t +s), travel time on day e from a to b starting at t + s M(a, b, t+s) = historical average of TT d (a, b, t + s) TT*(a, b, t) = travel time with frozen velocity field V(e, l, t ) TTE e (a, b, t + s ) = α(t, s) TT*( a, b, t + s) + β (t, s) M(a, b, t+s) Obtain α(t, s), β (t, s) by least-squares regression 22
24 Traveler information Speed maps, now common on the Internet and via cable TV, are available at PeMS website The map also shows incidents. Clicking on an incident icon gives a description 23

25 Traveler information PeMS provides travelers in LA travel time estimates and predictions from designated origin to destination for fastest route and 15 other routes Exhibit shows an example Fastest routes will also be provided for HOV vehicles 24
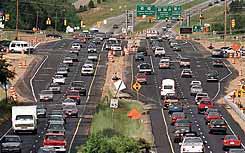
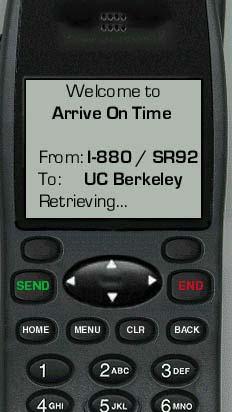
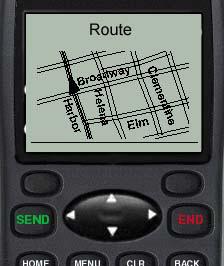
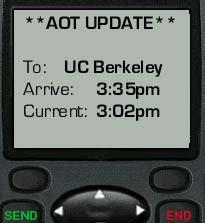
26 Traveler information scenario Am I going to be late? 25
 and any freeway segment, as illustrated here PeMS is developing")
27 Sensor diagnostics PeMS sensor diagnostics allow user to verify when sensors are not working or reporting data inconsistently Users can identify the total number of 30-second intervals of data received or the percent of the total day reporting Analysis can be done for any time period (i.e., hour, day, week, month, year) and any freeway segment, as illustrated here PeMS is developing methods to monitor the data quality based on reasonableness of reported volumes, speeds, occupancies and agreement with neighboring values 26
28 Conclusions Think of freeway system as an agency that produces transport services Output is VMT Fixed input is capital depreciation and workforce that maintains system Variable input is travel time, measured as VHT So Q = VMT/VHT, measures productivity Presentation shows numerous examples to dramatically increase Q 27

29 Appendix 1: How to Access PeMS Go to the following URL: You need a username and password You can get these at the PeMS web site Select Login and then Apply for an Account Fill out the online form and select Apply 28

 Select")
")
30 2) Log-In Web Site Layout 29 3) Select District 1) Introduction 4) Select Analysis
 or 12 (historical data) Select a Freeway - This menu allows you to choose the highway and direction you would like to examine.")
31 Web Site Layout (continued) Select a District - This menu allows you to choose which district to examine. The current choices are District 7,8,3 (real-time data collection) or 12 (historical data) Select a Freeway - This menu allows you to choose the highway and direction you would like to examine. Otherwise, you can input the ID number of a specific loop Plots - This menu allows you to choose from among 6 types of analysis graphs Reference - The Setup and Calculations menu option allows you to access background information on the system. The Data Inventory menu option allows you to access background information on the data collection. The History of Changes menu option allows you to access a log of changes with regard to the data Database For detailed analyses you can directly access the PeMS database 30
32 Appendix 2: PeMS algorithm for g-factors and speeds Outline Theoretical and empirical evidence of g-factor variability The algorithm Empirical results and comparison with constant g-factor algorithm 31
33 g-factor and speed estimation Fundamental relation v () t = g() t count occupancy () t () t T (g vehicle + g detector )/v g vehicle g vehicle /v v loop threshold signal time 32
34 Variation in g-factors between detectors 33
35 Variation in g-factor over time 34
36 PeMS g-factor algorithm Basic assumption: fixed and known free-flow speed o( t) T g ( t) = c( t) inst v free Step 1: IIR filter to trace g-factor g or g filt filt ( t) ( t) = = ( 1 p) g filt ( t g 1) filt ( t 1) + p g inst ( t) Step 2: corrector to cancel delay. g ( t) = g ( t) + τ filt o( t) T v( t) = g ( t) c( t) [ g ( t + ) g ( t) ] hist hist 35
37 Empirical results 36
38 Comparison with constant g-factor algorithm Comparison based on variation over one day Evaluation based on the relative mean error, Err = i v est ( t) v v ( t) real real ( t) 2 37
39 Conclusion and future work Shown empirical evidence of the variability in the g-factor. Introduced PeMS adaptive, real-time g-factor algorithm. Future work: Free-flow speed How to determine congestion? 38
40 Figure: std histogram of g-factor 39
41 Figure: std of g-factor 40

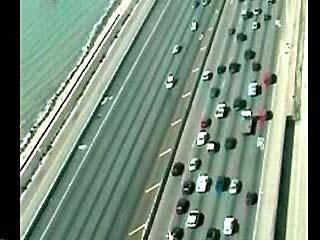
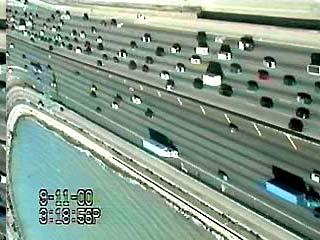
42 Berkeley Highway Lab 12 cameras with overlapping fields of view covering 1.5 miles of I-880 Video data are processed to obtain position and speed of every vehicle Left movie is feature tracker; right movie is grouper 41
43 Lane-changing maneuver and shockwave 42
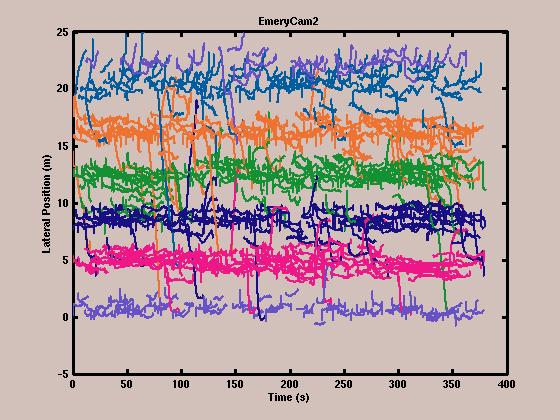
44 Microbehavior 43

45 Lane changing 44

46 Shockwave 45
The Freeway Performance Measurement System (PeMS) (PeMS Version 3)
 (PeMS Version 3)") The Freeway Performance Measurement System (PeMS) (PeMS Version 3) Table of Contents Background Capabilities Your Feedback Appendix 1 Background What is PeMS? The Freeway Performance Measurement System
The Freeway Performance Measurement System (PeMS) (PeMS Version 3) Table of Contents Background Capabilities Your Feedback Appendix 1 Background What is PeMS? The Freeway Performance Measurement System
Causes and Cures of Highway Congestion
 Causes and Cures of Highway Congestion Chao Chen, Zhanfeng Jia and Pravin Varaiya fchaos,jia,varaiyag@eecs.berkeley.edu Electrical Engineering & Computer Science University of California, Berkeley August
IMPUTATION OF RAMP FLOW DATA FOR FREEWAY TRAFFIC SIMULATION
 IMPUTATION OF RAMP FLOW DATA FOR FREEWAY TRAFFIC SIMULATION Ajith Muralidharan Department of Mechanical Engineering University of California, Berkeley CA 9472 Phone: (51) 642-519 Email: ajith@berkeley.edu.
PeMS, Berkeley Highway Lab System, Data Fusion and Future Data Needs
 PeMS, Berkeley Highway Lab System, Data Fusion and Future Data Needs TRB Workshop on Data Fusion Beckman Conference Center Irvine, California April 15~17, 2009 Xiao-Yun Lu Research Engineer California
Practical Use of ADUS for Real- Time Routing and Travel Time Prediction
 Practical Use of ADUS for Real- Time Routing and Travel Time Prediction Dr. Jaimyoung Kwon Statistics, Cal State East Bay, Hayward, CA, USA Dr. Karl Petty, Bill Morris, Eric Shieh Berkeley Transportation
G. Computation of Travel Time Metrics DRAFT
 SHRP 2 Project L03 G. Computation of Travel Time Metrics Introduction The key principles for constructing reliability metrics for use in Project L03 is that the metrics must be based on the measurement
Macroscopic Modeling and Simulation of Freeway Traffic Flow
 Macroscopic Modeling and Simulation of Freeway Traffic Flow Jan Hueper, Gunes Dervisoglu, Ajith Muralidharan, Gabriel Gomes, Roberto Horowitz and Pravin Varaiya Abstract This paper illustrates the macroscopic
APPLICATION OF ADVANCED ANALYSIS TOOLS FOR FREEWAY PERFORMANCE MEASUREMENT
 APPLICATION OF ADVANCED ANALYSIS TOOLS FOR FREEWAY PERFORMANCE MEASUREMENT Pantelis Kopelias Attikes Diadromes S.A., 41.9 Km of Attiki Odos, GR 19002 Peania, Athens, Greece Email:pkopelia@attikesdiadromes.gr
ESTIMATING PARAMETERS FOR MODIFIED GREENSHIELD S MODEL AT FREEWAY SECTIONS FROM FIELD OBSERVATIONS
 0 ESTIMATING PARAMETERS FOR MODIFIED GREENSHIELD S MODEL AT FREEWAY SECTIONS FROM FIELD OBSERVATIONS Omor Sharif University of South Carolina Department of Civil and Environmental Engineering 00 Main Street
UDOT Freeway and Traffic Signal Performance Metrics
 UDOT Freeway and Traffic Signal Performance Metrics September 26, 2016 Grant Farnsworth, PE, PTOE UDOT Traffic Mobility Engineer Kelly Burns Eric Rasband Utah Demographics Speed Report Benefit of Past
An Analysis of TDM Impacts on a Corridor Segment Research Findings
 An Analysis of TDM Impacts on a Corridor Segment Research Findings Phil Winters, CUTR TDM Program Director Liren Zhou, Graduate Research Assistant Sachin Rai, ITS Research Associate Nevine Georggi, TDM
PORTAL. A Case Study. Dr. Kristin Tufte Mark Wong September 23, Linux Plumbers Conference 2009
 PORTAL A Case Study Dr. Kristin Tufte (tufte@cecs.pdx.edu) Mark Wong (markwkm@postgresql.org) Linux Plumbers Conference 2009 September 23, 2009 Overview What is PORTAL? How PORTAL works Improving PORTAL
Connected Corridors: I-210 Pilot Integrated Corridor Management System
 PARTNERS FOR ADVANCED TRANSPORTATION TECHNOLOGY INSTITUTE OF TRANSPORTATION STUDIES UNIVERSITY OF CALIFORNIA, BERKELEY Connected Corridors: I-210 Pilot Integrated Corridor Management System Processing
SIMULATION AND ANALYSIS OF ARTERIAL TRAFFIC OPERATIONS ALONG THE US 61 CORRIDOR IN BURLINGTON, IOWA FINAL REPORT
 SIMULATION AND ANALYSIS OF ARTERIAL TRAFFIC OPERATIONS ALONG THE US 61 CORRIDOR IN BURLINGTON, IOWA FINAL REPORT Principal Investigator Tom Maze Principal Contributor Ali Kamyab Sponsored by the Engineering
Arterial data quality and traffic estimation
 Arterial data quality and traffic estimation Qijian Gan Postdoctoral Researcher PATH University of California, Berkeley qgan@berkeley.edu 10th SF Bay Area ITE Annual Workshop May 2nd, 2018 Outline Introduction
The Practical Side of Cell Phones as Traffic Probes
 The Practical Side of Cell Phones as Traffic Probes The information contained in this document is considered proprietary, and may not be reproduced or redistributed without the consent of Delcan Inc. Cell
Mobile Century data documentation
 Mobile Century data documentation December 16, 2009 Contents 1 USER AGREEMENT, TERMS OF USE 1 2 DESCRIPTION OF THE DATA 2 2.1 Inductive loop detector data................... 2 2.1.1 Inductive loop detector
APPENDIX E TRANSPORTATION
 APPENDIX E TRANSPORTATION 2011 PATRON SURVEYS VISSIM MODEL CALIBRATION AND VALIDATION Environmental and Planning Consultants 440 Park Avenue South 7th Floor New York, NY 10016 tel: 212 696-0670 fax:
APPENDIX D. Traffic Impact Analysis
 APPENDIX D Traffic Impact Analysis TRAFFIC IMPACT ANALYSIS CALEXICO SOLAR FARM I County of Imperial, California July 8, 2011 LLG Ref. 3-11-2034 Prepared by: Cara Leone Transportation Planner II Under the
Economic Crash Analysis Tool. Release Notes
 Release Notes August 2017 Release: 1. Project Information Worksheet: a. Update: Removed the design exception report option b. Enhancement: The first question has been expanded to provide better clarity
Vehicle Re-Identification using Wireless Magnetic Sensors: Algorithm Revision, Modifications and Performance Analysis
 Vehicle Re-Identification using Wireless Magnetic Sensors: Algorithm Revision, Modifications and Performance Analysis Rene O. Sanchez, Christopher Flores, Roberto Horowitz, Ram Rajagopal and Pravin Varaiya
Multi-Sensor Traffic Data Fusion
 CALIFORNIA PATH PROGRAM INSTITUTE OF TRANSPORTATION STUDIES UNIVERSITY OF CALIFORNIA, BERKELEY Multi-Sensor Traffic Data Fusion ZuWhan Kim, A. Skabardonis California PATH Working Paper UCB-ITS-PWP-2003-3
Intelligent Transportation Systems (ITS) for Critical Infrastructure Protection
 for Critical Infrastructure Protection") Intelligent Transportation Systems (ITS) for Critical Infrastructure Protection Presented at the Transportation Research Board January 2002 Annual Meeting Washington DC, USA HAMED BENOUAR Executive Director
Intelligent Transportation Systems (ITS) for Critical Infrastructure Protection Presented at the Transportation Research Board January 2002 Annual Meeting Washington DC, USA HAMED BENOUAR Executive Director
Intelligent Transportation Traffic Data Management
 Intelligent Transportation Traffic Data Management Ugur Demiryurek Asscociate Director, IMSC Viterbi School of Engineering University of Southern California Los Angeles, CA 900890781 demiryur@usc.edu 1
ROADWAY LIGHTING CURFEW
 STATE OF RHODE ISLAND AND PROVIDENCE PLANTATIONS Rhode Island Department of Transportation ROADWAY LIGHTING CURFEW IMPLEMENTATION PLAN March 25, 21 TABLE OF CONTENTS INTRUDUCTION/OVERVIEW... 1 1.1. ANTICIPATED
Acyclica Congestion Management. By Sarah King Regional Sales Manager Control Technologies
 Acyclica Congestion Management By Sarah King Regional Sales Manager Control Technologies Overview 1. Goals 2. Data Collection 3. Measuring Congestion 4. Travel Time 5. Intersection Delay 6. Origin/Destination
Transportation Data for Chicago Traffic Management Center. Abraham Emmanuel Deputy Commissioner, CDOT
 Transportation Data for Chicago Traffic Management Center Abraham Emmanuel Deputy Commissioner, CDOT Chicago Traffic Management Center (TMC) Proposed in the early 2000s with a core building and Advanced
An Analysis of TDM Impacts on a Corridor Segment
 An Analysis of TDM Impacts on a Corridor Segment Phil Winters, CUTR TDM Program Director Liren Zhou, Graduate Research Assistant Sachin Rai, ITS Research Associate Nevine Georggi, TDM Research Associate
VARIATIONS IN CAPACITY AND DELAY ESTIMATES FROM MICROSCOPIC TRAFFIC SIMULATION MODELS
 VARIATIONS IN CAPACITY AND DELAY ESTIMATES FROM MICROSCOPIC TRAFFIC SIMULATION MODELS (Transportation Research Record 1802, pp. 23-31, 2002) Zong Z. Tian Associate Transportation Researcher Texas Transportation
ITS Canada Annual Conference and General Meeting. May 2013
 Evaluation of Travel Time Data Collection Technologies: An Innovative Approach for a Large- Scale Network ITS Canada Annual Conference and General Meeting May 2013 Study Steps Obtain the traffic data from
The negative effects of homogeneous traffic on merging sections
 The negative effects of homogeneous traffic on merging sections J.A.C.M. Elbers a,1 and E.C. van Berkum a a Centre for Transport Studies University of Twente, Department of Civil Engineering Tel: +31 534893821,
RITIS Training Module 10 Script. To return to the Florida Analytics main page, select Florida Analytics Tools in the upper left corner of the page.
 RITIS Training Module 10 Script Welcome to the Regional Integrated Transportation Information System or RITIS Module 10 CBT. To begin, select the start button or press Shift+N on your keyboard. To return
Using Empirical (real-world) Transportation Data to Extend Travel Demand Model Capabilities
 Transportation Data to Extend Travel Demand Model Capabilities") Portland State University PDXScholar TREC Friday Seminar Series Transportation Research and Education Center (TREC) 10-4-2013 Using Empirical (real-world) Transportation Data to Extend Travel Demand Model
Portland State University PDXScholar TREC Friday Seminar Series Transportation Research and Education Center (TREC) 10-4-2013 Using Empirical (real-world) Transportation Data to Extend Travel Demand Model
Managed Lane owner decision needed San Mateo County s options Understanding revenues & costs Pros & cons of County s options Proposed next steps
 San Mateo County Transportation Authority Meeting August 2, 2018 1 OVERVIEW Managed Lane owner decision needed San Mateo County s options Understanding revenues & costs Pros & cons of County s options
ALGORITHMS AND DATA STRUCTURES FOR THE REAL-TIME PROCESSING OF TRAFFIC DATA JEFFREY MILLER
 ALGORITHMS AND DATA STRUCTURES FOR THE REAL-TIME PROCESSING OF TRAFFIC DATA by JEFFREY MILLER A Dissertation Presented to the FACULTY AND THE SCHOOL OF ENGINEERING UNIVERSITY OF SOUTHERN CALIFORNIA In
TxDOT TMS PERFORMANCE MEASURES ITS TEXAS Texas Department of Transportation
 TxDOT TMS PERFORMANCE MEASURES ITS TEXAS 2017 Texas Department of Transportation Traffic Management Systems November 2017 TRF-TM Update 1 2 Implementation of TMS Performance Metrics TMS Performance Metrics
Validation of Simulation Models Using Vehicle Trajectories. TRB Annual Meeting January 11, 2015
 Validation of Simulation Models Using Vehicle Trajectories TRB Annual Meeting January 11, 2015 1 Overview Project Objectives and the Project Team State of Practice for Aggregate Calibration Trajectory
Performance Evaluation of Non-Intrusive Methods for Traffic Data Collection. Kamal Banger, Ministry of Transportation of Ontario
 Abstract Performance Evaluation of Non-Intrusive Methods for Traffic Data Collection Kamal Banger, Ministry of Transportation of Ontario Nancy Adriano, P.Eng., Ministry of Transportation of Ontario For
PARAMICS Plugin Document BOTTLENECK ramp metering control
 PARAMICS Plugin Document BOTTLENECK ramp metering control Lianyu Chu PATH ATMS Center University of California, Irvine Plugin Compatibility: V4 Release date: 3/20/2003 522 Social Science Tower Irvine,
Verification Plan: Mitchell Hammock Road. Adaptive Traffic Signal Control System. Prepared by: City of Oviedo. Draft 1: June 2015
 Verification Plan: Mitchell Hammock Road Adaptive Traffic Signal Control System Red Bug Lake Road from Slavia Road to SR 426 Mitchell Hammock Road from SR 426 to Lockwood Boulevard Lockwood Boulevard from
Connected Corridors Face-to-Face Meeting. Tuesday, Dec 6th, :30 3:30 pm Caltrans D7 HQ
 Connected Corridors Face-to-Face Meeting Tuesday, Dec 6th, 2016 1:30 3:30 pm Caltrans D7 HQ Dec 6th, 2016 Agenda 2 Introductions Schedule Update Outreach High Level Design and Implementation Software Hardware
Mobile Millennium Using Smartphones as Traffic Sensors
 Mobile Millennium Using Smartphones as Traffic Sensors Dan Work and Alex Bayen Systems Engineering, Civil and Environmental Engineering, UC Berkeley Intelligent Infrastructure, Center for Information Technology
TM2.0 Enabling vehicle interaction with traffic management. TF3 Principles for data. Report
 TM2.0 Enabling vehicle interaction with traffic management TF3 Principles for data Report July 2015 1 Outline The focus of Task Force 3 - Principles for Data (TF3) is to provide the basis for data exchange
Running Reports. Choosing a Report CHAPTER
 13 CHAPTER WCS reporting is necessary to monitor the system and network health as well as troubleshoot problems. A number of reports can be generated to run on an immediate and scheduled basis. Each report
research report Evaluation of Driver Reactions for Effective Use of Dynamic Message Signs in Richmond, Virginia
 Final Report VTRC 10-R16 Virginia Transportation Research Council research report Evaluation of Driver Reactions for Effective Use of Dynamic Message Signs in Richmond, Virginia http:/www.virginiadot.org/vtrc/main/online_reports/pdf/10-r16.pdf
Bellevue s Traffic Adaptive Signals
 What we ll cover Bellevue s Traffic Adaptive Signals SCATS Phase 1 Implementation SCATS Operations Responsiveness New Features Some Initial Results 2011 Program and Beyond Final Thoughts ITE Quad Mtg April
Defining and Measuring Urban Conges on
 Primer on Defining and Measuring Urban Conges on Introduc on Traffic congestion has become a major challenge in most urban areas. In recent years, the development of measures to mitigate traffic congestion
ANALYZING AND COMPARING TRAFFIC NETWORK CONDITIONS WITH A QUALITY TOOL BASED ON FLOATING CAR AND STATIONARY DATA
 15th World Congress on Intelligent Transport Systems ITS Connections: Saving Time, Saving Lives New York, November 16-20, 2008 ANALYZING AND COMPARING TRAFFIC NETWORK CONDITIONS WITH A QUALITY TOOL BASED
Los Angeles County Metropolitan Transportation Authority (Metro) Arterial Performance Measures Framework
 Arterial Performance Measures Framework") Los Angeles County Metropolitan Transportation Authority (Metro) Arterial Performance Measures Framework Anita Vandervalk-Ostrander Iteris, Inc. Santa Ana, California, USA Steven Gota, Deputy Executive
Los Angeles County Metropolitan Transportation Authority (Metro) Arterial Performance Measures Framework Anita Vandervalk-Ostrander Iteris, Inc. Santa Ana, California, USA Steven Gota, Deputy Executive
Coupled Evaluation of Communication System Loading and ATIS/ATMS Efficiency
 Coupled Evaluation of Communication System Loading and ATIS/ATMS Efficiency Bruce Hellinga, Hesham Rakha and Michel Van Aerde Department of Civil Engineering, Ellis Hall, Queen s University, Kingston,
THE APPLICATIONS OF ADVANCED TECHNOLOGIES TO AUTOMATE TRAVEL TIMES Port Aransas Ferry Operations Project
 THE APPLICATIONS OF ADVANCED TECHNOLOGIES TO AUTOMATE TRAVEL TIMES Port Aransas Ferry Operations Project America B. Garza, P.E. Corpus Christi District October 15, 2014 Presentation Agenda 1 Introduction
Texas Clear Lanes. Congestion Relief Initiative
 Texas Clear Lanes Congestion Relief Initiative March 2016 Governor Greg Abbott s Charge In September 2015, Governor Greg Abbott challenged the Texas Transportation Commission (Commission) and the (TxDOT)
Optimization of the ALINEA Ramp-metering Control Using Genetic Algorithm with Micro-simulation
 Paper # 03-4400 Optimization of the ALINEA Ramp-metering Control Using Genetic Algorithm with Micro-simulation Lianyu Chu California PATH, ATMS Center Institute of Transportation Studies University of
Away from Isolation: Caltrans Arterial Management
 Away from Isolation: Caltrans Arterial Management David Man CALTRANS TRAFFIC OPERATIONS NOV 19, 2015 1 Agenda Introduction Basic Facts Past Present Future 2070s and Cabinets 2 Basic Facts 5,000 State traffic
REAL-TIME & HISTORICAL FEATURES OF THE BLUEARGUS SOFTWARE SUITE
 REAL-TIME & HISTORICAL FEATURES OF THE BLUEARGUS SOFTWARE SUITE DATA DRIVEN Optimized for travel-time data and dashboardbased visualization, BlueARGUS is the most comprehensive database manipulation software
CORSIM User's Guide. Version 6.0
 CORSIM User's Guide Version 6.0 Prepared by: ITT Industries, Inc., Systems Division ATMS R&D and Systems Engineering Program Team P O Box 15012 Colorado Springs, CO 80935-5012 Prepared for: FHWA Office
TMC of the Future. Matt Lee Associate Vice President
 TMC of the Future Matt Lee Associate Vice President Overview Traffic Operations Centers Transportation Management Centers TMCs are transforming to be more proactive in addressing recurring as well as non-recurring
Ioannis Psarros Department of Civil Engineering and Intermodal Freight Transportation Institute, Memphis, TN
 Ioannis Psarros Department of Civil Engineering and Intermodal Freight Transportation Institute, Memphis, TN CIVL 7904/8904: Traffic Flow Theory (Spring 2014) April 5, 2014 Transportation Research Increased
SYSTEM CONFIGURATION AND FUNCTIONAL OUTLINE OF MPD ROAD TRAFFIC CONTROL CENTER
 Maintaining 'Control Consoles' Responsible for Controlling Traffic across Metropolitan Tokyo Masayuki Kurosawa Traffic Facilities and Control Division, Traffic Bureau Tokyo Metropolitan Police Department
Running Reports CHAPTER
 CHAPTER 14 WCS reporting is necessary to monitor the system and network health as well as troubleshoot problems. A number of reports can be generated to run on an immediate and scheduled basis. Each report
Arizona State Troopers Highway Patrol Division Sergeant John Paul Cartier
 Arizona State Troopers Highway Patrol Division Sergeant John Paul Cartier Average Annual Number of Responders Struck and Killed Nationally 12 Law Enforcement Officers 5 Fire and Rescue Personnel 60 Towing
OR 217,I-5 Experience Portland, OR
 OR 217,I-5 Experience Portland, OR By: Abby Caringula Parsons Brinckerhoff July 8th, 2011 Presentation Outline Background VISUM Network Adjustment Model Origin-Destination(O-D) Demand Development ANM Export
APPLICATION OF AERIAL VIDEO FOR TRAFFIC FLOW MONITORING AND MANAGEMENT
 Pitu Mirchandani, Professor, Department of Systems and Industrial Engineering Mark Hickman, Assistant Professor, Department of Civil Engineering Alejandro Angel, Graduate Researcher Dinesh Chandnani, Graduate
Lesson 5: Design Consistency Module (DCM)
") Go back to: Table of Contents Go to the next lesson Overview : Design Consistency Module (DCM) The Design Consistency Module evaluates operating speed consistency through a speed-profile model that estimates
Go back to: Table of Contents Go to the next lesson Overview : Design Consistency Module (DCM) The Design Consistency Module evaluates operating speed consistency through a speed-profile model that estimates
Understanding the Potential for Video Analytics to Support Traffic Management Functions
 Understanding the Potential for Video Analytics to Support Traffic Management Functions Project Summary Slides November 2014 ENTERPRISE Program Program Goals Facilitate rapid progress in the development
RITIS Training Module 9 Script
 RITIS Training Module 9 Script Welcome to the Regional Integrated Information System or RITIS Module 09 CBT. To begin, select the start button or press Shift+N on your keyboard. This training module will
3 CONCEPT OF OPERATIONS
 0 0 0 This standard describes a general, field-located computing device that must be capable of executing applications software from various developers. Generally accepted systems engineering practices
RITIS Training Module 4 Script
 RITIS Training Module 4 Script Welcome to the Regional Integrated Information System or RITIS Module 04 CBT. To begin, select the start button or press Shift+N on your keyboard. This training module will
Airside Congestion. Airside Congestion
 Airside Congestion Amedeo R. Odoni T. Wilson Professor Aeronautics and Astronautics Civil and Environmental Engineering Massachusetts Institute of Technology Objectives Airside Congestion _ Introduce fundamental
STREAMS Integrated Network Management Presented by: Matthew Cooper
 STREAMS Integrated Network Management Presented by: Matthew Cooper Transmax helps customers realise the community benefits of optimising transport networks by providing smarter, more sustainable ITS solutions.
TxDOT Video Analytics System User Manual
 TxDOT Video Analytics System User Manual Product 0-6432-P1 Published: August 2012 1 TxDOT VA System User Manual List of Figures... 3 1 System Overview... 4 1.1 System Structure Overview... 4 1.2 System
Data Security & Operating Environment
 Data Security & Operating Environment Version 1.0, Summer 2018 Last updated: June 21, 2018 https://www.kintone.com/contact/ Contents 1. Service Level Objective (SLO)... 1 2. Availability and Reliability...
Data Driven Analysis in Transportation Systems
 Data Driven Analysis in Transportation Systems http://imsc.usc.edu/ Ugur Demiryurek, Ph.D. Associate Director, Integrated Media Systems Center (IMSC) Viterbi School of Engineering University of Southern
Slides 11: Verification and Validation Models
 Slides 11: Verification and Validation Models Purpose and Overview The goal of the validation process is: To produce a model that represents true behaviour closely enough for decision making purposes.
Utilization of TSMO Practices in Highway Construction Work Zones: A Case Study
 Utilization of TSMO Practices in Highway Construction Work Zones: A Case Study James Webb, P.E., Iowa Department of Transportation Liz Finarty, P.E., Iowa Department of Transportation James Armstrong,
Tuning RED for Web Traffic
 Tuning RED for Web Traffic Mikkel Christiansen, Kevin Jeffay, David Ott, Donelson Smith UNC, Chapel Hill SIGCOMM 2000, Stockholm subsequently IEEE/ACM Transactions on Networking Vol. 9, No. 3 (June 2001)
Temporally Adaptive A* Algorithm on Time Dependent Transportation Network
 Temporally Adaptive A* Algorithm on Time Dependent Transportation Network Nianbo Zheng, Feng Lu Institute of Geographic Sciences and Natural Resources Research Chinese Academy of Sciences Beijing, 100101,
SRP DEMAND MANAGEMENT STUDY
 SRP DEMAND MANAGEMENT STUDY Setup Guide September 2017 2017 Welcome! Thank you for joining SRP s Demand Management Study. This Setup Guide provides an overview of the study and outlines steps to complete
IT INFRASTRUCTURE PROJECT PHASE I INSTRUCTIONS
 Project Overview IT INFRASTRUCTURE PROJECT PHASE I INSTRUCTIONS This project along with the Phase II IT Infrastructure Project will help you understand how a network administrator improves network performance
Travel Time Estimation Using Bluetooth
 Travel Time Estimation Using Bluetooth Ravindra Gudishala Chester Wilmot Aditya Mokkapatti Louisiana State University/Louisiana Transportation Research Center Objectives Estimate Travel Time in order to
User Manual for Smart Hub Website
 Appendix to Roadway Striping Productivity Data Analysis for INDOT Greenfield and Crawfordsville Districts, SPR-3650 User Manual for Smart Hub Website 1. Login to Website Access to the GT Website is provided
Getting Results from Regional Traffic Incident Management Teams
 Getting Results from Regional Traffic Incident Management Teams Polk County, Florida TIM Team 2008 By: Don Olson and Arland T. (Ted) Smith Florida Department of Transportation District One If this incident
Welcome to our world of smart city and managed motorway solutions. October 2017
 Welcome to our world of smart city and managed motorway solutions. October 2017 Addinsight helps to manage congestion - it s the future of smart cities and motorways. 1 Addinsight and SAGE Automation Addinsight
Managing DC Work Zones: DDOT s Citywide Transportation Management Plan
 Managing DC Work Zones: DDOT s Citywide Transportation Management Plan ARTBA National Work Zone Management Conference September 20, 2016 1 Outline Citywide Transportation Management Plan (TMP) Citywide
Updating NTCIP 1202 (Actuated Signal Controllers) to Support a Connected Vehicle Environment. Authors
 to Support a Connected Vehicle Environment. Authors") Updating NTCIP 1202 (Actuated Signal Controllers) to Support a Connected Vehicle Environment Jean Johnson NEMA 1300 North 17 th Street, Suite 900 Rosslyn, VA 22209 (703) 841-3226 jean.johnson@nema.org
Updating NTCIP 1202 (Actuated Signal Controllers) to Support a Connected Vehicle Environment Jean Johnson NEMA 1300 North 17 th Street, Suite 900 Rosslyn, VA 22209 (703) 841-3226 jean.johnson@nema.org
Lab 1: Improving performance by LAN Hardware Upgrade
 Lab 1: Improving performance by LAN Hardware Upgrade Objective In this lab, OPNET s IT Guru Academic Edition advanced modeling software will be used to study performance improvements in LAN obtained by
South Central ROP Projects
 Pennsylvania Department of Transportation ROP Overview and Summary South Central ROP Projects November 2007 77 INCIDENT MANAGEMENT (IM) Draft Version 1 July 2007-40 - IM 1: SOUTH CENTRAL PA ITS DEPLOYMENT
Improving the Effectiveness of Smart Work Zone Technologies ICT R27-155
 Improving the Effectiveness of Smart Work Zone Technologies ICT R27-155 Paul Lorton, IDOT Yanning Li, Juan Carlos Martinez Mori, and Prof. Dan Work (UIUC) 1 Outline Background on smart work zones Evaluation
Hur kan förbättrad ramp metering minska köerna i Södra Länken?
 Hur kan förbättrad ramp metering minska köerna i Södra Länken? Athina Tympakianaki imobility Lab 2018-06-07, CTR-dagen Motivation Motorway congestion infrastructure capacity travel delay traffic safety
Traffic Congestion Alert System in Work Zone
 Creative Components Iowa State University Capstones, Theses and Dissertations Spring 2018 Traffic Congestion Alert System in Work Zone Vamsi Krishna Jagarlamudi krishnaj@iastate.edu Follow this and additional
Guidelines for Traffic Counting. May 2013
 Guidelines for Traffic Counting May 2013 Guidelines for Traffic Counting Matthew Rodwell Hastings District Council Abbreviations ADT AADT HCV HPMV NZTA RAMM RCA TMS VKT Average Daily Traffic Annual Average
Sensor and sensor network panel. Alexandre Bayen Electrical Engineering and Computer Science Civil and Environmental Engineering UC Berkeley
 Sensor and sensor network panel Alexandre Bayen Electrical Engineering and Computer Science Civil and Environmental Engineering UC Berkeley http://traffic.berkeley.edu http://float.berkeley.edu Classical
CIE4801 Transportation and spatial modelling Beyond the 4-step model
 CIE4801 Transportation and spatial modelling Beyond the 4-step model Erik de Romph, Transport & Planning 31-08-18 Delft University of Technology Challenge the future Multi disciplinary 2 Contents Input
UC DAVIS THERMAL ENERGY STORAGE (TES) TANK OPTIMIZATION INVESTIGATION MATTHEW KALLERUD, DANNY NIP, MIANFENG ZHANG TTP289A JUNE 2012
 TANK OPTIMIZATION INVESTIGATION MATTHEW KALLERUD, DANNY NIP, MIANFENG ZHANG TTP289A JUNE 2012") UC DAVIS THERMAL ENERGY STORAGE (TES) TANK OPTIMIZATION INVESTIGATION MATTHEW KALLERUD, DANNY NIP, MIANFENG ZHANG TTP289A 004 11 JUNE 2012 TABLE OF CONTENTS Abstract...3 Introduction...3 Methodology...4
UC DAVIS THERMAL ENERGY STORAGE (TES) TANK OPTIMIZATION INVESTIGATION MATTHEW KALLERUD, DANNY NIP, MIANFENG ZHANG TTP289A 004 11 JUNE 2012 TABLE OF CONTENTS Abstract...3 Introduction...3 Methodology...4
INTELLIGENT TRAFFIC MANAGEMENT FOR INDIA Phil Allen VP Sales APAC
 INTELLIGENT TRAFFIC MANAGEMENT FOR INDIA 2017-05 Phil Allen VP Sales APAC Phil.Allen@tomtom.com OUR BUSINESS TODAY 4,700 employees in 35 countries LICENSING Delivering digital maps and dynamic content
Chapter 2 Trajectory and Floating-Car Data
 Chapter 2 Trajectory and Floating-Car Data Measure what is measurable, and make measurable what is not so. Galileo Galilei Abstract Different aspects of traffic dynamics are captured by different measurement
DELIVERY SERVICE WEB SITE (DSWEB) PROCEDURES MANUAL
 PROCEDURES MANUAL") DELIVERY SERVICE WEB SITE (DSWEB) BGE - SUPPLIER EXCHANGE OF INFORMATION FOR GAS CHOICE PROGRAMS Table of Contents I. Introduction... 3 II. System Requirements... 3 III. Requesting Access to DSWeb... 3
DELIVERY SERVICE WEB SITE (DSWEB) BGE - SUPPLIER EXCHANGE OF INFORMATION FOR GAS CHOICE PROGRAMS Table of Contents I. Introduction... 3 II. System Requirements... 3 III. Requesting Access to DSWeb... 3
Veirs Mill Road Metrobus Improvements Request to Conduct Public Hearing
 Customer Services, Operations, and Safety Committee Board Information Item III-B September 24, 2009 Veirs Mill Road Metrobus Improvements Request to Conduct Public Hearing Washington Metropolitan Area
UNIFORM GUIDELINES RED LIGHT CAMERA ENFORCEMENT
 UNIFORM GUIDELINES RED LIGHT CAMERA ENFORCEMENT CULVER CITY POLICE DEPARTMENT AUTOMATED ENFORCEMENT DIVISION CITY OF CULVER CITY, CALIFORNIA Table of Contents SECTION 1- Purpose of Uniform Guidelines SECTION
Concept Definition Report Adaptive Urban Signal Control Integration (AUSCI) Project. Executive Summary -- August 1995
 Project. Executive Summary -- August 1995") Executive Summary -- August 1995 This summary highlights the work performed as part of the AUSCI Concept Definition Report. Additional supporting and background material is presented in a separate document
Executive Summary -- August 1995 This summary highlights the work performed as part of the AUSCI Concept Definition Report. Additional supporting and background material is presented in a separate document