RGS data reduction and analysis of point-like sources
|
|
|
- Ambrose Neal
- 5 years ago
- Views:
Transcription
1 14 th ESAC SAS Workshop 2 nd 6 th June 2014 RGS data reduction and analysis of point-like sources Rosario González-Riestra XMM-Newton SOC ESAC

2 Processing RGS data (I) from... to... FRAME Time CCD, node, RAWX CCD, node, RAWY rgsproc Wavelength Cross Dispersion ENERGY Flux
3 Processing RGS data (II) PPS YES Final products SAS version coordinates, reprocess CCFs? YES extraction Some checks.. regions OK? background OK? spectra response matrices NO NO run rgsproc make changes Science analysis ODF
4 The RGS processing task: rgsproc meta-task: interface to 20 SAS tasks (that can also be run separately) controlled by 80 parameter switches six entry and final points ( processing stages ) 1:events 3:filter 5:fluxing 2:angles 4:spectra 6:lightcurve produces filtered event lists, light curves, spectra and response matrices the quality of the results depends critically on the accuracy of the coordinates of the source
 Target coordinates: RA,dec : incidence angle of target photons = ( cos - cos ) d / m measured known = o + F / L known known = f (RA, dec, RA o, dec o,p.a.) input to rgsproc known from S/C attitude")
5 A simplified scheme of the RGS FOV (and why the coordinates are so important!) Target coordinates: RA,dec : incidence angle of target photons = ( cos - cos ) d / m measured known = o + F / L known known = f (RA, dec, RA o, dec o,p.a.) input to rgsproc known from S/C attitude history file S/C pointing: RA o, dec o o : incidence angle at centre of FOV the wavelength scale and the effective area depend on the position of the source in the FOV 1 arcsec 2.3 må (45 km/s at 15 Å)
6 Source dependent Source independent rgsproc: what does it do? Stage Task Purpose Output atthkgen generates attitude file attfilter filters the attitude file hkgtigen generates housekeeping GTIs Events rgsoffsetcalc rgssources rgsframes rgsenergy uses the diagnostic mode data for offset calculation creates the list of sources to processed flags bad frames, convert RAW[XY] to readout node reference system, creates GTI for telemetry drops, calculates dead time performs energy calibrations, i.e. creates the PI column Source list and intermediate combined event list rgsbadpix flags bad pixels from CCF and from own analysis rgsevents reconstructs events: total energy,pattern and coordinates evlistcomb concatenates event list Angles rgsangles performs aspect correction Filter rgsfilter filters event list, removing unwanted frames and events and adding exposure maps Final event list rgsregions computes background and source extraction regions for each source Spectra rgsspectrum extracts source and background spectra Source and background spectra rgsbkgmodel generates model background Fluxing rgsrmfgen creates response matrix Response matrices and rgsfluxer combines several RGS spectra into a single fluxed spectrum fluxed spectrum Lightcurve rgslccorr creates background-subtracted light curves Light curve
7 rgsproc: parameters entrystage -- optional,type=string,default=events; (re)start processing at finalstage -- optional,type=string,default=fluxing; conclude processing at withfoundhot -- optional,type=bool,default=yes; include found hot pixels withinstexpids -- optional,type=bool,default=no; enable explicit subset of exposures pixnoiselimit -- optional,type=int,constraints="pixnoiselimit spatialres -- optional,type=int,constraints="spatialres in [0:4095]",default=0; in [2:]",default=5; hot pixel threshold vertices pulse per height node across spatial regions instexpids -- optional,type=list<string>; instrument-exposure id list colnoiselimit -- optional,type=int,constraints="colnoiselimit orderres -- optional,type=int,constraints="orderres in [0:4095]",default=250; in [2:]",default=3; hot column vertices threshold per node pulse across height order regions orders -- optional,type=list<int>,constraints="orders in [1:6]",default='1 2'; reflection orders for spectrum generation pixsharpness -- optional,type=real,constraints="pixsharpness xpsfincl -- optional,type=real,constraints="xpsfincl in [0:]",default=5; in [0:100]",default=90; hot pixel sharpness percent criterion of cross-dispersion PSF included expunge -- optional,type=list<string>,default=events; delete intermediate files colsharpness -- optional,type=real,constraints="colsharpness xpsfexcl -- optional,type=real,constraints="xpsfexcl in [0:]",default=8; in [0:100]",default=95; hot column sharpness percent criterion of cross-dispersion PSF excluded from background withprefix -- optional,type=bool,default=no; enable filename prefix override detcoord -- optional,type=string,default=cam; pdistincl -- optional,type=real,constraints="pdistincl detector coordinate system in [0:100]",default=90; percent of pulse-height distribution included prefix -- optional,type=string; prefix for product filenames withdetcoord -- optional,type=bool,default=no; procsrcsexpr -- optional,type=string,default=index==#primesrc; enable detector coordinate output select which sources to process timestep -- optional,type=real,constraints="timestep in [0:]",default=1; [seconds] time step reconstruct -- optional,type=bool,default=yes; exclsrcsexpr -- optional,type=string,default=index==#primesrc; enable event reconstruction select which sources to exclude from background driftlimit -- optional,type=real,constraints="driftlimit in [0:]",default=5; [arcmin] GTI attitude drift limit betabinning -- optional,type=string,default=binsize; bkgcorrect -- optional,type=bool,default=yes; Specify number or size background of beta bins correct the spectra withepicset -- optional,type=bool,default=no; add sources from an epic-derived source list betabinref -- optional,type=real,default= ; withbkgset -- optional,type=bool,default=yes; midpoint of bin for generate which BETACHA background is one spectra [rad] epicset -- optional,type=dataset; name of the epic-derived source list betabinwidth -- optional,type=real,constraints="betabinwidth edgechannels -- optional,type=int,constraints="edgechannels in [0:]",default=1.208e-05; in [0:]",default=2; width of beta bin flag [rad] chip-edge channels as dubious withsrc -- optional,type=bool,default=no; add a source with user-defined position, rate etc nbetabins -- optional,type=int,constraints="nbetabins rebin -- optional,type=int,constraints="rebin in [1:]",default=3400; in [1:]",default=1; number of beta dispersion bins channel rebinning factor srclabel -- optional,type=string,default=user; label for the user-defined source betamin -- optional,type=real,default=0.03; withfracexp -- optional,type=bool,default=no; lowerleft of first beta bin [rad] add FRAC_EXP column to output files srcrate -- optional,type=real,constraints="srcrate in [0:]",default=0; rate value (if known) for the user-defined source betamax -- optional,type=real,default=0.08; exposed -- optional,type=real,constraints="exposed top end of last beta bin [rad] in [0:1]",default=0.1; minimum good fractional exposure srcstyle -- optional,type=string,default=radec; style for entering the position of the user-defined source xdispbinning -- optional,type=string,default=binsize; badquality -- optional,type=int,constraints="badquality Specify number or size of cross-dispersion in [0:5]",default=1; bins QUALITY used to flag bad channels srcra -- optional,type=real,default=-999; [decimal degrees] right ascension of the user-defined source xdispbinref -- optional,type=real,default= ; rmfbins -- optional,type=int,constraints="rmfbins midpoint of for which in [1:]",default=4000; XDSPCHA is one [rad] number of response energy bins srcdec -- optional,type=real,default=-999; [decimal degrees] declination of the user-defined source xdispbinwidth -- optional,type=real,constraints="xdispbinwidth fftdim -- optional,type=int,constraints="fftdim in [0:]",default=1.08e-05; in [1:5]",default=3; width convolution of cross size dispersion exponent bin [rad] srcdisp -- optional,type=real,default=0; [arcmin] dispersion off-axis angle of the user-defined source nxdispbins -- optional,type=int,constraints="nxdispbins withmirrorpsf -- optional,type=bool,default=yes; in [1:]",default=170; whether number to of include xdisp bins the standard mirror PSF distribution srcxdsp -- optional,type=real,default=0; [arcmin] cross-dispersion off-axis angle of the user-defined source xdispmin -- optional,type=real,default=-0.001; angdistset -- optional,type=file,default=angdist.txt; lowerleft of first xdisp bin [rad] user-defined angular distribution file attstyle -- optional,type=string,default=expmedian; for defining the reference attitude xdispmax -- optional,type=real,default=0.001; withangdist -- optional,type=bool,default=no; top end of last xdisp bin [rad] whether to include a custom angular distribution attra -- optional,type=real,default=-999; [decimal degrees] right ascension of the user-defined attitude withpointingcolumn -- optional,type=bool,default=no; mergeorders -- optional,type=bool,default=no; Produce columns with flux all Spacecraft orders together Pointing attdec -- optional,type=real,default=-999; [decimal degrees] declination of the user-defined attitude withmlambdacolumn -- optional,type=bool,default=no; flxformat -- optional,type=string,default=dal; Produce column output with m*lambda file format (source at requested position) attapos -- optional,type=real,default=-999; [decimal degrees] position angle of the user-defined attitude rejflags -- optional,type=list<string>,default='bad_shape flxmode -- optional,type=string,default=wavelength; ON_NODE_INTERFACE computational ON_BADPIX NEXT_TO_BADPIX mode calcoffsets -- optional,type=bool,default=no; calculate offsets from diagnostic mode flxmin -- optional,type=real,constraints="flxmin ON_WINDOW_BORDER BELOW_ACCEPTANCE'; in [0:]",default=4; event rejection minimum flags output wavelength or energy withoffsethistogram -- optional,type=bool,default=no; Store histograms in a dataset driftbinsize -- optional,type=real,constraints="driftbinsize flxmax -- optional,type=real,constraints="flxmax in [0:]",default=1; in [arcsec] [0:]",default=39; drift quantization maximum width output wavelength or energy withdiagoffset -- optional,type=bool,default=no; enable offset subtraction from Diagnostic Offset Average files withcombmap -- optional,type=bool,default=yes; flxbins -- optional,type=int,constraints="flxbins generate the combined in exposure [1:]",default=3400; map number of output bins withgain -- optional,type=bool,default=yes; enable gain correction auxgtitables -- optional,type=list<table>; flxquality -- optional,type=list<int>,constraints="flxquality Additional GTI tables in [0:5]",default=0; usable quality in promotion order withcti -- optional,type=bool,default=yes; enable CTI correction withflxnan -- optional,type=bool,default=no; enable alternate NaN value withadvisory -- optional,type=bool,default=yes; include non-uplinked CCF bad pixels flxnan -- optional,type=real,default=0; alternate NaN value


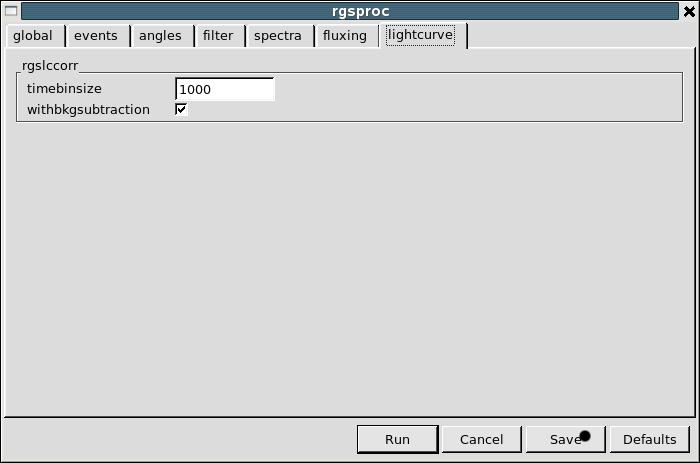
8 rgsproc: the GUI Global Events Angles Filter Spectra Fluxing Lightcurve
9 What do I get after the processing? For each RGS and exposure: File Content rgsproc (default) PPS P R1S004EVENLI0000.FIT Filtered Event List Y Y P R1S004SRCLI_0000.FIT Source List Y (coord from proposal) Y (coord from EPIC src list) P R1S004BGSPEC1001.FIT P R1S004BGSPEC2001.FIT Background Spectra (1 st and 2 nd order) Y Y P R1S004SRSPEC1001.FIT P R1S004SRSPEC2001.FIT Source Spectra (1 st and 2 nd order) N Y P R1S004SBSPEC1001.FIT P R1S004SBSPEC2001.FIT Source+Bkg Spectra (1 st and 2 nd order) Y Y P R1S004RSPMAT1001.FIT P R1S004RSPMAT2001.FIT Response Matrices (1 st and 2 nd order) Y only for 1 st order P R1S004IMAGE_0000.FIT P R1S004IMAGE_0000.PNG Dispersion-CrossDispersion Image N Y P R1S004ORDIMG0000.FIT P R1S004ORDIMG0000.PNG Dispersion-Energy Image N Y P R1S004EXPMAP0000.FIT Exposure Map Y Y P R1S004FBKTSR0000.FIT Flare Background Timeseries N Y P R1S004MBSPEC1000.FIT P R1S004MBSPEC2000.FIT P R1S004SRTSR_1001.FIT P R1S004BGTSR_1001.FIT Model Background Spectra N Y Source and Background Lightcurves Y Y For each observation: File Content rgsproc (default) PPS P OBX000fluxed1000.FIT P OBX000fluxed2000.FIT Source Fluxed Spectra (1 st and 2 nd order) Y Y


10 The filtered event list M_LAMBDA vs XDISP_CORR: Spatial Image M_LAMBDA vs PI: Order Image
11 The source list List of coordinates Extraction regions Sources can be added and/or modified with rgssources Region definitions can be changed with rgsregions. Defaults are: source spatial: 95% of x-dispersion PSF inclusion background spatial: 98% of x-dispersion PSF exclusion order mask: 95% of pulse-height distribution

12 The event list and the extraction regions Source Background 14th SAS Workshop, ESAC, 4 June 2014

13 The event list and the extraction regions 1 st order 2 nd order 14th SAS Workshop, ESAC, 4 June 2014
14 The light curve generated with rgslccorr filters the event list file using the source and background region from the source list light curves are extracted for 1 st and 2 nd orders default in rgsproc: with background subtraction and time bin of 1000 s rgslccorr allows the user to select a range of CCDs/wavelength/energy the background light curve is produced separately
15 The extracted spectrum generated with rgsspectrum spectra are extracted for 1 st and 2 nd orders default since SAS 10.0: wavelength space the rgsproc default is the total source spectrum (i.e. NOT background subtracted) the background spectrum is produced separately a model background can be generated optionally with rgsbkgmodel
16 The fluxed spectrum RGS extracted spectra (channel/counts) can be converted to physical units Å vs. photons cm -2 s -1 Å -1 (fluxed) with rgsfluxer This task also merges several spectra to (e.g.) on a single spectrum increasing the signal-to-noise ratio fluxed spectra must be used with care in spectral fitting codes, since they do not take into account the effects of redistribution. from RGS countrate to physical flux => extracted spectrum + response matrix
17 The response matrices Response files for each source and order are computed with rgsrmfgen - Effective area depends on data selections both in PI and XDISP - Inter-chip gaps - Bad columns - Wiggles due to sampling of data selection regions - Failing CCD chains - Instrumental edges
18 Should I reprocess the data? SAS version of pipeline products PROC0 and PROCDATE The calibration index file are there new calibration files? Source coordinates and extraction regions are they right? Background was the observation affected by flares? Multiple sources and regions are there several sources within the FOV? 14th SAS Workshop, ESAC, 4 June 2014
19 High background (I) Proton flare during observation decrease in signal-to-noise! Derive the binned (10/100 sec) light curve of the background region of CCD#9 with evselect or xmmselect [or use Pipeline file "FBKTSR"] Select periods with (e.g) 0.5 c/s and generate GTIs with tabgtigen

20 High background (II) re-run rgsproc from the 'filter' stage: rgsproc entrystage=filter auxgtitables=mygti.ds Same High observation background filtered observation to CCD9 (CCD9 < 0.5 up counts/sec to 9 counts/sec)

21 Multiples sources and masks (I) If there are several sources in the FOV (YY Gem/ Castor)... Field with two sources separated by 71 primary source: YY Gem, secondary source: Castor Castor Castor YY Gem YY Gem EPIC MOS image

22 Multiples sources and masks (II) Use rgssources to add the coordinates of Castor to the SRCLIST table Castor Use rgsregions to create new region masks excluding both sources from the background Run rgsproc entrystage=spectra to extract the new spectrum YY Gem
23 Data analysis Extracted source + background spectra + response matrix Work using specific packages, e.g. XSPEC, SPEX, Sherpa, PintOfAle, ISIS.. OVII triplet in YY Gem Mkn 421
24 Summary Data processing with rgsproc events angles filter spectra fluxing lightcurve Checks PPS version and calibration files coordinates, sources and regions high background, flares Data analysis response matrices and effective area fitting (model vs observation)
OM data reduction using SAS
 XMM-Newton Optical-UV Monitor: data reduction OM data reduction using SAS Antonio Talavera XMM-Newton Science Operation Centre, ESAC, ESA Simon Rosen, Chris Brindle & Vladimir Yershov MSSL, UCL, UK OM
SAS development status
 development status Carlos GABRIEL and the S3MT Science Operations Centre / ESA Page 1 SOC team After John Hoar > GAIA and Jenny Carter > EPIC@Leicester : - Eduardo Ojero - Richard Saxton - Aitor Ibarra
attcalc June 20, 2018 Abstract
 XMM-Newton Science Analysis System Page: 1 attcalc June 20, 2018 Abstract The task attcalc calculates linearized sky coordinates (i.e. a tangential projection on the sky) on an event-by-event basis, and
Chandra Source Catalog Quality Assurance Specifications
 I. General Chandra Source Catalog Quality Assurance Specifications August 17, 2007 Ian Evans (ievans@cfa.harvard.edu) 1. Quality Assurance Mechanisms Chandra Source Catalog quality assurance is achieved
THE EPIC SIMULATOR AND PILE-UP MODELLING. Prashin Jethwa EPIC BOC /3/2012
 THE EPIC SIMULATOR AND PILE-UP MODELLING Prashin Jethwa EPIC BOC 2012 7/3/2012 OUTLINE Introduction to the EPIC simulator What is it? How does it work? Validation Pile-up modelling Flux losses Spectral
ESAS into SAS ESAC. XMM-Newton. Carlos GABRIEL & Aitor IBARRA. XMM-Newton Science Operations Centre ESAC / ESA SAS
 E into Carlos GABRIEL & Aitor IBARRA Science Operations Centre / ESA What is E? Extended Source Analysis Software (E): * package for the analysis of EPIC MOS and pn observations (by SS & KK), [suited especially
SAS development, maintenance and future
 SAS development, maintenance and future Carlos GABRIEL (*) XMM-Newton Science Operations Centre ESAC / ESA *on behalf of a lot of people (SAS & PPS Team, SAS WG,...) SAS & PPS development and maintenance
Using A Pileup Model
 Using A Pileup Model Sherpa Threads (CIAO 3.4) Using A Pileup Model 1 Table of Contents Background Information Remove the acis_detect_afterglow Correction Getting Started Reading in Data & Instrument Responses
Obtain Grating Spectra from LETG/HRC I Data
 Obtain Grating Spectra from LETG/HRC I Data CIAO 3.4 Science Threads Obtain Grating Spectra from LETG/HRC I Data 1 Table of Contents Obtain Grating Spectra from LETG/HRC I Data CIAO 3.4 Data Preparation
PACS SPECTROMETER SPATIAL CALIBRATION
 PACS SPECTROMETER SPATIAL CALIBRATION A. Contursi Herschel Calibration workshop 18-20 January ESAC Spatial Calibration Observations summary 40x40 chopped raster at chopper position 0 on Neptune, step size
Introduction to the Data Model
 DM Intro CIAO 34 Introduction to the Data Model CIAO 34 Science Threads Introduction to the Data Model 1 Table of Contents DM Intro CIAO 34 Get Started Data Model Tools Running Data Model Tools Virtual
Chandra X-Ray Center. CIAO Workshop
 Chandra X-Ray Center 1 CIAO Workshop Introduction to X-Ray Data Analysis David Huenemoerder (MIT) Randall Smith (CfA) Abstract We describe in general terms how flux incident on an X-Ray telescope observatory
Introduction to CIAO (Chandra Interactive Analysis of Observations)
") Introduction to CIAO (Chandra Interactive Analysis of Observations) From "ahelp ciao"... A powerful data analysis system originally written for the needs of users of the Chandra X-ray Observatory. Built
Introduction to CIAO (Chandra Interactive Analysis of Observations) From "ahelp ciao"... A powerful data analysis system originally written for the needs of users of the Chandra X-ray Observatory. Built
Extracting Extended Source Spectra and Responses
 Extracting Extended Source Spectra and Responses CIAO 3.4 Science Threads Extracting Extended Source Spectra and Responses 1 Table of Contents Getting Started CALDB 3.3.0.1 patch Using Consistent Calibration:
Imaging and Deconvolution
 Imaging and Deconvolution Urvashi Rau National Radio Astronomy Observatory, Socorro, NM, USA The van-cittert Zernike theorem Ei E V ij u, v = I l, m e sky j 2 i ul vm dldm 2D Fourier transform : Image
SAS status and development - medium and long term strategy
 SAS status and development - medium and long term strategy Carlos GABRIEL XMM-Newton Science Operations Centre ESAC / ESA On behalf of SOC SAS&PPS & SAS WG teams 19th XMM-Newton Users Group Meeting ESA
VERY LARGE TELESCOPE 3D Visualization Tool Cookbook
 European Organisation for Astronomical Research in the Southern Hemisphere VERY LARGE TELESCOPE 3D Visualization Tool Cookbook VLT-SPE-ESO-19500-5652 Issue 1.0 10 July 2012 Prepared: Mark Westmoquette
1 acis make bkgd. MEMORANDUM May 11, Description. 1.2 Parameters
 MIT Kavli Institute Chandra X-Ray Center MEMORANDUM May 11, 2006 To: Jonathan McDowell, SDS Group Leader From: Glenn Allen (SDS) for the ACIS Background Working Group Subject: acis make bkgd Revision:
Data products. Dario Fadda (USRA) Pipeline team Bill Vacca Melanie Clarke Dario Fadda
 Pipeline team Bill Vacca Melanie Clarke Dario Fadda") Data products Dario Fadda (USRA) Pipeline team Bill Vacca Melanie Clarke Dario Fadda Pipeline (levels 1 à 2) The pipeline consists in a sequence of modules. For each module, files are created and read
Data products Dario Fadda (USRA) Pipeline team Bill Vacca Melanie Clarke Dario Fadda Pipeline (levels 1 à 2) The pipeline consists in a sequence of modules. For each module, files are created and read
GIANO: The Graphical User Interface Manual
 1/22 GIANO: The Graphical User Interface Manual Document: TNG-GIANO-001 Issue: 1.0 Prepared by : Name: S. Scuderi Institute: INAF Osservatorio Astrofisico di Catania Date : Approved by : Name: L. Origlia
ESAS upgrades in SAS. Carlos GABRIEL + S3MT + SAS WG XMM-Newton Science Operations Centre ESAC / ESA
 ESAS upgrades in SAS Carlos GABRIEL + S3MT + SAS WG XMM-Newton Science Operations Centre ESAC / ESA SAS development, future plans, and expected ESAS upgrades in SAS Carlos GABRIEL + S3MT + SAS WG XMM-Newton
Simulation and Auxiliary Data Management
 Simulation and Auxiliary Data Management Paola Sartoretti GEPI Meudon Simulation/Test and Auxiliary data! Test data are the simulated RVS data needed to test the data reduction algorithms. They are produced
Introduction to CIAO
 1 Introduction to CIAO (Chandra Interactive Analysis of Observations) CIAO: Chandra's data analysis system Fruscione et al. 2006, SPIE Proc. 6270, 62701V, D.R. Silvia & R.E. Doxsey, eds. THE PEOPLE WHO
CIAO Exercises. Table of Contents. Introduction. Getting to know Chandra data Download dataset. Exercise 10. Review V&V report.
 CIAO Exercises Table of Contents Introduction Getting to know Chandra data Download dataset Exercise 1 Review V&V report Exercise 2 Display data in ds9 Exercise 3 Exercise 4 Exercise 5 Exercise 6 Inspect
Obtain Grating Spectra from HETG/ACIS S Data
 Obtain Grating Spectra from HETG/ACIS S Data CIAO 3.4 Science Threads Obtain Grating Spectra from HETG/ACIS S Data 1 Table of Contents Obtain Grating Spectra from HETG/ACIS S Data CIAO 3.4 Data Preparation
PACS Spectrometer Simulation and the Extended to Point Correction
 PACS Spectrometer Simulation and the Extended to Point Correction Jeroen de Jong February 11, 2016 Abstract This technical note describes simulating a PACS observation with a model source and its application
MOS CCD NOISE. Andy Read. Tao Song, Steve Sembay, Tony Abbey
 MOS CCD NOISE Andy Read Tao Song, Steve Sembay, Tony Abbey Noise in MOS CCDs Low energy plateau (
Spectroscopy techniques II. Danny Steeghs
 Spectroscopy techniques II Danny Steeghs Conducting long-slit spectroscopy Science goals must come first, what are the resolution and S/N requirements? Is there a restriction on exposure time? Decide on
SPICE User s Guide. SPitzer IRS Custom Extractor. Spitzer Heritage Archive Documentation. SPICE GUI version
 SPitzer IRS Custom Extractor Spitzer Heritage Archive Documentation SPICE GUI version 2.3.1+ Contents Chapter 1. Introduction... 4 1.1 Important Documentation...4 1.2 Getting Started...5 1.3 IRS Pipeline
The STScI STIS Pipeline VII: Extraction of 1-D Spectra
 STIS Instrument Science Report 97-02 The STScI STIS Pipeline VII: Extraction of 1-D Spectra Steve Hulbert, Phil Hodge, and Ivo Busko February 1997 ABSTRACT This report discusses the extraction of 1-D spectra
Status of PSF Reconstruction at Lick
 Status of PSF Reconstruction at Lick Mike Fitzgerald Workshop on AO PSF Reconstruction May 10-12, 2004 Quick Outline Recap Lick AO system's features Reconstruction approach Implementation issues Calibration
The Italian LBT spectroscopic data reduction pipeline
 LBTO 2017 Users' Meeting The Italian LBT spectroscopic data reduction pipeline Alida Marchetti INAF-IASF Milano Firenze, June 20th-23rd reduction pipeline SOME NUMBERS INAF nights 46 Effective observing
Weighting ARFs and RMFs: multiple sources
 Weighting ARFs and RMFs: multiple sources CIAO 3.4 Science Threads Weighting ARFs and RMFs: multiple sources 1 Table of Contents Weighting ARFs and RMFs: multiple sources CIAO 3.4 Get Started CALDB 3.3.0.1
Using the ACIS "Blank Sky" Background Files
 Using the ACIS "Blank Sky" Background Files CIAO 3.4 Science Threads Using the ACIS "Blank Sky" Background Files 1 Table of Contents Get Started Download the background files Download the scripts Finding
CIAO Quick Start. Abbreviated CIAO threads to get started with the most common Chandra data reduction tasks.
 CIAO Quick Start Abbreviated CIAO threads to get started with the most common Chandra data reduction tasks. I want to... install CIAO Goto http://cxc.cfa.harvard.edu/ciao/download Select Standard Install
Progress Report. Ian Evans On behalf of the Chandra Source Catalog Project Team. Chandra Users Committee Meeting October 22, 2013
 Progress Report Ian Evans On behalf of the Chandra Source Catalog Project Team Chandra Users Committee Meeting October 22, 2013 Current Catalog Release Summary Current catalog version: 1.1; Released: 2010
Overview of LFI maps generation and their characteristics
 Overview of LFI maps generation and their characteristics Davide Maino University of Milano, Dept. of Physics UC Davis, 20 May 2013 Davide Maino Overview of LFI maps generation and their characteristics
Dr. Larry J. Paxton Johns Hopkins University Applied Physics Laboratory Laurel, MD (301) (301) fax
 (301) fax") Dr. Larry J. Paxton Johns Hopkins University Applied Physics Laboratory Laurel, MD 20723 (301) 953-6871 (301) 953-6670 fax Understand the instrument. Be able to convert measured counts/pixel on-orbit into
Dr. Larry J. Paxton Johns Hopkins University Applied Physics Laboratory Laurel, MD 20723 (301) 953-6871 (301) 953-6670 fax Understand the instrument. Be able to convert measured counts/pixel on-orbit into
JWST Pipeline & Data Products
 JWST Pipeline & Data Products Stage 1: Ramps-to-Slopes Karl D. Gordon JWST Calibration WG Lead Space Telescope Sci. Inst. Baltimore, MD, USA Stage 2: Calibrated Slopes Stage 3: Ensemble Processing 18 May
Astrosat Project Soft X-Ray Telescope (SXT)
") Astrosat Project Soft X-Ray Telescope (SXT) Standard Operating Procedure AS1SXTLevel2-1.0 Software Prepared by TIFR SXT Team 4 December 2015 Department of Astrophysics & Astronomy Tata Institute of Fundamental
Astrosat Project Soft X-Ray Telescope (SXT) Standard Operating Procedure AS1SXTLevel2-1.0 Software Prepared by TIFR SXT Team 4 December 2015 Department of Astrophysics & Astronomy Tata Institute of Fundamental
Analysis of Extended Sources
 Analysis of Extended Sources Michael Wise 1 Analysis of Extended Sources 5th Chandra/CIAO Workshop, 29-31 October 2003 2 Online documentation http://cxc.harvard.edu/ciao/guides/esa.html Background subtraction
Description of NOMAD Observation Types and HDF5 Datasets NOT YET COMPLETE
 NOMAD Science Team KONINKLIJK BELGISCH INSTITUUT VOOR RUIMTE-AERONOMIE INSTITUT ROYAL D AERONOMIE SPATIALE DE BELGIQUE ROYAL BELGIAN INSTITUTE OF SPACE AERONOMY KONINKLIJK BELGISCH INSTITUUT VOOR RUIMTE-AERONOMIE
region June 20, 2018 Abstract Creates source/background region definition files for extraction of products from event lists.
 operationstyle= single : in this mode, the task constructs just two regions: a source region and a local-background region, both for the same single source. The source region is XMM-Newton Science Analysis
JWST Pipeline & Data Products
 JWST Pipeline & Data Products Stage 1: Ramps-to-Slopes Karl D. Gordon JWST Calibration WG Lead Space Telescope Sci. Inst. Baltimore, MD, USA Stage 2: Calibrated Slopes Stage 3: Ensemble Processing Star
Progress Report. Ian Evans On behalf of the Chandra Source Catalog Project Team. Chandra Users Committee Meeting October 25, 2010
 Progress Report Ian Evans On behalf of the Chandra Source Catalog Project Team Chandra Users Committee Meeting October 25, 2010 Executive Summary Summary Catalog version 1.1 was released on 2010 Aug 10
XRT Data Analysis I E. Troja (NASA/GSFC/ORAU)
") XRT Data Analysis I E. Troja (NASA/GSFC/ORAU) with thanks to Kim Page (U. Leicester) 1 Introduction to XRT Basic steps: Outline - XRT data processing (from Level 1 to Level 3) - create images, light curves
XRT Data Analysis I E. Troja (NASA/GSFC/ORAU) with thanks to Kim Page (U. Leicester) 1 Introduction to XRT Basic steps: Outline - XRT data processing (from Level 1 to Level 3) - create images, light curves
Slide 1. Technical Aspects of Quality Control in Magnetic Resonance Imaging. Slide 2. Annual Compliance Testing. of MRI Systems.
 Slide 1 Technical Aspects of Quality Control in Magnetic Resonance Imaging Slide 2 Compliance Testing of MRI Systems, Ph.D. Department of Radiology Henry Ford Hospital, Detroit, MI Slide 3 Compliance Testing
Document Number: SC2/FTS/SOF/020
 SCUBA-2 FTS Project Office University of Lethbridge Physics Department 4401 University Drive Lethbridge, Alberta CANADA T1K 3M4 Tel: 1-403-329-2771 Fax: 1-403-329-2057 Email: brad.gom@uleth.ca WWW: http://research.uleth.ca/scuba2/
Southern African Large Telescope. PFIS Distortion and Alignment Model
 Southern African Large Telescope PFIS Distortion and Alignment Model Kenneth Nordsieck University of Wisconsin Document Number: SALT-3120AS0023 Revision 2.0 31 May 2006 Change History Rev Date Description
Diffuse Source Absolute Sensitivity and Point Source Relative Sensitivity as a Function of Extraction Slit Height for STIS First-Order Modes
 Instrument Science Report STIS 98-01 Diffuse Source Absolute Sensitivity and Point Source Relative Sensitivity as a Function of Extraction Slit Height for STIS First-Order Modes Ralph Bohlin, Space Telescope
esac PACS Spectrometer: forward model tool for science use
 esac European Space Astronomy Centre (ESAC) P.O. Box, 78 28691 Villanueva de la Cañada, Madrid Spain PACS Spectrometer: forward model tool for science use Prepared by Elena Puga Reference HERSCHEL-HSC-TN-2131
Ahelp: tgdetect CIAO 3.4. Jump to: Description Examples Parameters CHANGES IN CIAO 3.3 Bugs See Also
 Ahelp: tgdetect CIAO 3.4 URL: http://cxc.harvard.edu/ciao3.4/tgdetect.html Last modified: December 2006 AHELP for CIAO 3.4 tgdetect Context: tools Jump to: Description Examples Parameters CHANGES IN CIAO
simx: A General-Purpose X-ray Event Simulator Randall Smith
 simx: A General-Purpose X-ray Event Simulator Randall Smith Download simx from http://hea-www.harvard.edu/simx Install via: (requires c compiler) unix% tar -zxf simx-2.4.2.tar.gz unix% cd simx-2.4.2 unix%./configure
CS267 Homework 1: Fast Matrix Multiply
 CS267 Homework 1: Fast Matrix Multiply S Woo X, Simon Scott April 18, 2012 1 Introduction The VEGAS HPC uses three shared memory data buffers, one between each of the data processing threads. There is
SSW, Radio, X-ray, and data analysis
 SSW, Radio, X-ray, and data analysis Eduard Kontar School of Physics and Astronomy University of Glasgow, UK CESRA Summer School, Glasgow, August 2015 SSW Pre-school installation guide for IDL, SSW and
OSKAR Settings Files Revision: 8
 OSKAR Settings Files Version history: Revision Date Modification 1 212-4-23 Creation. 2 212-5-8 Added default value column to settings tables. 3 212-6-13 Updated settings for version 2..2-beta. 4 212-7-27
Current Status of the Blank Field Templates for the PN Timing Mode
 Current Status of the Blank Field Templates for the PN Timing Mode Benjamin Mück 1 M. Guainazzi 2, E. Kendziorra 1, C. Tenzer 1 1 Institute for Astronomy and Astrophysics & Kepler Center for Astro and
Fast pattern recognition with the ATLAS L1Track trigger for the HL-LHC
 Fast pattern recognition with the ATLAS L1Track trigger for the HL-LHC On behalf of the ATLAS Collaboration Uppsala Universitet E-mail: mikael.martensson@cern.ch ATL-DAQ-PROC-2016-034 09/01/2017 A fast
1 Overview. MEMORANDUM November 4, 2015
 MIT Kavli Institute Chandra X-Ray Center MEMORANDUM November 4, 2015 To: File From: David P. Huenemoerder, Glenn E. Allen Subject: Description of enhancements to HETG/ACIS CC-mode processing Revision:
IRS Large Offset Test
 IRS Large Offset Test The IRS Large Offset Test (ILOT) was conceived as a simple test of the pointing accuracy during the long gyro-based offsets available to observers utilizing the SPOT Cluster Target
CRISM (Compact Reconnaissance Imaging Spectrometer for Mars) on MRO. Calibration Upgrade, version 2 to 3
 on MRO. Calibration Upgrade, version 2 to 3") CRISM (Compact Reconnaissance Imaging Spectrometer for Mars) on MRO Calibration Upgrade, version 2 to 3 Dave Humm Applied Physics Laboratory, Laurel, MD 20723 18 March 2012 1 Calibration Overview 2 Simplified
CRISM (Compact Reconnaissance Imaging Spectrometer for Mars) on MRO Calibration Upgrade, version 2 to 3 Dave Humm Applied Physics Laboratory, Laurel, MD 20723 18 March 2012 1 Calibration Overview 2 Simplified
Euclid Mission Database
 Euclid Mission Database Roland D. Vavrek ESA / European Space Astronomy Centre 2016 Euclid Photometric Calibration Workshop Euclid Mission Database (MDB) Based on the Gaia Parameter Database design Centralized,
FIFI-LS: Basic Cube Analysis using SOSPEX
 FIFI-LS: Basic Cube Analysis using SOSPEX Date: 1 Oct 2018 Revision: - CONTENTS 1 INTRODUCTION... 1 2 INGREDIENTS... 1 3 INSPECTING THE CUBE... 3 4 COMPARING TO A REFERENCE IMAGE... 5 5 REFERENCE VELOCITY
Introduction and Scripts. Jonathan McDowell Chandra X-ray Center, SAO
 Introduction and Scripts Jonathan McDowell Chandra X-ray Center, SAO 2014 Nov CXC Scope Caveat: will cover ACIS imaging data only Basics the same for HRC and gratings, but with extra wrinkles Introduction
PACS Products Explained
 PACS Products Explained Katrina Exter Zoltan Balog Issue User. Version 1.0 --> Mar 2015 PACS Products Explained Katrina Exter Zoltan Balog Build 13.0.5130 Build 13.0.5130 Table of Contents 1. Introduction...
Instytut Fizyki Doświadczalnej Wydział Matematyki, Fizyki i Informatyki UNIWERSYTET GDAŃSKI
 Instytut Fizyki Doświadczalnej Wydział Matematyki, Fizyki i Informatyki UNIWERSYTET GDAŃSKI I. Background theory. 1. Characteristics of the apparatus: prismatic, grating, interferometers. 2. Operating
Specifications: tgfindzo Algorithm and Interface
 MIT Kavli Institute Chandra X-Ray Center Specifications: tgfindzo Algorithm and Interface David Huenemoerder December 13, 2011 Revision History 1. 2011.12.13 version 1.0; corrections from JC; and more
Color and Shading. Color. Shapiro and Stockman, Chapter 6. Color and Machine Vision. Color and Perception
 Color and Shading Color Shapiro and Stockman, Chapter 6 Color is an important factor for for human perception for object and material identification, even time of day. Color perception depends upon both
ChaRT. Margarita Karovska. and the ChaRT Team CXC. 5 th Chandra/CIAO Workshop, October 2003
 1 ChaRT and the ChaRT Team I. ChaRT Overview 2 ChaRT (Chandra Ray Tracer) is a user friendly web interface that allows the user to simulate High Resolution Mirror Assembly (HRMA) Point Spread Functions
Gamma spectroscopic measurements using the PID350 pixelated CdTe radiation detector
 Gamma spectroscopic measurements using the PID350 pixelated CdTe radiation detector K. Karafasoulis, K. Zachariadou, S. Seferlis, I. Papadakis, D. Loukas, C. Lambropoulos, C. Potiriadis Abstract Spectroscopic
AO-PSF reconstruction for Shack-Hartmann AO systems
 AO-PSF reconstruction for Shack-Hartmann AO systems Application to Altair Gemini-North AO system 1st Victoria Workshop on AO-PSF reconstruction Veran s method - summary Algorithm... WFS measurements covariances
Working with M 3 Data. Jeff Nettles M 3 Data Tutorial at AGU December 13, 2010
 Working with M 3 Data Jeff Nettles M 3 Data Tutorial at AGU December 13, 2010 For Reference Slides and example data from today s workshop available at http://m3dataquest.jpl.nasa.gov See Green et al. (2010)
Introduction to Raman spectroscopy measurement data processing using Igor Pro
 Introduction to Raman spectroscopy measurement data processing using Igor Pro This introduction is intended to minimally guide beginners to processing Raman spectroscopy measurement data, which includes
Visualization & the CASA Viewer
 Visualization & the Viewer Juergen Ott & the team Atacama Large Millimeter/submillimeter Array Expanded Very Large Array Robert C. Byrd Green Bank Telescope Very Long Baseline Array Visualization Goals:
AIA Data processing and Distribution: from Telemetry to Science data
 AIA Data processing and Distribution: from Telemetry to Science data AIA and HMI impose novel requirements on the data processing and distribution. The volume of data places constraints on the frequency
Merging Data from Multiple Imaging Observations
 Merging Data from Multiple Imaging Observations CIAO 3.4 Science Threads Merging Data from Multiple Imaging Observations 1 Table of Contents Merging Data from Multiple Imaging Observations CIAO 3.4 Getting
ESO SCIENCE DATA PRODUCTS STANDARD. Doc. No. GEN-SPE-ESO , Issue 5. Addendum. Date: 15/07/2015. Integral Field Spectroscopy: 3D Data Cubes
 ESO SCIENCE DATA PRODUCTS STANDARD Doc. No. GEN-SPE-ESO-33000-5335, Issue 5 Addendum Date: 15/07/2015 Integral Field Spectroscopy: 3D Data Cubes The data format being defined in this section applies to
PACS. Considerations for PACS Mapping. Herschel. PACS Mapping Page 1. Babar Ali,David Frayer,Pierre Chanial
 PACS Mapping Page 1 Considerations for PACS Mapping Babar Ali,David Frayer,Pierre Chanial PACS Mapping Page 2 Req. I Mapping considerations for PACS data reduction pipelines I - A. History Version Date
SPIcam: an overview. Alan Diercks Institute for Systems Biology 23rd July 2002
 SPIcam: an overview Alan Diercks Institute for Systems Biology diercks@systemsbiology.org 23rd July 2002 1 Outline Overview of instrument CCDs mechanics instrument control performance construction anecdotes
Continuation Format Page
 C.1 PET with submillimeter spatial resolution Figure 2 shows two views of the high resolution PET experimental setup used to acquire preliminary data [92]. The mechanics of the proposed system are similar
Navigator. The Navigator
 TM002-02-A Introduction to WiRE and System start-up Navigator The Navigator Enables control of what data is open and where it is viewed Windows Measurement - Viewers and data housed together (different
Event reconstruction in STAR
 Chapter 4 Event reconstruction in STAR 4.1 Data aquisition and trigger The STAR data aquisition system (DAQ) [54] receives the input from multiple detectors at different readout rates. The typical recorded
Create a PSF CIAO 3.4 Science Threads
 Create a PSF CIAO 3.4 Science Threads Create a PSF 1 Table of Contents Create a PSF CIAO 3.4 The PSF Libraries Get Started Characterizing the Source What is the energy of the source? (dmextract) How far
PACS Data Reduction Guide: Spectroscopy. Issue user Version 15.0 March 2017
 PACS Data Reduction Guide: Spectroscopy Issue user Version 15.0 March 2017 PACS Data Reduction Guide: Spectroscopy Table of Contents 1. PACS Spectroscopy Launch Pad I... 1 1.1. Introduction... 1 1.1.1.
WSDC Subsystem Peer Review
 WSDC Subsystem Peer Review Multiband DETector () Ken Marsh (IPAC/Caltech) 1 Outline Relationship of to other WSDS pipeline modules Why multiband? Theoretical basis Procedure - Steps involved - Allowance
ADC Figure of Merit. Introduction:
 ADC Figure of Merit Introduction: The improved performance LRIS in spectroscopic mode with the ADC (over the no-adc case) has many factors. Concentrating solely on spectral throughput, those factors that
zap Documentation Release 1.0.dev86 Kurt Soto
 zap Documentation Release 1.0.dev86 Kurt Soto February 03, 2016 Contents 1 Installation 3 1.1 Requirements............................................... 3 1.2 Steps...................................................
AKARI FTS Toolkit Manual
 Version 1 (May 13, 2008) 1 AKARI FTS Toolkit Manual Version 1 Hidenori Takahashi 1, Yoko Okada 2, Akiko Yasuda 2, Hiroshi Matsuo 3, Mitsunobu Kawada 4, Noriko Murakami 5, and Chris Pearson 6,7 1 Gunma
GONG Hα Instrument. J. Harvey & GONG Team
 GONG Hα Instrument J. Harvey & GONG Team Outline Overview Optical design Hα Filter Camera Mechanical Remaining issues September 22, 2009 GONG H-alpha Review 2 Instrument Design Goals No significant impact
Astrosat Project Soft X-Ray Telescope (SXT)
") Astrosat Project Soft X-Ray Telescope (SXT) SXT-SOFTWARE-SXTFLAGPIX TIFR Team Sanket Kotak Ashutosh Bajpai Kallol Mukerjee April 29, 2016 Department of Astrophysics & Astronomy Tata Institute of Fundamental
Astrosat Project Soft X-Ray Telescope (SXT) SXT-SOFTWARE-SXTFLAGPIX TIFR Team Sanket Kotak Ashutosh Bajpai Kallol Mukerjee April 29, 2016 Department of Astrophysics & Astronomy Tata Institute of Fundamental
CrIS Full Spectral Resolution SDR and S-NPP/JPSS-1 CrIS Performance Status
 CrIS Full Spectral Resolution SDR and S-NPP/JPSS-1 CrIS Performance Status Yong Han NOAA Center for Satellite Applications and Research, College Park, MD, USA and CrIS SDR Science Team ITSC-0 October 7
TMSEEG Tutorial. Version 4.0. This tutorial was written by: Sravya Atluri and Matthew Frehlich. Contact:
 TMSEEG Tutorial Version 4.0 This tutorial was written by: Sravya Atluri and Matthew Frehlich Contact: faranak.farzan@sfu.ca For more detail, please see the Method article describing the TMSEEG Toolbox:
XMM Extract. 10 October 2013
 XMM Extract 10 October 2013 Contents Change log... 2 Description... 3 Main features... 3 Preparing the data... 4 Event files... 4 The index file... 5 A first run... 7 More control over what it does...
Geometric Transformations
 Geometric Transformations CS 4620 Lecture 9 2017 Steve Marschner 1 A little quick math background Notation for sets, functions, mappings Linear and affine transformations Matrices Matrix-vector multiplication
L. Pina, A. Fojtik, R. Havlikova, A. Jancarek, S.Palinek, M. Vrbova
 L. Pina, A. Fojtik, R. Havlikova, A. Jancarek, S.Palinek, M. Vrbova Faculty of Nuclear Sciences, Czech Technical University, Brehova 7, 115 19 Prague, Czech Republic CD EXPERIMENTAL ARRANGEMENT SPECTRAL
Model FP-6500 Spectrofluorometer Instruction Manual. FP-6500 for Windows
 Model FP-6500 Spectrofluorometer Instruction Manual FP-6500 for Windows P/N: 0302-9999 April 2000 Contents Safety Considerations...i Regulatory Statements... iii Preface... iv Installation Conditions...v
ENMAP RADIOMETRIC INFLIGHT CALIBRATION
 ENMAP RADIOMETRIC INFLIGHT CALIBRATION Harald Krawczyk 1, Birgit Gerasch 1, Thomas Walzel 1, Tobias Storch 1, Rupert Müller 1, Bernhard Sang 2, Christian Chlebek 3 1 Earth Observation Center (EOC), German
PN treatment in ESAS - SAS validation - Calibration files and Configuration Control
 PN treatment in E - validation - Calibration files and Configuration Control Carlos GABRIEL Science Operations Centre / ESA development overall structure development team: Central team (@ ESA s SOC) =
Living Image Software
 Living Image Software User s Manual Version 3.1 2002-2008 Xenogen Corporation. All rights reserved. PN 124908 Xenogen Corporation 68 Elm Street Hopkinton, MA 01748 USA 1.877.522.2447 (US) 1.508.435.9500
Suomi NPP CrIS Reprocessed SDR Long-term Accuracy and Stability
 Suomi NPP CrIS Reprocessed SDR Long-term Accuracy and Stability Yong Chen 1, Yong Han, Likun Wang 1, Fuzhong Weng, Ninghai Sun, and Wanchun Chen 1 CICS-MD, ESSIC, University of Maryland, College Park,