Algorithms for GIS csci3225
|
|
|
- Winifred Gibson
- 6 years ago
- Views:
Transcription
1 Algorithms for GIS csci3225 Laura Toma Bowdoin College
2 Spatial data types and models
3 Spatial data in GIS satellite imagery planar maps surfaces networks point cloud (LiDAR)
4 Spatial data in GIS satellite imagery planar maps surfaces How to represent it? networks point cloud (LiDAR)
 Useful for continuous data (ie data that varies continuously) such as satellite imagery, aerial photographs, surface functions such as elevation, pollution, population")
5 Vector model Data is represented using points, lines and polygons Useful for data that has discrete boundaries, such as streets, maps, rivers Raster model Data is represented as a surface modeled by a matrix of values (pixels) Useful for continuous data (ie data that varies continuously) such as satellite imagery, aerial photographs, surface functions such as elevation, pollution, population

6
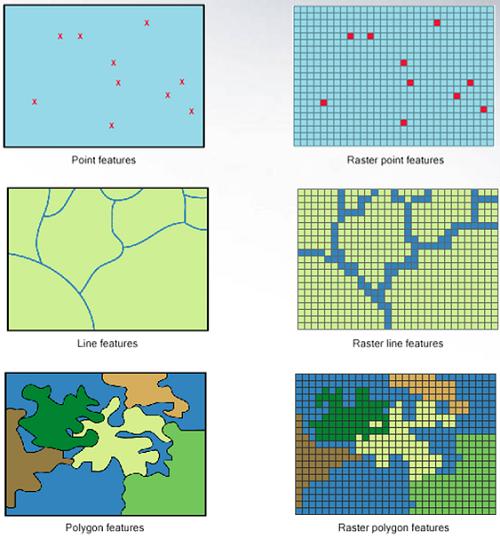
7 Both models can be used for all data
8 Both models can be used for all data

9 World is often modeled as a collection of vector and raster layers streets, parcels, boundaries usually as vector elevation, land usage usually as raster
10 Spatial data in GIS satellite imagery planar maps surfaces RASTER VECTOR RASTER or VECTOR networks point cloud (LiDAR) VECTOR RASTER
11 VECTOR Data structures for networks
12 Data structures for networks? How about this: list of points, each point stores its coordinates list of segments, each segment stores pointers to its vertices points (xa, ya) (xb, yb) (xc, yc) (xd, yd) a segments b (0,1) (1,2) (2,3) c d What if you wanted to traverse a path starting at point 0? search through the segment list looking for a segment that starts from a; you find (0,1) search through the segment list looking for another segment from 1; you find (1,2)
 (0,1)")
13 Data structures for networks? How about this: list of points, each point stores its coordinates list of segments, each segment stores pointers to its vertices 0 points segments 1 (xa, ya) (0,1) 3 2 (xb, yb) (1,2) (xc, yc) (xd, yd) (2,3) d b c a Spaghetti data structure (like spaghetti, no structure, messy, inefficient eating)
14 Data structures for networks Need a topological data structure that allows to traverse paths efficiently Wait, a network is a graph! Use adjacency list points adj list (xa, ya) (xb, yb) (xc, yc) (xd, yd) (0,1) (1,0) (2,1) (3,2) (1,2) (2,3) a b c d In practice, this adjacency list needs to be built From raw data
15 Exercise Assume you download US road data. It comes as a file that has the following format - first the number of vertices and the number of edges - then all the vertices and their geometric coordinates - then all edges, where an edge is given through the indices of its vertices. Sketch how you would build an adjacency list from it. Analyze function of V vertices and E edges. 4 3 (1.1, 2.3) (3.4, 2.1) (2.6, 1.8) (1.4,8.2) (0,1) (1,2) (2,3)
16 Spatial data in GIS satellite imagery surfaces planar maps RASTER networks VECTOR VECTOR RASTER or VECTOR point cloud (LiDAR) RASTER

17 Data structures for surfaces


18 Surfaces can have different topologies
 The Earth is round, and its surface has the topology of a 2D")
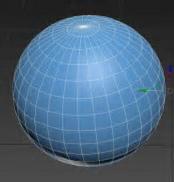
19 Surfaces in GIS GIS deals with the surface of the Earth (or Mars, or ) The Earth is round, and its surface has the topology of a 2D sphere
, there is a unique z(x,y) Put differently, a terrain is a surface in 3D such that any vertical line intersects it in at most one point")
20 Terrains A terrain is a function of two variables, z(x,y). Meaning that, for a given (x,y), there is a unique z(x,y) Put differently, a terrain is a surface in 3D such that any vertical line intersects it in at most one point (xy-monotone) surface of Mars
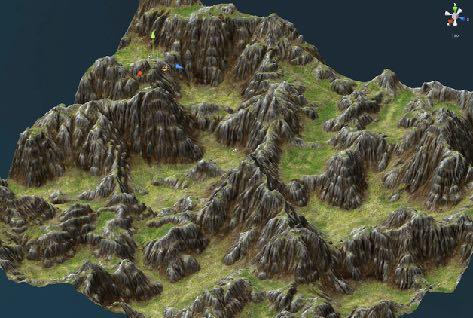
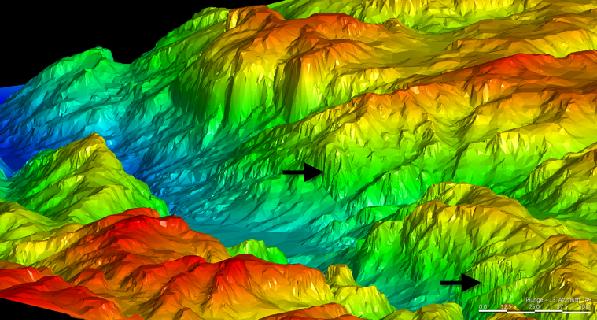
21 Terrains

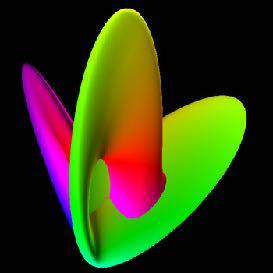
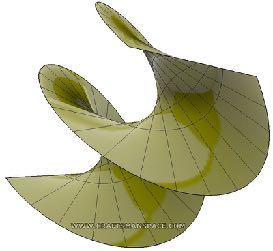
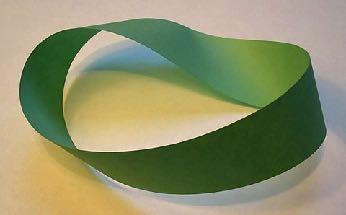
22 Not terrains
 = population_at(x,y) http://www.thecartofish.com/blog/wp-content/uploads/2014/12/windpopraster.")
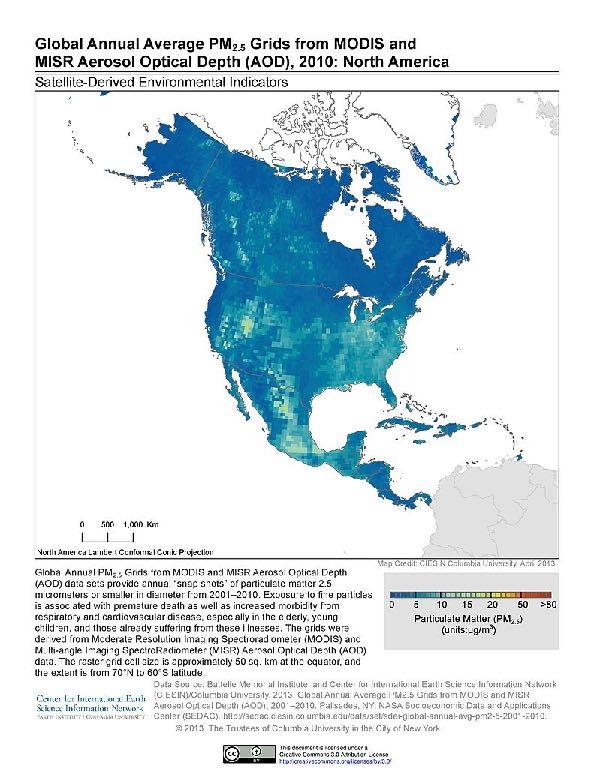
23 Terrains Most often terrains represent elevation, but they can also represent other Earth surface functions like rainfall, population, solar radiation, Population surface: z(x,y) = population_at(x,y)
24
} and")

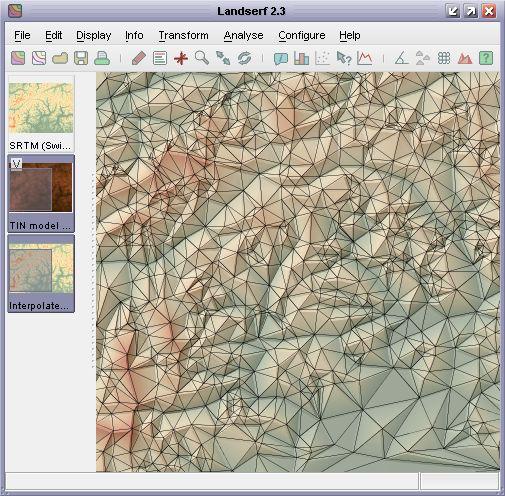
25 Modeling terrains: Digital terrain models In practice, terrain data comes as a set of sample points {(x,y)} and their sampled z-values A digital terrain model = sample points + interpolation method + data structure? pictures from Herman Haverkort

26 With DTM we can do terrain modeling
27 Digital terrain models Rasters TINs (vector) images from Herman Haverkort

28 Terrain as a raster (grid) A raster terrain is a matrix of (elevation) values Samples uniform grid Data structure matrix Interpolation method nearest neighbor, linear, bilinear, splines, krigging, IDW, etc
29 Grids with nearest neighbor interpolation? 20 27
30 Grids with nearest neighbor interpolation? 20
31 Grids with nearest neighbor interpolation 20
32 Linear interpolation?


33 Linear interpolation Terrain: mesh of triangles on grid points

34 Raster with nearest neighbor vs linear interpolation

35 Grids in practice Grid elevation data can be obtained from aerial imagery image = raster SAR interferometry: by combining Synthetic Aperture Radar (SAR) images of the same area it is possible to go from color to elevation maps Massive amounts of aerial imagery available Grid elevation data from LiDAR point clouds point cloud (LiDAR)
36 Grids in practice Elevation data sources GTOPO dataset whole Earth at 1km resolution SRTM 90m elevation data for entire world can download tiles anywhere in the world SRTM 30m data available for the entire USA (50+GB) Recently, elevation from LiDAR point clouds below 2m resolution Huge! Grids available in a variety of formats
37 Grid arc-ascii format ncols 391 nrows 472 xllcorner yllcorner cellsize 30 NODATA_value
38 Exercise Consider an area of 300km-by-300km to be represented as a raster (grid) at: A. 100m resolution B. 10m resolution C. 1m resolution How big (how many points) is the grid in each case? Answer:
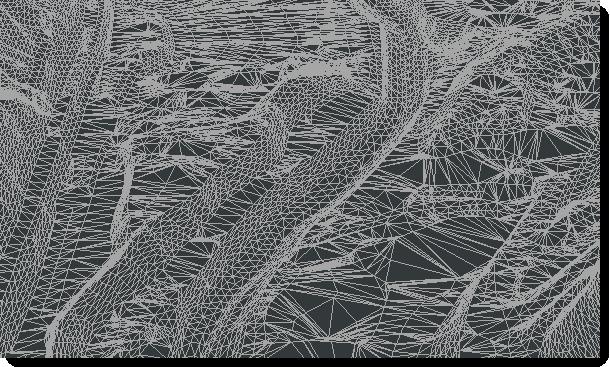
39 Terrain as a TIN (triangulated irregular network) Samples points arbitrarily distributed, variable resolution Interpolation method linear Data structure need a topological structure for triangular meshes

40 Why TINs? uniform resolution = waste on flat areas variable resolution ==> fewer points

41
42
43
44 Topological data structures for TINs The 2D projection of a triangulated terrain is a triangulation. A TIN is equivalent to a planar triangulation, except points have heights
 A good data structure for TINs should do all these fast find all edges and all")
45 Topological data structures for TINs What do we expect to do on a TIN? walk along an edge/triangle path The 2D projection of a triangulated terrain is a triangulation. given an edge, find the two faces that are adjacent to this edge walk along the boundary of a face (triangle) A good data structure for TINs should do all these fast find all edges and all triangles incident to a point
 every vertex stores: its coordinates every edge stores: every triangles stores: 2 references to its adjacent vertices 2 references to its adjacent triangles every triangle stores:")
46 Topological data structures for TINs Edge-based arrays of vertices, edges and triangles every vertex stores: its coordinates geometry Triangle-based arrays of vertices and triangles (edges are not stored explicitly) every vertex stores: its coordinates every edge stores: every triangles stores: 2 references to its adjacent vertices 2 references to its adjacent triangles every triangle stores: topology 3 references to its incident vertices 3 references to its adjacent triangles 3 references to its 3 edge Note: CGAL uses triangle-based These are simplified versions of more general structures for arbitrary meshes which we might study later (the half-edge and quad-edge data structures)
47 Data structures for TINs edge-based triangle-based
48 Data structures for TINs edge-based triangle-based Analysis? Is one better than other? Storing topology: equivalent Memory:??
49 Data structures for TINs How much memory does a topological structure for a TIN need? A. edge-based B. triangle-based Denote n = number of points in the TIN e = number of edges f = number of triangles (faces) There is a formula that connects e, f and n.
50 Detour through planar graphs and Euler characteristic
51 Let P be a set of points in the plane. A triangulation is a partition of the plane into regions such that all regions are triangles. one possible triangulation of P
52 planar graph A triangulation is a graph: V = the points, E = the edges
53 Planar graphs A graph is called planar if it can be drawn in the plane such that no two edges intersect except at their endpoints. Such a drawing is called a planar embedding of the graph. Example: V = {a,b,c,d}, E = {(a,b), (a,c), (a,d), (b,c), (c,d), (d,a)} Drawing the graph in the plane is called embedding. Let s come up with different embeddings of the graph.
54 Planar graphs A graph is called planar if it can be drawn in the plane such that no two edges intersect except at their endpoints. Such a drawing is called a planar embedding of the graph. Two drawings of the same graph. Since there exists a planar embedding, the graph is planar.
55 Planar graphs A graph is called planar if it can be drawn in the plane such that no two edges intersect except at their endpoints. Such a drawing is called a planar embedding of the graph. Note: Edges can be represented as simple curves in the drawing
56 Planar graphs A planar graph introduces a subdivision of the plane into regions called faces, which are polygons bounded by the graph s edges. planar graph triangulation All faces (except the outside face) are triangles
![Euler formula [Euler] The following relation exists between the number of edges, vertices and faces in a connected](/docs-images/71/65532613/images/57-0.jpg "planar graph: v - e + f = 2.")
57 Euler formula [Euler] The following relation exists between the number of edges, vertices and faces in a connected planar graph: v - e + f = 2. Figure thanks to Wikipedia The 7 bridges of Konisberg problem Euler, November 14, 1750
58
![Euler formula [Euler] The following relation exists between the number of edges, vertices and faces in a connected planar graph: v - e + f = 2.](/docs-images/71/65532613/images/59-0.jpg "Notes: For c connected components: v - e + f - c =1 v - e + f= 2 also true for any convex polyhedral surface in 3D v - e + f is called the Euler characteristic, X X is an invariant that describes the")
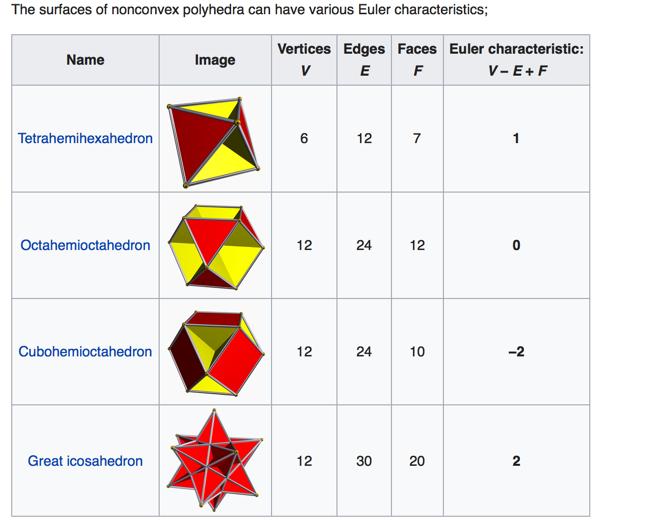
59 Euler formula [Euler] The following relation exists between the number of edges, vertices and faces in a connected planar graph: v - e + f = 2. Notes: For c connected components: v - e + f - c =1 v - e + f= 2 also true for any convex polyhedral surface in 3D v - e + f is called the Euler characteristic, X X is an invariant that describes the shape of space it is X=2 for planar graphs and convex polyhedra can be extended to other topological spaces
60
61 From Euler formula to size of triangulations TIN: n = nb of points e = nb. edges f = nb faces A triangulation is a planar graph, so n-e+f = 2 [Euler] Furthermore, each triangle has 3 edges and each edge is in precisely 2 triangles (assuming the outside face is a triangle). This means 3f = 2e. We get: the number of faces in a triangulation with n vertices is f = 2n-4 the number of edges in a triangulation with n vertices is e = 3n-6 If the outside face is not triangulated it can be shown that e < 3n-6, f < 2n-4 Intuition: Given n points, the planar graph with largest number of edges and faces is a complete triangulation. Theorem: A triangulation with n vertices has at most 3n-6 edges and at most 2n-4 faces.
62 Known results Any planar graph has a planar straight-line drawing where edges do not intersect [Fary s theorem]. A graph is planar iff it has no subgraphs isomorphic with K5 or K3,3 [Kuratowski s theorem]. K5 K3,3 Any planar graph ==> has a dual graph. A graph is planar <== it has a (well-defined) dual graph. Any planar graph has at least one vertex of degree <= 5. Computationally: There are a number of efficient algorithms for planarity testing that run in o(n 3 ), but are difficult to implement.
63 End Detour
64 Data structures for TINs The problem: How much memory do we need to store a TIN into a topological structure? edge-based triangle-based Denote n = number of points in the TIN e = number of edges f = number of triangles (faces) Answer: We ll use that: a triangulation with n vertices has e <= 3n-6 and f <= 2n-4
65 Grid or TIN? Grid Pros: implicit topology implicit geometry TIN Pros: variable resolution space efficient (potentially) simple algorithms readily available in this form Cons: uniform resolution ==> space waste space becomes prohibitive as resolution increases Cons: need to built the TIN (grid > TIN) stored topology takes space more complex programming (pointers..);
66 Grid or TIN? We have an elevation grid for an area of 300km-by-300km at 1m resolution. The elevation values are represented as floating point numbers (4B). A. How much space does the grid use (in GB)? B. Assume the grid undergoes a process of simplification, so that 90% of the grid points are eliminated, leaving 10% of the points. These points are represented as a TIN with a topological edgebased structure. How much space does the TIN use (in GB)? Answer:
67 Grid-to-tin simplification
68 Summary Data models: raster and vector Networks Terrains rasters TINs Topological structures for TINs Planarity Euler formula V-E+F=2 A triangulation is a planar graph, and e < 3n and f < 2n Grid or TIN?
Algorithms for GIS. Spatial data: Models and representation (part I) Laura Toma. Bowdoin College
 Laura Toma. Bowdoin College") Algorithms for GIS Spatial data: Models and representation (part I) Laura Toma Bowdoin College Outline Spatial data in GIS applications Point data Networks Terrains Planar maps and meshes Data structures
Algorithms for GIS Spatial data: Models and representation (part I) Laura Toma Bowdoin College Outline Spatial data in GIS applications Point data Networks Terrains Planar maps and meshes Data structures
Flow on terrains. Laura Toma csci 3225 Algorithms for GIS Bowdoin College
 Flow on terrains Laura Toma csci 3225 Algorithms for GIS Bowdoin College Overview Flow on grids (discrete) flow direction flow accumulation algorithms for FD and FA dealing with flat areas watershed hierarchy
SPATIAL DATA MODELS Introduction to GIS Winter 2015
 SPATIAL DATA MODELS Introduction to GIS Winter 2015 GIS Data Organization The basics Data can be organized in a variety of ways Spatial location, content (attributes), frequency of use Come up with a system
Algorithms for GIS: Terrain simplification
 Algorithms for GIS: Terrain simplification Digital terrain models in GIS grid (raster) TIN Data Sources: digitizing contour maps Data Sources: satellite imagery Data Sources: satellite imagery \ Data Sources:
Representing Geography
 Data models and axioms Chapters 3 and 7 Representing Geography Road map Representing the real world Conceptual models: objects vs fields Implementation models: vector vs raster Vector topological model
Algorithms for GIS csci3225
 Algorithms for GIS csci3225 Laura Toma Bowdoin College LiDAR data in GIS LiDAR (Light Detection and Ranging) Each point records: its geographic location x,y its height z the number of returns in its pulse
Voronoi Diagrams in the Plane. Chapter 5 of O Rourke text Chapter 7 and 9 of course text
 Voronoi Diagrams in the Plane Chapter 5 of O Rourke text Chapter 7 and 9 of course text Voronoi Diagrams As important as convex hulls Captures the neighborhood (proximity) information of geometric objects
Algorithms for GIS csci3225
 Algorithms for GIS csci3225 Laura Toma Bowdoin College Flow on digital terrain models (I) Flow Where does the water go when it rains? Flooding: What are the areas susceptible to flooding? Sea level rise:
Lecture 6: GIS Spatial Analysis. GE 118: INTRODUCTION TO GIS Engr. Meriam M. Santillan Caraga State University
 Lecture 6: GIS Spatial Analysis GE 118: INTRODUCTION TO GIS Engr. Meriam M. Santillan Caraga State University 1 Spatial Data It can be most simply defined as information that describes the distribution
INTRODUCTION TO GRAPH THEORY. 1. Definitions
 INTRODUCTION TO GRAPH THEORY D. JAKOBSON 1. Definitions A graph G consists of vertices {v 1, v 2,..., v n } and edges {e 1, e 2,..., e m } connecting pairs of vertices. An edge e = (uv) is incident with
17/07/2013 RASTER DATA STRUCTURE GIS LECTURE 4 GIS DATA MODELS AND STRUCTURES RASTER DATA MODEL& STRUCTURE TIN- TRIANGULAR IRREGULAR NETWORK
 RASTER DATA STRUCTURE GIS LECTURE 4 GIS DATA MODELS AND STRUCTURES Space is subdivided into regular grids of square grid cells or other forms of polygonal meshes known as picture elements (pixels) the
Class #2. Data Models: maps as models of reality, geographical and attribute measurement & vector and raster (and other) data structures
 data structures") Class #2 Data Models: maps as models of reality, geographical and attribute measurement & vector and raster (and other) data structures Role of a Data Model Levels of Data Model Abstraction GIS as Digital
Class #2 Data Models: maps as models of reality, geographical and attribute measurement & vector and raster (and other) data structures Role of a Data Model Levels of Data Model Abstraction GIS as Digital
Data Representation in Visualisation
 Data Representation in Visualisation Visualisation Lecture 4 Taku Komura Institute for Perception, Action & Behaviour School of Informatics Taku Komura Data Representation 1 Data Representation We have
Outline. Visualization Discretization Sampling Quantization Representation Continuous Discrete. Noise
 Fundamentals Data Outline Visualization Discretization Sampling Quantization Representation Continuous Discrete Noise 2 Data Data : Function dependent on one or more variables. Example Audio (1D) - depends
Maps as Numbers: Data Models
 Maps as Numbers: Data Models vertices E Reality S E S arcs S E Conceptual Models nodes E Logical Models S Start node E End node S Physical Models 1 The Task An accurate, registered, digital map that can
Discrete Wiskunde II. Lecture 6: Planar Graphs
 , 2009 Lecture 6: Planar Graphs University of Twente m.uetz@utwente.nl wwwhome.math.utwente.nl/~uetzm/dw/ Planar Graphs Given an undirected graph (or multigraph) G = (V, E). A planar embedding of G is
Computational Geometry [csci 3250]
![Computational Geometry [csci 3250]](/thumbs/93/112686747.jpg "Computational Geometry [csci 3250]") Computational Geometry [csci 3250] Laura Toma Bowdoin College Polygon Triangulation Polygon Triangulation The problem: Triangulate a given polygon. (output a set of diagonals that partition the polygon
Computational Geometry [csci 3250] Laura Toma Bowdoin College Polygon Triangulation Polygon Triangulation The problem: Triangulate a given polygon. (output a set of diagonals that partition the polygon
Computer Database Structure for Managing Data :-
 The Map as an Abstraction of Space :- We begin the process of abstraction by conceptualizing what we encounter as a group of points, lines, areas and surfaces. We make decision about which object to take
LAMC Advanced Circle October 9, Oleg Gleizer. Warm-up
 LAMC Advanced Circle October 9, 2016 Oleg Gleizer prof1140g@math.ucla.edu Warm-up Problem 1 Prove that a straight line tangent to a circle is perpendicular to the radius connecting the tangency point to
Week 9: Planar and non-planar graphs. 7 and 9 November, 2018
 (1/27) MA284 : Discrete Mathematics Week 9: Planar and non-planar graphs http://www.maths.nuigalway.ie/ niall/ma284/ 7 and 9 November, 2018 1 Planar graphs and Euler s formula 2 Non-planar graphs K 5 K
Lecture 4: Digital Elevation Models
 Lecture 4: Digital Elevation Models GEOG413/613 Dr. Anthony Jjumba 1 Digital Terrain Modeling Terms: DEM, DTM, DTEM, DSM, DHM not synonyms. The concepts they illustrate are different Digital Terrain Modeling
Understanding Geospatial Data Models
 Understanding Geospatial Data Models 1 A geospatial data model is a formal means of representing spatially referenced information. It is a simplified view of physical entities and a conceptualization of
Spatial Data Models. Raster uses individual cells in a matrix, or grid, format to represent real world entities
 Spatial Data Models Raster uses individual cells in a matrix, or grid, format to represent real world entities Vector uses coordinates to store the shape of spatial data objects David Tenenbaum GEOG 7
Contents of Lecture. Surface (Terrain) Data Models. Terrain Surface Representation. Sampling in Surface Model DEM
 Data Models. Terrain Surface Representation. Sampling in Surface Model DEM") Lecture 13: Advanced Data Models: Terrain mapping and Analysis Contents of Lecture Surface Data Models DEM GRID Model TIN Model Visibility Analysis Geography 373 Spring, 2006 Changjoo Kim 11/29/2006 1
Lecture 13: Advanced Data Models: Terrain mapping and Analysis Contents of Lecture Surface Data Models DEM GRID Model TIN Model Visibility Analysis Geography 373 Spring, 2006 Changjoo Kim 11/29/2006 1
DATA MODELS IN GIS. Prachi Misra Sahoo I.A.S.R.I., New Delhi
 DATA MODELS IN GIS Prachi Misra Sahoo I.A.S.R.I., New Delhi -110012 1. Introduction GIS depicts the real world through models involving geometry, attributes, relations, and data quality. Here the realization
Planar Graphs. 1 Graphs and maps. 1.1 Planarity and duality
 Planar Graphs In the first half of this book, we consider mostly planar graphs and their geometric representations, mostly in the plane. We start with a survey of basic results on planar graphs. This chapter
CS 2336 Discrete Mathematics
 CS 2336 Discrete Mathematics Lecture 15 Graphs: Planar Graphs 1 Outline What is a Planar Graph? Euler Planar Formula Platonic Solids Five Color Theorem Kuratowski s Theorem 2 What is a Planar Graph? Definition
CS 532: 3D Computer Vision 14 th Set of Notes
 1 CS 532: 3D Computer Vision 14 th Set of Notes Instructor: Philippos Mordohai Webpage: www.cs.stevens.edu/~mordohai E-mail: Philippos.Mordohai@stevens.edu Office: Lieb 215 Lecture Outline Triangulating
Polygon Triangulation
 Polygon Triangulation The problem: Triangulate a given polygon. (output a set of diagonals that partition the polygon into triangles). Computational Geometry [csci 3250] Polygon Triangulation Laura Toma
Week 9: Planar and non-planar graphs. 1st and 3rd of November, 2017
 (1/26) MA284 : Discrete Mathematics Week 9: Planar and non-planar graphs http://www.maths.nuigalway.ie/~niall/ma284/ 1st and 3rd of November, 2017 1 Recall... planar graphs and Euler s formula 2 Non-planar
Finding Shortest Path on Land Surface
 Finding Shortest Path on Land Surface Lian Liu, Raymond Chi-Wing Wong Hong Kong University of Science and Technology June 14th, 211 Introduction Land Surface Land surfaces are modeled as terrains A terrain
Improved Visibility Computation on Massive Grid Terrains
 Improved Visibility Computation on Massive Grid Terrains Jeremy Fishman Herman Haverkort Laura Toma Bowdoin College USA Eindhoven University The Netherlands Bowdoin College USA Laura Toma ACM GIS 2009
TERRAIN, DINOSAURS AND CADASTRES: OPTIONS FOR THREE-DIMENSIONAL MODELING
 TERRAIN, DINOSAURS AND CADASTRES: OPTIONS FOR THREE-DIMENSIONAL MODELING REBECCA O.C. TSE AND CHRISTOPHER GOLD Hong Kong Polytechnic University Department of Land Surveying and Geo-Informatics Hong Kong
The Computational Geometry Algorithms Library. Andreas Fabri GeometryFactory
 The Computational Geometry Algorithms Library Andreas Fabri GeometryFactory Mission Statement Make the large body of geometric algorithms developed in the field of computational geometry available for
CS Object Representation. Aditi Majumder, CS 112 Slide 1
 CS 112 - Object Representation Aditi Majumder, CS 112 Slide 1 What is Graphics? Modeling Computer representation of the 3D world Analysis For efficient rendering For catering the model to different applications..
Review of Cartographic Data Types and Data Models
 Review of Cartographic Data Types and Data Models GIS Data Models Raster Versus Vector in GIS Analysis Fundamental element used to represent spatial features: Raster: pixel or grid cell. Vector: x,y coordinate
Scalar Field Visualization. Some slices used by Prof. Mike Bailey
 Scalar Field Visualization Some slices used by Prof. Mike Bailey Scalar Fields The approximation of certain scalar function in space f(x,y,z). Most of time, they come in as some scalar values defined on
Advanced Data Types and New Applications
 Advanced Data Types and New Applications These slides are a modified version of the slides of the book Database System Concepts (Chapter 24), 5th Ed., McGraw-Hill, by Silberschatz, Korth and Sudarshan.
3D Modeling Parametric Curves & Surfaces
 3D Modeling Parametric Curves & Surfaces Shandong University Spring 2012 3D Object Representations Raw data Point cloud Range image Polygon soup Solids Voxels BSP tree CSG Sweep Surfaces Mesh Subdivision
Planarity: dual graphs
 : dual graphs Math 104, Graph Theory March 28, 2013 : dual graphs Duality Definition Given a plane graph G, the dual graph G is the plane graph whose vtcs are the faces of G. The correspondence between
Algorithms for GIS:! Quadtrees
 Algorithms for GIS: Quadtrees Quadtree A data structure that corresponds to a hierarchical subdivision of the plane Start with a square (containing inside input data) Divide into 4 equal squares (quadrants)
HW Graph Theory Name (andrewid) - X. 1: Draw K 7 on a torus with no edge crossings.
 - X. 1: Draw K 7 on a torus with no edge crossings.") 1: Draw K 7 on a torus with no edge crossings. A quick calculation reveals that an embedding of K 7 on the torus is a -cell embedding. At that point, it is hard to go wrong if you start drawing C 3 faces,
1: Draw K 7 on a torus with no edge crossings. A quick calculation reveals that an embedding of K 7 on the torus is a -cell embedding. At that point, it is hard to go wrong if you start drawing C 3 faces,
Lecture 4: Bipartite graphs and planarity
 Lecture 4: Bipartite graphs and planarity Anders Johansson 2011-10-22 lör Outline Bipartite graphs A graph G is bipartite with bipartition V1, V2 if V = V1 V2 and all edges ij E has one end in V1 and V2.
1. a graph G = (V (G), E(G)) consists of a set V (G) of vertices, and a set E(G) of edges (edges are pairs of elements of V (G))
, E(G)) consists of a set V (G) of vertices, and a set E(G) of edges (edges are pairs of elements of V (G))") 10 Graphs 10.1 Graphs and Graph Models 1. a graph G = (V (G), E(G)) consists of a set V (G) of vertices, and a set E(G) of edges (edges are pairs of elements of V (G)) 2. an edge is present, say e = {u,
10 Graphs 10.1 Graphs and Graph Models 1. a graph G = (V (G), E(G)) consists of a set V (G) of vertices, and a set E(G) of edges (edges are pairs of elements of V (G)) 2. an edge is present, say e = {u,
v Working with Rasters SMS 12.1 Tutorial Requirements Raster Module Map Module Mesh Module Time minutes Prerequisites Overview Tutorial
 v. 12.1 SMS 12.1 Tutorial Objectives This tutorial teaches how to import a Raster, view elevations at individual points, change display options for multiple views of the data, show the 2D profile plots,
GEOMETRIC SEARCHING PART 1: POINT LOCATION
 GEOMETRIC SEARCHING PART 1: POINT LOCATION PETR FELKEL FEL CTU PRAGUE felkel@fel.cvut.cz https://cw.felk.cvut.cz/doku.php/courses/a4m39vg/start Based on [Berg] and [Mount] Version from 3.10.2014 Geometric
Planar Graph (7A) Young Won Lim 5/21/18
 Young Won Lim 5/21/18") Planar Graph (7A) Copyright (c) 2015 2018 Young W. Lim. Permission is granted to copy, distribute and/or modify this document under the terms of the GNU Free Documentation License, Version 1.2 or any later
Planar Graph (7A) Copyright (c) 2015 2018 Young W. Lim. Permission is granted to copy, distribute and/or modify this document under the terms of the GNU Free Documentation License, Version 1.2 or any later
Lecture 06. Raster and Vector Data Models. Part (1) Common Data Models. Raster. Vector. Points. Points. ( x,y ) Area. Area Line.
 Common Data Models. Raster. Vector. Points. Points. ( x,y ) Area. Area Line.") Lecture 06 Raster and Vector Data Models Part (1) 1 Common Data Models Vector Raster Y Points Points ( x,y ) Line Area Line Area 2 X 1 3 Raster uses a grid cell structure Vector is more like a drawn map
Lecture 06 Raster and Vector Data Models Part (1) 1 Common Data Models Vector Raster Y Points Points ( x,y ) Line Area Line Area 2 X 1 3 Raster uses a grid cell structure Vector is more like a drawn map
LECTURE 2 SPATIAL DATA MODELS
 LECTURE 2 SPATIAL DATA MODELS Computers and GIS cannot directly be applied to the real world: a data gathering step comes first. Digital computers operate in numbers and characters held internally as binary
layers in a raster model
 layers in a raster model Layer 1 Layer 2 layers in an vector-based model (1) Layer 2 Layer 1 layers in an vector-based model (2) raster versus vector data model Raster model Vector model Simple data structure
2D rendering takes a photo of the 2D scene with a virtual camera that selects an axis aligned rectangle from the scene. The photograph is placed into
 2D rendering takes a photo of the 2D scene with a virtual camera that selects an axis aligned rectangle from the scene. The photograph is placed into the viewport of the current application window. A pixel
Subdivision Of Triangular Terrain Mesh Breckon, Chenney, Hobbs, Hoppe, Watts
 Subdivision Of Triangular Terrain Mesh Breckon, Chenney, Hobbs, Hoppe, Watts MSc Computer Games and Entertainment Maths & Graphics II 2013 Lecturer(s): FFL (with Gareth Edwards) Fractal Terrain Based on
Matching and Planarity
 Matching and Planarity Po-Shen Loh June 010 1 Warm-up 1. (Bondy 1.5.9.) There are n points in the plane such that every pair of points has distance 1. Show that there are at most n (unordered) pairs of
Advanced Data Types and New Applications
 Advanced Data Types and New Applications These slides are a modified version of the slides of the book Database System Concepts (Chapter 24), 5th Ed., McGraw-Hill, by Silberschatz, Korth and Sudarshan.
GRAPHS, GRAPH MODELS, GRAPH TERMINOLOGY, AND SPECIAL TYPES OF GRAPHS
 GRAPHS, GRAPH MODELS, GRAPH TERMINOLOGY, AND SPECIAL TYPES OF GRAPHS DR. ANDREW SCHWARTZ, PH.D. 10.1 Graphs and Graph Models (1) A graph G = (V, E) consists of V, a nonempty set of vertices (or nodes)
Dijkstra's Algorithm
 Shortest Path Algorithm Dijkstra's Algorithm To find the shortest path from the origin node to the destination node No matrix calculation Floyd s Algorithm To find all the shortest paths from the nodes
M. Andrea Rodríguez-Tastets. I Semester 2008
 M. -Tastets Universidad de Concepción,Chile andrea@udec.cl I Semester 2008 Outline refers to data with a location on the Earth s surface. Examples Census data Administrative boundaries of a country, state
3D Modeling Parametric Curves & Surfaces. Shandong University Spring 2013
 3D Modeling Parametric Curves & Surfaces Shandong University Spring 2013 3D Object Representations Raw data Point cloud Range image Polygon soup Surfaces Mesh Subdivision Parametric Implicit Solids Voxels
Planarity. 1 Introduction. 2 Topological Results
 Planarity 1 Introduction A notion of drawing a graph in the plane has led to some of the most deep results in graph theory. Vaguely speaking by a drawing or embedding of a graph G in the plane we mean
Purpose: To explore the raster grid and vector map element concepts in GIS.
 GIS INTRODUCTION TO RASTER GRIDS AND VECTOR MAP ELEMENTS c:wou:nssi:vecrasex.wpd Purpose: To explore the raster grid and vector map element concepts in GIS. PART A. RASTER GRID NETWORKS Task A- Examine
Marching Squares Algorithm. Can you summarize the marching squares algorithm based on what we just discussed?
 Marching Squares Algorithm Can you summarize the marching squares algorithm based on what we just discussed? Marching Squares Algorithm Can you summarize the marching squares algorithm based on what we
Section 1-1 Points, Lines, and Planes
 Section 1-1 Points, Lines, and Planes I CAN. Identify and model points, lines, and planes. Identify collinear and coplanar points and intersecting lines and planes in space. Undefined Term- Words, usually
Line segment intersection. Family of intersection problems
 CG Lecture 2 Line segment intersection Intersecting two line segments Line sweep algorithm Convex polygon intersection Boolean operations on polygons Subdivision overlay algorithm 1 Family of intersection
Saab. Kyle McDonald. Polygon Meshes
 Saab Kyle McDonald Polygon Meshes Siddhartha Chaudhuri http://www.cse.iitb.ac.in/~cs749 What is a polygon mesh? Like a point cloud, it is a discrete sampling of a surface... but, it adds linear (flat)
Planar Graph (7A) Young Won Lim 6/20/18
 Young Won Lim 6/20/18") Planar Graph (7A) Copyright (c) 2015 2018 Young W. Lim. Permission is granted to copy, distribute and/or modify this document under the terms of the GNU Free Documentation License, Version 1.2 or any later
Planar Graph (7A) Copyright (c) 2015 2018 Young W. Lim. Permission is granted to copy, distribute and/or modify this document under the terms of the GNU Free Documentation License, Version 1.2 or any later
Symmetric Product Graphs
 Rochester Institute of Technology RIT Scholar Works Theses Thesis/Dissertation Collections 5-20-2015 Symmetric Product Graphs Evan Witz Follow this and additional works at: http://scholarworks.rit.edu/theses
Level of Details in Computer Rendering
 Level of Details in Computer Rendering Ariel Shamir Overview 1. Photo realism vs. Non photo realism (NPR) 2. Objects representations 3. Level of details Photo Realism Vs. Non Pixar Demonstrations Sketching,
Maps as Numbers: Data Models
 Maps as Numbers: Data Models vertices nodes tart node nd node arcs Reality Conceptual Models The Task An accurate, registered, digital map that can be queried and analyzed Translate: Real World Locations,
Chapter 12 and 11.1 Planar graphs, regular polyhedra, and graph colorings
 Chapter 12 and 11.1 Planar graphs, regular polyhedra, and graph colorings Prof. Tesler Math 184A Fall 2017 Prof. Tesler Ch. 12: Planar Graphs Math 184A / Fall 2017 1 / 45 12.1 12.2. Planar graphs Definition
Basic Combinatorics. Math 40210, Section 01 Fall Homework 4 Solutions
 Basic Combinatorics Math 40210, Section 01 Fall 2012 Homework 4 Solutions 1.4.2 2: One possible implementation: Start with abcgfjiea From edge cd build, using previously unmarked edges: cdhlponminjkghc
COMP30019 Graphics and Interaction Scan Converting Polygons and Lines
 COMP30019 Graphics and Interaction Scan Converting Polygons and Lines Department of Computer Science and Software Engineering The Lecture outline Introduction Scan conversion Scan-line algorithm Edge coherence
Ma/CS 6b Class 11: Kuratowski and Coloring
 Ma/CS 6b Class 11: Kuratowski and Coloring By Adam Sheffer Kuratowski's Theorem Theorem. A graph is planar if and only if it does not have K 5 and K 3,3 as topological minors. We know that if a graph contains
3D convex hulls. Computational Geometry [csci 3250] Laura Toma Bowdoin College
![3D convex hulls. Computational Geometry [csci 3250] Laura Toma Bowdoin College](/thumbs/75/72944672.jpg "3D convex hulls. Computational Geometry [csci 3250] Laura Toma Bowdoin College") 3D convex hulls Computational Geometry [csci 3250] Laura Toma Bowdoin College Convex Hull in 3D The problem: Given a set P of points in 3D, compute their convex hull convex polyhedron 2D 3D polygon
3D convex hulls Computational Geometry [csci 3250] Laura Toma Bowdoin College Convex Hull in 3D The problem: Given a set P of points in 3D, compute their convex hull convex polyhedron 2D 3D polygon
Discrete Mathematics I So Practice Sheet Solutions 1
 Discrete Mathematics I So 2016 Tibor Szabó Shagnik Das Practice Sheet Solutions 1 Provided below are possible solutions to the questions from the practice sheet issued towards the end of the course. Exercise
Math 443/543 Graph Theory Notes 5: Planar graphs and coloring
 Math 443/543 Graph Theory Notes 5: Planar graphs and coloring David Glickenstein October 10, 2014 1 Planar graphs The Three Houses and Three Utilities Problem: Given three houses and three utilities, can
K-structure, Separating Chain, Gap Tree, and Layered DAG
 K-structure, Separating Chain, Gap Tree, and Layered DAG Presented by Dave Tahmoush Overview Improvement on Gap Tree and K-structure Faster point location Encompasses Separating Chain Better storage Designed
v Importing Rasters SMS 11.2 Tutorial Requirements Raster Module Map Module Mesh Module Time minutes Prerequisites Overview Tutorial
 v. 11.2 SMS 11.2 Tutorial Objectives This tutorial teaches how to import a Raster, view elevations at individual points, change display options for multiple views of the data, show the 2D profile plots,
CS 311 Discrete Math for Computer Science Dr. William C. Bulko. Graphs
 CS 311 Discrete Math for Computer Science Dr. William C. Bulko Graphs 2014 Definitions Definition: A graph G = (V,E) consists of a nonempty set V of vertices (or nodes) and a set E of edges. Each edge
Mesh Basics: Definitions, Topology & Data Structures. Standard Graph Definitions
 Mesh : Definitions, Topology & Data Structures 1 Standard Graph Definitions G = V = vertices = {A,B,C,D,E,F,G,H,I,J,K,L} E = edges = {(A,B),(B,C),(C,D),(D,E),(E,F),(F,G), (G,H),(H,A),(A,J),(A,G),(B,J),(K,F),
MA 323 Geometric Modelling Course Notes: Day 36 Subdivision Surfaces
 MA 323 Geometric Modelling Course Notes: Day 36 Subdivision Surfaces David L. Finn Today, we continue our discussion of subdivision surfaces, by first looking in more detail at the midpoint method and
5. THE ISOPERIMETRIC PROBLEM
 Math 501 - Differential Geometry Herman Gluck March 1, 2012 5. THE ISOPERIMETRIC PROBLEM Theorem. Let C be a simple closed curve in the plane with length L and bounding a region of area A. Then L 2 4 A,
An Introduction to Geometric Modeling using Polygonal Meshes
 An Introduction to Geometric Modeling using Polygonal Meshes Joaquim Madeira Version 0.2 October 2014 U. Aveiro, October 2014 1 Main topics CG and affine areas Geometric Modeling Polygonal meshes Exact
TWO CONTRIBUTIONS OF EULER
 TWO CONTRIBUTIONS OF EULER SIEMION FAJTLOWICZ. MATH 4315 Eulerian Tours. Although some mathematical problems which now can be thought of as graph-theoretical, go back to the times of Euclid, the invention
CS 177 Homework 1. Julian Panetta. October 22, We want to show for any polygonal disk consisting of vertex set V, edge set E, and face set F:
 CS 177 Homework 1 Julian Panetta October, 009 1 Euler Characteristic 1.1 Polyhedral Formula We want to show for any polygonal disk consisting of vertex set V, edge set E, and face set F: V E + F = 1 First,
Lecture 2: GIS Data Sources, Data Types and Representation. GE 118: INTRODUCTION TO GIS Engr. Meriam M. Santillan Caraga State University
 Lecture 2: GIS Data Sources, Data Types and Representation GE 118: INTRODUCTION TO GIS Engr. Meriam M. Santillan Caraga State University Geographic Data in GIS Can be obtained from various sources in different
Rendering. Converting a 3D scene to a 2D image. Camera. Light. Rendering. View Plane
 Rendering Pipeline Rendering Converting a 3D scene to a 2D image Rendering Light Camera 3D Model View Plane Rendering Converting a 3D scene to a 2D image Basic rendering tasks: Modeling: creating the world
Jordan Curves. A curve is a subset of IR 2 of the form
 Jordan Curves A curve is a subset of IR 2 of the form α = {γ(x) : x [0,1]}, where γ : [0,1] IR 2 is a continuous mapping from the closed interval [0,1] to the plane. γ(0) and γ(1) are called the endpoints
Image Morphing. The user is responsible for defining correspondences between features Very popular technique. since Michael Jackson s clips
 Image Morphing Image Morphing Image Morphing Image Morphing The user is responsible for defining correspondences between features Very popular technique since Michael Jackson s clips Morphing Coordinate
Graph Theory. 1 Introduction to Graphs. Martin Stynes Department of Mathematics, UCC January 26, 2011
 Graph Theory Martin Stynes Department of Mathematics, UCC email: m.stynes@ucc.ie January 26, 2011 1 Introduction to Graphs 1 A graph G = (V, E) is a non-empty set of nodes or vertices V and a (possibly
1 Appendix to notes 2, on Hyperbolic geometry:
 1230, notes 3 1 Appendix to notes 2, on Hyperbolic geometry: The axioms of hyperbolic geometry are axioms 1-4 of Euclid, plus an alternative to axiom 5: Axiom 5-h: Given a line l and a point p not on l,
Computergrafik. Matthias Zwicker Universität Bern Herbst 2016
 Computergrafik Matthias Zwicker Universität Bern Herbst 2016 Today Curves NURBS Surfaces Parametric surfaces Bilinear patch Bicubic Bézier patch Advanced surface modeling 2 Piecewise Bézier curves Each
Graph and Digraph Glossary
 1 of 15 31.1.2004 14:45 Graph and Digraph Glossary A B C D E F G H I-J K L M N O P-Q R S T U V W-Z Acyclic Graph A graph is acyclic if it contains no cycles. Adjacency Matrix A 0-1 square matrix whose
Outline of Presentation. Introduction to Overwatch Geospatial Software Feature Analyst and LIDAR Analyst Software
 Outline of Presentation Automated Feature Extraction from Terrestrial and Airborne LIDAR Presented By: Stuart Blundell Overwatch Geospatial - VLS Ops Co-Author: David W. Opitz Overwatch Geospatial - VLS
7) Are HD and HA the same line?
 Are HD and HA the same line?") Review for Exam 2 Math 123 SHORT ANSWER. You must show all work to receive full credit. Refer to the figure to classify the statement as true or false. 7) Are HD and HA the same line? Yes 8) What is the
Review for Exam 2 Math 123 SHORT ANSWER. You must show all work to receive full credit. Refer to the figure to classify the statement as true or false. 7) Are HD and HA the same line? Yes 8) What is the
pine cone Ratio = 13:8 or 8:5
 Chapter 10: Introducing Geometry 10.1 Basic Ideas of Geometry Geometry is everywhere o Road signs o Carpentry o Architecture o Interior design o Advertising o Art o Science Understanding and appreciating
Lecture 21 - Chapter 8 (Raster Analysis, part2)
") GEOL 452/552 - GIS for Geoscientists I Lecture 21 - Chapter 8 (Raster Analysis, part2) Today: Digital Elevation Models (DEMs), Topographic functions (surface analysis): slope, aspect hillshade, viewshed,
GEOL 452/552 - GIS for Geoscientists I Lecture 21 - Chapter 8 (Raster Analysis, part2) Today: Digital Elevation Models (DEMs), Topographic functions (surface analysis): slope, aspect hillshade, viewshed,
GRAPH THEORY and APPLICATIONS. Planar Graphs
 GRAPH THEORY and APPLICATIONS Planar Graphs Planar Graph A graph is planar if it can be drawn on a plane surface with no two edges intersecting. G is said to be embedded in the plane. We can extend the
Geometric Modeling Mortenson Chapter 11. Complex Model Construction
 Geometric Modeling 91.580.201 Mortenson Chapter 11 Complex Model Construction Topics Topology of Models Connectivity and other intrinsic properties Graph-Based Models Emphasize topological structure Boolean
Geometric Modeling. Mesh Decimation. Mesh Decimation. Applications. Copyright 2010 Gotsman, Pauly Page 1. Oversampled 3D scan data
 Applications Oversampled 3D scan data ~150k triangles ~80k triangles 2 Copyright 2010 Gotsman, Pauly Page 1 Applications Overtessellation: E.g. iso-surface extraction 3 Applications Multi-resolution hierarchies
Brief History. Graph Theory. What is a graph? Types of graphs Directed graph: a graph that has edges with specific directions
 Brief History Graph Theory What is a graph? It all began in 1736 when Leonhard Euler gave a proof that not all seven bridges over the Pregolya River could all be walked over once and end up where you started.