layers in a raster model
|
|
|
- Avice Lang
- 5 years ago
- Views:
Transcription
1 layers in a raster model Layer 1 Layer 2
2 layers in an vector-based model (1) Layer 2 Layer 1

3 layers in an vector-based model (2)
4 raster versus vector data model Raster model Vector model Simple data structure Easy and efficient overlaying Compatible with Remote Sensing imagery High spatial variability is efficiently represented Simple for programming by user Same grid cell definition for various attributes Inefficient use of computer storage Errors in perimeter and shape Difficult to perform network analysis Inefficient projection transformations Loss of information when using large pixel sizes Less accurate and less appealing map output Complex data structure Difficult to perform overlaying Not compatible with RS imagery Inefficient representation of high spatial variability Compact data structure Efficient encoding of topology Easy to perform network analysis Highly accurate map output
5 Quadtree data structure In this, geographical area is decomposed into four quadrants and the decomposition continues until each quad represents a homogenous unit. The storage requirement of a quadree is much lower than that of a raster having the resolution of the smallest quad element
6 Quadtree data structure In this, geographical area is decomposed into four quadrants and the decomposition continues until each quad represents a homogenous unit. The storage requirement of a quadtree is much lower than that of a raster having the resolution of the smallest quad element
7 THE QUADTREE DATA STRUCTURE WORKS WITH: LEVELS QUADRANTS HOMOGENEOUS AREAS
8
9
10
11
12
13
14
15
16
17
18
19
20 N
21 N
22 N
23 N
24 N

25 N
26 N
27 N
28 N
29 N

30 N
31 N
32 N
33 N
34 Quad trees advantages : - computation of standard region properties is easy - variable resolution and hence less storage requirement disadvantages : - translation invariant (two regions having same size and shape can produce different quadtrees. - cannot split into parts
35 Course Content Introduction to GIS, Definitions of GIS and Overview, History and concepts of GIS, Development of GIS, Scope and application areas Geographical Entities, Attribute data, Linking spatial and attribute data Spatial Data Models, raster vs vector, Raster data Models, Spatial Relationships, GIS Data Analysis, Raster data analysis tools Mapping concepts, Map elements, Map scales and representation, Map projections and coordinate systems Practical and Case Studies Laboratory Sessions: Introduction to Arc GIS, Strength of Arc GIS, Some hands-on session in introducing the ARC GIS environment
36 Feature relationships & Topology There are vast number of possible relationships in spatial data. Relationships are important in GIS analysis. "is contained in" relationship between a point and an area is important in relating objects to their surrounding environment. "intersects" between two lines is important in analyzing routes through networks Relationships can exist between entities of the same type or of different types. for each shopping center, can find the nearest shopping center (same type) for each customer, can find the nearest shopping center (different types)
37 Types of relationship Relationships which are used to construct complex objects from simple primitives. Relationship between a line and the ordered set of points which defines it. Relationship between a polygon and the ordered set of lines which defines it. Relationships which can be computed from the coordinates of the objects. Areas can be examined to see which one encloses a given point - the "is contained in" relationship can be computed. Areas can be examined to see if they overlap - the "overlaps" relationship. Relationships which cannot be computed from coordinates We can compute if two lines cross, but not if the highways they represent intersect (may be an overpass). Objects representing "house", "lot", plot", with associated attributes might be grouped together logically as sellers account.
38 Spatial relationships Point-point "is within", e.g. find all of the customer points within 1 km of this retail store point "is nearest to", e.g. find the hazardous waste site which is nearest to this groundwater well Point-line "ends at", e.g. find the intersection at the end of this street "is nearest to", e.g. find the road nearest to this aircraft crash site Point-area "is contained in", e.g. find all of the customers located in this ZIP code boundary "can be seen from", e.g. determine if any of this lake can be seen from this viewpoint
39 Spatial relationships Line-line "crosses", e.g. determine if this road crosses this river "comes within", e.g. find all of the roads which come within 1 km of this railroad "flows into", e.g. find out if this stream flows into this river Line-area "crosses", e.g. find all of the soil types crossed by this railroad "borders", e.g. find out if this road forms part of the boundary of this airfield Area-area "overlaps", e.g. identify all overlaps between types of soil on this map and types of land use on this other map "is nearest to", e.g. find the nearest lake to this forest fire "is adjacent to", e.g. find out if these two areas share a common boundary
40 Relationships as attributes Example: Flows-in relationship Option A Link ID empty Downstream Each stream link in a stream network could be given the ID of the downstream link which it flows into Flow could be traced from link to link by following pointers Option B Link ID Pointer empty Point ID Pointer Each stream link in a stream network could be given the ID of the downstream point which it flows into Each stream point in a stream network could be given the ID of the downstream link which it flows into Flow could be traced from link to link by following pointers
41 Relationships as attributes Example: is contained in relationship 1. Find the containing county of each well (compute the is contained in relationship). 2. Store the result as a new attribute, County, of each well. 3. Using this revised attribute table, total flow by county and add results to the county table. Well ID County A 001 A 002 B 003 A 004 A County County B County ID A 3 B 1 No. of Wells
42 Object Pairs Some attribute is between a pair of objects. Distance is the attribute of a pair of objects. Flow of commuters between two places. Trade between two counties. In some cases these attributes can be attached to an object linking the origin and destination objects. For example, trade can be attached to an arrow pointing from county A to B. In general, these kind of attributes shall be described using separate tables or matrix. A C B D A B C D A B C D A distance table between points A, B, C, and D

43 Topology Topology is a branch of mathematics that deals with properties of space that remain invariant under certain transformations. Properties : 3 spatial relationships Containment: Polygons can be defined by set of lines enclose them Contiguity: Identification of polygons which touch each other or connect identify contiguous polygons (left or right) Connectivity: Identification of interconnected arcs, starting point & end point of network analysis
44 GIS topology Topology is a mathematics approach that defines unchangeable spatial relationships. When a map is stretched or distorted, some properties change, Distance Angles Relative proximities Some properties won t change, Adjacencies Most other relationships, such as "is contained in", "crosses" Types of spatial objects - areas remain areas, lines remain lines, points remain points These unchanged properties are called topological properties.
45 Topological examples Network connectivity Polygon adjacency Topology poorly-defined Topology well-defined
46 Importance of topology Topology enables operations like connectivity and contiguity analysis. Searching a shortest path Finding a service area by using a road network Finding adjacent areas Topology enables spatial analysis without using a coordinate set, Apply spatial analysis using topological definitions alone Major difference from CAD or computer-aided cartography
47 Topology and GIS analysis Searching a shortest path Finding adjacent areas The shortest path from the blue point to the yellow point is through the red point and then the orange point ( =5.5 map units). However, if the topology of the red point is not defined clearly, which means the two purple lines are consider as one and the two orange lines are considered as one, the resulting answer will be wrong (2+2+2=6 map units). The overlapped two polygons have to be cut into three in order to clearly defined the spatial topology. Otherwise there will be difficulties finding an adjacent polygon of either.

48 Editing coincident features The spatial relationship between two polygon features is distorted when edited incorrectly. The primary purpose of a topology is to define spatial relationships between features. The primary spatial relationships that you can model using topology are adjacency (contiguity), coincidence (containment) and connectivity. When editing features, it's important to maintain the spatial relationships that exist among them. For example, when you edit the shared boundary between two land use features, you don't want to introduce a gap between the two. To prevent editing errors, you can create a topology.
49 Topological Consistency Relations Every line is bounded by two points. For every line there are two adjacent areas (left and right polygon). Every area (polygon) is bounded by a closed cycle of points and lines. Every point is surrounded by a closed cycle of lines and areas. Lines intersect only in points.
50 Topological Invariants Exterior Interior Boundary
51 Topological Relationships Relationships between two regions can be determined based on the intersection of their boundaries and interiors (4-intersection). A B
52 Lines: fundamental spatial data model node vertex vertex node vertex vertex Lines start and end at nodes line #1 goes from node #2 to node #1 Vertices determine shape of line Nodes and vertices are stored as coordinate pairs
53 Polygons: fundamental spatial data model Polygon #2 is bounded by lines 1 & 2 Line 2 has polygon 1 on left and polygon 2 on right
54 Polygons: fundamental spatial data model complex data model, especially for larger data sets arc-node topology, used for ArcInfo data sets or defined by rules in the Geodatabase.
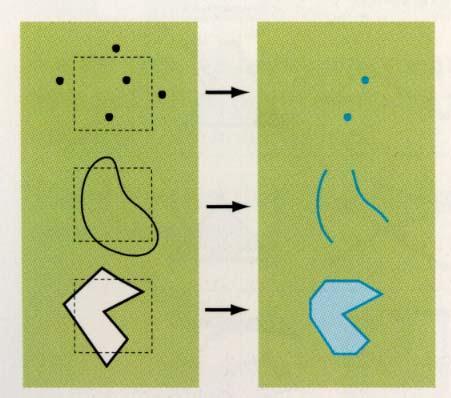
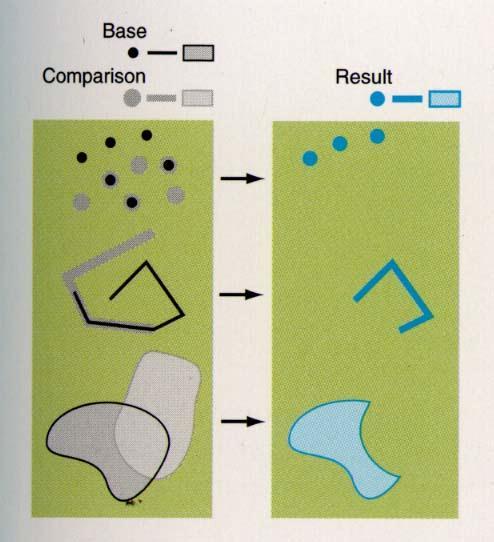
55 Spatial Relationships disjoint covered by meet contains equal covers inside overlap

 Within is one within")

56 Spatial Relationships Between Geometries Boolean operators Adjacency - Intersect Coincidence - Touch Connectivity- Disjointness Equal the same Disjoint contain a common point Intersect cut each other Touch at boundaries Cross overlap (different dimensions) Within is one within another Contain completely within another Overlap (same dimension) Relate are intersections between the interior, boundary, or exterior of boundaries


57 Feature Geometry Geometry and Features Points and Multipoints Polylines Polygons Envelopes


58 Geometry and Features Components of Feature Geometries Rings Segments Paths Attributes of Feature Geometries Vertical measurements with z values Linear measurements with m values


59 Testing Spatial Relationships Equals Contains


60 Testing Spatial Relationships Within Crosses


61 Testing Spatial Relationships Overlaps Disjoint Touches


62 Applying Topological Operators Buffer Clip Convex Hull Cut


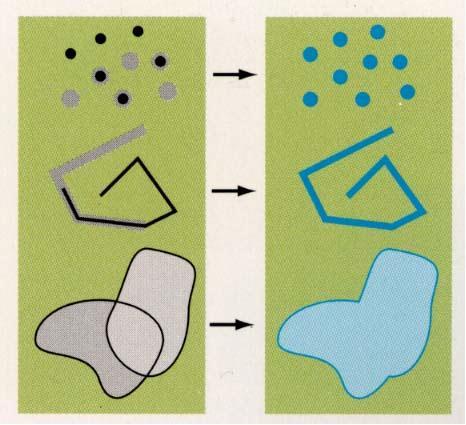
63 Applying Topological Operators Difference Intersect Symmetric Difference Union
64 Define an area where spotted owls have been spotted Convex Hull Create a convex hull for data set the smallest convex polygon that contains the set of points
65 (Raster based) overlay operation tools Arithmetic functions (+, -, *, /) Relational functions (<, >, =) Logical operations (and, or, xor, not) Conditional functions ( if, then, else )
66 Logical functions Boolean operators A AND B = A B intersection A OR B = A B union A XOR B = A B exclusion A NOT B = A B negation
67 Arithmetic operations Map A Map B MapC= MapA + 10 Map C MapC1= MapA + MapB Map C MapC2= ((MapA - MapB)/(MapA + MapB)) *100 Map C
68 Relational functions Map A Map B Output = MAP A > MAP B 1 1 Output = FALSE 1 = TRUE
69 Relational and logical operators F = forest 7 = 700 m 6 = 600 m 4 = 400 m MapD=(MapA= Forest ) and (MapB <500) MapD1=(MapA= Forest ) or (MapB <500) MapD2=(MapA= Forest ) xor (MapB <500) MapD3=(MapA= Forest ) and not (MapB <500) F F F F F F F F F F F F F Map D Map D = false 1 = true Map D Map D
70 Conditional functions Map C F F F F F MapC= iff(mapa= Forest,1,?) ????? F F F? 1 1? 1 F F F?? F F??? MapC1=iff((MapA= Forest ) F = forest 7 = 700 m 6 = 600 m 4 = 400 m and (MapB= 700),1,0) 1 1 Map C = false 1 = true? = undefined


71 Overlaying using and statement Landuse = forest AND Slope = steep
Representing Geography
 Data models and axioms Chapters 3 and 7 Representing Geography Road map Representing the real world Conceptual models: objects vs fields Implementation models: vector vs raster Vector topological model
Topic 5: Raster and Vector Data Models
 Geography 38/42:286 GIS 1 Topic 5: Raster and Vector Data Models Chapters 3 & 4: Chang (Chapter 4: DeMers) 1 The Nature of Geographic Data Most features or phenomena occur as either: discrete entities
DATA MODELS IN GIS. Prachi Misra Sahoo I.A.S.R.I., New Delhi
 DATA MODELS IN GIS Prachi Misra Sahoo I.A.S.R.I., New Delhi -110012 1. Introduction GIS depicts the real world through models involving geometry, attributes, relations, and data quality. Here the realization
Class #2. Data Models: maps as models of reality, geographical and attribute measurement & vector and raster (and other) data structures
 data structures") Class #2 Data Models: maps as models of reality, geographical and attribute measurement & vector and raster (and other) data structures Role of a Data Model Levels of Data Model Abstraction GIS as Digital
Class #2 Data Models: maps as models of reality, geographical and attribute measurement & vector and raster (and other) data structures Role of a Data Model Levels of Data Model Abstraction GIS as Digital
Lecture 8. Vector Data Analyses. Tomislav Sapic GIS Technologist Faculty of Natural Resources Management Lakehead University
 Lecture 8 Vector Data Analyses Tomislav Sapic GIS Technologist Faculty of Natural Resources Management Lakehead University Vector Data Analysis Vector data analysis involves one or a combination of: Measuring
Multidimensional Data and Modelling - DBMS
 Multidimensional Data and Modelling - DBMS 1 DBMS-centric approach Summary: l Spatial data is considered as another type of data beside conventional data in a DBMS. l Enabling advantages of DBMS (data
Spatial Data Models. Raster uses individual cells in a matrix, or grid, format to represent real world entities
 Spatial Data Models Raster uses individual cells in a matrix, or grid, format to represent real world entities Vector uses coordinates to store the shape of spatial data objects David Tenenbaum GEOG 7
Welcome to NR402 GIS Applications in Natural Resources. This course consists of 9 lessons, including Power point presentations, demonstrations,
 Welcome to NR402 GIS Applications in Natural Resources. This course consists of 9 lessons, including Power point presentations, demonstrations, readings, and hands on GIS lab exercises. Following the last
Lecture 6: GIS Spatial Analysis. GE 118: INTRODUCTION TO GIS Engr. Meriam M. Santillan Caraga State University
 Lecture 6: GIS Spatial Analysis GE 118: INTRODUCTION TO GIS Engr. Meriam M. Santillan Caraga State University 1 Spatial Data It can be most simply defined as information that describes the distribution
An Introduction to Spatial Databases
 An Introduction to Spatial Databases R. H. Guting VLDB Journal v3, n4, October 1994 Speaker: Giovanni Conforti Outline: a rather old (but quite complete) survey on Spatial DBMS Introduction & definition
Mid-term exam. GIS and Forest Engineering Applications. Week 5. FE 257. GIS and Forest Engineering Applications. Week 5
 FE 257. GIS and Forest Engineering Applications Week 5 Week 5 Last week (Chapter 3): Acquiring, creating, and editing GIS s Examining Error Chapter 7 Buffering and other proximity operations Questions?
17/07/2013 RASTER DATA STRUCTURE GIS LECTURE 4 GIS DATA MODELS AND STRUCTURES RASTER DATA MODEL& STRUCTURE TIN- TRIANGULAR IRREGULAR NETWORK
 RASTER DATA STRUCTURE GIS LECTURE 4 GIS DATA MODELS AND STRUCTURES Space is subdivided into regular grids of square grid cells or other forms of polygonal meshes known as picture elements (pixels) the
Multidimensional (spatial) Data and Modelling (2)
 Data and Modelling (2)") Multidimensional (spatial) Data and Modelling (2) 1 Representative operations on maps l l l l l are operations on layers used in maps (all 2-d). Synonyms f. map: layer, spatial partition Def. properties:
Multidimensional (spatial) Data and Modelling (2) 1 Representative operations on maps l l l l l are operations on layers used in maps (all 2-d). Synonyms f. map: layer, spatial partition Def. properties:
Introduction to GIS. Introduction to GIS. Content
 1 Introduction to GIS Cees van Westen Dinand Alkema International Institute for Geo-Information Science and Earth Observation (ITC), Enschede, The Netherlands. E-mail: westen@itc.nl Alkema@itc.nl Introduction
Announcements. Data Sources a list of data files and their sources, an example of what I am looking for:
 Data Announcements Data Sources a list of data files and their sources, an example of what I am looking for: Source Map of Bangor MEGIS NG911 road file for Bangor MEGIS Tax maps for Bangor City Hall, may
EAT 233/3 GEOGRAPHIC INFORMATION SYSTEM (GIS)
") EAT 233/3 GEOGRAPHIC INFORMATION SYSTEM (GIS) CO3: Ability to produce detail mapping using geographic information systems (GIS) BY : AYU WAZIRA AZHARI SPATIAL DATA & THE MODELLING Spatial Data in GIS Spatial
EAT 233/3 GEOGRAPHIC INFORMATION SYSTEM (GIS) CO3: Ability to produce detail mapping using geographic information systems (GIS) BY : AYU WAZIRA AZHARI SPATIAL DATA & THE MODELLING Spatial Data in GIS Spatial
SPATIAL DATA MODELS Introduction to GIS Winter 2015
 SPATIAL DATA MODELS Introduction to GIS Winter 2015 GIS Data Organization The basics Data can be organized in a variety of ways Spatial location, content (attributes), frequency of use Come up with a system
Remote Sensing and GIS. GIS Spatial Overlay Analysis
 Subject Paper No and Title Module No and Title Module Tag Geology Remote Sensing and GIS GIS Spatial Overlay Analysis RS & GIS XXXI Principal Investigator Co-Principal Investigator Co-Principal Investigator
GIS Data Models. 4/9/ GIS Data Models
 GIS Data Models 1 Conceptual models of the real world The real world can be described using two conceptually different models: 1. As discrete objects, possible to represent as points, lines or polygons.
Review of Cartographic Data Types and Data Models
 Review of Cartographic Data Types and Data Models GIS Data Models Raster Versus Vector in GIS Analysis Fundamental element used to represent spatial features: Raster: pixel or grid cell. Vector: x,y coordinate
Spatial Analysis 2. Basic operations Béla Márkus
 Spatial Analysis 2. Basic operations Béla Márkus Spatial Analysis 2.: Basic operations Béla Márkus Lector: János Tamás This module was created within TÁMOP - 4.1.2-08/1/A-2009-0027 "Tananyagfejlesztéssel
4.0 DIGITIZATION, EDITING AND STRUCTURING OF MAP DATA
 .0 DIGITIZATION, EDITING AND STRUCTURING OF MAP DATA The process of digitizing existing maps is a transformation from one analog) form of information to another digital) form. Data input is the operation
Spatial Analysis and Modeling (GIST 4302/5302) Guofeng Cao Department of Geosciences Texas Tech University
 Guofeng Cao Department of Geosciences Texas Tech University") Spatial Analysis and Modeling (GIST 4302/5302) Guofeng Cao Department of Geosciences Texas Tech University Outline of Today Last week, we learned: Characteristics of spatial data Types of spatial data
Spatial Analysis and Modeling (GIST 4302/5302) Guofeng Cao Department of Geosciences Texas Tech University Outline of Today Last week, we learned: Characteristics of spatial data Types of spatial data
Name: Date: June 27th, 2011 GIS Boot Camps For Educators Lecture_3
 Name: Date: June 27th, 2011 GIS Boot Camps For Educators Lecture_3 Practical: Creating and Editing Shapefiles Using Straight, AutoComplete and Cut Polygon Tools Use ArcCatalog to copy data files from:
Spatial Data Management
 Spatial Data Management [R&G] Chapter 28 CS432 1 Types of Spatial Data Point Data Points in a multidimensional space E.g., Raster data such as satellite imagery, where each pixel stores a measured value
Spatial Data Management
 Spatial Data Management Chapter 28 Database management Systems, 3ed, R. Ramakrishnan and J. Gehrke 1 Types of Spatial Data Point Data Points in a multidimensional space E.g., Raster data such as satellite
M. Andrea Rodríguez-Tastets. I Semester 2008
 M. -Tastets Universidad de Concepción,Chile andrea@udec.cl I Semester 2008 Outline refers to data with a location on the Earth s surface. Examples Census data Administrative boundaries of a country, state
Spatial Analysis (Vector) I
 I") Spatial Analysis (Vector) I GEOG 300, Lecture 8 Dr. Anthony Jjumba 1 Spatial Analysis In a GIS, Data are usually grouped into layers (or themes). The analysis functions of a GIS use the spatial and non-spatial
Spatial Analysis (Vector) I GEOG 300, Lecture 8 Dr. Anthony Jjumba 1 Spatial Analysis In a GIS, Data are usually grouped into layers (or themes). The analysis functions of a GIS use the spatial and non-spatial
Vector Data. James Frew ESM 263 Winter
 Vector Data 1 Why Vector Data? Recall: features vs fields features: discrete enffes with specific locafons fields: confnuous funcfons of (x, y) Vector is GIS-speak for feature representafons dimensionality:
Thoughts on Representing Spatial Objects. William A. Huber Quantitative Decisions Rosemont, PA
 Thoughts on Representing Spatial Objects William A. Huber Quantitative Decisions Rosemont, PA Overview 1. Some Ways to Structure Space 2. What to Put into a Grid 3. Objects and Fields 4. Hybrid Structures
Solid Modelling. Graphics Systems / Computer Graphics and Interfaces COLLEGE OF ENGINEERING UNIVERSITY OF PORTO
 Solid Modelling Graphics Systems / Computer Graphics and Interfaces 1 Solid Modelling In 2D, one set 2D line segments or curves does not necessarily form a closed area. In 3D, a collection of surfaces
A New Approach for Data Conversion from CAD to GIS
 Esin Bitik (PhD) Dursun Zafer Şeker Ziyadin ÇAKIR Hakan DENLİ A New Approach for Data Conversion from CAD to GIS June 19, 2014 Contents 1. Aim of the study 2. Introduction 3. Vector Data Structure 4. Converting
Determining Differences between Two Sets of Polygons
 Determining Differences between Two Sets of Polygons MATEJ GOMBOŠI, BORUT ŽALIK Institute for Computer Science Faculty of Electrical Engineering and Computer Science, University of Maribor Smetanova 7,
Chapter 3. Sukhwinder Singh
 Chapter 3 Sukhwinder Singh PIXEL ADDRESSING AND OBJECT GEOMETRY Object descriptions are given in a world reference frame, chosen to suit a particular application, and input world coordinates are ultimately
Maps as Numbers: Data Models
 Maps as Numbers: Data Models vertices E Reality S E S arcs S E Conceptual Models nodes E Logical Models S Start node E End node S Physical Models 1 The Task An accurate, registered, digital map that can
Data Models and Data processing in GIS
 PDHonline Course L155G (5 PDH) Data Models and Data processing in GIS Instructor: Steve Ramroop, Ph.D. 2012 PDH Online PDH Center 5272 Meadow Estates Drive Fairfax, VA 22030-6658 Phone & Fax: 703-988-0088
Object modeling and geodatabases. GEOG 419: Advanced GIS
 Object modeling and geodatabases GEOG 419: Advanced GIS CAD Data Model 1960s and 1970s Geographic data stored as points, lines, and areas No attributes; each feature type stored on a different layer No
Longley Chapter 3. Representations
 Longley Chapter 3 Digital Geographic Data Representation Geographic Data Type Data Models Representing Spatial and Temporal Data Attributes The Nature of Geographic Data Representations Are needed to convey
Introduction to Spatial Database Systems. Outline
 Introduction to Spatial Database Systems by Cyrus Shahabi from Ralf Hart Hartmut Guting s VLDB Journal v3, n4, October 1994 1 Outline Introduction & definition Modeling Querying Data structures and algorithms
Purpose: To explore the raster grid and vector map element concepts in GIS.
 GIS INTRODUCTION TO RASTER GRIDS AND VECTOR MAP ELEMENTS c:wou:nssi:vecrasex.wpd Purpose: To explore the raster grid and vector map element concepts in GIS. PART A. RASTER GRID NETWORKS Task A- Examine
Copyright The McGraw-Hill Companies, Inc. Permission required for reproduction or display.
 CHAPTER 11 VECTOR DATA ANALYSIS 11.1 Buffering 11.1.1 Variations in Buffering Box 11.1 Riparian Buffer Width 11.1.2 Applications of Buffering 11.2 Overlay 11.2.1 Feature Type and Overlay 11.2.2 Overlay
L1-Spatial Concepts L1 - Spatial Concepts
 L1 - Spatial Concepts NGEN06(TEK230) Algorithms in Geographical Information Systems Aim Understand the relationship between spatial queries and mathematical concepts. Know how topological relationships
Lecturer 2: Spatial Concepts and Data Models
 Lecturer 2: Spatial Concepts and Data Models 2.1 Introduction 2.2 Models of Spatial Information 2.3 Three-Step Database Design 2.4 Extending ER with Spatial Concepts 2.5 Summary Learning Objectives Learning
Overview.! Manual Digitizing! Heads-up Digitizing! Common Errors! Summary! Heads-up Digitizing Tutorial
 Digitizing Overview! Manual Digitizing! Heads-up Digitizing! Common Errors! Summary! Heads-up Digitizing Tutorial Manual Digitizing! Simplest, easiest, and cheapest method of capturing vector data from
Chapter 17 Creating a New Suit from Old Cloth: Manipulating Vector Mode Cartographic Data
 Chapter 17 Creating a New Suit from Old Cloth: Manipulating Vector Mode Cartographic Data Imagine for a moment that digital cartographic databases were a perfect analog of the paper map. Once you digitized
Introduction to ILWIS
 Introduction to ILWIS Source: Cees van Westen Associated Institute of the What is ILWIS? PC-based GIS & Remote Sensing package Developed by ITC A complete package: image processing spatial analysis digital
Lab 3: Digitizing in ArcGIS Pro
 Lab 3: Digitizing in ArcGIS Pro What You ll Learn: In this Lab you ll be introduced to basic digitizing techniques using ArcGIS Pro. You should read Chapter 4 in the GIS Fundamentals textbook before starting
Chapter 3: Maps as Numbers
 Chapter 3: Maps as Numbers 3. Representing Maps as Numbers 3.2 Structuring Attributes 3.3 Structuring Maps 3.4 Why Topology Matters 3.5 Formats for GIS Data 3.6 Exchanging Data David Tenenbaum EEOS 265
GEOGRAPHIC INFORMATION SYSTEMS Lecture 02: Feature Types and Data Models
 GEOGRAPHIC INFORMATION SYSTEMS Lecture 02: Feature Types and Data Models Feature Types and Data Models How Does a GIS Work? - a GIS operates on the premise that all of the features in the real world can
CSG obj. oper3. obj1 obj2 obj3. obj5. obj4
 Solid Modeling Solid: Boundary + Interior Volume occupied by geometry Solid representation schemes Constructive Solid Geometry (CSG) Boundary representations (B-reps) Space-partition representations Operations
Watershed Sciences 4930 & 6920 ADVANCED GIS
 Slides by Wheaton et al. (2009-2014) are licensed under a Creative Commons Attribution-NonCommercial-ShareAlike 3.0 Unported License Watershed Sciences 4930 & 6920 ADVANCED GIS VECTOR ANALYSES Joe Wheaton
Analytical and Computer Cartography Winter Lecture 9: Geometric Map Transformations
 Analytical and Computer Cartography Winter 2017 Lecture 9: Geometric Map Transformations Cartographic Transformations Attribute Data (e.g. classification) Locational properties (e.g. projection) Graphics
Motion Planning. O Rourke, Chapter 8
 O Rourke, Chapter 8 Outline Translating a polygon Moving a ladder Shortest Path (Point-to-Point) Goal: Given disjoint polygons in the plane, and given positions s and t, find the shortest path from s to
GIS DATA MODELS AND SPATIAL DATA STRUCTURE
 UNIT 5 GIS DATA MODELS AND SPATIAL DATA STRUCTURE GIS Data Models and Spatial Data 5.1 Introduction Objectives 5.2 GIS Data Models Raster Data Models Vector Data Models Comparison of Raster and Vector
Principles of Data Management. Lecture #14 (Spatial Data Management)
") Principles of Data Management Lecture #14 (Spatial Data Management) Instructor: Mike Carey mjcarey@ics.uci.edu Database Management Systems 3ed, R. Ramakrishnan and J. Gehrke 1 Today s Notable News v Project
Principles of Data Management Lecture #14 (Spatial Data Management) Instructor: Mike Carey mjcarey@ics.uci.edu Database Management Systems 3ed, R. Ramakrishnan and J. Gehrke 1 Today s Notable News v Project
Geometric Modeling Mortenson Chapter 11. Complex Model Construction
 Geometric Modeling 91.580.201 Mortenson Chapter 11 Complex Model Construction Topics Topology of Models Connectivity and other intrinsic properties Graph-Based Models Emphasize topological structure Boolean
Watershed Sciences 4930 & 6920 GEOGRAPHIC INFORMATION SYSTEMS
 Watershed Sciences 4930 & 6920 GEOGRAPHIC INFORMATION SYSTEMS WATS 4930/6920 WHERE WE RE GOING WATS 6915 welcome to tag along for any, all or none WEEK FIVE Lecture VECTOR ANALYSES Joe Wheaton HOUSEKEEPING
GIS Workbook #1. GIS Basics and the ArcGIS Environment. Helen Goodchild
 GIS Basics and the ArcGIS Environment Helen Goodchild Overview of Geographic Information Systems Geographical Information Systems (GIS) are used to display, manipulate and analyse spatial data (data that
Algorithms for GIS csci3225
 Algorithms for GIS csci3225 Laura Toma Bowdoin College Spatial data types and models Spatial data in GIS satellite imagery planar maps surfaces networks point cloud (LiDAR) Spatial data in GIS satellite
Introduction to Geographic Information Systems Dr. Arun K Saraf Department of Earth Sciences Indian Institute of Technology, Roorkee
 Introduction to Geographic Information Systems Dr. Arun K Saraf Department of Earth Sciences Indian Institute of Technology, Roorkee Lecture 04 Raster data model and comparisons with vector Hello friends,
Coverage data model. Vector-Based Spatial Analysis: Tools Processes. Topological Data Model. Polygons Files. Geographic Information Systems.
 GEOG4340 Geographic Information Systems Lecture Four 2013winter Vector-Based Spatial Analysis: Tools Processes Reading materials: Chapter 6 of Intro GIS by J. R. Jensen and R.R. Jensen Cheng. Q., Earth
RASTER ANALYSIS S H A W N L. P E N M A N E A R T H D A T A A N A LY S I S C E N T E R U N I V E R S I T Y O F N E W M E X I C O
 RASTER ANALYSIS S H A W N L. P E N M A N E A R T H D A T A A N A LY S I S C E N T E R U N I V E R S I T Y O F N E W M E X I C O TOPICS COVERED Spatial Analyst basics Raster / Vector conversion Raster data
Soil texture: based on percentage of sand in the soil, partially determines the rate of percolation of water into the groundwater.
 Overview: In this week's lab you will identify areas within Webster Township that are most vulnerable to surface and groundwater contamination by conducting a risk analysis with raster data. You will create
Introduction to GIS. Geographic Information Systems SOCR-377 9/24/2015. R. Khosla Fall Semester The real world. What in the world is GIS?
 Introduction to GIS Geographic Information Systems SOCR-377 What in the world is GIS? GIS is simultaneously the telescope, the microscope, the computer and the Xerox machine of regional analysis and synthesis
Spatial Analysis and Modeling (GIST 4302/5302) Database Fundaments. Database. Review: Bits and Bytes
 Database Fundaments. Database. Review: Bits and Bytes") Spatial Analysis and Modeling (GIST 4302/5302) Database Fundaments Guofeng Cao Department of Geosciences Texas Tech University Review: Bits and Bytes Data stored in a computer system is measured in bits
Spatial Analysis and Modeling (GIST 4302/5302) Database Fundaments Guofeng Cao Department of Geosciences Texas Tech University Review: Bits and Bytes Data stored in a computer system is measured in bits
Minnesota Department of Natural Resources ArcView Utilities Extension User s Guide
 Introduction This document describes the functionality and use of the ArcView Utilities extension for the ArcView desktop GIS software. These tools were developed out of the need for additional geoprocessing
Chapter 12 Solid Modeling. Disadvantages of wireframe representations
 Chapter 12 Solid Modeling Wireframe, surface, solid modeling Solid modeling gives a complete and unambiguous definition of an object, describing not only the shape of the boundaries but also the object
Lecture 2: GIS Data Sources, Data Types and Representation. GE 118: INTRODUCTION TO GIS Engr. Meriam M. Santillan Caraga State University
 Lecture 2: GIS Data Sources, Data Types and Representation GE 118: INTRODUCTION TO GIS Engr. Meriam M. Santillan Caraga State University Geographic Data in GIS Can be obtained from various sources in different
Introduction to GIS 2011
 Introduction to GIS 2011 Digital Elevation Models CREATING A TIN SURFACE FROM CONTOUR LINES 1. Start ArcCatalog from either Desktop or Start Menu. 2. In ArcCatalog, create a new folder dem under your c:\introgis_2011
Advanced Data Types and New Applications
 Advanced Data Types and New Applications These slides are a modified version of the slides of the book Database System Concepts (Chapter 24), 5th Ed., McGraw-Hill, by Silberschatz, Korth and Sudarshan.
Vector-Based GIS Data Processing. Chapter 6
 Vector-Based GIS Data Processing Chapter 6 Vector Data Model Feature Classes points lines polygons Layers limited to one class of data Figure p. 186 Vector Data Model Shapefiles ArcView non-topological
GEOGRAPHIC INFORMATION SYSTEMS Lecture 18: Spatial Modeling
 Spatial Analysis in GIS (cont d) GEOGRAPHIC INFORMATION SYSTEMS Lecture 18: Spatial Modeling - the basic types of analysis that can be accomplished with a GIS are outlined in The Esri Guide to GIS Analysis
Advanced Data Types and New Applications
 Advanced Data Types and New Applications These slides are a modified version of the slides of the book Database System Concepts (Chapter 24), 5th Ed., McGraw-Hill, by Silberschatz, Korth and Sudarshan.
Introduction to Geographic Information Science. Some Updates. Last Lecture 4/6/2017. Geography 4103 / Raster Data and Tesselations.
 Geography 43 / 3 Introduction to Geographic Information Science Raster Data and Tesselations Schedule Some Updates Last Lecture We finished DBMS and learned about storage of data in complex databases Relational
Lecture 17: Solid Modeling.... a cubit on the one side, and a cubit on the other side Exodus 26:13
 Lecture 17: Solid Modeling... a cubit on the one side, and a cubit on the other side Exodus 26:13 Who is on the LORD's side? Exodus 32:26 1. Solid Representations A solid is a 3-dimensional shape with
Maps as Numbers: Data Models
 Maps as Numbers: Data Models vertices nodes tart node nd node arcs Reality Conceptual Models The Task An accurate, registered, digital map that can be queried and analyzed Translate: Real World Locations,
Use of open-source GIS for the preprocessing of distributed hydrological. models
 Use of open-source GIS for the preprocessing of distributed hydrological models F. Branger, I. Braud, S. Debionne, J. Dehotin, S. Jankowfsky, O. Vannier, P. Viallet Who are we? Cemagref Hydrology-Hydraulics
The GIS Spatial Data Model
 The GIS Spatial Data Model Introduction: Spatial data are what drive a GIS. Every piece of functionality that makes a GIS separate from another analytical environment is rooted in the spatially explicit
Raster GIS. Raster GIS 11/1/2015. The early years of GIS involved much debate on raster versus vector - advantages and disadvantages
 Raster GIS Google Earth image (raster) with roads overlain (vector) Raster GIS The early years of GIS involved much debate on raster versus vector - advantages and disadvantages 1 Feb 21, 2010 MODIS satellite
Introducing ArcScan for ArcGIS
 Introducing ArcScan for ArcGIS An ESRI White Paper August 2003 ESRI 380 New York St., Redlands, CA 92373-8100, USA TEL 909-793-2853 FAX 909-793-5953 E-MAIL info@esri.com WEB www.esri.com Copyright 2003
Computational Geometry
 Lecture 1: Introduction and convex hulls Geometry: points, lines,... Geometric objects Geometric relations Combinatorial complexity Computational geometry Plane (two-dimensional), R 2 Space (three-dimensional),
Slide 1. Advanced Cartography in ArcGIS. Robert Jensen Edie Punt. Technical Workshops
 Slide 1 Technical Workshops Advanced Cartography in ArcGIS Robert Jensen Edie Punt Slide 2 Overview Using representations to manage symbology Solving graphic conflicts Geoprocessing for cartography in
LAB 1: Introduction to ArcGIS 8
 LAB 1: Introduction to ArcGIS 8 Outline Introduction Purpose Lab Basics o About the Computers o About the software o Additional information Data ArcGIS Applications o Starting ArcGIS o o o Conclusion To
Introduction :- Storage of GIS Database :- What is tiling?
 Introduction :- GIS storage and editing subsystems provides a variety of tools for storing and maintaining the digital representation of a study area. It also provide tools for examining each theme for
A CONSISTENCY MAINTENANCE OF SHARED BOUNDARY AFTER POLYGON GENERALIZATION
 CO-182 A CONSISTENCY MAINTENANCE OF SHARED BOUNDARY AFTER POLYGON GENERALIZATION AI T.(1), ZHANG W.(2) (1) Wuhan University, WUHAN CITY, CHINA ; (2) Zhongnan University of Economics and Law, WUHAN CITY,
Spatial Analysis and Modeling (GIST 4302/5302) Representation of Spatial Data. Representation of Spatial Data Models 3/5/18
 Representation of Spatial Data. Representation of Spatial Data Models 3/5/18") 3/5/8 Spatial Analysis and Modeling (GIST 432/532) Representation of Spatial Data Guofeng Cao Department of Geosciences Texas Tech University Representation of Spatial Data Models Object-based model: treats
3/5/8 Spatial Analysis and Modeling (GIST 432/532) Representation of Spatial Data Guofeng Cao Department of Geosciences Texas Tech University Representation of Spatial Data Models Object-based model: treats
Digitizing and Editing Polygons in the STS Gypsy Moth Project. M. Dodd 2/10/04
 Digitizing and Editing Polygons in the STS Gypsy Moth Project M. Dodd 2/10/04 Digitizing and Editing Polygons in the STS Gypsy Moth Project OVERVIEW OF DIGITIZING IN STS 3 THE DIGITIZING WINDOW 4 DIGITIZING
Tutorial 7: Adding Features and Editing Line and Polygon Layers
 Tutorial 7: Adding Features and Editing Line and Polygon Layers Tutorial Content 7.1. When should I use a line layer to represent data? 7.2. How do I add line features? 7.3. How to use the snapping tool?
3D Cadastral System Functionalities for 5D Multi- Purpose LIS
 3D Cadastral System Functionalities for 5D Multi- Purpose LIS ΕΣΠΑ 2007-2013, Δράση«Διμερής Ε&Τ Συνεργασία Ελλάδας- Ισραήλ 2013-2015» YΠOYPΓEIO ΠAΙΔΕΙΑΣ ΚΑΙ ΘΡΗΣΚΕΥΜΑΤΩΝ Γ.Γ.Ε.Τ. ΕΥΔΕ - ΕΤΑΚ Outline 5DMuPLIS
Solids as point set. Solid models. Solid representation schemes (cont d) Solid representation schemes. Solid representation schemes (cont d)
 Solid representation schemes. Solid representation schemes (cont d)") Solid models Solid models developed to address limitations of wireframe modeling. Attempt was to create systems which create only complete representations. Modelers would support direct creation of 3D
Solid models Solid models developed to address limitations of wireframe modeling. Attempt was to create systems which create only complete representations. Modelers would support direct creation of 3D
Automated Conflation for ArcGIS. User Guide. Version September ESEA 280 Second Street, Suite 270 Los Altos, CA 94022
 Automated Conflation for ArcGIS User Guide Version 9.6.0 September 2015 ESEA 280 Second Street, Suite 270 Los Altos, CA 94022 Table of Contents WELCOME TO MAPMERGER... 5 USING MAPMERGER... 6 IMPORTING
Spatial Data Structures
 Spatial Data Structures Hierarchical Bounding Volumes Regular Grids Octrees BSP Trees Constructive Solid Geometry (CSG) [Angel 9.10] Outline Ray tracing review what rays matter? Ray tracing speedup faster
VECTOR ANALYSIS: QUERIES, MEASUREMENTS & TRANSFORMATIONS
 VECTOR ANALYSIS: QUERIES, MEASUREMENTS & TRANSFORMATIONS GIS Analysis Winter 2016 Spatial Analysis Operations performed on spatial data that add value Can reveal things that might otherwise be invisible
Lecture 7 Digitizing. Dr. Zhang Spring, 2017
 Lecture 7 Digitizing Dr. Zhang Spring, 2017 Model of the course Using and making maps Navigating GIS maps Map design Working with spatial data Geoprocessing Spatial data infrastructure Digitizing File
v Map Module Operations SMS Tutorials Prerequisites Requirements Time Objectives
 v. 12.3 SMS 12.3 Tutorial Objectives This tutorial describes the fundamental tools in the Map module of the SMS. This tutorial provides information that is useful when constructing any type of geometric
Unit 4: Vector Overlay Analysis. Lecture Outline. Possible background reading material: McHarg, Ian 1992 Design with Nature. Wiley and Sons, New York.
 Unit 4: Vector Overlay Analysis Lecture Outline Possible background reading material: McHarg, Ian 1992 Design with Nature. Wiley and Sons, New York. Introduction: The idea of overlay originated when maps
Renderer Implementation: Basics and Clipping. Overview. Preliminaries. David Carr Virtual Environments, Fundamentals Spring 2005
 INSTITUTIONEN FÖR SYSTEMTEKNIK LULEÅ TEKNISKA UNIVERSITET Renderer Implementation: Basics and Clipping David Carr Virtual Environments, Fundamentals Spring 2005 Feb-28-05 SMM009, Basics and Clipping 1
Shape Representation Basic problem We make pictures of things How do we describe those things? Many of those things are shapes Other things include
 Shape Representation Basic problem We make pictures of things How do we describe those things? Many of those things are shapes Other things include motion, behavior Graphics is a form of simulation and
INCREASING CLASSIFICATION QUALITY BY USING FUZZY LOGIC
 JOURNAL OF APPLIED ENGINEERING SCIENCES VOL. 1(14), issue 4_2011 ISSN 2247-3769 ISSN-L 2247-3769 (Print) / e-issn:2284-7197 INCREASING CLASSIFICATION QUALITY BY USING FUZZY LOGIC DROJ Gabriela, University
Geodatabase over Taita Hills, Kenya
 Geodatabase over Taita Hills, Kenya Anna Broberg & Antero Keskinen Abstract This article introduces the basics of geographical information systems (GIS) and explains how the Taita Hills project can benefit