John A. Conte, P.E. 2/22/2012 1
|
|
|
- Phyllis White
- 5 years ago
- Views:
Transcription


1 John A. Conte, P.E. 2/22/2012 1
2 Objectives Excited to be here! Students, faculty, engineers Share my engineering career Some thoughts on Six Sigma Some thoughts on Process Capability Cp, Cpk, Pp and Ppk 2/22/2012 2
3 How Did I Get Here? Graduated with University of Missouri with BSIE in 1966 Lived in Kansas City, Denver, Dallas Worked for AT&T Western Electric for 25 years Worked for DSC Communications for 10 years ASQ Senior Instructor for past 10 years May 2008 responded to my story request August 2008 presented Engineering Seminar This year, invited to be a Professor for a Day by Dr. Occena Actually visited Dr. Chang s class in August /22/2012 3
4 Most valuable course The most valuable course during my four years here was Quality Control and Industrial Statistics Lead to my job with AT&T Western Electric Served me the first 15 years The basis for 20 years of using Bayesian Metrics The focus for the courses I currently teach ASQ CQE Exam Preparation ASQ BB Quality Engineering Statistics Villanova on line University Lean Six Sigma MBB 2/22/2012 4

5 September 1962 Defoe Hall McNair House 2/22/2012 5

6 2/22/2012 6
7 Job Offer upon graduation I remember in the interview I was told I am sorry but we do not have any current openings for an industrial engineer but we do have an opening for a quality engineer. I see from your college transcript that you have taken a course entitled Quality Control and Industrial Statistics. Would you like to work for us as a Quality Control Engineer? 2/22/2012 7
8 Semi Retirement Website Published Papers on Bayesian Metrics Courses Taught for the American Society for Quality ASQ CQE Exam Preparation Six Sigma Engineering Statistics Statistical Process Control Introduction to Quality Engineering CQPA, CQI, CSSGB Exam Preparation Teach an on line course for Villanova University 2/22/2012 8
9 What is Six Sigma A methodology A defined Body of Knowledge Different from Quality Engineering? DMAIC Project Champion, Project Management Team Approach Test for Normality Gage R&R Variation Minitab and Implementations without Statistics 2/22/2012 9


10 1972 ASQ CQE BoK 2/22/
11 ASQ CQE BoK 2/22/
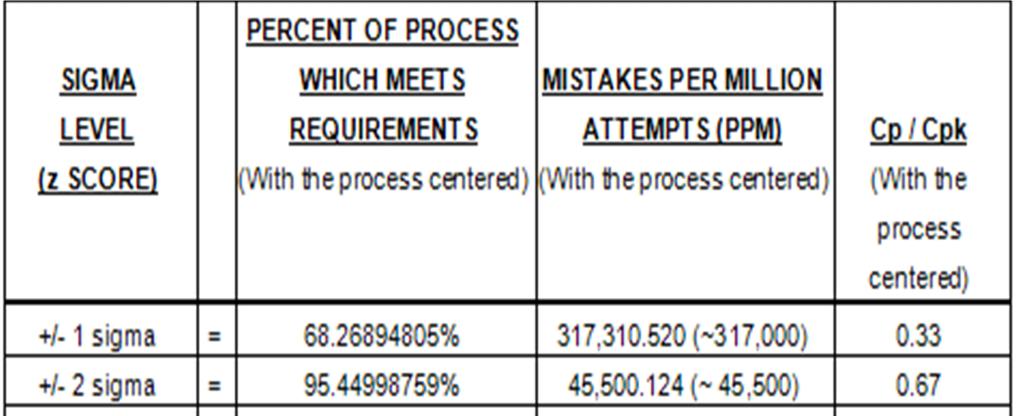
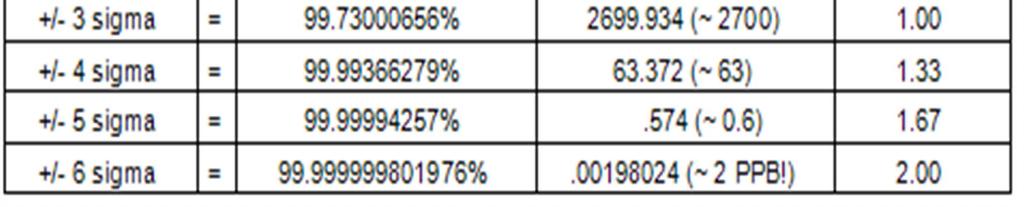
12 Comparison of Common Process Capability Measures Percent defective The percent of product that is nonconforming or defective. Process yield The percent of product that meets its requirements. PPM / DPMO When the number of defective products produced is small, it is often shown as a ratio of the number of defectives in 1 million parts or the number of defects in 1 million opportunities. This is referred to as PPM for parts per million defective or DPMO for defects per million opportunities. For example, a process that is producing 99.73% good product is producing.27% defective product, or 2700 parts per million (PPM) defective.
13 Process Capability Indices (Cp, Cpk) Measure the relationship of the process bell curve to the specification limits; use short term / within group variation. Process Performance Indices (Pp, Ppk) Measure the relationship of the process bell curve to the specification limits; use long term / between group variation. Sigma Levels A sigma level is nothing more than a z score it measures the number of standard deviations of the process that can fit between the process average and the nearest performance limit or target. For example, if a particular process average is 3 standard deviations from the nearest performance limit, the process is operating at a 3 sigma level. A 6 sigma level would mean that the process is centered six standard deviations away from the nearest limit.
14 +/- 6 SIGMA +/- 3 SIGMA +/- 1.5 SIGMA PERFORMANCE TARGETS
15 A z score is nothing more than a distance measure in all cases it represents the number of standard deviations between the mean of the data set and some target value or point of interest. If the point of interest is the nearest specification limit, the z score can be called a Sigma level! z x
16 z Score / Sigma level Example: The process is stable!! The process is normally distributed!! Process average = Process standard deviation = Upper spec limit = 14 Lower spec limit = 10 z x What is the z score / sigma level for the upper spec limit?
17 z Score / Sigma level Example: The process is stable!! The process is normally distributed!! Process average = Process standard deviation = Upper spec limit = 14 Lower spec limit = 10 z x
18 Distribution Plot Normal, Mean=12.24, StDev= Density X 14 z = 1.55 % defective upper = 6.06%
19 z Score / Sigma level Example: The process is stable!! The process is normally distributed!! Process average = Process standard deviation = Upper spec limit = 14 Lower spec limit = 10 z x What is the z score / sigma level for the lower spec limit?
20 z Score / Sigma level Example: The process is stable!! The process is normally distributed!! Process average = Process standard deviation = Upper spec limit = 14 Lower spec limit = 10 What is the z score / sigma level for the lower spec limit? z x
21 Distribution Plot Normal, Mean=12.24, StDev= Remember that the Normal curve is symmetric the area under the curve is the same on each side. Density % defective lower = 2.44% Z = X
22 Distribution Plot Normal, Mean=12.24, StDev= Density % good = 100 percent defective = = = 91.5% 0.1 % defective lower = 2.44% % defective upper = 6.06% X 14
23 Distribution Plot Normal, Mean=12.24, StDev= Density % defective = 2.44 x 10,000 = 24,400 PPM defective Parts per Million Defective (PPM) is simply the % defective multiplied by 10,000 (to equate the number to 1,000,000 instead of 100): 6.06% defective = 6.06 x 10,000 = 60,600 PPM defective X 14
24 Process Capability of Data LSL USL P rocess D ata LS L 10 Target * USL 14 Sample M ean Sample N 20 StDev (Within) StDev (O v erall) Within Overall P otential (Within) C apability Z.Bench 1.63 Z.LSL 2.24 Z.U SL 1.76 Cpk 0.59 O v erall C apability Z.Bench 1.37 Z.LSL 1.97 Z.U SL 1.55 Ppk 0.52 Cpm * Observed Performance PPM < LSL 0.00 PPM > U SL PPM Total Exp. Within Performance PPM < LSL PPM > U SL PPM Total Exp. Overall Performance PPM < LSL PPM > U SL PPM Total
25 Process Capability of Data LSL USL Process Data LS L 10 Target * USL 14 Sample Mean Sample N 20 StDev (Within) StDev (O v erall) Within Overall P otential (Within) C apability Z.Bench 1.63 Z.LS L 2.24 Z.U SL 1.76 Cpk 0.59 O v erall C apability Z.Bench 1.37 Z.LS L 1.97 Z.U SL 1.55 Ppk 0.52 Cpm * Within variation is based on the Range / MR / Sigma Chart average O bserv ed P erformance PPM < LSL 0.00 PPM > USL PPM Total Exp. Within Performance PPM < LSL PPM > USL PPM Total Exp. O v erall Performance PPM < LSL PPM > USL PPM Total Overall variation is based on the standard deviation across all results
26


27 The 1.5 Sigma Motorola Shift
28 Process Capability Indices: Cp, Cpk (Or Cp u And Cp l ) and Cr The Cp and Cpk family of process capability indices predict the potential capability of the process to meet its requirements they reflect how the process could perform if the shifts and drifts of the process were to be eliminated. There is disagreement over the use of the term short term vs. long term: Some people also refer to the Cp and Cpk as the "potential" or "long term" process capability indices because they reflect how the process could perform if it were completely stable. Others call these the short term indices because they are based on the average amount of variation within each sample group, which is a smaller period of time than the entire data set.
29 Because these indices are being used to predict potential process performance, the standard deviation used ( ˆ ) is always estimated from the Range (or Sigma or Moving Range) control chart as follows: ˆ d 2 R bar is the centerline value for the accompanying Range chart R d 2 is a calculation factor based on sample size and is found on the following table:


30 2/22/
31 The Cp is limited in that it does not consider the location of the center of the process distribution. A process centered outside the specification limits, and therefore highly defective, could still score a very good Cp if its variation is small enough. The Cp is therefore considered to be a preliminary measure only. If the amount of variation is acceptable, then the Cpk must be calculated to assess the centering of the process relative to the performance limits.
32 Process Capability of C1 LSL USL P rocess Data LSL 10.5 Target * USL 11.5 Sample Mean Sample N 100 StDev (Within) StDev (O v erall) Within Overall P otential (Within) C apability C p 3.63 C PL C PU C pk O v erall C apability Pp 3.52 PPL PPU Ppk Cpm * O bserv ed P erformance PPM < LSL PPM > USL 0.00 PPM Total Exp. Within Performance PPM < LSL PPM > USL 0.00 PPM Total Exp. O v erall Performance PPM < LSL PPM > USL 0.00 PPM Total
33 The Cpk compares the actual process center and spread to the nominal or target process center and spread. Cpk is based on the distance from the process mean to the nearest, and therefore riskiest, performance target, so the smallest value is always selected. Cpk = the smaller of: Upper Performance Limit 3 σˆ - x or x - Lower Performance Limit 3 σˆ
34 With both the Cp and Cpk indices, larger values are always better: When Cpk is greater than 1, the process is in better shape to perform at acceptable levels. As a rule of thumb, a minimum Cp and Cpk value of 1.33 (4 sigma) is desired by most American companies today, although many companies are seeking Cpk values of 2, 3, 4, and larger before they consider their processes to be capable. When the Cpk is equal to 1 (3 sigma), the process may be acceptable at the moment, but any shifting of the process or increase in process variation will immediately drive the process to unacceptable performance levels. When the Cpk is less than 1, the process is incapable of performing at an acceptable level and should be given immediate attention. +/- 6 SIGMA +/- 3 SIGMA +/- 1.5 SIGMA PERFORMANCE TARGETS
35 Process Capability of C1 Process Data LS L 5 Target * USL 9 Sample Mean 7 Sample N 125 StDev(Within) LSL USL Potential (Within) C apability Cp 0.50 CPL 0.50 CPU 0.50 Cpk O bserv ed Performance PPM < LSL PPM > USL PPM Total Exp. Within Performance PPM < LSL PPM > USL PPM Total A Cp of 0.5 means that the specification limits are half the width of the total predicted process variation. A Cpk of 0.5 means that half of a Normal curve will fit between the average and either performance limit, so this process is at a 1.5 sigma level.
36 Special Process Capability Circumstances What does it mean when the both Cp and Cpk are all the same?
37 Process Capability of C1 Process Data LS L 5 Target * USL 9 Sample Mean 7 Sample N 125 StDev (Within) LSL USL Potential (Within) C apability C p 0.50 CPL 0.50 CPU 0.50 Cpk O bserv ed Performance PPM < LSL PPM > USL PPM Total Exp. Within Performance PPM < LSL PPM > USL PPM Total Equal Cp and Cpk Values:The Cp and Cpk values will only be equal when a process is centered at the target or nominal value. Note that the Cpk value for a given process can never be greater than the Cp value, so if the Cp is unacceptable, the Cpk be unacceptable as well.
38 Special Process Capability Circumstances What does a negative Cpk tell you?
39 Negative Cpk Values: Companies will sometimes find their processes centered outside of the performance limits. When this occurs, the Cpk calculation still holds true. The only difference is that if the process mean is outside the performance limits (less than the lower performance limit or greater than the upper performance limit), one Cpk value will be a negative number. The negative value is therefore chosen as the Cpk value since it will always be the lower of the two calculations. Process Data LSL 10.5 Target * USL 11.5 Sample Mean Sample N 100 StDev(Within) StDev(Overall) Observed Performance PPM < LSL PPM > USL 0.00 PPM Total Process Capability of C Exp. Within Performance PPM < LSL PPM > USL 0.00 PPM Total LSL Exp. Overall Performance PPM < LSL PPM > USL 0.00 PPM Total USL Within Overall Potential (Within) Capability Cp 3.63 CPL CPU Cpk Overall Capability Pp 3.52 PPL PPU Ppk Cpm *
40 Special Process Capability Circumstances What does a Cpk = 0 tell you?
41 Cpk = 0: Processes centered on a performance limit will have a Cpk value of zero since there is no difference between the process average and the performance limit. Process Capability of C1 Process Data LS L 5 Target * USL 9 Sample Mean 9 Sample N 125 StDev (Within) LSL USL Potential (Within) C apability C p 0.50 CPL 1.00 CPU 0.00 Cpk Observed Performance PPM < LSL PPM > USL PPM Total Exp. Within Performance PPM < LSL PPM > USL PPM Total
42 Pp and Ppk The Pp and Ppk indices use the overall variation as calculated by the standard deviation for all the data collected across all sample subgroups: s (x x) n 1 2
43 When the process is stable, the Cp / Cpk indices and the Pp / Ppk indices will be very similar. If the process is not stable, the use of the Cp / Cpk indices is definitely not recommended and the Pp / Ppk indices are suspect as well. Mathematically how do the formulas for Cpk and Ppk differ?

44
45 Page 303, The Certified Quality Inspector Handbook, H. Fred Walker, Ahmad K. Elshennawy, Bhisham C. Gupta, and Mary McShane Vaughn, ASQ Press 2009 Kotz and Lovelace (1998,253) strongly argue against the use of Pp and Ppk. They have written: We highly recommend against using these indices when the process is not in statistical control. Under these conditions, the P numbers are meaningless with regard to process capability, have no tractable statistical properties, and infer nothing about long term capability of the process. Worse still, they provide no motivation to the user companies to get their process in control. The P numbers are a step backwards in the efforts to properly quantify process capability, and a step towards statistical terrorism in its undiluted form. Montgomery (2005, 349) agrees with Kotz and Lovelace. He writes "The process performance indices Pp and Ppk are more than a step backwards. They are a waste of engineering and management effort they tell you nothing." The authors wholeheartedly agree with Kotz and Lovelace and Montgomery. No one can judge a process when its future behavior is so unpredictable.
46 Revised Process Prep times in Minutes I-MR Chart of C Individual Value Moving Range Observation 9 11 Observation UC L= _ X= LC L= UC L= MR= LC L=0 2/22/
47 Process Capability of C4 Process Data LS L * Target * USL 1.5 Sample Mean Sample N 20 StDev (Within) StDev (O v erall) USL Within Overall P otential (Within) C apability Cp * CPL * C PU C pk O v erall C apability Pp * PPL * PPU Ppk Cpm * Observed Performance PPM < LSL * PPM > USL PPM Total Exp. Within Performance PPM < LSL * PPM > USL PPM Total Exp. Overall Performance PPM < LSL * PPM > USL PPM Total /22/
48 MBB Process Capability problem Not knowing what the specification limits Using the SPC IX & MR chart control limits as your specification limits Failing to compute Cpk with (MR or R bar) and D2 value Get same value for Cpk and Ppk Assuming Lower Specification Limit when none was given They compute a value for Cp and Pp when it is NA When they use Minitab to solve problem not knowing what the sub group size When asked to compute the percent within and beyond spec they correctly get 24.35% within spec, but go on to tell me that some number other than 756,500 PPM are beyond specification
49 Questions from Students 2/22/
Department of Industrial Engineering. Chap. 8: Process Capability Presented by Dr. Eng. Abed Schokry
 Department of Industrial Engineering Chap. 8: Process Capability Presented by Dr. Eng. Abed Schokry Learning Outcomes: After careful study of this chapter, you should be able to do the following: Investigate
Statistical Techniques for Validation Sampling. Copyright GCI, Inc. 2016
 Statistical Techniques for Validation Sampling Tie Risk to Sampling Data Type Confidence Level Reliability and Risk Typical Performance Levels One-sided or two-sided spec Distribution (variables) Risk
Process Capability Analysis (Cpk) SixSigmaTV.Net
 SixSigmaTV.Net") Process Capability Analysis (Cpk) SixSigmaTV.Net Process Capability Using SigmaXL SigmaXL is an easy to use Excel plug-in for Six Sigma graphical and statistical analysis to help with many phases of your
Process Capability Analysis (Cpk) SixSigmaTV.Net Process Capability Using SigmaXL SigmaXL is an easy to use Excel plug-in for Six Sigma graphical and statistical analysis to help with many phases of your
Process Capability in the Six Sigma Environment
 GE Research & Development Center Process Capability in the Six Sigma Environment C.L. Stanard 2001CRD119, July 2001 Class 1 Technical Information Series Copyright 2001 General Electric Company. All rights
Denver, Colorado November 16, 2004 D. R. Corpron Senior Manager & Master Black Belt
 Using Process Simulation in Quantitative Management Denver, Colorado November 16, 2004 D. R. Corpron Senior Manager & Master Black Belt 1 Preview What is the problem? Why process simulation? Steps to perform
Six Sigma Green Belt Part 5
 Six Sigma Green Belt Part 5 Process Capability 2013 IIE and Aft Systems, Inc. 5-1 Process Capability Is the measured, inherent reproducibility of the product turned out by the process. It can be quantified
Risk Assessment of a LM117 Voltage Regulator Circuit Design Using Crystal Ball and Minitab (Part 1) By Andrew G. Bell
 By Andrew G. Bell") Risk Assessment of a LM7 Voltage Regulator Circuit Design Using Crystal Ball and Minitab (Part ) By Andrew G. Bell 3 August, 2006 Table of Contents Executive Summary 2 Introduction. 3 Design Requirements.
Risk Assessment of a LM7 Voltage Regulator Circuit Design Using Crystal Ball and Minitab (Part ) By Andrew G. Bell 3 August, 2006 Table of Contents Executive Summary 2 Introduction. 3 Design Requirements.
Process Capability Analysis in Case Study of Specimens for Rice Polished Cylinder
 International Science Index Vol: 8 No: Part V Process Capability Analysis in Case Study of Specimens for ice Polished Cylinder T. Boonkang, S. Bangphan, P. Bangphan, T. Pothom Abstract Process capability
Mitigating Consumer Risk When Manufacturing Under Verification for Drug Shortages
 Mitigating Consumer Risk When Manufacturing Under Verification for Drug Shortages Presented By Kathy Eley, Principal Consultant and Hector Rivera, Senior Engineer Hyde Engineering + Consulting Presentation
Towards Process Understanding:
 Towards Process Understanding: sta2s2cal analysis applied to the manufacturing process of tablets Drug Product Development: A QbD Approach Nadia Bou-Chacra Faculty of Pharmaceutical Sciences University
Minitab detailed
 Minitab 18.1 - detailed ------------------------------------- ADDITIVE contact sales: 06172-5905-30 or minitab@additive-net.de ADDITIVE contact Technik/ Support/ Installation: 06172-5905-20 or support@additive-net.de
This is file Q8Intl-IM13C.doc - The third of 5 files for solutions to this chapter.
 This is file Q8Intl-IM13C.doc - The third of 5 files for solutions to this chapter. 11. For each of the following control charts, assume that the process has been operating in statistical control for some
Continuous Improvement Toolkit. Normal Distribution. Continuous Improvement Toolkit.
 Continuous Improvement Toolkit Normal Distribution The Continuous Improvement Map Managing Risk FMEA Understanding Performance** Check Sheets Data Collection PDPC RAID Log* Risk Analysis* Benchmarking***
Minitab Training. Leading Innovation. 3 1 s. 6 2 s. Upper Specification Limit. Lower Specification Limit. Mean / Target. High Probability of Failure
 Lower Specification Limit Mean / Target Upper Specification Limit High Probability of Failure Minitab Training 1 3 1 s 3 1 s Much Lower Probability of Failure 1 6 2 s 6 2 s Learning Objectives Understand
What is Process Capability?
 6. Process or Product Monitoring and Control 6.1. Introduction 6.1.6. What is Process Capability? Process capability compares the output of an in-control process to the specification limits by using capability
Control Charts. An Introduction to Statistical Process Control
 An Introduction to Statistical Process Control Course Content Prerequisites Course Objectives What is SPC? Control Chart Basics Out of Control Conditions SPC vs. SQC Individuals and Moving Range Chart
Cpk: What is its Capability? By: Rick Haynes, Master Black Belt Smarter Solutions, Inc.
 C: What is its Capability? By: Rick Haynes, Master Black Belt Smarter Solutions, Inc. C is one of many capability metrics that are available. When capability metrics are used, organizations typically provide
= = P. IE 434 Homework 2 Process Capability. Kate Gilland 10/2/13. Figure 1: Capability Analysis
 Kate Gilland 10/2/13 IE 434 Homework 2 Process Capability 1. Figure 1: Capability Analysis σ = R = 4.642857 = 1.996069 P d 2 2.326 p = 1.80 C p = 2.17 These results are according to Method 2 in Minitab.
CLEANING OPTIMISATION STUDY - THE CLEANING OF AN OEB5 COMPOUND VESSEL IN THE HIGH CONTAINMENT SUITE AT MSD SWORDS
 CLEANING OPTIMISATION STUDY - THE CLEANING OF AN OEB5 COMPOUND VESSEL IN THE HIGH CONTAINMENT SUITE AT MSD SWORDS Fearghal Downey Technical Director Hyde Engineering and Consulting 31 st August 2017 1.Acknowledgements
Process capability analysis
 6 Process capability analysis In general, process capability indices have been quite controversial. (Ryan, 2000, p. 186) Overview Capability indices are widely used in assessing how well processes perform
Assignment 9 Control Charts, Process capability and QFD
 Instructions: Assignment 9 Control Charts, Process capability and QFD 1. Total No. of Questions: 25. Each question carries one point. 2. All questions are objective type. Only one answer is correct per
STATGRAPHICS PLUS for WINDOWS
 TUTORIALS FOR Quality Control Analyses STATGRAPHICS PLUS for WINDOWS SEPTEMBER 1999 MANUGISTICS, INC 2115 East Jefferson Street Rockville, Maryland 20852 Introduction This manual contains tutorials for
Modified S-Control Chart for Specified value of Cp
 American International Journal of Research in Science, Technology, Engineering & Mathematics Available online at http://www.iasir.net ISSN (Print): 38-349, ISSN (Online): 38-358, ISSN (CD-ROM): 38-369
Tools For Recognizing And Quantifying Process Drift Statistical Process Control (SPC)
") Tools For Recognizing And Quantifying Process Drift Statistical Process Control (SPC) J. Scott Tarpley GE Intelligent Platforms, Inc. December, 200 Process Analytical Technology (PAT) brings us? Timely
Tools For Recognizing And Quantifying Process Drift Statistical Process Control (SPC) J. Scott Tarpley GE Intelligent Platforms, Inc. December, 200 Process Analytical Technology (PAT) brings us? Timely
MAT 142 College Mathematics. Module ST. Statistics. Terri Miller revised July 14, 2015
 MAT 142 College Mathematics Statistics Module ST Terri Miller revised July 14, 2015 2 Statistics Data Organization and Visualization Basic Terms. A population is the set of all objects under study, a sample
Statistical Process Control: Micrometer Readings
 Statistical Process Control: Micrometer Readings Timothy M. Baker Wentworth Institute of Technology College of Engineering and Technology MANF 3000: Manufacturing Engineering Spring Semester 2017 Abstract
Lecture 3 Questions that we should be able to answer by the end of this lecture:
 Lecture 3 Questions that we should be able to answer by the end of this lecture: Which is the better exam score? 67 on an exam with mean 50 and SD 10 or 62 on an exam with mean 40 and SD 12 Is it fair
Lecture 3 Questions that we should be able to answer by the end of this lecture:
 Lecture 3 Questions that we should be able to answer by the end of this lecture: Which is the better exam score? 67 on an exam with mean 50 and SD 10 or 62 on an exam with mean 40 and SD 12 Is it fair
Capability Calculations: Are AIAG SPC Appendix F Conclusions Wrong?
 WHITE PAPER Capability Calculations: Are AIAG SPC Appendix F Conclusions Wrong? Bob Doering CorrectSPC Page 0 Appendix 7 of the AIAG SPC book contains sample data set and calculations for capability. They
The Basics of Variation
 Variation A question that is often asked is, How much variance is acceptable? Taking the work arrival time example, your boss probably doesn t care how long it takes you to get to work, as long as you
4. RCO Prevention Reduce Chance of Occurrence: Does not Allow defect to occur.
 GREEN BELT ABBREVIATIONS AND OTHER SUMMARY: 1. VOC Voice of Customer 2. CTQ - Critical to Quality (Characteristics) 3. CTP - Critical to Process (Inputs & Factors) 4. RCO Prevention Reduce Chance of Occurrence:
Toll Free: 1(877) Website:
 Website:") Management Certification for Manufacturing Professionals (Customized) Course No. 324 (DET Course ID: 1073267) This course consists of 4 courses which prepare students to have the knowledge and skills in
Management Certification for Manufacturing Professionals (Customized) Course No. 324 (DET Course ID: 1073267) This course consists of 4 courses which prepare students to have the knowledge and skills in
Diploma of Laboratory Technology. Assessment 2 Control charts. Data Analysis. MSL Analyse data and report results.
 Diploma of Laboratory Technology Assessment 2 Control charts Data Analysis MSL925001 Analyse data and report results www.cffet.net PURPOSE 2 ASSESSMENT MAP 2 SUBMISSION 2 GETTING STARTED 3 TASK 1 X CHART
Understanding ASQ Certification Tracks for Succeeding as Quality Professionals
 Understanding ASQ Certification Tracks for Succeeding as Quality Professionals Minnesota Section 1208 American Society for Quality Bill Hamann March 13 th, 2018 Speaker Bio 25 years Medical Device Manufacturing
Quality Improvement Tools
 CHAPTER SIX SUPPLEMENT Quality Improvement Tools McGraw-Hill/Irwin Copyright 2011 by the McGraw-Hill Companies, Inc. All rights reserved. Learning Objectives 1. Apply quality management tools for problem
NCSS Statistical Software
 Chapter 245 Introduction This procedure generates R control charts for variables. The format of the control charts is fully customizable. The data for the subgroups can be in a single column or in multiple
MAT 110 WORKSHOP. Updated Fall 2018
 MAT 110 WORKSHOP Updated Fall 2018 UNIT 3: STATISTICS Introduction Choosing a Sample Simple Random Sample: a set of individuals from the population chosen in a way that every individual has an equal chance
Measures of Dispersion
 Lesson 7.6 Objectives Find the variance of a set of data. Calculate standard deviation for a set of data. Read data from a normal curve. Estimate the area under a curve. Variance Measures of Dispersion
AC : DETERMINING PROCESS CAPABILITY OF AN INDUSTRIAL PROCESS IN LABORATORY USING COMPUTER AIDED HARDWARE AND SOFTWARE TOOLS
 AC 007-150: DETERMINING PROCESS CAPABILITY OF AN INDUSTRIAL PROCESS IN LABORATORY USING COMPUTER AIDED HARDWARE AND SOFTWARE TOOLS Akram Hossain, Purdue University-Calumet Akram Hossain is a professor
Multivariate Capability Analysis
 Multivariate Capability Analysis Summary... 1 Data Input... 3 Analysis Summary... 4 Capability Plot... 5 Capability Indices... 6 Capability Ellipse... 7 Correlation Matrix... 8 Tests for Normality... 8
Stat 528 (Autumn 2008) Density Curves and the Normal Distribution. Measures of center and spread. Features of the normal distribution
 Density Curves and the Normal Distribution. Measures of center and spread. Features of the normal distribution") Stat 528 (Autumn 2008) Density Curves and the Normal Distribution Reading: Section 1.3 Density curves An example: GRE scores Measures of center and spread The normal distribution Features of the normal
Stat 528 (Autumn 2008) Density Curves and the Normal Distribution Reading: Section 1.3 Density curves An example: GRE scores Measures of center and spread The normal distribution Features of the normal
2009 by Minitab Inc. All rights reserved. Release 3.1, January 2009 Minitab, Quality Companion by Minitab, the Minitab logo, and Quality Trainer by
 2009 by Minitab Inc. All rights reserved. Release 3.1, January 2009 Minitab, Quality Companion by Minitab, the Minitab logo, and Quality Trainer by Minitab are registered trademarks of Minitab, Inc. in
4.2 Data Distributions
 NOTES Data Distribution: Write your questions here! Dotplots Histograms Find the mean number of siblings: Find the median number of siblings: Types of distributions: The mean on the move: Compare the mean
Moving Average (MA) Charts
 Charts") Moving Average (MA) Charts Summary The Moving Average Charts procedure creates control charts for a single numeric variable where the data have been collected either individually or in subgroups. In contrast
Moving Average (MA) Charts Summary The Moving Average Charts procedure creates control charts for a single numeric variable where the data have been collected either individually or in subgroups. In contrast
Bushing blocks optimization for an external gear pump
 Bushing blocks optimization for an external gear pump MARIA PIA D AMBROSIO D - SixSigmaIn Team snc MARCO MANARA - Casappa SpA Summary Companies profile: SixSigmaIn Team & Casappa Hydraulic pumps - basic
Further Maths Notes. Common Mistakes. Read the bold words in the exam! Always check data entry. Write equations in terms of variables
 Further Maths Notes Common Mistakes Read the bold words in the exam! Always check data entry Remember to interpret data with the multipliers specified (e.g. in thousands) Write equations in terms of variables
26, 2016 TODAY'S AGENDA QUIZ
 TODAY'S AGENDA - Complete Bell Ringer (in Canvas) - Complete Investigation 1 QUIZ (40 minutes) - Be sure your assignments from the week are complete (bell ringers, hw, makeup work) - Investigation 2.1
Chapter 2 Modeling Distributions of Data
 Chapter 2 Modeling Distributions of Data Section 2.1 Describing Location in a Distribution Describing Location in a Distribution Learning Objectives After this section, you should be able to: FIND and
10.4 Measures of Central Tendency and Variation
 10.4 Measures of Central Tendency and Variation Mode-->The number that occurs most frequently; there can be more than one mode ; if each number appears equally often, then there is no mode at all. (mode
10.4 Measures of Central Tendency and Variation
 10.4 Measures of Central Tendency and Variation Mode-->The number that occurs most frequently; there can be more than one mode ; if each number appears equally often, then there is no mode at all. (mode
6-1 THE STANDARD NORMAL DISTRIBUTION
 6-1 THE STANDARD NORMAL DISTRIBUTION The major focus of this chapter is the concept of a normal probability distribution, but we begin with a uniform distribution so that we can see the following two very
Project Management Certificate Program
 Published on UA@Work (https://uaatwork.arizona.edu) Home > Project Management Certificate Program Project Management Certificate Program Date:: September 20, 2013 Project Management Certificate Program?
We are IntechOpen, the world s leading publisher of Open Access books Built by scientists, for scientists. International authors and editors
 We are IntechOpen, the world s leading publisher of Open Access books Built by scientists, for scientists 4,000 116,000 120M Open access books available International authors and editors Downloads Our
Chapter 5: The standard deviation as a ruler and the normal model p131
 Chapter 5: The standard deviation as a ruler and the normal model p131 Which is the better exam score? 67 on an exam with mean 50 and SD 10 62 on an exam with mean 40 and SD 12? Is it fair to say: 67 is
STANDARDS OF LEARNING CONTENT REVIEW NOTES ALGEBRA I. 4 th Nine Weeks,
 STANDARDS OF LEARNING CONTENT REVIEW NOTES ALGEBRA I 4 th Nine Weeks, 2016-2017 1 OVERVIEW Algebra I Content Review Notes are designed by the High School Mathematics Steering Committee as a resource for
appstats6.notebook September 27, 2016
 Chapter 6 The Standard Deviation as a Ruler and the Normal Model Objectives: 1.Students will calculate and interpret z scores. 2.Students will compare/contrast values from different distributions using
Beware the Tukey Control Chart
 Quality Digest Daily, August, 213 Manuscript 28 Another bad idea surfaces Donald J. Wheeler I recently read about a technique for analyzing data called the Tukey control chart. Since Professor John Tukey
STANDARDS OF LEARNING CONTENT REVIEW NOTES. ALGEBRA I Part I. 4 th Nine Weeks,
 STANDARDS OF LEARNING CONTENT REVIEW NOTES ALGEBRA I Part I 4 th Nine Weeks, 2016-2017 1 OVERVIEW Algebra I Content Review Notes are designed by the High School Mathematics Steering Committee as a resource
What s New in Oracle Crystal Ball? What s New in Version Browse to:
 What s New in Oracle Crystal Ball? Browse to: - What s new in version 11.1.1.0.00 - What s new in version 7.3 - What s new in version 7.2 - What s new in version 7.1 - What s new in version 7.0 - What
Density Curve (p52) Density curve is a curve that - is always on or above the horizontal axis.
 Density curve is a curve that - is always on or above the horizontal axis.") 1.3 Density curves p50 Some times the overall pattern of a large number of observations is so regular that we can describe it by a smooth curve. It is easier to work with a smooth curve, because the histogram
1.3 Density curves p50 Some times the overall pattern of a large number of observations is so regular that we can describe it by a smooth curve. It is easier to work with a smooth curve, because the histogram
Getting Started with Minitab 17
 2014, 2016 by Minitab Inc. All rights reserved. Minitab, Quality. Analysis. Results. and the Minitab logo are all registered trademarks of Minitab, Inc., in the United States and other countries. See minitab.com/legal/trademarks
2.3. Quality Assurance: The activities that have to do with making sure that the quality of a product is what it should be.
 5.2. QUALITY CONTROL /QUALITY ASSURANCE 5.2.1. STATISTICS 1. ACKNOWLEDGEMENT This paper has been copied directly from the HMA Manual with a few modifications from the original version. The original version
Distributions of random variables
 Chapter 3 Distributions of random variables 31 Normal distribution Among all the distributions we see in practice, one is overwhelmingly the most common The symmetric, unimodal, bell curve is ubiquitous
STANDARDS OF LEARNING CONTENT REVIEW NOTES. ALGEBRA I Part II. 3 rd Nine Weeks,
 STANDARDS OF LEARNING CONTENT REVIEW NOTES ALGEBRA I Part II 3 rd Nine Weeks, 2016-2017 1 OVERVIEW Algebra I Content Review Notes are designed by the High School Mathematics Steering Committee as a resource
Building Better Parametric Cost Models
 Building Better Parametric Cost Models Based on the PMI PMBOK Guide Fourth Edition 37 IPDI has been reviewed and approved as a provider of project management training by the Project Management Institute
Getting Started with Minitab 18
 2017 by Minitab Inc. All rights reserved. Minitab, Quality. Analysis. Results. and the Minitab logo are registered trademarks of Minitab, Inc., in the United States and other countries. Additional trademarks
UNIT 1A EXPLORING UNIVARIATE DATA
 A.P. STATISTICS E. Villarreal Lincoln HS Math Department UNIT 1A EXPLORING UNIVARIATE DATA LESSON 1: TYPES OF DATA Here is a list of important terms that we must understand as we begin our study of statistics
Case study for robust design and tolerance analysis
 Subject Case study for robust design and tolerance analysis DfSS.nl A good practice in development projects is to take production variation of components into account when making design choices. The properties
+ Statistical Methods in
 9/4/013 Statistical Methods in Practice STA/MTH 379 Dr. A. B. W. Manage Associate Professor of Mathematics & Statistics Department of Mathematics & Statistics Sam Houston State University Discovering Statistics
Statistics: Interpreting Data and Making Predictions. Visual Displays of Data 1/31
 Statistics: Interpreting Data and Making Predictions Visual Displays of Data 1/31 Last Time Last time we discussed central tendency; that is, notions of the middle of data. More specifically we discussed
3.5 Applying the Normal Distribution: Z-Scores
 3.5 Applying the Normal Distribution: Z-Scores In the previous section, you learned about the normal curve and the normal distribution. You know that the area under any normal curve is 1, and that 68%
CHAPTER 2: SAMPLING AND DATA
 CHAPTER 2: SAMPLING AND DATA This presentation is based on material and graphs from Open Stax and is copyrighted by Open Stax and Georgia Highlands College. OUTLINE 2.1 Stem-and-Leaf Graphs (Stemplots),
American Society for Quality
 US Army BOSS Program Information Session American Society for Quality Choices and Challenges for the Future 10 September 2017 Certified Lean Six Sigma Black Belt Certified Change Management Advanced Practitioner
AN5800 Amplified Pressure Product Capabilities APPLICATION NOTE
 SM5800 - Amplified Pressure Product Capabilities OVERVIEW The SM5800 series pressure product provides a significant advantage to the user due to a number of improvements associated with the technology
Statistical Consulting at Draper Laboratory
 Statistical Consulting at Draper Laboratory A Project Report Submitted to the Faculty of the WORCESTER POLYTECHNIC INSTITUTE in partial fulfillment of the requirements for the Degree of Master of Science
Why Should I become a Member?
 KC PMI Mid-America Chapter Welcome to the Kansas City PMI Mid-America Chapter Information Session Why Should I become a Member? KC PMI Mid-America Chapter Event Agenda 2:00 pm - 2:15 pm Ice Breaker/Networking
Pre-control and Some Simple Alternatives
 Pre-control and Some Simple Alternatives Stefan H. Steiner Dept. of Statistics and Actuarial Sciences University of Waterloo Waterloo, N2L 3G1 Canada Pre-control, also called Stoplight control, is a quality
Process capability for a complete electronic product assembly
 Rochester Institute of Technology RIT Scholar Works Theses Thesis/Dissertation Collections 6-206 Process capability for a complete electronic product assembly Flavia Carvalho Resende fcr4827@rit.edu Follow
APPROACHES TO THE PROCESS CAPABILITY ANALYSIS IN THE CASE OF NON- NORMALLY DISTRIBUTED PRODUCT QUALITY CHARACTERISTIC
 APPROACHES TO THE PROCESS CAPABILITY ANALYSIS IN THE CASE OF NON- NORMALLY DISTRIBUTED PRODUCT QUALITY CHARACTERISTIC Jiří PLURA, Milan ZEMEK, Pavel KLAPUT VŠB-Technical University of Ostrava, Faculty
Probability & Statistics Chapter 6. Normal Distribution
 I. Graphs of Normal Probability Distributions Normal Distribution Studied by French mathematician Abraham de Moivre and German mathematician Carl Friedrich Gauss. Gauss work was so important that the normal
Basic Statistical Terms and Definitions
 I. Basics Basic Statistical Terms and Definitions Statistics is a collection of methods for planning experiments, and obtaining data. The data is then organized and summarized so that professionals can
Acceptance Sampling by Variables
 Acceptance Sampling by Variables Advantages of Variables Sampling o Smaller sample sizes are required o Measurement data usually provide more information about the manufacturing process o When AQLs are
Goals. The Normal Probability Distribution. A distribution. A Discrete Probability Distribution. Results of Tossing Two Dice. Probabilities involve
 Goals The Normal Probability Distribution Chapter 7 Dr. Richard Jerz Understand the difference between discrete and continuous distributions. Compute the mean, standard deviation, and probabilities for
QstatLab: software for statistical process control and robust engineering
 QstatLab: software for statistical process control and robust engineering I.N.Vuchkov Iniversity of Chemical Technology and Metallurgy 1756 Sofia, Bulgaria qstat@dir.bg Abstract A software for quality
Assignment 4/5 Statistics Due: Nov. 29
 Assignment 4/5 Statistics 5.301 Due: Nov. 29 1. Two decision rules are given here. Assume they apply to a normally distributed quality characteristic, the control chart has three-sigma control limits,
Software Professional Development Customized Training QPS Course # 333 (DET Course # )
") Software Professional Development Customized Training QPS Course # 333 (DET Course # 1087354) TYPE OF TRAINING: BENEFITS: COURSES-DESCRIPTION: PREREQUISITES: EXPECTED OUTCOME: DURATION: COST: REGISTRATION:
Software Professional Development Customized Training QPS Course # 333 (DET Course # 1087354) TYPE OF TRAINING: BENEFITS: COURSES-DESCRIPTION: PREREQUISITES: EXPECTED OUTCOME: DURATION: COST: REGISTRATION:
Engineering Manual LOCTITE GC 3W T3 & T4 Solder Paste
 Engineering Manual LOCTITE GC 3W T3 & T4 Solder Paste Suitable for use with: Standard SAC Alloys GC 3W The Game Changer Contents 1. Introduction: Basic Properties, Features & Benefits 2. Operating Parameters
User's Guide. CHARTrunner Lean. Version 1.0
 User's Guide CHARTrunner Lean Version 1.0 PQ Systems copyright notice Copyright 2006-2011 Productivity-Quality Systems, Inc. Productivity-Quality Systems, Inc. is also known as PQ Systems, Inc. All rights
B.2 Measures of Central Tendency and Dispersion
 Appendix B. Measures of Central Tendency and Dispersion B B. Measures of Central Tendency and Dispersion What you should learn Find and interpret the mean, median, and mode of a set of data. Determine
Math 120 Introduction to Statistics Mr. Toner s Lecture Notes 3.1 Measures of Central Tendency
 Math 1 Introduction to Statistics Mr. Toner s Lecture Notes 3.1 Measures of Central Tendency lowest value + highest value midrange The word average: is very ambiguous and can actually refer to the mean,
The Normal Probability Distribution. Goals. A distribution 2/27/16. Chapter 7 Dr. Richard Jerz
 The Normal Probability Distribution Chapter 7 Dr. Richard Jerz 1 2016 rjerz.com Goals Understand the difference between discrete and continuous distributions. Compute the mean, standard deviation, and
Critical Parameter Development & Management Process. Quick Guide
 Critical Parameter Development & Management Process Quick Guide By C.M. (Skip) Creveling President Product Development Systems & Solutions Inc. www.pdssinc.com 12 Steps for a Critical Parameter Development
Frequency Distributions
 Displaying Data Frequency Distributions After collecting data, the first task for a researcher is to organize and summarize the data so that it is possible to get a general overview of the results. Remember,
Normal Curves and Sampling Distributions
 Normal Curves and Sampling Distributions 6 Copyright Cengage Learning. All rights reserved. Section 6.2 Standard Units and Areas Under the Standard Normal Distribution Copyright Cengage Learning. All rights
STANDARDS OF LEARNING CONTENT REVIEW NOTES ALGEBRA I. 2 nd Nine Weeks,
 STANDARDS OF LEARNING CONTENT REVIEW NOTES ALGEBRA I 2 nd Nine Weeks, 2016-2017 1 OVERVIEW Algebra I Content Review Notes are designed by the High School Mathematics Steering Committee as a resource for
Mathematics Scope & Sequence Grade 7 Revised: June 2015
 Rational Numbers Mathematics Scope & Sequence 2015-16 Grade 7 Revised: June 2015 First Six Weeks (29 ) 7.3B apply and extend previous understandings of operations to solve problems using addition, subtraction,
Downloaded from
 UNIT 2 WHAT IS STATISTICS? Researchers deal with a large amount of data and have to draw dependable conclusions on the basis of data collected for the purpose. Statistics help the researchers in making
Connecticut Teacher Certification Process ARC II Program
 Connecticut Teacher Certification Process 2017-2018 ARC II Program Presentation to ARC Candidates : May 18, 2018 Edward M. O Connell, Dean Alternate Route to Certification ARC Recommendation for Certification
SigmaXL Feature List Summary, What s New in Versions 6.0, 6.1 & 6.2, Installation Notes, System Requirements and Getting Help
 SigmaXL Feature List Summary, What s New in Versions 6.0, 6.1 & 6.2, Installation Notes, System Requirements and Getting Help Copyright 2004-2013, SigmaXL Inc. SigmaXL Version 6.2 Feature List Summary
Before you start filling the forms online, you will be asked the following two preliminary questions:
 United States-India Educational Foundation 2015 FULBRIGHT FLTA PROGRAM Instructions for Completing the Fulbright Online FLTA Program Application Read all instructions carefully before completing the application