Manual on Wobble Analysis
|
|
|
- Dayna Blair
- 5 years ago
- Views:
Transcription
1 Manual on Wobble Analysis In Swathed
2 Index Index...2 Introduction Recognize Artefacts Unravel the data Make a DTM Open the data Swath editor Introduction Cross plot analyse in TimeSeries Photobook...23
3 Introduction The wobble analysis is an part of Swathed, the software of the Ocean Mapping Group. Swathed works under Linux. I recommend to read lecture 26, written by John Hughes Clarke, before even start on the wobble analysis tool. Lecture 26 can be found on To analyse data we ve to make a few steps. In this manual I will explain which steps have to be taken to make an analysis. Working with Swathed takes some time. Without experience it is hard to recognize artefacts. That s why I will explain each step, how we can recognize artefacts and how we can solve artefacts. Artefacts look like each other. But it is possible to recognize the difference artefacts. With the sun illumination technique, we can recognize artefacts better en sometimes we can even see what kind of artefact we re working with. In Swathed we can look at factors as across profiles, DTM, scatter plots and correlations, and with that find the cause of the artefact, find the size of the error and solve the error. From research we saw that the structure of the errors in lever arm definitions in across- and along track look like each other. The cause is different. In both cases the error, an induced heave error, will effect the whole swath. The whole swath will be (linear) lifted or lowered, depending on the motion of the ship like roll and pitch. On bigger ships is the chance on this kind of error bigger then on smaller ships. With a time-delay of the motion sensor and an yaw-misalignment, the errors look like each other while the cause here also is different. In both cases the error will have the biggest weight on the outer beams of the swath and the lowest weight on the inner beams. We talk about a linear tilt of the swath; one half of the swath will measure to deep and the other half will measure to shallow. An yaw-misalignment will cause crosstalk between roll and pitch. We can prevent from this error, to line up the motion sensor to the ships reference frame when we measure the ships reference frame (boat geometry).
4 We also saw that artefacts caused by incorrect Surface Sound Speed or due to an incorrect Sound Velocity Profile have both a different character. Artefacts caused by an incorrect Surface Sound Speed are not linear over the swath and make an linear tilt; one half of the swath will measure to deep and the other half will measure to shallow. With an incorrect Surface Sound speed the depth and across track error depends on the shape of the used multibeam echo sounder and on the motions of the ship at that moment. Artefacts caused by an wrong Sound Velocity Profile are also not linear over the swath, but are in phase! That will cause an smiley or an frown. An smiley is caused when there is used a to high sound velocity and a frown when there is used an to low sound velocity.
5 0.1 Recognize Artefacts In a DTM the Sun Illumination can come from different angles. We can recognize artefacts better or worse through different angles. According to Hughes Clarke, there are different types of artefacts. Linear tilted Types of Artefacts [Hughes Clarke, lecture 26] Linear up and down Not linear tilted, out of phase Not linear tilted, in phase
6 0.2 Unravel the data We can unravel raw data with hand, or by using an unravel script. If you re interested and want to learn the unravelling process, which I can recommend for the first times, unravel by hand. Guidelines to do this can be found on When you want to do it the easy way, you can use an unravel script. For the different multibeam systems we also need different scripts. Scripts made by Ocean Mapping Group can be downloaded on Right mouse click on the buttons and save in the directory were your raw files are. New_unravel.gz is for Simrad, new_xtf_unravel.gz is for Reson. Here I also found the following recommendations: A few rules, caveats and options that you'll have to customize in the script: 1. SIMRAD RAW FILES WARNING: You may need to modify the RT command for the sonar of choice (currently setup for EM3002). As of version 1.0.4, it will attempt to guess the model number, but the script is hardwired to support only a few sonars. 2. SIMRAD RAW FILES WARNING: You'll have to remove the -force_swap option from the RT command if the data was logged using the Unix based Merlin (instead of the new Windows based SIS, which is what this script assumes). As of version 1.0.4, this is no longer necessary as RT can decide the byte-ordering on it's own (but can still be forced to a certain order with -LE or -BE options). 3. RESON XTF FILES OPTION: You might need to change the sonar type for the xtf2omg_reson command (e.g. -sonar 8125) 4. RULE: It expects raw data to be in the 'raw' directory, all lowercase. It also expects a raw subdirectory, i.e. you can't yet shove the line data into the raw directory on its own (but this may be a useful future feature for quick n' dirty one day jobs).
7 To start unravelling simply type the next in your konsole or terminal in Linux: e.g. new_unravel raw/jd234/whatever*.all e.g. new_unravel raw/*/*.all e.g. new_unravel raw/*/*.all.gz Directories will automatically be created.
8 0.3 Make a DTM Start making a DTM. Then we can see if there are artefacts in the data. Look where and if there is an flat area in the DTM, we like to use a flat area for the analysis in Swathed. Area which we rather don t use for the analysis, are non flat area s or with objects like boulders or seegrass. Please show the steps 0.4 Open the data Maps To read data in Swathed, the data should be in *.merged format. There is a procedure to make from an *.xtf file an *.merged file. This can be found on Jonnies homepage, It is important to keep your maps organised, so you can easy work with them in Swathed. I would recommend to create make a folder with the following folders maps inside: DTM Maps Merged Raw SVP Start Swathed To start swathed, we have to give the link to the folder with the data. After that we have to give the lines which we want to be opened. We always open a *.merged file in Swathed. This line can be opened in Swathed to type the following in the terminal or console (example): Swathed mini merged/1998_jdxxx/0013_ _ merged
9 These commands mean: swathed start the program Swathed -mini gives a smaller screen (option) Merged/1998_JDxxx link to the correct folder we want to use 0013 merged link to the data we want to use

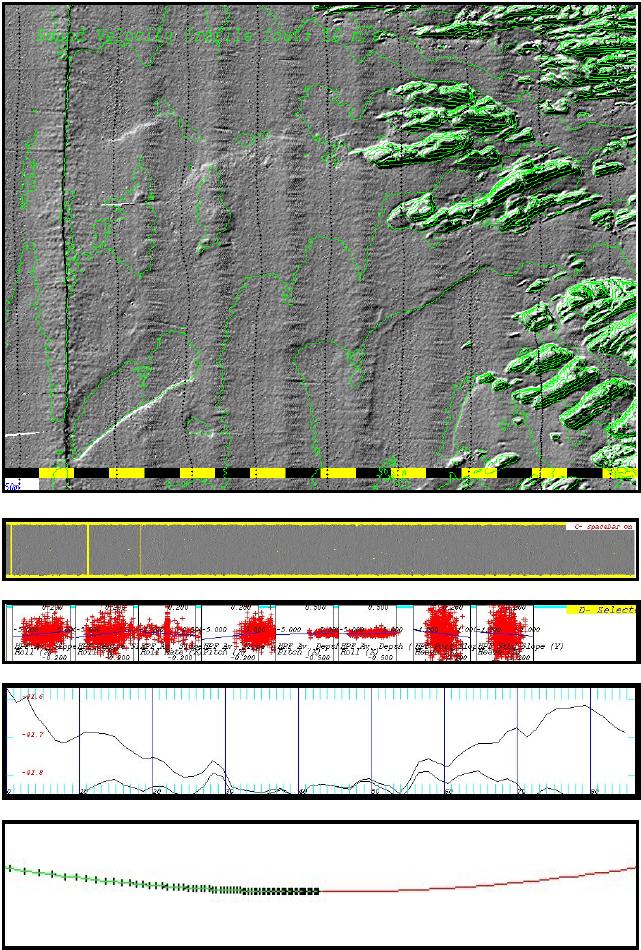
10 1 Swath editor 1.1 Introduction When we start Swathed, we will see the swath editor screen. In this screen there are 80 swaths visible. (figure)
11 Top view, in which the red dots are phase measurements and the bleu dots are amplitude measurements. With the left mouse button we can edit the data. There is one black dot, which we can move up down and left right. With this we can see where we are in the swath, in the other screens. Side view of the swath. Left is west, right is east. With mouse and keyboard we can move through the swaths (80). With the mouse in this screen, and press D (detrend), we can change the view more from the side or more from the top. In the screen we can also see the mean ping rate of the multibeam echosounder en de mean velocity of the ship. In this screen an artefact can become visible. Here we can see the heading, roll, pitch and heave, of the visible 80 Swaths. Compare this screen with the screen above it. Then we can see if the swath correlates with the movements of the ship, like roll, pitch or heave. Here we see the raw data. Back view of all swaths. With the mouse in this screen + V, IHO standards become visible. With the mouse in this screen + K, QMS standards become visible. Sun Illumination of the data. With the mouse in this screen + C, backscatter information becomes visible. With the mouse in the mint green part, and press the spacebar, we re going through the Swaths. 2.2 TimeSeries With the time series tool we can co an wobble analysis. I will explain this in, but now first explain the main features in the time series tool.

12 In time series we can make an analysis of the errors/offsets which are in an dataset. In the time series toos we can select four features and plot them in the bars. In the figure I selected slope fit, along sun map, roll and X plots A. Down in the time series tool, we can see all the selection options in the yellow buttons. To select a bar, you have to put your mouse in the bar and press the space bar. Then the bar is selected, and you can choose an option to press a yellow button. In the mint green bar you can select a part of the DTM at which you want to zoom in. This part you can select with your mouse. To put the selected area back in the original scale, you can put your mouse in the mint green bar and press A. Or press R for rescaling. In the graph bars, like for the roll, the vertical scale can also be edited. You can do this to put the mouse in the graph bar and press arrow up or arrow down on your keyboard.
 we can recognize an frown or an smile.")
13 2.3 Refraction Tool An error in sound velocity profile, can look like an frown or an smile. In the refraction tool (figure) we can recognize an frown or an smile. We can change the sound velocity, and see how big the sound velocity corrections should be to make a flat seafloor.
14 2 3.Cross plot analyse in TimeSeries 3.1. Select the following graphs/bars: Slope fit With slope fit we can look for an area suitable for the analysis. The blue line should be under the red line to make an proper analysis. With page up and page down we can change the value of the red line is a lineaire regression, witch is calculated with a standart equation with least squares. It is an percentage of the depth. In the example in the figure we can see a suitable area for an analysis on the left side, cause the blue line is under the red line. Hpf across slope In the Hpf across slope bar (figure) the blue part is within 0.25 en thus is suitable for the analysis. Yellow is the part which in the slope fit bar above the red line, and thus not suitable for the analyse. So the blue part on the left side is suitable for the analyse. Sun illumination along track In Along Sun Map (figure) we can select an DTM in sun illumination. This is the DTM of one line. Motion With a bar with the motion of the ship, like roll, pitch or heave (figure), we can compare the motion with hpf across slope, hpf average depth or the sun illumination along track, to see if there is any correlation between the motion and the artefacts.
 and the columns the type of movement at that moment (i till viii) roll, pitch, heave or roll rate.")
15 Cross plots With cross plots (figure) we can recognize what the cause of an artefact is. In the next figure we can see all cross plots given in lecture 26. The rows give the type of error (A till G) and the columns the type of movement at that moment (i till viii) roll, pitch, heave or roll rate. In every cross plot with a circle around in the figure, we can recognize an type of error. By every type of error we can see a change in one or two crossplots. There will exist a slope, except at Gii. To this slope we can recognize errors. I will now describe the different types of error. In a cross plot we can see a linear regression which is made out of different scatter plots. The slope of the linear regression shows us the size of the error. In each cross plot there is a correlation with HPF across track slope or HPF mean depth. Which one is used in a cross plot is shown in the cross plot. In each cross plot is also horizontal shown how big the motion of the ship is in that cross plot. Vertical is shown how big the HPF slope or the HPF mean depth is.
16 3.2 Characteristics of errors shown in cross plots (A)Motion scale Type I An error in motion scale will cause artefacts of type I. The HPF (high pass filtered) across track error will correlate with the roll. So only when a ship has a roll motion, and there is an error in motion scale, there will occur artefacts. The slope of the inner beams is the same as the slope of the outer beams. An error in motion scale is not really 2007, so we won t see this much or not at all anymore. (B)Time delay Type I When there is an time delay, this will cause artefacts if there s also an roll rate. Then there can exist artefacts of type I. With an error in time-delay the HPF across slope will correlate with the roll rate. (C)Yaw Misalignment Type I An Yaw misalignment can cause artefacts of Type I. With an yaw misalignment the HPF accros slope correlates with the pitch. So only when the ship has a pitch motion, an yaw misalignment will cause artefacts. (D)X lever arm error Type II An error in the x-lever arm can cause artefacts of Type II. In this error the HPF mean depth will correlate with pitch. When the ship makes a pitch motion, and there is an offset in the X lever arm, this can cause artefacts. (E)Y lever arm error Type II An error in the Y lever arm can cause artefacts of Type II. In this error the HPF mean depth will correlate with the roll. When the ship make a roll motion, and there is an offset in the Y lever arm, this can cause artefacts.
17 (F)Surface Sound Type IV Port and starboard HPF slope correlates the same in speed gradient and in opposite directions with heave (transducer depth) (G) Surface Sound Type III A wrong sound velocity profile can cause artefacts of Type III. In this type of error the HPF across slope correlates with roll.
18 3.3 Correlations Each type of error has to do with correlations. The correlations of each error will look like this: (B) Time-delay Type I, HPF across slope correlates with roll rate (C) Yaw Misalignment Type I, HPF across slope correlates with pitch
19 (D) X lever arm error Type II, HPF mean depth correlates with pitch (E) Y lever arm error Type II, HPF mean depth correlates with roll
20 (F) Surface Sound Type IV, correlation with heave (G) Surface Sound Type III, HPF across slope correlates with roll

21 3.4 Remove an artefact I explained now how we can recognize an artefact in Swathed. We can now try to get rid of the artefact or mimimize the artefact. When we now in which scatter plot the artefact is, we can change the error with the upper bars. We can remove an artefact like this. Make sure you opened the bar with the crossplots. And open with the yellow buttons the menu FFT & Xplots (figure). With this menu we can determine how big the error is. For example if there is an error in the x lever arm, then we ve to make the value of the x-lever arm so that the slope in the FFT & Xplots -1 is, or as close as possible to -1. When the slope (almost) -1 is, that will be the correct value of the x lever arm. The slope has to be -1 to remove or minimize an error, is for an error in the x lever arm, an error in y lever arm, a time delay, an SSS error and a SSS gradient. For an error in yaw misalignment the slope should be to remove or minimize this error. With apply fix the change is applied, and we can control this to see in the DTM if the artefacts are gone or minimized.
22

23 3 Photobook 4.1 Error in X-lever arm of 2 meters
24 This figure shows us an DTM with nine sailing lines. The sailing lines are shown with the dotted lines. In the DTM we introduced an systematic error in the x lever arm of 2 meters The effect of this error is an artefact over the whole width of the swath (type II). The whole swath will be lifted or lowered. This error becomes more clear with pitch motions and a flat seafloor. Here are two profiles of the line given; the lowest line gives the profile without error in the x lever arm. In the upper line is with an error of 2 meter in the x lever arm. Just like as in the DTM we can see that an error in the x lever arm affects the whole swath. This effect is everywhere in the swath the same. The difference in depth between these two swaths is about 20 cm. In the scatter plots we can see that the line in the scatter plot has a slope: HPF average depth correlates with the pitch. This means that there is an error in the x lever arm.
25 Here is a part of one line given. This DTM uses sun-illlumination. Under the DTM is the pitch given at the same moment of the DTM. In this DTM we can see the influence of the pitch on the x lever arm. Because when there is a bigger pitch there are also more clear artefacts in the DTM.

26 4.2 Error in Y-lever arm of 2 meters
27 In this DTM we introduced a synthetic error in the y lever arm of two meters. The effect of this error is an artefact over the whole width of the swath. The whole swath is lifted or lowered. This means that the artefact is of type II. This DTM looks like the DTM with the error in the x lever arm. Only this error becomes visible with a roll motion. Here is one line out of the DTM in sun illumination given. Under the DTM the roll is showed at the moment of the DTM. In the DTM we can see the influence of the roll on the y lever arm. When there is roll, we can clearly see artefacts in the DTM. In the scatter plots we can see that the line in the scatter plot has a slope: HPF average depth correlates with the roll. This means that there is an error in the y lever arm. Here are two profiles of the line shown; one gives a profile without error in the y lever arm, the other gives a profile with an error of 2 meters in the y lever arm. Which profile is deeper depends on the roll (if the roll is positive or negative). Just as in the DTM we can see that an error in the Y lever arm affects the whole swath. The effect is the same everywhere in the swath and the difference in depth is about 10 cm.

28 4.3 Roll delay of 35 ms
29 In this DTM we introduced an synthetic time-dealy of 35 milliseconds. Effect of this error are linear artefacts with a slope over the swath (type I). The outer beams have the biggest error. We can see this in the DTM; the more the swath comes to the outer beams, the more the artefacts are visible. One half of the swath is measured to deep and the other half to shallow. In the yellow border we can see this through the shadow. The error becomes visible by changes in roll rate and a flat seafloor. Here is an DTM given. It is an zoomed part of the sailing line. Under the DTM is the roll rate given at that moment. In the DTM we can see that the roll rate influenced the Y lever arm. When the roll rate gets bigger (positive or negative), we can clearly see artefacts in the DTM. In the scatter plot we see that the (graph of the) scatter plot has an slope: HPF average slope correlates with the roll rate. This means that there is an error in the x lever arm. In this profile of the sailing line is is not so clear to see that the artefact is an type I. We can see in the profile that both swaths cross each other several times. This means that the error has to be an type I of an type 3. Because the swaths are linear, it has to be type 1.

30 4.3 Yaw misalignment of 4 degrees
31 In this DTM we introduced an synthetic yaw misalignment of 4 degrees. A yaw misalignment can be caused through crosstalk. The effect of yaw misalignment are artefacts which are lineair and have a slope over the swath (type I). The outer beams have the biggest errors. We can see this in the DTM; the more to the outside of the swath, the more visible are the artefacts. One half of the swath is measured to deep and the other half is measured to shallow. We can see this at some point through the shadow. This error becomes visible by changes in pitch and a flat seafloor. Here is an DTM given. It is an zoomed part of the sailing line. Under the DTM is the pitch given at that moment of the DTM. In the DTM we can see that when the pitch is bigger (positive), artifacts also appear. In the scatterplot we can see that the (graph of the) scatterplot has a slope: HPF average Slope correlates with pitch. This means that there is an yaw misalignment. Here are two profiles given of the sailing line; one fives the profile without yaw misalignment, the other gives a profile with yaw misalignment of 4 degrees. The swaths cross each other in the middle of the swath. This is correct, because at the swath with an yaw misalignment is the middle of the swath the only point that measures the correct depth. One half is measured to deep, the other half measured to shallow.
32 4.5 Systematic error in Sound Velocity Profile of 10 m/s s
33
34 In the DTM we introduced an synthetic error of 10 m/s in the sound velocity profile. The effect of this error are artefacts which are not linear and not in phase over the swath (type IV). The outer beams have the biggest errors. We can see this in the DTM; the more the swath comes more to the outer beams, the better we can see the artefacts. This error becomes visible with changes in picth and a flat seafloor. With an error in the sound velocity profile the whole bottom can be lowered of lifted. We can see this on the contour lines. This is an zoomed part of the sailing line. We can see ribbles on the outer sides of the swath. From the scatter plots we cannot see clearly an error; all plots are more ore less horizontal. So it could be an error in the Sound Velocity Profile. Here are two profiles given; the lower line is the swath without error in SVP, the upper line is an error in SVP of 10 m/s. It is clear that there is quite a big smiley. In the refraction tool, when we look at the swath from the front, we can clearly see an smiley. So it could be an error in the SVP. When we try an higher value in the refraction tool, the smiley even gets bigger. When we try an lower value the smiley disappears. This means that the used SVP is too high. We can replay the measurement with an corrected sound velocity profile..
35 4.6 Surface Sound Speed error of 10 m/s
36
37 In this DTM we introduced an synthetic error om 10 m/s in the surface sound speed. We can see small ribbles on the outer sides of the swath, which get smaller to the middle of the swath. This data is measured with an EM3000. The EM3000 is an flat array. This means that all beams are steered. When there is an error in the SSS with an flat array, this should be visible over the whole width of the swath. The error should theoretical be bigger at the outer beams and smaller at the inner beams. When the next layer in the sound velocity profile was correctly used, we introduce the Don Dinn effect; the error won t bet bigger or even gets minimized. Here is an DTM given. It is an zoomed part of the sailing line. Under the DTM the roll is given for that moment. In the DTM we can see that the ribbles come to the middle of the swath. Also we can see that there is correlation with the roll. Here are two profiles given; the lower line is the swath without error in the SSS, the middle line has an error in SSS of 10 m/s and the upper line has an error in SSS of 20 m/s. We can see that the outer beams go up, but the difference is minimal. The swath in the refraction tool. The swath is quite flat. The conclusion is that an error in SSS has a minimal influence on the swath when there is measured till a depth of 20 meters with an error in SSSS of about 10 m/s. In the scatterplot we can see that the (graph of the) scatterplot has an slope: HPF average slope an HPF centre slope. Both have correlations with the roll. This means that there is an error in the surface sound speed.
GEOACOUSTICS GEOSWATH PLUS DATA PROCESSING WITH CARIS HIPS 8.1
 GEOACOUSTICS GEOSWATH PLUS DATA PROCESSING WITH CARIS HIPS 8.1 IN SUPPORT OF SANDY SUPPLEMENTAL RESEARCH Val Schmidt and Kevin Jerram University of New Hampshire Center for Coastal and Ocean Mapping Sunken
Patch Test & Stability Check Report
 Patch Test & Stability Check Report Storebælt, 2009 SB Cable Project CT Offshore Final Report November, 2009 SB Cable Project November 2009 8-10 Teglbaekvej DK-8361 Hasselager Aarhus, Denmark Tel: +45
Perspective-MB. -- Bathymetry Processing Guide. Kongsberg.ALL Addendum
 Perspective-MB -- Bathymetry Processing Guide Kongsberg.ALL Addendum By: Tony M. Ramirez November, 2013 Triton Imaging Inc. Engineering Office 2121 41 st Avenue, Suite 211 Capitola, CA 95010 USA +1-831-722-7373
Checking the values using backscatter data
 A Technique for using Backscatter Imagery to Calibrate your Multibeam sonar Harold Orlinsky Harold@Hypack.com Checking the values using backscatter data The collection of Backscatter is co located with
Ocean High Technology Institute, Inc. Tadahiko Katsura Japan Hydrographic Association
 Technical Aspects of Marine Scientific Research for Continental Shelf Outer Limits: Advanced Method of Multi-beam Data Processing to Obtain Detailed and Precise Bathymetry Yasutaka Yokoi Ocean High Technology
The Results of Limiting MRU Updates In Multibeam Data by Pat Sanders, HYPACK, Inc.
 The Results of Limiting MRU Updates In Multibeam Data by Pat Sanders, HYPACK, Inc. Abstract: Some Motion Reference Units (MRUs) can deliver heave- pitch- roll data at rates up to 100Hz. This paper investigates
Geocoder: An Efficient Backscatter Map Constructor
 Geocoder: An Efficient Backscatter Map Constructor Luciano Fonseca, Brian Calder Center for Coastal and Ocean Mapping, University of New Hampshire Durham, NH 03824 ABSTRACT: The acoustic backscatter acquired
EM 120 Multibeam Echosounder
 EM 120 Multibeam Echosounder The EM 120 multibeam echosounder from Kongsberg was used for bathymetric surveying. The system has an operating frequency of 12 khz, suitable for deep ocean waters, and 191
Teledyne PDS. Multibeam Calibration. Version January Teledyne RESON B.V. Stuttgartstraat AS Rotterdam The Netherlands
 Multibeam Calibration Teledyne PDS Version 2.0.4 January 2017 Teledyne RESON B.V. Stuttgartstraat 42-44 3047 AS Rotterdam The Netherlands Tel.: +31 (0)10 245 15 00 www.teledyne-reson.com Teledyne RESON
New Method for the Removal of Refraction Artifacts in Multibeam Echosounders Systems
 New Method for the Removal of Refraction Artifacts in Multibeam Echosounders Systems Edouard Kammerer John E. Hughes Clarke Ocean Mapping Group - University of New Brunswick Contact: kammerer@omg.unb.ca
Real-time Monitoring of
 Real-time Monitoring of Uncertainty due to Refraction in Multibeam Echosounding J. Beaudoin Ocean Mapping Group University of New Brunswick Oct. 21 st 2008 Shallow Survey 2008 1 Introduction CSL Heron
CSC 101: Lab #7 Digital Audio Due Date: 5:00pm, day after lab session
 CSC 101: Lab #7 Digital Audio Due Date: 5:00pm, day after lab session Purpose: The purpose of this lab is to provide you with hands-on experience in digital audio manipulation techniques using the Audacity
Comparision of Target Detection Capabilities of the Reson Seabat 8101 and Reson Seabat 9001 Multibeam Sonars
 Comparision of Target Detection Capabilities of the Reson Seabat 8101 and Reson Seabat 9001 Multibeam Sonars by Robert Sean Galway For: Dr. John Hughes-Clarke Course: Multibeam Sonar Theory Dept: of Geodesy
Real time 3D display of hydrographic data for QA and QC.
 Real time 3D display of hydrographic data for QA and QC. Roland Arsenault Center for Coastal and Ocean Mapping & Joint Hydrographic Center University of New Hampshire roland@ccom.unh.edu Figure 1 Data
To Measure a Constant Velocity. Enter.
 To Measure a Constant Velocity Apparatus calculator, black lead, calculator based ranger (cbr, shown), Physics application this text, the use of the program becomes second nature. At the Vernier Software
Further Maths Notes. Common Mistakes. Read the bold words in the exam! Always check data entry. Write equations in terms of variables
 Further Maths Notes Common Mistakes Read the bold words in the exam! Always check data entry Remember to interpret data with the multipliers specified (e.g. in thousands) Write equations in terms of variables
( 83P UDP/IP Ethernet Datagram,.83P File Format )
") IMAGENEX TECHNOLOGY CORP. DeltaT - 83P PROFILE POINT OUTPUT ( 83P UDP/IP Ethernet Datagram,.83P File Format ) For each ping, the following bytes are output during the 83P UDP datagram. If recording to
IMAGENEX TECHNOLOGY CORP. DeltaT - 83P PROFILE POINT OUTPUT ( 83P UDP/IP Ethernet Datagram,.83P File Format ) For each ping, the following bytes are output during the 83P UDP datagram. If recording to
3D Programming. 3D Programming Concepts. Outline. 3D Concepts. 3D Concepts -- Coordinate Systems. 3D Concepts Displaying 3D Models
 3D Programming Concepts Outline 3D Concepts Displaying 3D Models 3D Programming CS 4390 3D Computer 1 2 3D Concepts 3D Model is a 3D simulation of an object. Coordinate Systems 3D Models 3D Shapes 3D Concepts
Latest Developments in Bathymetric Data Processing and its Application to Sandwave Detection
 Latest Developments in Bathymetric Data Processing and its Application to Sandwave Detection Ottokarl Büchsenschütz-Nothdurft (1), Mark J. Pronk (1), and L. Hans van Opstal (1) (1) CARIS Geographic Information
GEOMETRIC AND RADIOMETRIC CORRECTION OF MULTIBEAM BACKSCATTER DERIVED FROM RESON 8101 SYSTEMS
 GEOMETRIC AND RADIOMETRIC CORRECTION OF MULTIBEAM BACKSCATTER DERIVED FROM RESON 8101 SYSTEMS Beaudoin, J.D. 1, Hughes Clarke, J.E. 1, Van Den Ameele, E.J. 2 and Gardner, J.V. 3 1: Ocean Mapping Group
SHALLOW SOUNDING BATHYMETRIC USING MULTIBEAM ECHOSOUNDER AND TOPOGRAPHIC LASER SCANNER
 SHALLOW SOUNDING BATHYMETRIC USING MULTIBEAM ECHOSOUNDER AND TOPOGRAPHIC LASER SCANNER BY : NURSUGI, TRI PATMASARI & KHAFID GEOSPASIAL INFORMATION AGENCY AMSTERDAM, 11-14 NOVEMBER 2014 Indonesia coastline
Prepared for: CALIFORNIA COAST COMMISSION c/o Dr. Stephen Schroeter 45 Fremont Street, Suite 2000 San Francisco, CA
 REVIEW OF MULTIBEAM SONAR SURVEYS WHEELER REEF NORTH, SAN CLEMENTE, CALIFORNIA TO EVALUATE ACCURACY AND PRECISION OF REEF FOOTPRINT DETERMINATIONS AND CHANGES BETWEEN 2008 AND 2009 SURVEYS Prepared for:
APPLICATION OF SURFACE SOUND SPEED MEASUREMENTS IN POST- PROCESSING FOR MULTI-SECTOR MULTIBEAM ECHOSOUNDERS ABSTRACT INTRODUCTION
 APPLICATION OF SURFACE SOUND SPEED MEASUREMENTS IN POST- PROCESSING FOR MULTI-SECTOR MULTIBEAM ECHOSOUNDERS Beaudoin, J.D. 1, Hughes Clarke, J.E. 1, and Bartlett, J.E. 2 1: Ocean Mapping Group (OMG), University
XYZ Exporter Page 1. XYZ Exporter
 XYZ Exporter Page 1 XYZ Exporter XYZ Exporter Page 2 1. Introduction This program was created to takeover from NaviScan Convert. It has the capability to export to various formats, where you have the possibility
Getting Started with Crazy Talk 6
 Getting Started with Crazy Talk 6 Crazy Talk 6 is an application that generates talking characters from an image or photo, as well as facial animation for video. Importing an Image Launch Crazy Talk and
GG 710S - Remote Sensing in Submarine Environments Lecture 4 Introduction to Sidescan Processing
 GG 710S - Remote Sensing in Submarine Environments Lecture 4 Introduction to Sidescan Processing Scenario: You ve been given a file of sidescan data to process. Where to begin? There are lots of ways to
GG450 4/5/2010. Today s material comes from p and in the text book. Please read and understand all of this material!
 GG450 April 6, 2010 Seismic Reflection I Today s material comes from p. 32-33 and 81-116 in the text book. Please read and understand all of this material! Back to seismic waves Last week we talked about
CARIS HIPS & SIPS 8.0 Manual
 MGEO 2014 CARIS HIPS & SIPS 8.0 Manual For Hydrography & Survey Use. 0 Tiffany Schnare www.geo-tiff.com MGEO 2014 Brian Pyke May 30, 2013 Foreward The following document was produced with the Marine Geomatics
Teledyne PDS. Trailing Suction Hopper. Version April Teledyne RESON B.V. Stuttgartstraat AS Rotterdam The Netherlands
 Trailing Suction Hopper Teledyne PDS Version 1.1.0 April 2017 Teledyne RESON B.V. Stuttgartstraat 42-44 3047 AS Rotterdam The Netherlands Tel.: +31 (0)10 245 15 00 www.teledyne-reson.com Teledyne RESON
Laser Machine User Manual:
 Laser Machine User Manual: OPERATOR ( EasyCut / LaserCut version 5.3 ) v1.0 CTR Laser Machine Operator Manual ( EasyCut version 5.3 ) ~ version 1.0 1 CONTENTS Section 1: Tutorials...5 1.1. How to Cut with
SonarWiz Quarterly Highlights Detail Q1
 SonarWiz Quarterly Highlights Detail - 2016 Q1 Revision 1.0,4/13/2016 Chesapeake Technology, Inc. email: support@chesapeaketech.com Main Web site: http://www.chesapeaketech.com Support Web site: http://www.chestech-support.com
QINSy. A Total Hydrographic Solution!
 QINSy A Total Hydrographic Solution! QINSy provides a user-friendly, turnkey solution for all types of marine navigation, positioning and surveying activities. From survey planning, to data collection,
Earthwork 3D for Dummies Doing a digitized dirt takeoff calculation the swift and easy way
 Introduction Earthwork 3D for Dummies Doing a digitized dirt takeoff calculation the swift and easy way Getting to know you Earthwork has inherited its layout from its ancestors, Sitework 98 and Edge.
New demands on the modeling of the continental shelf require the need for 3D graphics connected to seismic interpretation of seabed sediments.
 A New Approach to Mapping of the Continental Shelf Olav Egeland Manager of GeoCap AS, Norway. Website: www.geocap.no Email: olav.egeland@geocap.no Abstract New demands on the modeling of the continental
Pre-Lab Excel Problem
 Pre-Lab Excel Problem Read and follow the instructions carefully! Below you are given a problem which you are to solve using Excel. If you have not used the Excel spreadsheet a limited tutorial is given
O Hailey: Chapter 3 Bonus Materials
 O Hailey: Chapter 3 Bonus Materials Maya s Toon Line For those familiar with toon lines in Maya, you may skip ahead past this section. Those not familiar might find it useful to understand the basics of
Math 121 Project 4: Graphs
 Math 121 Project 4: Graphs Purpose: To review the types of graphs, and use MS Excel to create them from a dataset. Outline: You will be provided with several datasets and will use MS Excel to create graphs.
Designing Simple Buildings
 Designing Simple Buildings Contents Introduction 2 1. Pitched-roof Buildings 5 2. Flat-roof Buildings 25 3. Adding Doors and Windows 27 9. Windmill Sequence 45 10. Drawing Round Towers 49 11. Drawing Polygonal
Capstone Appendix. A guide to your lab computer software
 Capstone Appendix A guide to your lab computer software Important Notes Many of the Images will look slightly different from what you will see in lab. This is because each lab setup is different and so
Graphing Interface Overview
 Graphing Interface Overview Note: This document is a reference for using JFree Charts. JFree Charts is m-power s legacy graphing solution, and has been deprecated. JFree Charts have been replace with Fusion
3. Map Overlay and Digitizing
 3. Map Overlay and Digitizing 3.1 Opening Map Files NavviewW/SprayView supports digital map files in ShapeFile format from ArcView, DXF format from AutoCAD, MRK format from AG-NAV, Bitmap and JPEG formats
CGWAVE Analysis SURFACE WATER MODELING SYSTEM. 1 Introduction
 SURFACE WATER MODELING SYSTEM CGWAVE Analysis 1 Introduction This lesson will teach you how to prepare a mesh for analysis and run a solution for CGWAVE. You will start with the data file indiana.xyz which
After completing each task, be sure to save the file in the My Documents folder on your computer using the suggested name.
 PowerPoint Basic PPT2K13B Final Assignment This is the final assignment for the PowerPoint Basic course. Before attempting to complete this evaluation, you should have completed all Lessons Presentations,
Word 3 Microsoft Word 2013
 Word 3 Microsoft Word 2013 Mercer County Library System Brian M. Hughes, County Executive Action Technique 1. Insert a Text Box 1. Click the Insert tab on the Ribbon. 2. Then click on Text Box in the Text
Chemistry Excel. Microsoft 2007
 Chemistry Excel Microsoft 2007 This workshop is designed to show you several functionalities of Microsoft Excel 2007 and particularly how it applies to your chemistry course. In this workshop, you will
Getting Started with Silo
 CHAPTER 1 Getting Started with Silo In this chapter, we discuss how to view, select, and manipulate models in Silo. If you are not familiar with Silo or polygon modeling, make sure to read the About Silo
v Data Visualization SMS 12.3 Tutorial Prerequisites Requirements Time Objectives Learn how to import, manipulate, and view solution data.
 v. 12.3 SMS 12.3 Tutorial Objectives Learn how to import, manipulate, and view solution data. Prerequisites None Requirements GIS Module Map Module Time 30 60 minutes Page 1 of 16 Aquaveo 2017 1 Introduction...
LAB 2: DATA FILTERING AND NOISE REDUCTION
 NAME: LAB TIME: LAB 2: DATA FILTERING AND NOISE REDUCTION In this exercise, you will use Microsoft Excel to generate several synthetic data sets based on a simplified model of daily high temperatures in
Operator Manual. M3 Sonar. Portable Hydrographic System
 Operator Manual M3 Sonar Portable Hydrographic System M3 Sonar Portable Hydrographic System (PHS) Operator Manual Release 1.0 This manual provides you with the basic information required to operate the
Author s Name Name of the Paper Session. DYNAMIC POSITIONING CONFERENCE October 12-13, 2010 SENSORS SESSION
 Author s Name Name of the Paper Session DYNAMIC POSITIONING CONFERENCE October 12-13, 21 SENSORS SESSION and accurate transformation of acceleration over long lever arms on large vessels method, test results
Software for Hydrographic Data Processing
 Software for Hydrographic Data Processing Data courtesy of Dr. T. Komatsu, Tokyo University Ocean Research Institute CleanSweep provides a fast, user friendly environment for processing hydrographic survey
1.1.1 Orientation Coordinate Systems
 1.1.1 Orientation 1.1.1.1 Coordinate Systems The velocity measurement is a vector in the direction of the transducer beam, which we refer to as beam coordinates. Beam coordinates can be converted to a
How do you roll? Fig. 1 - Capstone screen showing graph areas and menus
 How do you roll? Purpose: Observe and compare the motion of a cart rolling down hill versus a cart rolling up hill. Develop a mathematical model of the position versus time and velocity versus time for
Easy View Manual Nicolaudie-Sunlite
 1989-2004 Nicolaudie-Sunlite Table of Contents Part I Preface Part II 3D Visualizer 1 2... 2 1 First steps Menu... 2 Toolbar... 3 Mouse move... 4... 5 2 3D stage Your first stage... 5... 7 3 Stage settings
Getting Started with ShowcaseChapter1:
 Chapter 1 Getting Started with ShowcaseChapter1: In this chapter, you learn the purpose of Autodesk Showcase, about its interface, and how to import geometry and adjust imported geometry. Objectives After
Atomic Force Microscope
 Atomic Force Microscope Preparation Before our first appointment to use the microscope, please watch the video tutorials at https://www.afmworkshop.com/atomic-force-microscope-animated-tutorials/. The
Alignment of Centimeter Scale Bathymetry using Six Degrees of Freedom
 Alignment of Centimeter Scale Bathymetry using Six Degrees of Freedom Ethan Slattery, University of California Santa Cruz Mentors: David Caress Summer 2018 Keywords: point-clouds, iterative closest point,
Image Quality. HP DesignJet CP Series Printers 6-1
 6 HP DesignJet CP Series Printers 6-1 Troubleshooting Checklist When faced with an problem, use the following checklist as a guide in troubleshooting the problem: 1 Problem reproduction Reproduce the problem
Data Visualization SURFACE WATER MODELING SYSTEM. 1 Introduction. 2 Data sets. 3 Open the Geometry and Solution Files
 SURFACE WATER MODELING SYSTEM Data Visualization 1 Introduction It is useful to view the geospatial data utilized as input and generated as solutions in the process of numerical analysis. It is also helpful
GeoTide Predictor User Guide
 GeoTide Predictor GeoTide Predictor User Guide The software described in this document is provided under licence and may only be used in accordance with the terms of the agreement. Whilst every attempt
WinADCP User s Guide. P/N (November 2001) RD Instruments Acoustic Doppler Solutions
 RD Instruments Acoustic Doppler Solutions") WinADCP User s Guide P/N 957-6158-00 (November 2001) RD Instruments Acoustic Doppler Solutions Table of Contents 1 Introduction... 1 1.1 System Requirements...1 1.2 Software Installation...2 2 Using WinADCP...
WinADCP User s Guide P/N 957-6158-00 (November 2001) RD Instruments Acoustic Doppler Solutions Table of Contents 1 Introduction... 1 1.1 System Requirements...1 1.2 Software Installation...2 2 Using WinADCP...
DW Tomo 8.1 User Guide
 DW Tomo 8.1 User Guide Copyright 2016, All rights reserved. Table of Contents Preface...1 Conventions Used in This Guide...1 Where to Find Information...1 Technical Support...2 Feedback...2 Chapter 1 Introducing
Modeling the effect of oceanic internal waves on the accuracy of multibeam echosounders
 Modeling the effect of oceanic internal waves on the accuracy of multibeam echosounders Travis John Hamilton (1) (1), (2) and Jonathan Beaudoin (1) Ocean Mapping Group, University of New Brunswick (2)
4. Generating a Relief
 ArtCAM Pro 5.5 Relief. The 3D model created by ArtCAM Pro is called a Relief and is shown in the 3D View. The Relief is defined by a resolution in a similar way to a bitmap image. But, instead of each
No Brain Too Small PHYSICS
 Level 3 Physics: Demonstrate understanding of Waves Waves Behaviour - Answers In 203, AS 9523 replaced AS 90520. The Mess that is NCEA Assessment Schedules. In AS 90520 there was an Evidence column with
CFP migration; practical aspects
 13 CFP migration; practical aspects Jan Thorbecke 1 13.1 Introduction In the past year the Common Focus Point (CFP) technology has become an important paradigm in the DELPHI research program. The interpretation
VirMuF Manual V 0.5 1
 VirMuF Manual V 0.5 1 Contents Overview... 3 How it Works... 3 Installation... 3 Usage... 4 Navigation... 4 Inspection... 5 Information... 6 Measure... 6 Cross Section... 7 Light... 8 Related Web Links...
Logger Pro Resource Sheet
 Logger Pro Resource Sheet Entering and Editing Data Data Collection How to Begin How to Store Multiple Runs Data Analysis How to Scale a Graph How to Determine the X- and Y- Data Points on a Graph How
Symbol for Windows Shuffle
 Handicom Symbol for Windows Shuffle (Version 4) Handicom, 2011, The Netherlands Content 1. Introduction...2 1.1 What is Shuffle?...2 1.2 System requirements...2 1.3 Installation...2 2. Open, save and play
Two-Dimensional Projectile Motion
 Two-Dimensional Projectile Motion I. Introduction. This experiment involves the study of motion using a CCD video camera in which a sequence of video frames (a movie ) is recorded onto computer disk and
v SMS 11.1 Tutorial Data Visualization Requirements Map Module Mesh Module Time minutes Prerequisites None Objectives
 v. 11.1 SMS 11.1 Tutorial Data Visualization Objectives It is useful to view the geospatial data utilized as input and generated as solutions in the process of numerical analysis. It is also helpful to
Note: Photoshop tutorial is spread over two pages. Click on 2 (top or bottom) to go to the second page.
 to go to the second page.") Introduction During the course of this Photoshop tutorial we're going through 9 major steps to create a glass ball. The main goal of this tutorial is that you get an idea how to approach this. It's not
Introduction During the course of this Photoshop tutorial we're going through 9 major steps to create a glass ball. The main goal of this tutorial is that you get an idea how to approach this. It's not
Teledyne PDS. Cutter Dredge. Version March Teledyne RESON B.V. Stuttgartstraat AS Rotterdam The Netherlands
 Cutter Dredge Teledyne PDS Version 2.1.1 March 2017 Teledyne RESON B.V. Stuttgartstraat 42-44 3047 AS Rotterdam The Netherlands Tel.: +31 (0)10 245 15 00 www.teledyne-reson.com Teledyne RESON has made
Qimera 1.5 FAQ 30 October 2017
 30 October 2017 1. Qimera FAQ.......................................................................................... 3 1.1 Qimera General...................................................................................
Operator Manual SIS. Seafloor Information System
 Operator Manual SIS Seafloor Information System Seafloor Information System SIS Operator Manual Release 3.6 164709/G September 2009 Document history Document number: 164709 Rev. F April 2007 Operator
Introduction to Google SketchUp
 Introduction to Google SketchUp When initially opening SketchUp, it will be useful to select the Google Earth Modelling Meters option from the initial menu. If this menu doesn t appear, the same option
COMP : Practical 6 Buttons and First Script Instructions
 COMP126-2006: Practical 6 Buttons and First Script Instructions In Flash, we are able to create movies. However, the Flash idea of movie is not quite the usual one. A normal movie is (technically) a series
Background on Kingdom Suite for the Imperial Barrel Competition 3D Horizon/Fault Interpretation Parts 1 & 2 - Fault Interpretation and Correlation
 Background on Kingdom Suite for the Imperial Barrel Competition 3D Horizon/Fault Interpretation Parts 1 & 2 - Fault Interpretation and Correlation Wilson (2010) 1 Fault/Horizon Interpretation Using Seismic
Project 11 Graphs (Using MS Excel Version )
") Project 11 Graphs (Using MS Excel Version 2007-10) Purpose: To review the types of graphs, and use MS Excel 2010 to create them from a dataset. Outline: You will be provided with several datasets and will
Project 11 Graphs (Using MS Excel Version 2007-10) Purpose: To review the types of graphs, and use MS Excel 2010 to create them from a dataset. Outline: You will be provided with several datasets and will
1 Introduction to Using Excel Spreadsheets
 Survey of Math: Excel Spreadsheet Guide (for Excel 2007) Page 1 of 6 1 Introduction to Using Excel Spreadsheets This section of the guide is based on the file (a faux grade sheet created for messing with)
INS aided subsurface positioning for ROV surveys
 INS aided subsurface positioning for ROV surveys M. van de Munt, Allseas Engineering B.V., The Netherlands R van der Velden, Allseas Engineering B.V., The Netherlands K. Epke, Allseas Engineering B.V.,
animation, and what interface elements the Flash editor contains to help you create and control your animation.
 e r ch02.fm Page 43 Wednesday, November 15, 2000 8:52 AM c h a p t 2 Animating the Page IN THIS CHAPTER Timelines and Frames Movement Tweening Shape Tweening Fading Recap Advanced Projects You have totally
Frequency Distributions
 Displaying Data Frequency Distributions After collecting data, the first task for a researcher is to organize and summarize the data so that it is possible to get a general overview of the results. Remember,
ROTOSCOPING AND MATTE PAINTING In Blender v2.48a
 In the world of Visual Effects, Rotoscoping, Matte Painting and Garbage Painting are necessary and complementary functions. They are used each time a cut-out in the image is necessary, to remove a background
Excel 2013 Intermediate
 Instructor s Excel 2013 Tutorial 2 - Charts Excel 2013 Intermediate 103-124 Unit 2 - Charts Quick Links Chart Concepts Page EX197 EX199 EX200 Selecting Source Data Pages EX198 EX234 EX237 Creating a Chart
High Resolution Imaging by Wave Equation Reflectivity Inversion
 High Resolution Imaging by Wave Equation Reflectivity Inversion A. Valenciano* (Petroleum Geo-Services), S. Lu (Petroleum Geo-Services), N. Chemingui (Petroleum Geo-Services) & J. Yang (University of Houston)
Survey of Math: Excel Spreadsheet Guide (for Excel 2016) Page 1 of 9
 Page 1 of 9") Survey of Math: Excel Spreadsheet Guide (for Excel 2016) Page 1 of 9 Contents 1 Introduction to Using Excel Spreadsheets 2 1.1 A Serious Note About Data Security.................................... 2 1.2
Survey of Math: Excel Spreadsheet Guide (for Excel 2016) Page 1 of 9 Contents 1 Introduction to Using Excel Spreadsheets 2 1.1 A Serious Note About Data Security.................................... 2 1.2
Advanced multipurpose Echosounder with single, dual or split beam
 ECHOSOUNDER Simrad ES60 Series Advanced multipurpose Echosounder with single, dual or split beam ALWAYS AT THE FOREFRONT OF TECHNOLOGY Simrad ES60 Echosounder with Single, Dual or Split Beam New features
Tutorial 2: Particles convected with the flow along a curved pipe.
 Tutorial 2: Particles convected with the flow along a curved pipe. Part 1: Creating an elbow In part 1 of this tutorial, you will create a model of a 90 elbow featuring a long horizontal inlet and a short
DYNAMIC POSITIONING CONFERENCE September 16-17, Sensors
 DYNAMIC POSITIONING CONFERENCE September 16-17, 2003 Sensors An Integrated acoustic positioning and inertial navigation system Jan Erik Faugstadmo, Hans Petter Jacobsen Kongsberg Simrad, Norway Revisions
Surveying Prof. Bharat Lohani Indian Institute of Technology, Kanpur. Lecture - 1 Module - 6 Triangulation and Trilateration
 Surveying Prof. Bharat Lohani Indian Institute of Technology, Kanpur Lecture - 1 Module - 6 Triangulation and Trilateration (Refer Slide Time: 00:21) Welcome to this another lecture on basic surveying.
Advancements in Area-Based Imagery Processing
 Advancements in Area-Based Imagery Processing An integrated Geocoder delivers a streamlined workflow and new capabilities Alexander MacDonald, CARIS, Canada Corey Collins, CARIS, Canada For many years
HYPERSTUDIO TOOLS. THE GRAPHIC TOOL Use this tool to select graphics to edit. SPRAY PAINT CAN Scatter lots of tiny dots with this tool.
 THE BROWSE TOOL Us it to go through the stack and click on buttons THE BUTTON TOOL Use this tool to select buttons to edit.. RECTANGLE TOOL This tool lets you capture a rectangular area to copy, cut, move,
Answer Notes Marks 1 (a) MP1. pitch is frequency; allow it for pitch
 MP1. pitch is frequency; allow it for pitch") (a) MP. pitch is frequency; allow it for pitch MP. any one of: whether sound/note sounds high or low; high sound has high frequency ORA; ignore references to amplitude, wavelength allow vibrates more often
(a) MP. pitch is frequency; allow it for pitch MP. any one of: whether sound/note sounds high or low; high sound has high frequency ORA; ignore references to amplitude, wavelength allow vibrates more often
Transforming Objects and Components
 4 Transforming Objects and Components Arrow selection Lasso selection Paint selection Move Rotate Scale Universal Manipulator Soft Modification Show Manipulator Last tool used Figure 4.1 Maya s manipulation
New Functions and Options in the current Release of SATlive
 New Functions and Options in the current Release of SATlive Version 1.40.26 New Functions and Changes in the current Version New functionality in version 1.40.26 Setup-window for Live-Add Trace added You
Which row could be correct for the colours seen at X, at Y and at Z?
 1 The ray diagram shows the image of an formed by a converging lens. converging lens image 50 cm What is the focal length of the lens? 40 cm 72 cm 40 cm 50 cm 72 cm 90 cm 2 The diagram shows the dispersion
XPEL DAP SUPPORT. DAP Tool List & Overview DESCRIPTION ICON/TOOL (SHORTCUT)
") Pointer (S) Left-click on individual entities to add them to the current selection (selected entities will turn red). If the entity selected is a member of a group, the entire group will be added to the
Pointer (S) Left-click on individual entities to add them to the current selection (selected entities will turn red). If the entity selected is a member of a group, the entire group will be added to the
Field Trial(s) of the UNB
 of the UNB") Field Trial(s) of the UNB Refraction Uncertainty Monitoring Toolkit Time spent on reconnaissance is seldom wasted. British Army Field Service Regulations, 1912 Jonathan D. Beaudoin jonnyb@omg.unb.ca 001-506-447-3307
Field Trial(s) of the UNB Refraction Uncertainty Monitoring Toolkit Time spent on reconnaissance is seldom wasted. British Army Field Service Regulations, 1912 Jonathan D. Beaudoin jonnyb@omg.unb.ca 001-506-447-3307
Art, Nature, and Patterns Introduction
 Art, Nature, and Patterns Introduction to LOGO Describing patterns with symbols This tutorial is designed to introduce you to some basic LOGO commands as well as two fundamental and powerful principles