Aerial Photo Rectification
|
|
|
- Lawrence Skinner
- 5 years ago
- Views:
Transcription
1 Aerial Photo Rectification ERDAS Imagine 2016 Description: We will be using ERDAS Imagine to georeference aerial photos to a DOQ image. We will try to achieve this with a total RMS (root mean square) error of less than one half pixel. 03.1
2 Rectifying scanned aerial photos of southeast Minnesota using ERDAS Imagine Objective: To rectify 1:15,840 aerial photos with a total RMS (root mean square) error of less than 0.5 pixels (0.5 meters). Background: The color infrared aerial photos of southeast Minnesota that you will be working with were acquired by the Minnesota Department of Natural Resources at a nominal scale of 1:15,840. They were scanned at a resolution of 300dpi (dots per inch) to produce a digital image. The data are in the Imagine file format (IMG). General Overview: Rectification is the process of transforming the data from one grid system into another grid system using a geometric transformation. It may involve correction of feature displacement in an aerial photograph in order to produce a planimetrically correct image of the landscape. The georeferencing process is accomplished by matching corresponding points from an already georeferenced image (in our case Digital Orthophoto Quads (DOQs)) with the same points on the scanned aerial photo image. This series of points will then be used to compute the best fit polynomial transformation to align the image to the correct geographic area (don't worry, the computer does this for you!). The first goal is to locate the matching corresponding points, or ground control points (GCPs) of permanent objects. The best GCPs are stationary features such as road intersections and landmarks. In general, you should not choose control points in areas that may change such as shorelines, riverbanks or forested areas. If you must choose natural features, try to find small islands in lakes that appear to be similar in both sources. Select their center/centroid points (usually the highest point) in order to try to account for change in water levels. Other types of points that may be helpful are irregular areas in the shorelines along the lake that look very similar, or patches of wetlands with a centroid or unique point. Individual trees are going to be very hard to distinguish due to the pixelation of the images, but if you can find one standing alone in both images they could also be good GCPs, if necessary. The second goal will be finding GCPs near the four corners of the image, and evenly distributed throughout the image. If you cluster control point pairs only in a certain area of the image, then your rectification is likely to be much less accurate as you move away from those points. We will find 20 or more GCPs, and correct for those which contribute the most error to the overall root mean square (RMS) value. Finally, we will "resample" the image, which essentially fills in the geometrically correct pixels with DN values based on the values in the input image. The three possible resampling methods are nearest neighbor, bilinear interpolation and cubic convolution. We ll use nearest neighbor which assigns each corrected output pixel the value of the nearest input pixel while keeping the radiometry intact. For further reference: Read Campbell sec. 11.6, or Lillesand, Kiefer and Chipman sec


3 Getting Set Up in ERDAS: Start ERDAS Imagine The data needed for this lab is in the S:\FR3252_5262 class folder and Lab 03. To load the color photo, right click on 2D View #1 and select Open Raster Layer. The Select Layer to Add dialog box will open. Navigate to the file aerialphoto.img and then click OK. Right click on the image and Fit to Frame to see the entire image. Click on the Metadata large i in the Home ribbon tab to view the image metadata. Note this data source is missing spatial reference information, but we will remedy that as we continue with the rectification process. Let's jump right in! Selecting Ground Control Points Be sure the ERDAS window is expanded to full size using the windows controls. If it is not, some menu choices may not appear in the steps below, though you can navigate to the place via help. Close any other ERDAS windows that may be open. To begin georeferencing, first click on the aerialphoto.img in the 2D View #1to select the layer. Click on the Multispectral ribbon tab and click on the Control Points button. It is part of the Transform & Orthocorrect group. The Set Geometric Model dialog box will appear. Make sure Model List is selected and scroll down in the Select Geometric Model listing until you can click on the Polynomial model choice and click OK. Notice there are a lot of choices here, choose two or three of them and find out more by selecting the model type and clicking on 'Help'. The Multipoint Geometric Correction window will open up with your uncorrected imagery and you should get the GCP Tool Reference Setup window in front of it. If the radio button is not already selected, make sure the reference points will come from Image Layer (New Viewer) and click OK. You will be asked to browse to your reference image. Tip: click the 'Recent' button to more quickly navigate to the folder where your reference DOQ is located The Reference Image Layer dialog opens up. The software is asking for the image we will use to provide our geographic reference points. Navigate to the Lab 03 folder and select doq.img and click OK (or just double click on 03.3

4 doq.img The Reference Map Information dialog box opens telling us the reference is UTM Zone 15 NAD83. Just go ahead and click OK to continue The Polynomial Model Properties Box appears. Click the up arrow to move the Polynomial Order to 2 and then the down arrow to return it to 1. This should activate the Apply button so you can click Apply. Then click Close to continue. If you didn't already read the Polynomial Model help document earlier, take a look at it now so you get a general sense of what the Polynomial Order means/does. Your screen should now look like this: (Multipoint Geometric Correction) 03.4

5 The Multipoint Geometric Correction (MGC) window is now our master work area for the rest of the lab. In the left half you have various views of the uncorrected aerial image that we want to rectify. In the right half are views of the black and white DOQ image that contains our reference geographic information. As we pick matching points in each photo, coordinate information of the points will appear in the table at the bottom of the screen. You may find that there are GCP points that appear in the color image on the left and in the table below the images, which is an interesting bug in ERDAS that makes it difficult to run a lab lesson like this. You can take a look at these points to see what the general distribution should look like, but do not keep them - the main task for this lab is for you to create your own points! Select the rows in the table by dragging your mouse from top to bottom (or right click and choose Select All) and then Right click to delete. Click on the Toggle Fully Automatic GCP Editing Mode icon in the Multipoint Geometric Correction window so it is NOT depressed (look in the help documentation to find out what this button does). 03.5
.")
6 You will notice in the aerial image in the upper left pane (the least zoomed in pane) there is a square white box. If you position your mouse over it the cursor becomes a 4-headed arrow. If you click and drag, notice what you see in the larger pane below. Move the 4- headed cursor around until an easily identifiable object appears in the lower pane (like a farm house). Now move the white box in the lower pane until it is directly over the farmhouse and notice that in the upper right pane the farmhouse will appear enlarged. Take some time to orient yourself to how the various levels of zoom and pointers work together. You can change the overall zoom level by right clicking in the lower pane. As you do this you will see how the upper left square box changes size to match the view of the lower pane. You can also click on the edges of either of the white squares to change the relative scene of the pane it represents. Try to find some geographical landmarks in the aerial photo. Now, right click on your DOQ and select Fit Image to Window. Find the same landmarks on the DOQ that you found in the photo. Use the zoom and pan tools to help you. Take some time to set up your window so both the input and reference windows are of similar scale. There are tools at the top of the viewer windows and you can also right click in the viewer and left click on Zoom to select the level of zoom desired. Here s a sample of how the two should look: If you find that the link boxes are difficult to see, you can change their color by right clicking on the box and selecting Link Box Color 03.6

7 Click the Create GCP in the GCP tool window. In the highest zoom pane of the aerial image, carefully click on an object. GCP#1 will be created. Now Click Create GCP again and Click on the matching object in the DOQ image pane with the highest zoom. GCP#1 will be created in that image as well. Helpful Hint: If the two Binocular icons are depressed any time you click on a row containing the GCPs, the main screen will display the corresponding Input and Reference point Another Helpful Hint: ERDAS has been known to occasionally crash during this lab! You should consider saving your points periodically. In the File menu, select Save Input As to save points in the left side of the screen to your student drive and select Save Reference As to save the points on the right side of the screen. By now you should have GCP #1 listed in the GCP Tool window. You should have data for the X Input and Y Input (the photo location of the GCP) and X Ref. and Y Ref. (the location on the DOQ). Repeat this process for at least six more GCPs. Once you have at least six GCPs, you can click on the summation icon to solve for your model (this is where the Polynomial Model is doing it's 'behind the scenes work'). Now you will see X Residual, Y Residual and RMS Error information. You will also see Control Point Error for (X) and (Y) and a (Total) about your GCP list. What do these numbers represent? Continue finding control points with this method until you have a minimum of 20. More GCPs are better, so try using 30 if you can. Also, you can try to use the automatic GCP and automatic solving buttons. What do these applications do for you? Cover the photo thoroughly in selecting your GCPs! It is important to distribute the ground control point pairs over the entire aerial photo, extending all the way to the corners. Try to get a GCP close to each of the four corners. This may be challenging if you are on top of a bluff in a field where there are few roads and other permanent features. 03.7

8 Minimizing the Root Mean Square Error The RMSE is important because it is a measure of the spatial error in the photo. We seek the smallest RMSE we can achieve. The residual columns give a measure of how much each point contributes to the total positional error. The X and Y residual will help you understand the contribution to the error by direction. To achieve the best possible RMSE (less than 0.5 pixels at a minimum - you need to know the pixel size of your image to translate your total error, which is measured in meters), we require careful placement of the GCP points. In the screen shot above for example, you might start by examining the row that contributed to the RMS Error. Make certain that the two GCPs are placed on the exactly on the same location. Move one of them if necessary. Often error can be reduced by deleting control points and then recreating them, being a bit more precise with their location. While it is Don t Fudge the Points! You can reduce the overall RMSE by deleting bad points or artificially moving GCPs to where they no longer match optically but lower RMSE. You will end up with a low RMSE but when you overlay your final image the pixels will not align well. The proof of THIS pudding is in the alignment! tempting, a control points with a high residual should not just be deleted. It may likely be telling us there is something going on in that part of the image that may require other actions such as clipping that portion of the image out and processing it separately. Often error can be reduced by deleting control points and then recreating them, being a bit more precise with their location. It is often a good idea to delete and re-create the first few of your points. Another method is to zoom in tightly to the area you are trying to match. You can move the points at this zoomed level and it may be easier for you to align the points. Once you have achieved the lowest RMS error you can achieve ( 0.5 pixels [(Total) < 0.5]) is an excellent but difficult to achieve goal) and you have twenty GCPs evenly spaced throughout the image, you are ready to resample the aerial photo pixels into geographic space. In the Multipoint Geometric window, click on the Display Resample Image Dialog button The Resample dialog box will appear similar to the screen at right. 03.8
9 Be sure to save your file as a JPEG2000 (JP2) file type or it will be too large to upload to Moodle Keep the default values for Output Cell Size and as well as the Output Corners. Make sure the Resampling Method is Nearest Neighbor and save your rectified photo to your preferred personal location and give it an appropriate name. To see your rectified image, open a new viewer and add your image. Your image is now ready for further analysis. Well done! Import your saved photo into ArcGIS. Load some imagery using File > Add Data > Add Basemap > Imagery Perform the following steps 1. Right click on your rectified image in the table of contents and select Properties 2. Select the Display tab and set the transparency to 50% 3. Right click anywhere in the menu bar area that is plain gray at the top of the screen and make certain the Effects menu is clicked 4. In the Effects menu bar that opens, select your rectified image from the drop down and click the icon. Your cursor should change to a triangular arrow 5. Right click on the layer with your image and Zoom to the Layer 6. Click and drag the arrow across your screen horizontally or vertically to swipe the image over the basemap. 7. To really examine how well the pixels align you will likely need to be around 1:700 zoom level Autosync Workstation As you work with Landsat you may find that two images from different time frames of the same geographic area may not align accurately. This can be a result of the automated processing that is done by USGS on the level 1 prodect. ERDAS Imagine has a functionality called Autosync which is similar to the georeferencing we did in the first part of the lab. In this case, you pick one image to be the reference, and the other the input. Points are placed across both images and when the model is run, the input is adjusted to match the model created by the points you have placed. Assuming both images are georeferenced but slightly off, we can easily resolve this using the Edge Matching model of Autosync Prior to starting Autosycn, your images should both be in stacks. Begin Autosync. You should see: 03.9

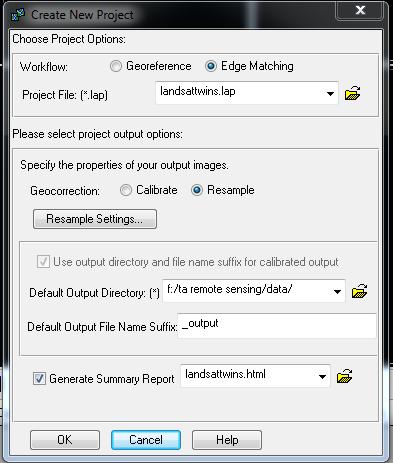
10 Click OK 03.10


11 Make the above changes using your student drive as the directory and whatever name you want for the summary report. Click Resample Settings and verify that the screen is as below: Click OK to this dialog box as well as the Create New Project dialog


12 File > Add Images > Input Images Browse to the image you would like to adjust Click ok and it will appear in the left half of the workspace File > Add Images > Input Images again Browse to the second image you would like to use and click OK Screen should look like: Run APM Model by clicking on Process > Run APM Model Run time about 20 minutes. Sample of dialogs while running: Hundreds of points will automatically be placed for you and the screen will appear as: 03.12


13 Clicking will display a copy of the report indicating overall error On the upper menu bar click on to put the preview screen in the upper panel Click on to put the preview screen in Swipe mode. Review your image to assure you are satisfied with the fit. A Blend and Flicker tool is also available. If you want to adjust GSPs click on the again to toggle


14 back to the review points mode Click on to create resampled output for all input images. The output images will have whatever suffix you placed in the Project dialog and be placed in the input folder. Statuses will be displaced: Each image will be resampled The above may take a while since both images will need to be resampled and have new pyramid layers created. The output files will now show in the table of contents: 03.14

15 After completion the images should exactly overly so image differences can more easily be evaluated. Lesson 03 Outcomes By completing Lesson 03 you should be able to: 1. Open ERDAS Imagine and load image files. 2. Fit images to the viewer and zoom to various levels. 3. Identify features that can be used as ground control points. 4. Apply the georeferencing tool to an unrectified image. 5. Identify which ground control points are contributing the most error and delete them. 6. Minimize the RMS error. 7. Be comfortable in maneuvering around the photo using the tools available in ERDAS Imagine
Exercise #5b - Geometric Correction of Image Data
 Exercise #5b - Geometric Correction of Image Data 5.6 Geocoding or Registration of geometrically uncorrected image data 5.7 Resampling 5.8 The Ukrainian coordinate system 5.9 Selecting Ground Control Points
Lab 5: Georeferencing, Digitization, and Processing
 Lab 5: Georeferencing, Digitization, and Processing Purpose: An introduction to georeferencing images, practice digitizing, and combine lesson up to this point. To Do: Register a scanned image, digitize
Georeferencing Imagery in ArcGIS 10.3.x
 Georeferencing Imagery in ArcGIS 10.3.x Georeferencing is the process of aligning imagery (maps, air photos, etc.) with spatial data such as point, lines or polygons (for example, roads and water bodies).
How to Align a Non- Georeferenced Image to an Existing Geographic Layer or Georeferenced Image
 How to Align a Non- Georeferenced Image to an Existing Geographic Layer or Georeferenced Image Written by Barbara M. Parmenter, revised 14 October 2011 You can align, or georeference, scanned maps to existing
Files Used in this Tutorial
 RPC Orthorectification Tutorial In this tutorial, you will use ground control points (GCPs), an orthorectified reference image, and a digital elevation model (DEM) to orthorectify an OrbView-3 scene that
Files Used in this Tutorial
 RPC Orthorectification Tutorial In this tutorial, you will use ground control points (GCPs), an orthorectified reference image, and a digital elevation model (DEM) to orthorectify an OrbView-3 scene that
Georeferencing in ArcGIS
 Georeferencing in ArcGIS Georeferencing In order to position images on the surface of the earth, they need to be georeferenced. Images are georeferenced by linking unreferenced features in the image with
Geometric Rectification of Remote Sensing Images
 Geometric Rectification of Remote Sensing Images Airborne TerrestriaL Applications Sensor (ATLAS) Nine flight paths were recorded over the city of Providence. 1 True color ATLAS image (bands 4, 2, 1 in
Blacksburg, VA July 24 th 30 th, 2010 Georeferencing images and scanned maps Page 1. Georeference
 George McLeod Prepared by: With support from: NSF DUE-0903270 in partnership with: Geospatial Technician Education Through Virginia s Community Colleges (GTEVCC) Georeference The process of defining how
button in the lower-left corner of the panel if you have further questions throughout this tutorial.
 Mosaic Tutorial: Simple Workflow This tutorial demonstrates how to use the Seamless Mosaic tool to mosaic six overlapping digital aerial scenes. You will learn about displaying footprints and image data
Geology & Geophysics REU GPS/GIS 1-day workshop handout #3: Working with data in ArcGIS
 Geology & Geophysics REU GPS/GIS 1-day workshop handout #3: Working with data in ArcGIS In this lab you ll start to use some basic ArcGIS routines to display your data. These include overlaying data on
Georeferencing & Spatial Adjustment
 Georeferencing & Spatial Adjustment Aligning Raster and Vector Data to the Real World Rotation Differential Scaling Distortion Skew Translation 1 The Problem How are geographically unregistered data, either
Overview. Image Geometric Correction. LA502 Special Studies Remote Sensing. Why Geometric Correction?
 LA502 Special Studies Remote Sensing Image Geometric Correction Department of Landscape Architecture Faculty of Environmental Design King AbdulAziz University Room 103 Overview Image rectification Geometric
GIS Basics for Urban Studies
 GIS Basics for Urban Studies Date: March 21, 2018 Contacts: Mehdi Aminipouri, Graduate Peer GIS Faciliator, SFU Library (maminipo@sfu.ca) Keshav Mukunda, GIS & Map Librarian Librarian for Geography (kmukunda@sfu.ca)
INTRODUCTION TO GIS WORKSHOP EXERCISE
 111 Mulford Hall, College of Natural Resources, UC Berkeley (510) 643-4539 INTRODUCTION TO GIS WORKSHOP EXERCISE This exercise is a survey of some GIS and spatial analysis tools for ecological and natural
Tutorial files are available from the Exelis VIS website or on the ENVI Resource DVD in the image_reg directory.
 Image Registration Tutorial In this tutorial, you will use the Image Registration workflow in different scenarios to geometrically align two overlapping images with different viewing geometry and different
Georeferencing & Spatial Adjustment 2/13/2018
 Georeferencing & Spatial Adjustment The Problem Aligning Raster and Vector Data to the Real World How are geographically unregistered data, either raster or vector, made to align with data that exist in
RDSC Workshop #4 Finding, Organizing & Creating Data. Sarah Watson March 17, 2017
 RDSC Workshop #4 Finding, Organizing & Creating Data Sarah Watson March 17, 2017 Overview Briefly discuss different online data sets Adjust the Scanned Map in Photoshop Georeference Scanned Map in ArcMap
The Problem. Georeferencing & Spatial Adjustment. Nature Of The Problem: For Example: Georeferencing & Spatial Adjustment 9/20/2016
 Georeferencing & Spatial Adjustment Aligning Raster and Vector Data to the Real World The Problem How are geographically unregistered data, either raster or vector, made to align with data that exist in
How to georeference images in ArcMap (Arcinfo, ArcReader, ArcView)
") How to georeference images in ArcMap (Arcinfo, ArcReader, ArcView) This procedure outlines the steps required to georeference any image, including air photos or raster copies of scanned paper maps. In
How to georeference images in ArcMap (Arcinfo, ArcReader, ArcView) This procedure outlines the steps required to georeference any image, including air photos or raster copies of scanned paper maps. In
Files Used in this Tutorial
 Generate Point Clouds and DSM Tutorial This tutorial shows how to generate point clouds and a digital surface model (DSM) from IKONOS satellite stereo imagery. You will view the resulting point clouds
Georeferencing in ArcGIS Pro. Overview of the Esri Georeferencing tools. Exercise
 Georeferencing in ArcGIS Pro Historic maps contain a wealth of information that can be used in research. You can use the scanned historic map as a background to your own data or you can digitize the information
Georeferencing a Scanned Map Image (FIP maps)
") MAP, DATA & GIS LIBRARY maplib@brocku.ca Georeferencing Scanned FIP Maps ArcMap Georeferencing a Scanned Map Image (FIP maps) These instructions offer an exercise in georeferencing historical scanned map
MAP, DATA & GIS LIBRARY maplib@brocku.ca Georeferencing Scanned FIP Maps ArcMap Georeferencing a Scanned Map Image (FIP maps) These instructions offer an exercise in georeferencing historical scanned map
Remote Sensing in an
 Chapter 2: Adding Data to a Map Document Remote Sensing in an ArcMap Environment Remote Sensing Analysis in an ArcMap Environment Tammy E. Parece Image source: landsat.usgs.gov Tammy Parece James Campbell
PART 1. Answers module 6: 'Transformations'
 Answers module 6: 'Transformations' PART 1 1 a A nominal measure scale refers to data that are in named categories. There is no order among these categories. That is, no category is better or more than
MODULE 1 BASIC LIDAR TECHNIQUES
 MODULE SCENARIO One of the first tasks a geographic information systems (GIS) department using lidar data should perform is to check the quality of the data delivered by the data provider. The department
General Digital Image Utilities in ERDAS
 General Digital Image Utilities in ERDAS These instructions show you how to use the basic utilities of stacking layers, converting vectors, and sub-setting or masking data for use in ERDAS Imagine 9.x
Training i Course Remote Sensing Basic Theory & Image Processing Methods September 2011
 Training i Course Remote Sensing Basic Theory & Image Processing Methods 19 23 September 2011 Geometric Operations Michiel Damen (September 2011) damen@itc.nl ITC FACULTY OF GEO-INFORMATION SCIENCE AND
Mosaic Tutorial: Advanced Workflow
 Mosaic Tutorial: Advanced Workflow This tutorial demonstrates how to mosaic two scenes with different color variations. You will learn how to: Reorder the display of the input scenes Achieve a consistent
POSITIONING A PIXEL IN A COORDINATE SYSTEM
 GEOREFERENCING AND GEOCODING EARTH OBSERVATION IMAGES GABRIEL PARODI STUDY MATERIAL: PRINCIPLES OF REMOTE SENSING AN INTRODUCTORY TEXTBOOK CHAPTER 6 POSITIONING A PIXEL IN A COORDINATE SYSTEM The essential
Lab 6: Transforming Spatial Data
 Lab 6: Transforming Spatial Data Objectives: The primary objectives of this lab are to georeference a raster dataset and to create GIS data by digitizing features from an image as a backdrop. Specifics:
University of Technology Building & Construction Department / Remote Sensing & GIS lecture
 5. Corrections 5.1 Introduction 5.2 Radiometric Correction 5.3 Geometric corrections 5.3.1 Systematic distortions 5.3.2 Nonsystematic distortions 5.4 Image Rectification 5.5 Ground Control Points (GCPs)
Introduction to Google Earth Tutorial Haiti. 3/15/2011. Tufts GIS Center. Data Exploration
 Introduction to Google Earth Tutorial Haiti. 3/15/2011. Tufts GIS Center. Data Exploration 1. Open Google Earth 2. On the left you will see a navigation pane with 3 sections: Search, Places and Layers.
Lab 10: Raster Analyses
 Lab 10: Raster Analyses What You ll Learn: Spatial analysis and modeling with raster data. You will estimate the access costs for all points on a landscape, based on slope and distance to roads. You ll
Import, view, edit, convert, and digitize triangulated irregular networks
 v. 10.1 WMS 10.1 Tutorial Import, view, edit, convert, and digitize triangulated irregular networks Objectives Import survey data in an XYZ format. Digitize elevation points using contour imagery. Edit
The Problem. Georeferencing & Spatial Adjustment. Nature of the problem: For Example: Georeferencing & Spatial Adjustment 2/4/2014
 Georeferencing & Spatial Adjustment Aligning Raster and Vector Data to a GIS The Problem How are geographically unregistered data, either raster or vector, made to align with data that exist in geographical
Lab 2. Practice with ArcGIS
 Lab 2. Practice with ArcGIS Purpose: To practice map composition and printing in ArcGIS To Do and Hand In: Compose, print, and hand in two maps, described below. Maps due in lab one week after assignment.
SITE DESIGN & ADVANCED WEB PART FEATURES...
 Overview OVERVIEW... 2 SITE DESIGN & ADVANCED WEB PART FEATURES... 4 SITE HIERARCHY... 4 Planning Your Site Hierarchy & Content... 4 Content Building Tools... 5 Pages vs Sites... 6 Creating Pages... 6
Lab 3. Introduction to GMT and Digitizing in ArcGIS
 Lab 3. Introduction to GMT and Digitizing in ArcGIS GEY 430/630 GIS Theory and Application Purpose: To learn how to use GMT to make basic maps and learn basic digitizing techniques when collecting data
Lab 3: Digitizing in ArcGIS Pro
 Lab 3: Digitizing in ArcGIS Pro What You ll Learn: In this Lab you ll be introduced to basic digitizing techniques using ArcGIS Pro. You should read Chapter 4 in the GIS Fundamentals textbook before starting
Introduction to ERDAS IMAGINE. (adapted/modified from Jensen 2004)
") Introduction to ERDAS IMAGINE General Instructions (adapted/modified from Jensen 2004) Follow the directions given to you in class to login the system. If you haven t done this yet, create a folder and
Introduction to ERDAS IMAGINE General Instructions (adapted/modified from Jensen 2004) Follow the directions given to you in class to login the system. If you haven t done this yet, create a folder and
Exercise 1: Introduction to MapInfo
 Geog 578 Exercise 1: Introduction to MapInfo Page: 1/22 Geog 578: GIS Applications Exercise 1: Introduction to MapInfo Assigned on January 25 th, 2006 Due on February 1 st, 2006 Total Points: 10 0. Convention
Exercise 6-1 Image Georegistration Using RESAMPLE
 Exercise 6-1 Image Georegistration Using RESAMPLE Resampling is a procedure for spatially georeferencing an image to its known position on the ground. Often, this procedure is used to register an image
Word 2007 Tables Objectives
 Word 2007 Tables In this lesson you will learn how to create, modify and format tables. You will also learn to use the AutoFormat table option and to sort table rows. Objectives Create a table Modify a
Gloucester County Library System EXCEL 2007
 Gloucester County Library System EXCEL 2007 Introduction What is Excel? Microsoft E x c e l is an electronic s preadsheet program. I t is capable o f performing many diff e r e n t t y p e s o f c a l
In this lesson you are going to create a drawing program similar to Windows Paint. 1. Start with a new project and remove the default cat sprite.
 Drawing Program In this lesson you are going to create a drawing program similar to Windows Paint. 1. Start with a new project and remove the default cat sprite. 2. Create a new sprite. 3. The new sprite
Lecture 06. Raster and Vector Data Models. Part (1) Common Data Models. Raster. Vector. Points. Points. ( x,y ) Area. Area Line.
 Common Data Models. Raster. Vector. Points. Points. ( x,y ) Area. Area Line.") Lecture 06 Raster and Vector Data Models Part (1) 1 Common Data Models Vector Raster Y Points Points ( x,y ) Line Area Line Area 2 X 1 3 Raster uses a grid cell structure Vector is more like a drawn map
Lecture 06 Raster and Vector Data Models Part (1) 1 Common Data Models Vector Raster Y Points Points ( x,y ) Line Area Line Area 2 X 1 3 Raster uses a grid cell structure Vector is more like a drawn map
Background on Kingdom Suite for the Imperial Barrel Competition 3D Horizon/Fault Interpretation Parts 1 & 2 - Fault Interpretation and Correlation
 Background on Kingdom Suite for the Imperial Barrel Competition 3D Horizon/Fault Interpretation Parts 1 & 2 - Fault Interpretation and Correlation Wilson (2010) 1 Fault/Horizon Interpretation Using Seismic
Geoprocessing and georeferencing raster data
 Geoprocessing and georeferencing raster data Raster conversion tools Geoprocessing tools ArcCatalog tools ESRI Grid GDB Raster Raster Dataset Raster Catalog Erdas IMAGINE TIFF ArcMap - raster projection
Using Microsoft Word. Text Editing
 Using Microsoft Word A word processor is all about working with large amounts of text, so learning the basics of text editing is essential to being able to make the most of the program. The first thing
Image georeferencing is the process of developing a model to transform from pixel coordinates into GIS coordinates such as meters on the ground.
 Image georeferencing is the process of developing a model to transform from pixel coordinates into GIS coordinates such as meters on the ground. Image rectification is the process of using your georeferencing
Photoshop tutorial: Final Product in Photoshop:
 Disclaimer: There are many, many ways to approach web design. This tutorial is neither the most cutting-edge nor most efficient. Instead, this tutorial is set-up to show you as many functions in Photoshop
The first time you open Word
 Microsoft Word 2010 The first time you open Word When you open Word, you see two things, or main parts: The ribbon, which sits above the document, and includes a set of buttons and commands that you use
Let s Make a Front Panel using FrontCAD
 Let s Make a Front Panel using FrontCAD By Jim Patchell FrontCad is meant to be a simple, easy to use CAD program for creating front panel designs and artwork. It is a free, open source program, with the
Explore a map Learn ArcGIS
 Explore a map Learn ArcGIS In this lesson, you'll open a web map and learn how to navigate and work with it using map tools as you explore Farmer Markets in the Louisville Area. 1. Go to www.arcgis.com
Heads-up Digitizing from Scanned Hard-Copy Maps Part I Georeferencing Scanned Images 1
 Data conversion/entry (GIS, databases) November 21-25, 2006 Freetown, Sierra Leone Heads-up Digitizing from Scanned Hard-Copy Maps Part I Georeferencing Scanned Images 1 Objectives: Explore digital archives
Map Direct Lite. Quick Start Guide: Map Layers 5/14/2018
 Map Direct Lite Quick Start Guide: Map Layers 5/14/2018 Contents Quick Start Guide: Map Layers... 1 Map Layers in Map Direct Lite.... 3 What is a Basemap Layer?... 4 Change the Basemap Using the Basemap
PowerPoint Intermediate 2010
 PowerPoint Intermediate 2010 I. Creating a Slide Master A. Using the design feature of PowerPoint essentially sets up similar formatting for all of your slides within a presentation. However, there are
Geography 281 Map Making with GIS Project Two: Map Design Issues in ArcMap
 Geography 281 Map Making with GIS Project Two: Map Design Issues in ArcMap This activity provides an introduction to the map design process. It takes you through a typical sequence from the initial decision
Discovering Computers & Microsoft Office Office 2010 and Windows 7: Essential Concepts and Skills
 Discovering Computers & Microsoft Office 2010 Office 2010 and Windows 7: Essential Concepts and Skills Objectives Perform basic mouse operations Start Windows and log on to the computer Identify the objects
INTRODUCTION TO IDRISI
 INTRODUCTION TO IDRISI Introduction The aim of this practical is to familiarise yourself with the IDRISI GIS environment. IDRISI is primarily designed to process and analyse raster information (remember,
Overview of Adobe Fireworks CS6
 Overview of Adobe Fireworks CS6 Lesson topics: Work with the Adobe Fireworks CS6 workspace: tools, Document windows, menus, and panels. Customize the workspace. Change the magnification of a document.
Map Tools: A Transformative Experience
 Bonus Chapter 3 Map Tools: A Transformative Experience The Autodesk AutoCAD Civil 3D 2016 software contains most of the functionality that can be found in the Autodesk AutoCAD Map 3D 2016 software. As
Introduction. Table Basics. Access 2010 Working with Tables. Video: Working with Tables in Access To Open an Existing Table: Page 1
 Access 2010 Working with Tables Introduction Page 1 While there are four types of database objects in Access 2010, tables are arguably the most important. Even when you're using forms, queries, and reports,
m ac romed ia D r e a mw e av e r Curriculum Guide
 m ac romed ia D r e a mw e av e r Curriculum Guide 1997 1998 Macromedia, Inc. All rights reserved. Macromedia, the Macromedia logo, Dreamweaver, Director, Fireworks, Flash, Fontographer, FreeHand, and
CHAPTER 3. Entering Text and Moving Around
 CHAPTER 3 Entering Text and Moving Around Typing text is what word processing is all about. You can, in fact, create a perfectly respectable document by typing alone. Everything else all of the formatting
Geometric Correction of Imagery
 Geometric Correction of Imagery Geometric Correction of Imagery Present by: Dr.Weerakaset Suanpaga D.Eng(RS&GIS) The intent is to compensate for the distortions introduced by a variety of factors, so that
Links to Activities ACTIVITY 1.1. Links to Activities Links to Activities
 EXCEL Analyzing Data Using Excel Section 1 Skills Start Excel and identify features in the Excel window Enter labels and values Use the fill handle to enter a series Enter formulas Create a formula using
4. If you are prompted to enable hardware acceleration to improve performance, click
 Exercise 1a: Creating new points ArcGIS 10 Complexity: Beginner Data Requirement: ArcGIS Tutorial Data Setup About creating new points In this exercise, you will use an aerial photograph to create a new
Chapter 1. Getting to Know Illustrator
 Chapter 1 Getting to Know Illustrator Exploring the Illustrator Workspace The arrangement of windows and panels that you see on your monitor is called the workspace. The Illustrator workspace features
Water Distribution System Modeling EPANET. Import an existing water distribution model and modify link and node parameters within WMS
 v. 10.1 WMS 10.1 Tutorial Water Distribution System Modeling EPANET Hydraulic Model Import an existing water distribution model and modify link and node parameters within WMS Objectives View an existing
Taking Advantage of the Explosion in Online Imagery with Autodesk Raster Design.
 11/28/2005-1:00 pm - 2:30 pm Room:Osprey 2 [Lab] (Swan) Walt Disney World Swan and Dolphin Resort Orlando, Florida Taking Advantage of the Explosion in Online Imagery with Autodesk Raster Design. Gary
Exercise 1: An Overview of ArcMap and ArcCatalog
 Exercise 1: An Overview of ArcMap and ArcCatalog Introduction: ArcGIS is an integrated collection of GIS software products for building a complete GIS. ArcGIS enables users to deploy GIS functionality
CHAPTER 1 COPYRIGHTED MATERIAL. Getting to Know AutoCAD. Opening a new drawing. Getting familiar with the AutoCAD and AutoCAD LT Graphics windows
 CHAPTER 1 Getting to Know AutoCAD Opening a new drawing Getting familiar with the AutoCAD and AutoCAD LT Graphics windows Modifying the display Displaying and arranging toolbars COPYRIGHTED MATERIAL 2
STUDENT PAGES GIS Tutorial Treasure in the Treasure State
 STUDENT PAGES GIS Tutorial Treasure in the Treasure State Copyright 2015 Bear Trust International GIS Tutorial 1 Exercise 1: Make a Hand Drawn Map of the School Yard and Playground Your teacher will provide
Lab 10: Raster Analyses
 Lab 10: Raster Analyses What You ll Learn: Spatial analysis and modeling with raster data. You will estimate the access costs for all points on a landscape, based on slope and distance to roads. You ll
Unit 8. Lesson 8.1. Microsoft FrontPage. Introduction. Microsoft FrontPage-1. Microsoft FrontPage
 Microsoft FrontPage Unit 8 Microsoft FrontPage Introduction Lesson 8.1 Microsoft FrontPage-1 A number of Software Packages are available in market for creating a website. Among popular software s are Dreamweaver,
Lab 3: Digitizing in ArcMap
 Lab 3: Digitizing in ArcMap What You ll Learn: In this Lab you ll be introduced to basic digitizing techniques using ArcMap. You should read Chapter 4 in the GIS Fundamentals textbook before starting this
Downloading shapefiles and using essential ArcMap tools
 CHAPTER 1 KEY CONCEPTS downloading shapefiles learning essential tools exploring the ArcMap table of contents understanding shapefiles customizing shapefiles saving projects Downloading shapefiles and
Introduction to SAGA GIS
 GIS Tutorial ID: IGET_RS_001 This tutorial has been developed by BVIEER as part of the IGET web portal intended to provide easy access to geospatial education. This tutorial is released under the Creative
City of Richmond Interactive Map (RIM) User Guide for the Public
 User Guide for the Public") Interactive Map (RIM) User Guide for the Public Date: March 26, 2013 Version: 1.0 3479477 3479477 Table of Contents Table of Contents Table of Contents... i About this
Interactive Map (RIM) User Guide for the Public Date: March 26, 2013 Version: 1.0 3479477 3479477 Table of Contents Table of Contents Table of Contents... i About this
Budget Exercise for Intermediate Excel
 Budget Exercise for Intermediate Excel Follow the directions below to create a 12 month budget exercise. Read through each individual direction before performing it, like you are following recipe instructions.
On the Web sun.com/aboutsun/comm_invest STAROFFICE 8 DRAW
 STAROFFICE 8 DRAW Graphics They say a picture is worth a thousand words. Pictures are often used along with our words for good reason. They help communicate our thoughts. They give extra information that
LAB 1: Introduction to ArcGIS 8
 LAB 1: Introduction to ArcGIS 8 Outline Introduction Purpose Lab Basics o About the Computers o About the software o Additional information Data ArcGIS Applications o Starting ArcGIS o o o Conclusion To
GSSHA WMS Basics Loading DEMs, Contour Options, Images, and Projection Systems
 v. 10.0 WMS 10.0 Tutorial GSSHA WMS Basics Loading DEMs, Contour Options, Images, and Projection Systems Learn how to work with DEMs and images and to convert between projection systems in the WMS interface
GEOG 487 Lesson 4: Step-by-Step Activity
 GEOG 487 Lesson 4: Step-by-Step Activity Part I: Visually Explore Trends In Part I, we will explore several tools and technique to make it easier to visually interpret patterns in your data using ArcGIS.
FrontPage 98 Quick Guide. Copyright 2000 Peter Pappas. edteck press All rights reserved.
 Master web design skills with Microsoft FrontPage 98. This step-by-step guide uses over 40 full color close-up screen shots to clearly explain the fast and easy way to design a web site. Use edteck s QuickGuide
XnView Image Viewer. a ZOOMERS guide
 XnView Image Viewer a ZOOMERS guide Introduction...2 Browser Mode... 5 Image View Mode...14 Printing... 22 Image Editing...26 Configuration... 34 Note that this guide is for XnView version 1.8. The current
Quick Start Guide. ARIS Architect. Version 9.7
 ARIS Architect Version 9.7 October 2014 This document applies to ARIS Version 9.7 and to all subsequent releases. Specifications contained herein are subject to change and these changes will be reported
Gloucester County Library System. Excel 2010
 Gloucester County Library System Excel 2010 Introduction What is Excel? Microsoft Excel is an electronic spreadsheet program. It is capable of performing many different types of calculations and can organize
Excel Core Certification
 Microsoft Office Specialist 2010 Microsoft Excel Core Certification 2010 Lesson 6: Working with Charts Lesson Objectives This lesson introduces you to working with charts. You will look at how to create
GIS LAB 8. Raster Data Applications Watershed Delineation
 GIS LAB 8 Raster Data Applications Watershed Delineation This lab will require you to further your familiarity with raster data structures and the Spatial Analyst. The data for this lab are drawn from
Exercise 03 Creating and Editing Shapefiles Assigned Feb. 2, 2018 Due Feb. 9, 2018
 Exercise 03 Creating and Editing Shapefiles Assigned Feb. 2, 2018 Due Feb. 9, 2018 On the class website I've posted an exercise_03_data.zip file which contains a USGS 7.5' quad map of Laramie (as laramie_quad_usgs_1963.tiff)
Would you like to put an image on your index page? There are several ways to do this and I will start with the easy way.
 Home Frontpage & Other Tutorials Dreamweaver Tutorial Contact Images and Tables Would you like to put an image on your index page? There are several ways to do this and I will start with the easy way.
The Fundamentals. Document Basics
 3 The Fundamentals Opening a Program... 3 Similarities in All Programs... 3 It's On Now What?...4 Making things easier to see.. 4 Adjusting Text Size.....4 My Computer. 4 Control Panel... 5 Accessibility
Lab 9: Atmospheric Corrections
 Lab 9: Atmospheric Corrections In this lab, you will use a simple method called dark pixel subtraction (a.k.a dark object subtraction) to correct satellite imagery for atmospheric effects. Atmospheric
TLMC SHORT CLASS: THESIS FORMATTING
 Table of Contents Introduction... 2 Getting Help... 2 Tips... 2 Working with Styles... 3 Applying a Style... 3 Creating A New Style... 3 Setting Margins... 4 Adding Page Numbers... 5 Step 1: Using Sections
IN THIS CLASS WE ARE GOING TO LEARN THE BASIC FEATURES OF WINDOWS 8.1 WITH HANDS ON TRAINING THE CLASS WILL RUN ON THE SPEED OF THE AVERAGE STUDENT
 1 IN THIS CLASS WE ARE GOING TO LEARN THE BASIC FEATURES OF WINDOWS 8.1 WITH HANDS ON TRAINING EACH CLASS WILL RUN APPROXIMATELY 40 MINUTES WE WILL PICK UP WHERE WE LEFT OFF AT THE NEXT CLASS THE CLASS
XnView 1.9. a ZOOMERS guide. Introduction...2 Browser Mode... 5 Image View Mode...15 Printing Image Editing...28 Configuration...
 XnView 1.9 a ZOOMERS guide Introduction...2 Browser Mode... 5 Image View Mode...15 Printing... 22 Image Editing...28 Configuration... 36 Written by Chorlton Workshop for hsbp Introduction This is a guide
In this lab, you will create two maps. One map will show two different projections of the same data.
 Projection Exercise Part 2 of 1.963 Lab for 9/27/04 Introduction In this exercise, you will work with projections, by re-projecting a grid dataset from one projection into another. You will create a map