Graph Clarity, Simplification, & Interaction
|
|
|
- Vernon Miles
- 5 years ago
- Views:
Transcription

1 Graph Clarity, Simplification, & Interaction
2 Today Today s Reading: Lombardi Graphs Bezier Curves Today s Reading: Clustering/Hierarchical edge Bundling Definition of Betweenness Centrality Emergency Management Graph Visualization Sean Kim s masters project Reading for Tuesday & Homework 3 Graph Interaction Brainstorming Exercise "Lombardi drawings of graphs", Duncan, Eppstein, Goodrich, Kobourov, Nollenberg, Graph Drawing 2010 Circular arcs Perfect angular resolution (edges for equal angles at vertices) Arcs only intersect 2 vertices (at endpoints) (not required to be crossing free) Vertices may be constrained to lie on circle or concentric circles
3 People are more patient with aesthetically pleasing graphs (will spend longer studying to learn/draw conclusions) What about relaxing the circular arc requirement and allowing Bezier arcs? How does it scale to larger data? Long curved arcs can be much harder to follow Circular layout of nodes is often very good! Would like more pseudocode Cubic Bézier Curve 4 control points Curve passes through first & last control point Curve is tangent at P0 to (P1-P0) and at P3 to (P3-P2) uche/graphics/en/html/curves_learningobject 2.html b/9902/bezier.html

4 Force-directed Lombardi-style graph drawing, Chernobelskiy et al., Graph Drawing Relaxation of the Lombardi Graph requirements straight-line segments rarely occur in nature... it is not clear that humans prefer straight-line segments for the sake of graph readability Forces on tangent angles as well as on vertex positions

5 Today Today s Reading: Lombardi Graphs Bezier Curves Today s Reading: Clustering/Hierarchical edge Bundling Definition of Betweenness Centrality Emergency Management Graph Visualization Sean Kim s masters project Reading for Tuesday & Homework 3 Graph Interaction Brainstorming Exercise Reading for Today Social Network Clustering and Visualization using Hierarchical Edge Bundles, Jia, Garland, & Hart, Computer Graphics Forum, 2011.
6 Color is very helpful (be careful about colorblindness) Relation to 6 degrees of separation Concern that small (but important) features or communities may be lost Concern about high cost of computing betweenness centrality (BC) metric Final graphs can still be confusing to interpret Diagrams very helpful in explaining steps algorithm Well written :) Social Network Clustering and Visualization using Hierarchical Edge Bundles, Jia, Garland, and Hart, Computer Graphics Forum Dense graphs, e.g., social networks Straight line drawings are cluttered by crossings Curved edges Bundled edges (similar pathways) reduce visual clutter, similar to clusters of electric wires Try to preserve tree balance Merge equal height trees at the root Differently heighted trees at levels to be balanced Clarifies communication, collaboration, and competition network structure
 Their Contribution!")
7 Social Network Clustering and Visualization using Hierarchical Edge Bundles, Jia, Garland, and Hart, Computer Graphics Forum Modularization Quality: average edge density within clusters vs. average edge density between clusters Large MQ = better clustering Unclear if this is actually a good metric? (degeneracies?) Their Contribution! Betweenness Centrality Differential Inter-community vs intra-community edges Was the decision to merge these trees obvious or arbitrary? Used this value as the strength of an edge bundle Tradeoff: accuracy vs. running time Interactive: select or deselect nodes, text queries, change colors, edit numerical bundle strengths Uniform depth optimal for Radial Layout [Eades 92] Social Network Clustering and Visualization using Hierarchical Edge Bundles, Jia, Garland, and Hart, Computer Graphics Forum What are some anecdotal real-world examples of a low BC edge and a high BC edge? Why does it make sense to preserve or simplify away these edges? Why is a tree the best simplified representation of a big complex graph? Ground Truth Comparisons: Why is this the best simplification/rendering? Should this be a future Data Structures Homework?

 Betweenness Centrality http://mathforum.org/mathimages/index.")
8 Social Network Clustering and Visualization using Hierarchical Edge Bundles, Jia, Garland, and Hart, Computer Graphics Forum Writing: Not all steps of prior work presented in full/intuitively Difficult to read when referenced figure is on the next page Each example graph/figure shows something specific, a contribution Lengthy discussion comparing to previous methods Limitations presented and explained Would be nice to also have pseudocode. (or are the many diagrams a visual pseudocode?) Betweenness Centrality Social_Networks#Betweenness_Centrality Click on A More Mathematical Explanation For each pair of nodes A and C in the graph Compute the shortest path between A & C Is B on that path? A->B->C? How many of the paths? Betweenness Centrality of node B = # of times B appears in these shortest paths (Assuming?) Similar definition for Betweenness Centrality of edge B1->B2
9 On the Visualization of Social and other Scale-Free Networks Jia, Hoberock, Garland, and Hart, TVCG Scale free network ==(?) Power law graph Degree distribution follows a power law Few nodes with high degree (called hubs ), many with low degree Naturally occurring in many sciences Goal: Eliminate less important edges in the graph that are seldom used for communication Goal: Simplification will improve the convergence and quality of node layout algorithms Filtering vs. clustering? Automatically vs. interactively? On the Visualization of Social and other Scale-Free Networks Jia, Hoberock, Garland, and Hart, TVCG Clustering works well for planar graphs, but can actually increase the edge density of non planar graphs. Also loses original semantics. Filtering retains edge & node semantics, simplified graph is a subset of the original. Stochastic filtering (random edge deletion) can destroy connectivity & important features Deterministic filtering choice: preserve high betweenness centrality edges focus on communication pathways preserve low betweenness centrality edges focus on clusters

10 On the Visualization of Social and other Scale-Free Networks Jia, Hoberock, Garland, and Hart, TVCG On the Visualization of Social and other Scale-Free Networks Jia, Hoberock, Garland, and Hart, TVCG Preprocess: mark feature edges (e.g., cliques or highly connected components) Priority queue Post-processing: catch errors in connectivity preservation approximation Estimate of betweenness centrality is much faster than exact computation Focus on paths through 50+ hub nodes Summed squared error in shortest paths of simplified vs original graph
 Occlusion of less important lines Interpolate warm to cold colors, highlight high-degree hubs (warm color foreground, cool color recedes) Interactive slider to control")
11 On the Visualization of Social and other Scale-Free Networks Jia, Hoberock, Garland, and Hart, TVCG Rendering Alpha (transparency) Occlusion of less important lines Interpolate warm to cold colors, highlight high-degree hubs (warm color foreground, cool color recedes) Interactive slider to control simplification On the Visualization of Social and other Scale-Free Networks Jia, Hoberock, Garland, and Hart, TVCG How do we know these simplifications are correct/appropriate/not misleading? Metrics may be application domain specific? Study graph statistics Perform tests of random node/edge selection & random walks Overclustering (problem with prior work) can imply that items directly interact when they did not in the original dataset

12 Today Today s Reading: Lombardi Graphs Bezier Curves Today s Reading: Clustering/Hierarchical edge Bundling Definition of Betweenness Centrality Emergency Management Graph Visualization Sean Kim s masters project Reading for Tuesday & Homework 3 Graph Interaction Brainstorming Exercise Emergency Response Decision Making


13 Full network detail is overwhelming Subset of data
14 Zoom and expand information for critical nodes and network links Trace back problem to source of outage


15 Prioritize crew assignments Multi-User Non-Linear Adaptive Magnification for Satellite Imagery and Graph Networks Sean Kim, Masters Thesis, RPI, July 2014
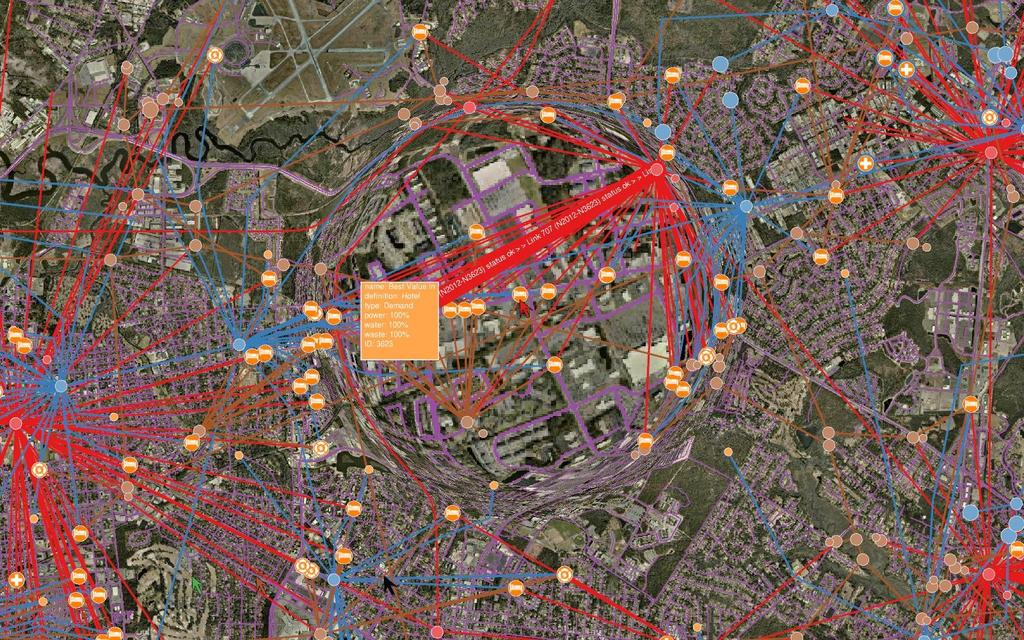
16 Multi-User Non-Linear Adaptive Magnification for Satellite Imagery and Graph Networks Sean Kim, Masters Thesis, RPI, July 2014 Multi-User Non-Linear Adaptive Magnification for Satellite Imagery and Graph Networks Sean Kim, Masters Thesis, RPI, July 2014
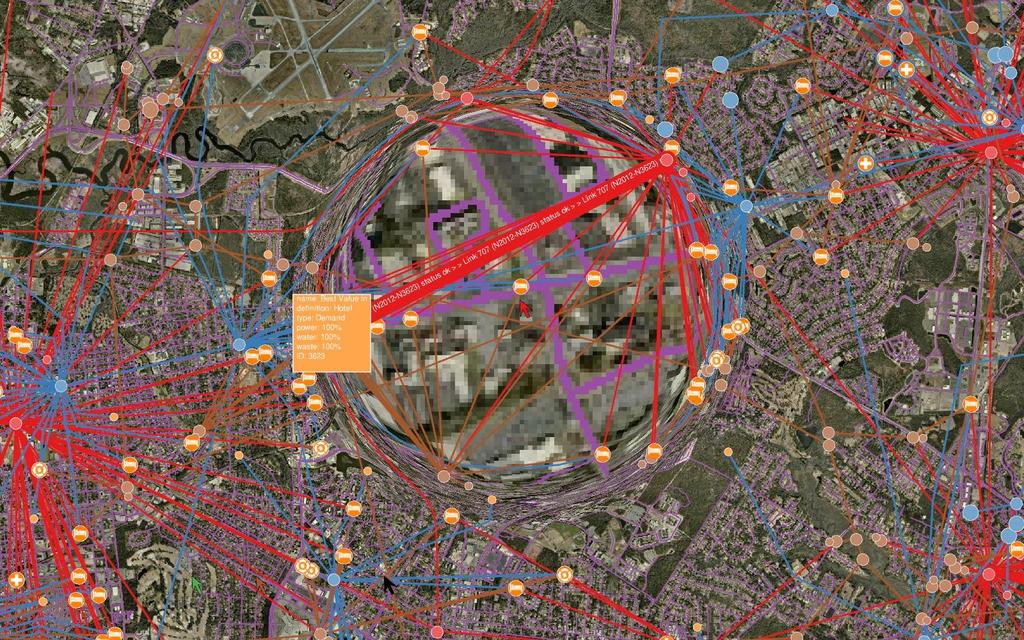
17 Multi-User Non-Linear Adaptive Magnification for Satellite Imagery and Graph Networks Sean Kim, Masters Thesis, RPI, July 2014 Multi-User Non-Linear Adaptive Magnification for Satellite Imagery and Graph Networks Sean Kim, Masters Thesis, RPI, July 2014

18 Today Today s Reading: Lombardi Graphs Bezier Curves Today s Reading: Clustering/Hierarchical edge Bundling Definition of Betweenness Centrality Emergency Management Graph Visualization Sean Kim s masters project Reading for Tuesday & Homework 3 Graph Interaction Brainstorming Exercise Reading for Tuesday Post a comment/question on LMS by Useful Junk? The Effects of Visual Embellishment on Comprehension and Memorability of Charts Bateman et al., CHI Article discussed here:
 Make an interactive (visualization) artifact: Depends on your level of prior experience with Web Development tools")
19 Homework Assignment 3: due 11:59pm Intro to (Web-Based) Interaction Explore the examples on the D3: Data-Driven Documents website (download the examples, modify them, start to read the documentation) Make an interactive (visualization) artifact: Depends on your level of prior experience with Web Development tools (if you re already a D3 expert, you can choose another new-to-you tool) Purpose: Can be silly & possibly exemplify our bad visualization traits (pie charts, chart junk, etc.) Types of interaction may include: pop up text messages data hide/reveal/emphasize/restructure font/size/color/transparency change Story-boarding
 Enhance the course, prerequisite, and degree requirements graph from last lecture to include interaction.")
20 Wizard-of-Oz for Interface Design cse440/12wi/projects/pocketdoctor/medfi.html Today s Worksheet Teams of 2. Someone you did not work with last time. Hopefully someone you just met in this course :) Enhance the course, prerequisite, and degree requirements graph from last lecture to include interaction. Story board/ Wizard of Oz interaction use case for a sophomore planning courses and/or about adding a dual or switching majors Initial Visualization (showing completed courses vs. requirements) Sketch/label a simple UI (checkboxes, radio buttons, drop down menus, visual object interaction via click/drag, etc.) Clearly label a specific action the user might make Post-Action Visualization (show course selection or impact of add dual or change-of-major)
Lombardi Spring Embedder (Short Demo)
") Lombardi Spring Embedder (Short Demo) Roman Chernobelskiy, Kathryn Cunningham, and Stephen G. Kobourov Department of Computer Science, University of Arizona Tucson, AZ, USA Abstract. A Lombardi drawing
Lombardi Spring Embedder (Short Demo) Roman Chernobelskiy, Kathryn Cunningham, and Stephen G. Kobourov Department of Computer Science, University of Arizona Tucson, AZ, USA Abstract. A Lombardi drawing
Mesh Quality Tutorial
 Mesh Quality Tutorial Figure 1: The MeshQuality model. See Figure 2 for close-up of bottom-right area This tutorial will illustrate the importance of Mesh Quality in PHASE 2. This tutorial will also show
IAT 355 Intro to Visual Analytics Graphs, trees and networks 2. Lyn Bartram
 IAT 355 Intro to Visual Analytics Graphs, trees and networks 2 Lyn Bartram Graphs and Trees: Connected Data Graph Vertex/node with one or more edges connecting it to another node Cyclic or acyclic Edge
Graphs and Networks 1
 Graphs and Networks 1 CS 4460 Intro. to Information Visualization November 6, 2017 John Stasko Learning Objectives Define network concepts vertex, edge, cycle, degree, direction Describe different node-link
1.2 Graph Drawing Techniques
 1.2 Graph Drawing Techniques Graph drawing is the automated layout of graphs We shall overview a number of graph drawing techniques For general graphs: Force Directed Spring Embedder Barycentre based Multicriteria
On the Visualization of Social and other Scale-Free Networks
 On the Visualization of Social and other Scale-Free Networks Yuntao Jia 1, Jared Hoberock 1, Micha Garland 2, and John C. Hart 1 1 University of Illinois at Urbana-Champaign 2 NVIDIA Yuntao Jia yjia3@illinois.edu
8. Visual Analytics. Prof. Tulasi Prasad Sariki SCSE, VIT, Chennai
 8. Visual Analytics Prof. Tulasi Prasad Sariki SCSE, VIT, Chennai www.learnersdesk.weebly.com Graphs & Trees Graph Vertex/node with one or more edges connecting it to another node. Cyclic or acyclic Edge
Graph/Network Visualization
 Graph/Network Visualization Data model: graph structures (relations, knowledge) and networks. Applications: Telecommunication systems, Internet and WWW, Retailers distribution networks knowledge representation
Graph and Tree Layout
 CS8B :: Nov Graph and Tree Layout Topics Graph and Tree Visualization Tree Layout Graph Layout Jeffrey Heer Stanford University Goals Overview of layout approaches and their strengths and weaknesses Insight
Lecture IV Bézier Curves
 Lecture IV Bézier Curves Why Curves? Why Curves? Why Curves? Why Curves? Why Curves? Linear (flat) Curved Easier More pieces Looks ugly Complicated Fewer pieces Looks smooth What is a curve? Intuitively:
Convex Hulls, Voronoi Diagrams, & k-means Clustering
 Convex Hulls, Voronoi Diagrams, & k-means Clustering Today Reading: LineUp: Visual Analysis of Multi-Attribute Rankings Let s do Computational Geometry Convex Hull Voronoi Diagram k-means Clustering HW4:
Curves & Surfaces. Last Time? Progressive Meshes. Selective Refinement. Adjacency Data Structures. Mesh Simplification. Mesh Simplification
 Last Time? Adjacency Data Structures Curves & Surfaces Geometric & topologic information Dynamic allocation Efficiency of access Mesh Simplification edge collapse/vertex split geomorphs progressive transmission
Input: Interaction Techniques
 Input: Interaction Techniques Administration Questions about homework? 2 Interaction techniques A method for carrying out a specific interactive task Example: enter a number in a range could use (simulated)
Week 6: Networks, Stories, Vis in the Newsroom
 Week 6: Networks, Stories, Vis in the Newsroom Tamara Munzner Department of Computer Science University of British Columbia JRNL 520H, Special Topics in Contemporary Journalism: Data Visualization Week
Stats 170A: Project in Data Science Exploratory Data Analysis: Clustering Algorithms
 Stats 170A: Project in Data Science Exploratory Data Analysis: Clustering Algorithms Padhraic Smyth Department of Computer Science Bren School of Information and Computer Sciences University of California,
Locating Images is Curved Mirrors
 Locating Images is Curved Mirrors Part 1: Intro and Concave Mirrors Types of Mirrors Concave (Converging) mirror - the centre of the mirror bulges away from you (eg. makeup mirror, car headlight, flashlight)
Surface Simplification Using Quadric Error Metrics
 Surface Simplification Using Quadric Error Metrics Authors: Michael Garland & Paul Heckbert Presented by: Niu Xiaozhen Disclaimer: Some slides are modified from original slides, which were designed by
CS559 Computer Graphics Fall 2015
 CS559 Computer Graphics Fall 2015 Practice Final Exam Time: 2 hrs 1. [XX Y Y % = ZZ%] MULTIPLE CHOICE SECTION. Circle or underline the correct answer (or answers). You do not need to provide a justification
Blacksburg, VA July 24 th 30 th, 2010 Digitizing and Analyzing Data Page 1
 Digitizing and Analyzing Data John McGee Jennifer McKee Prepared by: With support from: NSF DUE-0903270 in partnership with: Geospatial Technician Education Through Virginia s Community Colleges (GTEVCC)
Constraint Based Modeling Geometric and Dimensional. ENGR 1182 SolidWorks 03
 Constraint Based Modeling Geometric and Dimensional ENGR 1182 SolidWorks 03 Today s Objectives Using two different type of constraints in SolidWorks: Geometric Dimensional SW03 In-Class Activity List Geometric
6. Graphs & Networks. Visualizing relations. Dr. Thorsten Büring, 29. November 2007, Vorlesung Wintersemester 2007/08
 6. Graphs & Networks Visualizing relations Dr. Thorsten Büring, 29. November 2007, Vorlesung Wintersemester 2007/08 Slide 1 / 46 Outline Graph overview Terminology Networks and trees Data structures Graph
Lecture 7: Depth/Occlusion
 Lecture 7: Depth/Occlusion Information Visualization CPSC 533C, Fall 2006 Tamara Munzner UBC Computer Science 3 October 2006 Readings Covered Ware, Chapter 8: Space Perception and the Display of Data in
Vectorization Using Stochastic Local Search
 Vectorization Using Stochastic Local Search Byron Knoll CPSC303, University of British Columbia March 29, 2009 Abstract: Stochastic local search can be used for the process of vectorization. In this project,
Two Papers on Network Visualization. CPSC 533c Presented by: Jeremy Hilliker
 Two Papers on Network Visualization CPSC 533c Presented by: Jeremy Hilliker 2005-11-07 3D Geographic Network Displays Cox, Eick, He Bell Laboratories 1996 Motivation Computer networks can be represented
6. Graphs and Networks visualizing relations
 6. Graphs and Networks visualizing relations Vorlesung Informationsvisualisierung Prof. Dr. Andreas Butz, WS 2011/12 Konzept und Basis für n: Thorsten Büring 1 Outline Graph overview Terminology Networks
Advanced Texture-Mapping Curves and Curved Surfaces. Pre-Lecture Business. Texture Modes. Texture Modes. Review quiz
 Advanced Texture-Mapping Curves and Curved Surfaces Pre-ecture Business loadtexture example midterm handed bac, code posted (still) get going on pp3! more on texturing review quiz CS148: Intro to CG Instructor:
Information Visualization. Jing Yang Spring Graph Visualization
 Information Visualization Jing Yang Spring 2007 1 Graph Visualization 2 1 When? Ask the question: Is there an inherent relation among the data elements to be visualized? If yes -> data: nodes relations:
Overview. Animation is a big topic We will concentrate on character animation as is used in many games today. humans, animals, monsters, robots, etc.
 ANIMATION Overview Animation is a big topic We will concentrate on character animation as is used in many games today humans, animals, monsters, robots, etc. Character Representation A character is represented
Graph and Tree Layout
 CS8B :: Nov Graph and Tree Layout Topics Graph and Tree Visualization Tree Layout Graph Layout Goals Overview of layout approaches and their strengths and weaknesses Insight into implementation techniques
Classification of Extremal Curves with 6 Double Points and of Tree-like Curves with 6 Double Points and I! 5
 Classification of Extremal Curves with 6 Double Points and of Tree-like Curves with 6 Double Points and I! 5 Tim Ritter Bethel College Mishawaka, IN timritter@juno.com Advisor: Juha Pohjanpelto Oregon
To Do. Resources. Algorithm Outline. Simplifications. Advanced Computer Graphics (Spring 2013) Surface Simplification: Goals (Garland)
 Surface Simplification: Goals (Garland)") Advanced omputer Graphics (Spring 213) S 283, Lecture 6: Quadric Error Metrics Ravi Ramamoorthi To Do Assignment 1, Due Feb 22. Should have made some serious progress by end of week This lecture reviews
Advanced omputer Graphics (Spring 213) S 283, Lecture 6: Quadric Error Metrics Ravi Ramamoorthi To Do Assignment 1, Due Feb 22. Should have made some serious progress by end of week This lecture reviews
Appendix E Calculating Normal Vectors
 OpenGL Programming Guide (Addison-Wesley Publishing Company) Appendix E Calculating Normal Vectors This appendix describes how to calculate normal vectors for surfaces. You need to define normals to use
Graphs and Networks 2
 Topic Notes Graphs and Networks 2 CS 7450 - Information Visualization October 23, 2013 John Stasko Review Last time we looked at graph layout aesthetics and algorithms, as well as some example applications
Sampling, Aliasing, & Mipmaps
 Sampling, Aliasing, & Mipmaps Last Time? Monte-Carlo Integration Importance Sampling Ray Tracing vs. Path Tracing source hemisphere What is a Pixel? Sampling & Reconstruction Filters in Computer Graphics
6. Graphs and Networks visualizing relations
 6. Graphs and Networks visualizing relations Vorlesung Informationsvisualisierung Prof. Dr. Andreas Butz, WS 2009/10 Konzept und Basis für n: Thorsten Büring 1 Outline Graph overview Terminology Networks
Force-Directed Lombardi-Style Graph Drawing
 Force-Directed Lombardi-Style Graph Drawing Roman Chernobelskiy 1, Kathryn I. Cunningham 1, Michael T. Goodrich 2, Stephen G. Kobourov 1, and Lowell Trott 2 1 Department of Computer Science, University
Mesh Decimation. Mark Pauly
 Mesh Decimation Mark Pauly Applications Oversampled 3D scan data ~150k triangles ~80k triangles Mark Pauly - ETH Zurich 280 Applications Overtessellation: E.g. iso-surface extraction Mark Pauly - ETH Zurich
cs6964 February TABULAR DATA Miriah Meyer University of Utah
 cs6964 February 23 2012 TABULAR DATA Miriah Meyer University of Utah cs6964 February 23 2012 TABULAR DATA Miriah Meyer University of Utah slide acknowledgements: John Stasko, Georgia Tech Tamara Munzner,
Kinematics of Machines Prof. A. K. Mallik Department of Mechanical Engineering Indian Institute of Technology, Kanpur. Module 10 Lecture 1
 Kinematics of Machines Prof. A. K. Mallik Department of Mechanical Engineering Indian Institute of Technology, Kanpur Module 10 Lecture 1 So far, in this course we have discussed planar linkages, which
Data Science. Data Analyst. Data Scientist. Data Architect
 Data Science Data Analyst Data Analysis in Excel Programming in R Introduction to Python/SQL/Tableau Data Visualization in R / Tableau Exploratory Data Analysis Data Scientist Inferential Statistics &
CSE 167: Introduction to Computer Graphics Lecture #13: Curves. Jürgen P. Schulze, Ph.D. University of California, San Diego Fall Quarter 2017
 CSE 167: Introduction to Computer Graphics Lecture #13: Curves Jürgen P. Schulze, Ph.D. University of California, San Diego Fall Quarter 2017 Announcements Project 4 due Monday Nov 27 at 2pm Next Tuesday:
This work is about a new method for generating diffusion curve style images. Although this topic is dealing with non-photorealistic rendering, as you
 This work is about a new method for generating diffusion curve style images. Although this topic is dealing with non-photorealistic rendering, as you will see our underlying solution is based on two-dimensional
GENERALIZATIONS Cartographic Design & Principles Winter 2017
 GENERALIZATIONS Cartographic Design & Principles Winter 2017 The earth is infinitely complex maps are models that require some level of generalization Methods of Generalization Selection Dimension Simplification
Krita Vector Tools
 Krita 2.9 05 Vector Tools In this chapter we will look at each of the vector tools. Vector tools in Krita, at least for now, are complementary tools for digital painting. They can be useful to draw clean
INDEX UNIT 4 PPT SLIDES
 INDEX UNIT 4 PPT SLIDES S.NO. TOPIC 1. 2. Screen designing Screen planning and purpose arganizing screen elements 3. 4. screen navigation and flow Visually pleasing composition 5. 6. 7. 8. focus and emphasis
Large Scale Information Visualization. Jing Yang Fall Graph Visualization
 Large Scale Information Visualization Jing Yang Fall 2007 1 Graph Visualization 2 1 When? Ask the question: Is there an inherent relation among the data elements to be visualized? If yes -> data: nodes
Input part 3: Interaction Techniques
 Input part 3: Interaction Techniques Interaction techniques A method for carrying out a specific interactive task Example: enter a number in a range could use (simulated) slider (simulated) knob type in
GCSE-AS Mathematics Bridging Course. Chellaston School. Dr P. Leary (KS5 Coordinator) Monday Objectives. The Equation of a Line.
 Monday Objectives. The Equation of a Line.") GCSE-AS Mathematics Bridging Course Chellaston School Dr (KS5 Coordinator) Monday Objectives The Equation of a Line Surds Linear Simultaneous Equations Tuesday Objectives Factorising Quadratics & Equations
GCSE-AS Mathematics Bridging Course Chellaston School Dr (KS5 Coordinator) Monday Objectives The Equation of a Line Surds Linear Simultaneous Equations Tuesday Objectives Factorising Quadratics & Equations
Network visualization techniques and evaluation
 Network visualization techniques and evaluation The Charlotte Visualization Center University of North Carolina, Charlotte March 15th 2007 Outline 1 Definition and motivation of Infovis 2 3 4 Outline 1
Geometry Vocabulary Math Fundamentals Reference Sheet Page 1
 Math Fundamentals Reference Sheet Page 1 Acute Angle An angle whose measure is between 0 and 90 Acute Triangle A that has all acute Adjacent Alternate Interior Angle Two coplanar with a common vertex and
2. You are required to enter a password of up to 100 characters. The characters must be lower ASCII, printing characters.
 BLACK BOX SOFTWARE TESTING SPRING 2005 DOMAIN TESTING LAB PROJECT -- GRADING NOTES For all of the cases below, do the traditional equivalence class and boundary analysis. Draw one table and use a new line
CSE 167: Introduction to Computer Graphics Lecture 12: Bézier Curves. Jürgen P. Schulze, Ph.D. University of California, San Diego Fall Quarter 2013
 CSE 167: Introduction to Computer Graphics Lecture 12: Bézier Curves Jürgen P. Schulze, Ph.D. University of California, San Diego Fall Quarter 2013 Announcements Homework assignment 5 due tomorrow, Nov
RINGS : A Technique for Visualizing Large Hierarchies
 RINGS : A Technique for Visualizing Large Hierarchies Soon Tee Teoh and Kwan-Liu Ma Computer Science Department, University of California, Davis {teoh, ma}@cs.ucdavis.edu Abstract. We present RINGS, a
Visual Computing. Lecture 2 Visualization, Data, and Process
 Visual Computing Lecture 2 Visualization, Data, and Process Pipeline 1 High Level Visualization Process 1. 2. 3. 4. 5. Data Modeling Data Selection Data to Visual Mappings Scene Parameter Settings (View
Lecture 25: Bezier Subdivision. And he took unto him all these, and divided them in the midst, and laid each piece one against another: Genesis 15:10
 Lecture 25: Bezier Subdivision And he took unto him all these, and divided them in the midst, and laid each piece one against another: Genesis 15:10 1. Divide and Conquer If we are going to build useful
Subdivision Surfaces. Homework 1: Questions/Comments?
 Subdivision Surfaces Homework 1: Questions/Comments? 1 Questions on Homework? What s an illegal edge collapse? 1 2 3 a b 4 7 To be legal, the ring of vertex neighbors must be unique (have no duplicates)!
Computer Graphics I Lecture 11
 15-462 Computer Graphics I Lecture 11 Midterm Review Assignment 3 Movie Midterm Review Midterm Preview February 26, 2002 Frank Pfenning Carnegie Mellon University http://www.cs.cmu.edu/~fp/courses/graphics/
Drawing Metro Maps using Bézier Curves
 Drawing Metro Maps using Bézier Curves Martin Fink Lehrstuhl für Informatik I Universität Würzburg Joint work with Herman Haverkort, Martin Nöllenburg, Maxwell Roberts, Julian Schuhmann & Alexander Wolff
5.5 Newton s Approximation Method
 498CHAPTER 5. USING DERIVATIVES TO ANALYZE FUNCTIONS; FURTHER APPLICATIONS 4 3 y = x 4 3 f(x) = x cosx y = cosx 3 3 x = cosx x cosx = 0 Figure 5.: Figure showing the existence of a solution of x = cos
Organizing Design Data
 Organizing Design Data Module Overview This module explains how to use the data in different files for reference purposes. Module Prerequisites Knowledge of MicroStation s interface Some knowledge about
Introduction to ANSYS DesignXplorer
 Lecture 4 14. 5 Release Introduction to ANSYS DesignXplorer 1 2013 ANSYS, Inc. September 27, 2013 s are functions of different nature where the output parameters are described in terms of the input parameters
Glyphs. Presentation Overview. What is a Glyph!? Cont. What is a Glyph!? Glyph Fundamentals. Goal of Paper. Presented by Bertrand Low
 Presentation Overview Glyphs Presented by Bertrand Low A Taxonomy of Glyph Placement Strategies for Multidimensional Data Visualization Matthew O. Ward, Information Visualization Journal, Palmgrave,, Volume
MAE 384 Numerical Methods for Engineers
 MAE 384 Numerical Methods for Engineers Instructor: Huei-Ping Huang office: ERC 359, email: hp.huang@asu.edu (Huei rhymes with way ) Tu/Th 9:00-10:15 PM WGHL 101 Textbook: Numerical Methods for Engineers
Visualize the Network Topology
 Network Topology Overview, page 1 Datacenter Topology, page 3 View Detailed Tables of Alarms and Links in a Network Topology Map, page 3 Determine What is Displayed in the Topology Map, page 4 Get More
Lesson 14 Blends. For Resources go to > click on the Creo Parametric Book cover
 Lesson 14 Blends Figure 14.1 Cap OBJECTIVES Create a Parallel Blend feature Use the Shell Tool Create a Swept Blend REFERENCES AND RESOURCES For Resources go to www.cad-resources.com > click on the Creo
Hyperbolic Traffic Load Centrality for Large-Scale Complex Communications Networks
 ICT 2016: 23 rd International Conference on Telecommunications Hyperbolic Traffic Load Centrality for Large-Scale Complex Communications Networks National Technical University of Athens (NTUA) School of
Let s start with occluding contours (or interior and exterior silhouettes), and look at image-space algorithms. A very simple technique is to render
, and look at image-space algorithms. A very simple technique is to render") 1 There are two major classes of algorithms for extracting most kinds of lines from 3D meshes. First, there are image-space algorithms that render something (such as a depth map or cosine-shaded model),
1 There are two major classes of algorithms for extracting most kinds of lines from 3D meshes. First, there are image-space algorithms that render something (such as a depth map or cosine-shaded model),
H.Geometry Chapter 3 Definition Sheet
 Section 3.1 Measurement Tools Construction Tools Sketch Draw Construct Constructing the Duplicate of a Segment 1.) Start with a given segment. 2.) 3.) Constructing the Duplicate of an angle 1.) Start with
Calculus (Math 1A) Lecture 1
 Lecture 1") Calculus (Math 1A) Lecture 1 Vivek Shende August 23, 2017 Hello and welcome to class! I am Vivek Shende I will be teaching you this semester. My office hours Starting next week: 1-3 pm on tuesdays; 2-3
Calculus (Math 1A) Lecture 1 Vivek Shende August 23, 2017 Hello and welcome to class! I am Vivek Shende I will be teaching you this semester. My office hours Starting next week: 1-3 pm on tuesdays; 2-3
Graph Layout. Last Time: Conveying Structure. Framework for conveying structure. Photographs and illustrations. What is a good view?
 Graph Layout Maneesh Agrawala Last Time: Conveying Structure CS 294-10: Visualization Spring 2011 Photographs and illustrations Framework for conveying structure Goal: Expose important internal features
Parallel Computation of Spherical Parameterizations for Mesh Analysis. Th. Athanasiadis and I. Fudos University of Ioannina, Greece
 Parallel Computation of Spherical Parameterizations for Mesh Analysis Th. Athanasiadis and I. Fudos, Greece Introduction Mesh parameterization is a powerful geometry processing tool Applications Remeshing
Geometric Modeling. Mesh Decimation. Mesh Decimation. Applications. Copyright 2010 Gotsman, Pauly Page 1. Oversampled 3D scan data
 Applications Oversampled 3D scan data ~150k triangles ~80k triangles 2 Copyright 2010 Gotsman, Pauly Page 1 Applications Overtessellation: E.g. iso-surface extraction 3 Applications Multi-resolution hierarchies
An Introduction to GeoGebra
 An Introduction to GeoGebra Downloading and Installing Acquiring GeoGebra GeoGebra is an application for exploring and demonstrating Geometry and Algebra. It is an open source application and is freely
Introduction to Computer Science
 Introduction to Computer Science CSCI 09 Readings St. Amant, Ch. China nhe- Andrew Goodney Fall 08 An algorithm (pronounced AL-go-rithum) is a procedure or formula for solving a problem. The word derives
YEAR 12 Core 1 & 2 Maths Curriculum (A Level Year 1)
") YEAR 12 Core 1 & 2 Maths Curriculum (A Level Year 1) Algebra and Functions Quadratic Functions Equations & Inequalities Binomial Expansion Sketching Curves Coordinate Geometry Radian Measures Sine and
YEAR 12 Core 1 & 2 Maths Curriculum (A Level Year 1) Algebra and Functions Quadratic Functions Equations & Inequalities Binomial Expansion Sketching Curves Coordinate Geometry Radian Measures Sine and
MA 323 Geometric Modelling Course Notes: Day 03 The Design Problem
 M 2 Geometric Modelling ourse Notes: ay 0 The esign Problem avid L. Finn ecember 2nd, 2004 Yesterday, we introduced the model construction problem, and discussed two methods for creating curve models.
Geometric Features for Non-photorealistiic Rendering
 CS348a: Computer Graphics Handout # 6 Geometric Modeling and Processing Stanford University Monday, 27 February 2017 Homework #4: Due Date: Mesh simplification and expressive rendering [95 points] Wednesday,
SOFTWARE REQUIREMENTS ENGINEERING LECTURE # 7 TEAM SKILL 2: UNDERSTANDING USER AND STAKEHOLDER NEEDS REQUIREMENT ELICITATION TECHNIQUES-IV
 1 SOFTWARE REQUIREMENTS ENGINEERING LECTURE # 7 TEAM SKILL 2: UNDERSTANDING USER AND STAKEHOLDER NEEDS REQUIREMENT ELICITATION TECHNIQUES-IV 12 th June, 2013 Instructor Information 2 Course Instructor:
DC2 File Format. 1. Header line 2. Entity line 3. Point line 4. String line
 DC2 File Format The DesignCAD DC2 drawing file is an ASCII file, with the data present in character format. Each "record" in the file is actually a line in a text file. There are four types of records,
Design considerations
 Curves Design considerations local control of shape design each segment independently smoothness and continuity ability to evaluate derivatives stability small change in input leads to small change in
Big Apple Academy 2017 Mathematics Department
 Big Apple Academy 201 Mathematics Department Grade Homework Math Package It is important that you keep practicing your mathematical Knowledge over the summer to be ready for 5 th grade. In this Package
Lecture 6: GIS Spatial Analysis. GE 118: INTRODUCTION TO GIS Engr. Meriam M. Santillan Caraga State University
 Lecture 6: GIS Spatial Analysis GE 118: INTRODUCTION TO GIS Engr. Meriam M. Santillan Caraga State University 1 Spatial Data It can be most simply defined as information that describes the distribution
Math Dr. Miller - Constructing in Sketchpad (tm) - Due via by Friday, Mar. 18, 2016
 - Due via by Friday, Mar. 18, 2016") Math 304 - Dr. Miller - Constructing in Sketchpad (tm) - Due via email by Friday, Mar. 18, 2016 As with our second GSP activity for this course, you will email the assignment at the end of this tutorial
Math 304 - Dr. Miller - Constructing in Sketchpad (tm) - Due via email by Friday, Mar. 18, 2016 As with our second GSP activity for this course, you will email the assignment at the end of this tutorial
Visualisierung von Graphen
 Visualisierung von Graphen Smooth Orthogonal Drawings of Planar Graphs. Vorlesung Sommersemester 205 Orthogonal Layouts all edge segments are horizontal or vertical a well-studied drawing convention many
Visual Layout of Graph-Like Models
 Visual Layout of Graph-Like Models Tarek Sharbak MhdTarek.Sharbak@uantwerpen.be Abstract The modeling of complex software systems has been growing significantly in the last years, and it is proving to
Central issues in modelling
 Central issues in modelling Construct families of curves, surfaces and volumes that can represent common objects usefully; are easy to interact with; interaction includes: manual modelling; fitting to
Light, Photons, and MRI
 Light, Photons, and MRI When light hits an object, some of it will be reflected. The reflected light can form an image. We usually want to be able to characterize the image given what we know about the
Topics and things to know about them:
 Practice Final CMSC 427 Distributed Tuesday, December 11, 2007 Review Session, Monday, December 17, 5:00pm, 4424 AV Williams Final: 10:30 AM Wednesday, December 19, 2007 General Guidelines: The final will
Introduction to GIS A Journey Through Gale Crater
 Introduction to GIS A Journey Through Gale Crater In this lab you will be learning how to use ArcMap, one of the most common commercial software packages for GIS (Geographic Information System). Throughout
Let s Make a Front Panel using FrontCAD
 Let s Make a Front Panel using FrontCAD By Jim Patchell FrontCad is meant to be a simple, easy to use CAD program for creating front panel designs and artwork. It is a free, open source program, with the
Foundations, Reasoning About Algorithms, and Design By Contract CMPSC 122
 Foundations, Reasoning About Algorithms, and Design By Contract CMPSC 122 I. Logic 101 In logic, a statement or proposition is a sentence that can either be true or false. A predicate is a sentence in
ME 111: Engineering Drawing. Geometric Constructions
 ME 111: Engineering Drawing Lecture 2 01-08-2011 Geometric Constructions Indian Institute of Technology Guwahati Guwahati 781039 Geometric Construction Construction of primitive geometric forms (points,
Lab Practical - Limit Equilibrium Analysis of Engineered Slopes
 Lab Practical - Limit Equilibrium Analysis of Engineered Slopes Part 1: Planar Analysis A Deterministic Analysis This exercise will demonstrate the basics of a deterministic limit equilibrium planar analysis
Kinematics of Machines Prof. A. K. Mallik Department of Mechanical Engineering Indian Institute of Technology, Kanpur. Module - 3 Lecture - 1
 Kinematics of Machines Prof. A. K. Mallik Department of Mechanical Engineering Indian Institute of Technology, Kanpur Module - 3 Lecture - 1 In an earlier lecture, we have already mentioned that there
Lecture 13: Visualization and navigation of graphs Graph Layout
 MTTTS17 Dimensionality Reduction and Visualization Spring 2018 Jaakko Peltonen Lecture 13: Visualization and navigation of graphs Graph Layout Slides originally by Francesco Corona and Manuel J.A. Eugster
EVALUATION OF PROTOTYPES USABILITY TESTING
 EVALUATION OF PROTOTYPES USABILITY TESTING CPSC 544 FUNDAMENTALS IN DESIGNING INTERACTIVE COMPUTATION TECHNOLOGY FOR PEOPLE (HUMAN COMPUTER INTERACTION) WEEK 9 CLASS 17 Joanna McGrenere and Leila Aflatoony
CSCE 441 Computer Graphics Fall 2018
 CSCE 441 Computer Graphics Fall 2018 Meetings: Monday, Wednesday, Friday 9:10-10:00 a.m. Location: HRBB 113 Instructor: Dr. John Keyser Office: 527C, H.R. Bright Building Phone: 458-0167 Email: keyser@cse.tamu.edu
Workshop: Dynamic Inspirations with Nspire Dr. René Hugelshofer, Heerbrugg, Switzerland.
 Workshop: Dynamic Inspirations with Nspire Dr. René Hugelshofer, Heerbrugg, Switzerland. Part One: Presentation of TI-nspire Preface: TI-nspire is the new software from TI. This version is only a test
2D rendering takes a photo of the 2D scene with a virtual camera that selects an axis aligned rectangle from the scene. The photograph is placed into
 2D rendering takes a photo of the 2D scene with a virtual camera that selects an axis aligned rectangle from the scene. The photograph is placed into the viewport of the current application window. A pixel
3D Modeling: Surfaces
 CS 430/536 Computer Graphics I 3D Modeling: Surfaces Week 8, Lecture 16 David Breen, William Regli and Maxim Peysakhov Geometric and Intelligent Computing Laboratory Department of Computer Science Drexel