cs6964 February TABULAR DATA Miriah Meyer University of Utah
|
|
|
- Blaze Wilkerson
- 6 years ago
- Views:
Transcription
1 cs6964 February TABULAR DATA Miriah Meyer University of Utah
2 cs6964 February TABULAR DATA Miriah Meyer University of Utah slide acknowledgements: John Stasko, Georgia Tech Tamara Munzner, UBC
3 administrivia 3
4 - for final projects that have been approved, me: - working title - group member names - two or three sentence description 4
5 LAST TIME 5
6 6
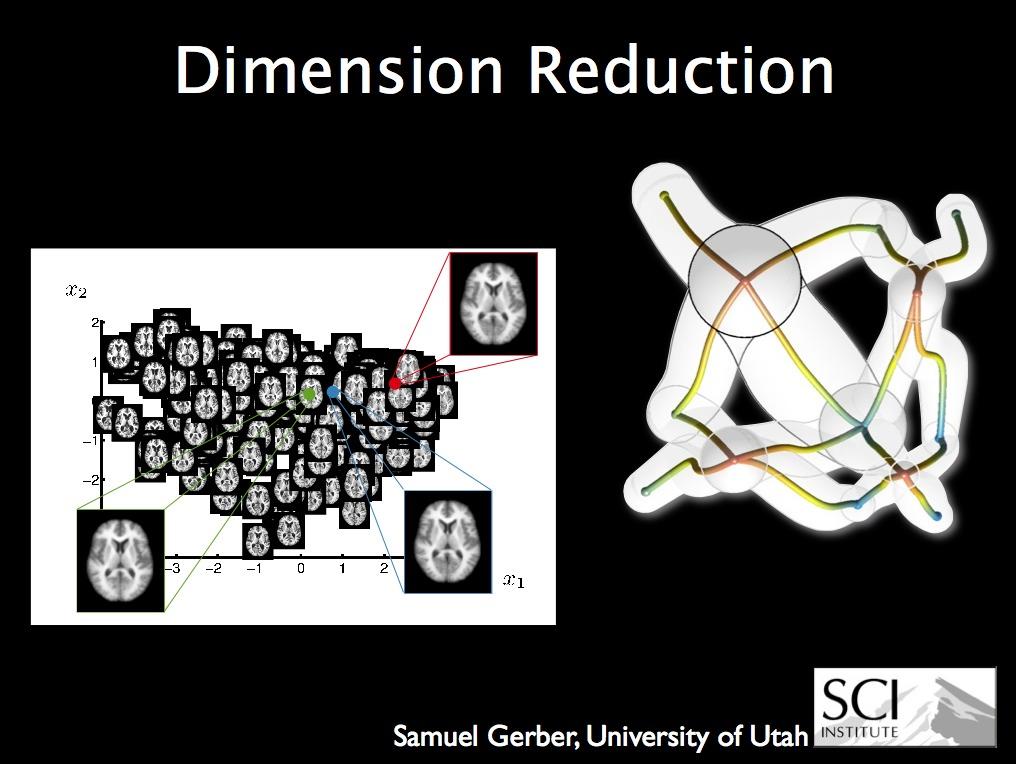
7 - curse of dimensionality - linear methods - multidimensional scale - manifold learning 7
8 WHERE ARE WE? - covered so far - abstractions - methods - visual representations - interactions - next stage: use these ideas for analysis and design - analyze previously proposed techniques and systems - design new techniques and systems - me: next couple of lectures as examples - you: project proposal and topic presentations 8
9 - multiscale scatterplots - hierarchical parallel coordinates - streamgraph 9
10 10

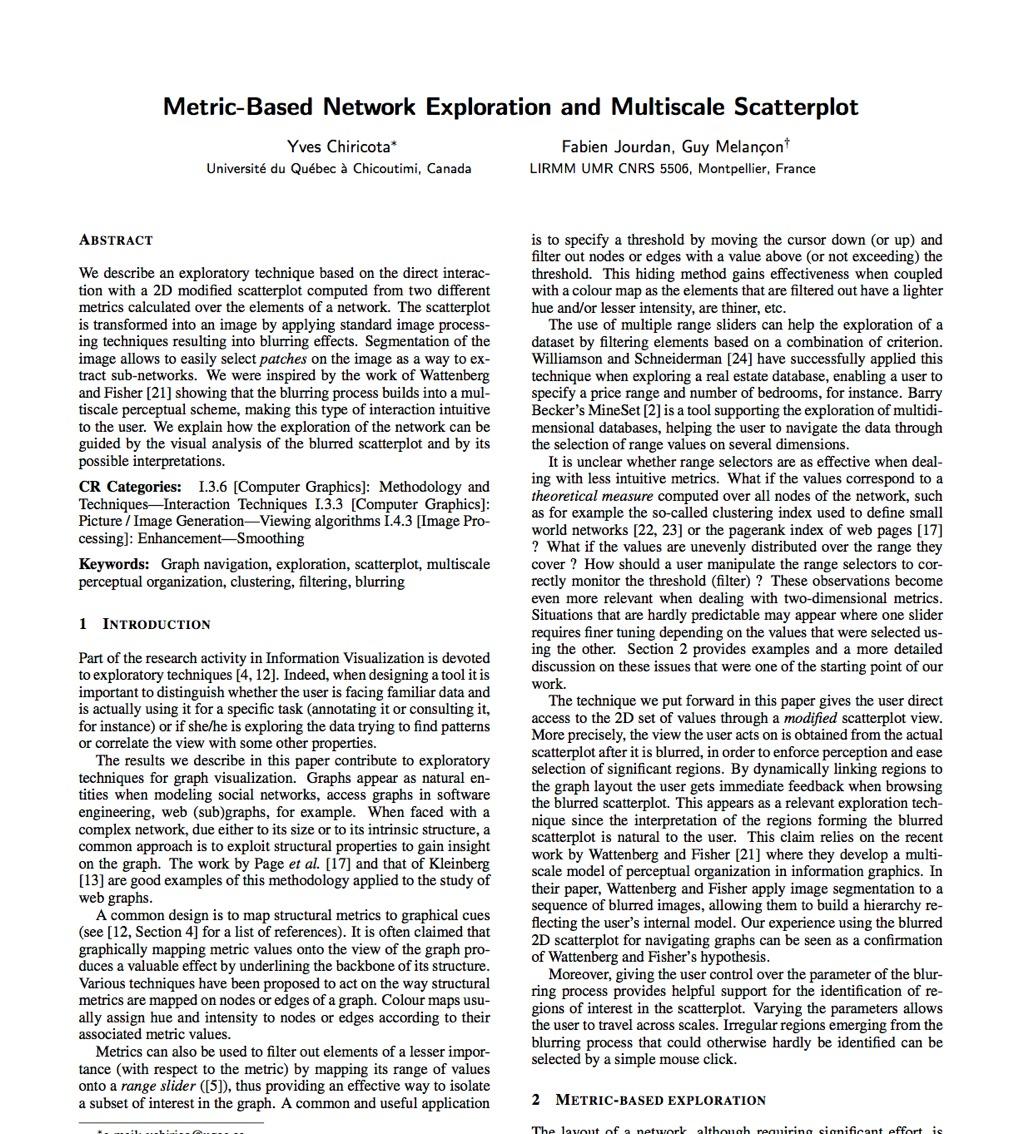
11 MULTISCALE SCATTERPLOTS - blur shows structure at multiple scales - convolve with Gaussian - slider to control scale parameter interactively - easily selectable regions in quantized image 11 Chiricota 2004
12 MULTISCALE SCATTERPLOTS - problem characterization: - generic network exploration - minimal problem context - paper is technique-driven not problem-driven - abstraction - task - selecting and filtering at different scales (within scatterplots) 12

13 DATA ABSTRACTION - original data - relational network - such as links between Java classes - derived attributes - two structure metrics for network - edge width: cluster cohesiveness - edge color: logical dependencies between classes - thus, table of numbers! 13 Chiricota 2004
14 DESIGN - basic solution - visual representation: scatterplots - mark type: points - channels: horizontal and vertical position - interaction technique: range sliders - filter max / min - challenge - interesting areas might not be easy to select as rectangular bounding box 14 Chiricota 2004

15 MULTISCALE SCATTERPLOT SELECTION TECHNIQUE - new representation - derived space created from original scatterplot image - greyscale patches forming complex shapes - enclosure of darker patches within lighter patches - new interaction - simple - sliders for filtering size of patch and number of levels - complex - single click to select all items at and below the specified level 15 Chiricota 2004

16 ALGORITHM - creating derived space - greyscale intensity is combination of: - blurred proximity relationships from original scatterplot image: convolve with Gaussian filter - point density in original scatterplot image - similar to splatting techniques - quantize image into k levels 16 Chiricota 2004

17 METHOD: LINKED VIEWS - linked scatterplot and node-link network view - linked highlighting - linked filtering 17 Chiricota 2004

18 RESULTS: IMDB - original data: IMDB graph of actors - metrics: network centrality, node degree - three hubs selected in network view 18 Chiricota 2004
19 RESULTS: IMDB - single click in blurred scatterplot view selects entire clique 19 Chiricota 2004
20 CRITIQUE: what do you think? 20
21 CRITIQUE - strengths - successful construction and use of derived space - appropriate validation - qualitative discussion of result images to show new technique capabilities - synergy between encoding and interaction choices - weaknesses - tricky to follow thread of argument - intro/framing focuses on network exploration - but, fundamental technique contribution more about scatterplot encoding and interaction 21
22 22


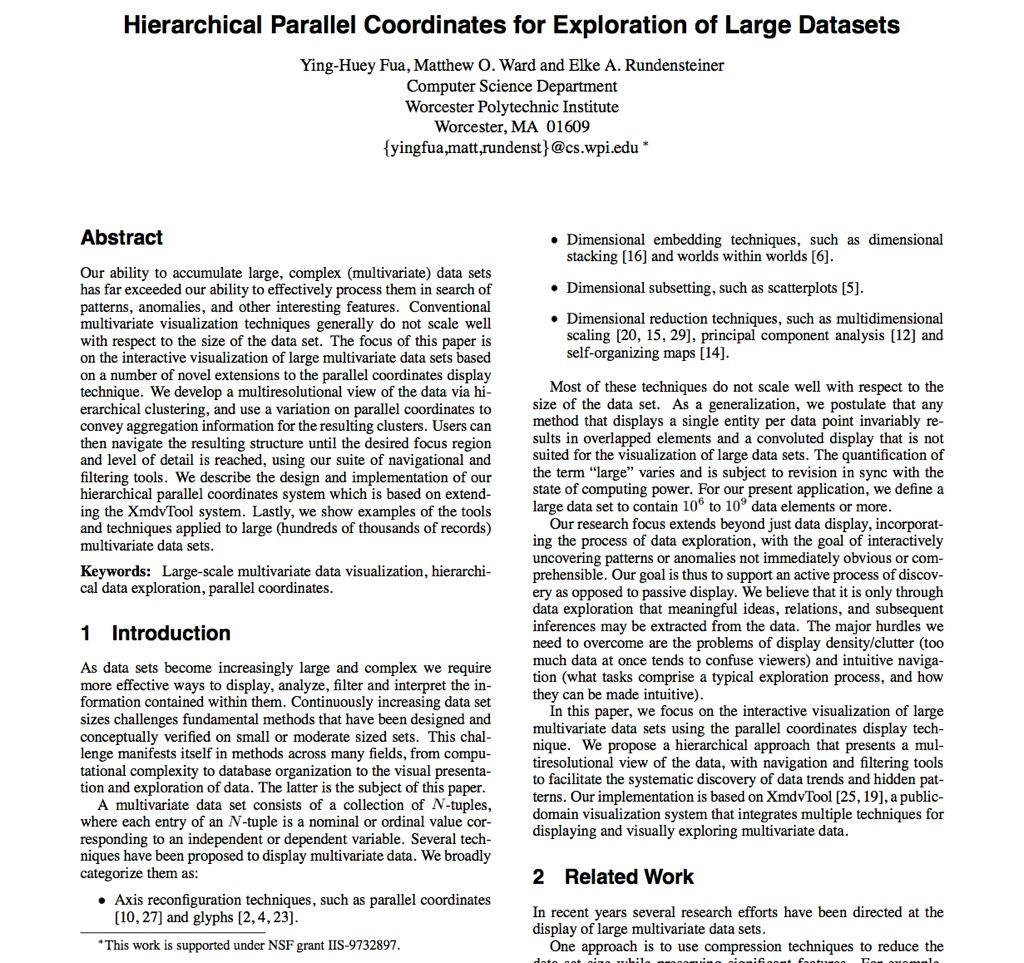
23 HIERARCHICAL PARALLEL COORDINATES - technique-driven paper - no problem characterization - goal: scale up parallel coordinates to large datasets - challenge: overplotting/occlusion 23 Fua 1999

24 PARALLEL COORDINATES - scatterplot limitation: visual representation with orthogonal axes - can show only two attributes with spatial position channel - alternative: line up axes in parallel to show many attributes with position - item encoded with a line with n segments - n is the number of attributes shown 24
25 EXAMPLE 25
26 EXAMPLE V1 V2 V3 V4 V5 D1
27 EXAMPLE V1 V2 V3 V4 V5 D2
28 EXAMPLE V1 V2 V3 V4 V5 D3

29 PARALLEL COORDINATES TASK - show correlation - positive correlation: straight lines - negative correlation: all lines cross at a single pt 29 Wegman 1990
30 PARALLEL COORDINATES TASK do you see any correlations? 30 Fua 1999
31 PARALLEL COORDINATES TASK - visible patterns only between neighboring axis pairs - how to pick axis order? - usual solution: reorderable axes, interactive exploration - same weakness as many other techniques - downside: human-powered search - not directly addressed in HPC paper 31 Fua 1999
32 HIERARCHICAL PARALLEL COORDINATES - data abstraction - original data - table of numbers - derived data - hierarchical clustering of items in table - clustering stats: # of points, mean, min, max, size, depth - cluster density: points/size - cluster proximity: linear ordering from tree traversal - task abstraction - find correlations - find trends and outliers at multiple scales 32

33 HPC: ENCODING DERIVED DATA - visual representation: variable-width opacity bands - show whole cluster, not just single item - min / max: spatial position - cluster density: transparency - mean: opaque 33 Fua 1999

34 HPC: INTERACTING WITH DERIVED DATA - interactively change level of detail to navigate cluster hierarchy 34 Fua 1999

35 HPC: ENCODING DERIVED DATA - visual encoding: color based on cluster proximity derived attribute - resolves ambiguity from crossings, clarifies structure 35 Fua 1999

36 HPC: MAGNIFICATION INTERACTION - dimensional zooming: use all available space - methods - linked vies to show true extent - overview + detail to maintain context 36 Fua 1999
37 CRITIQUE: what do you think? 37
38 CRITIQUE - parallel coordinates - strengths - can be a useful additional view - (rare to use completely stand-alone) - now popular, many follow-on techniques - weakness - major learning curve, difficult for novices - hierarchical parallel coordinates - strengths - success with major scalability improvement - careful construction and use of derived space - appropriate validation (result image discussion) - weakness - interface complexity (structure-based brushing) 38
39 39

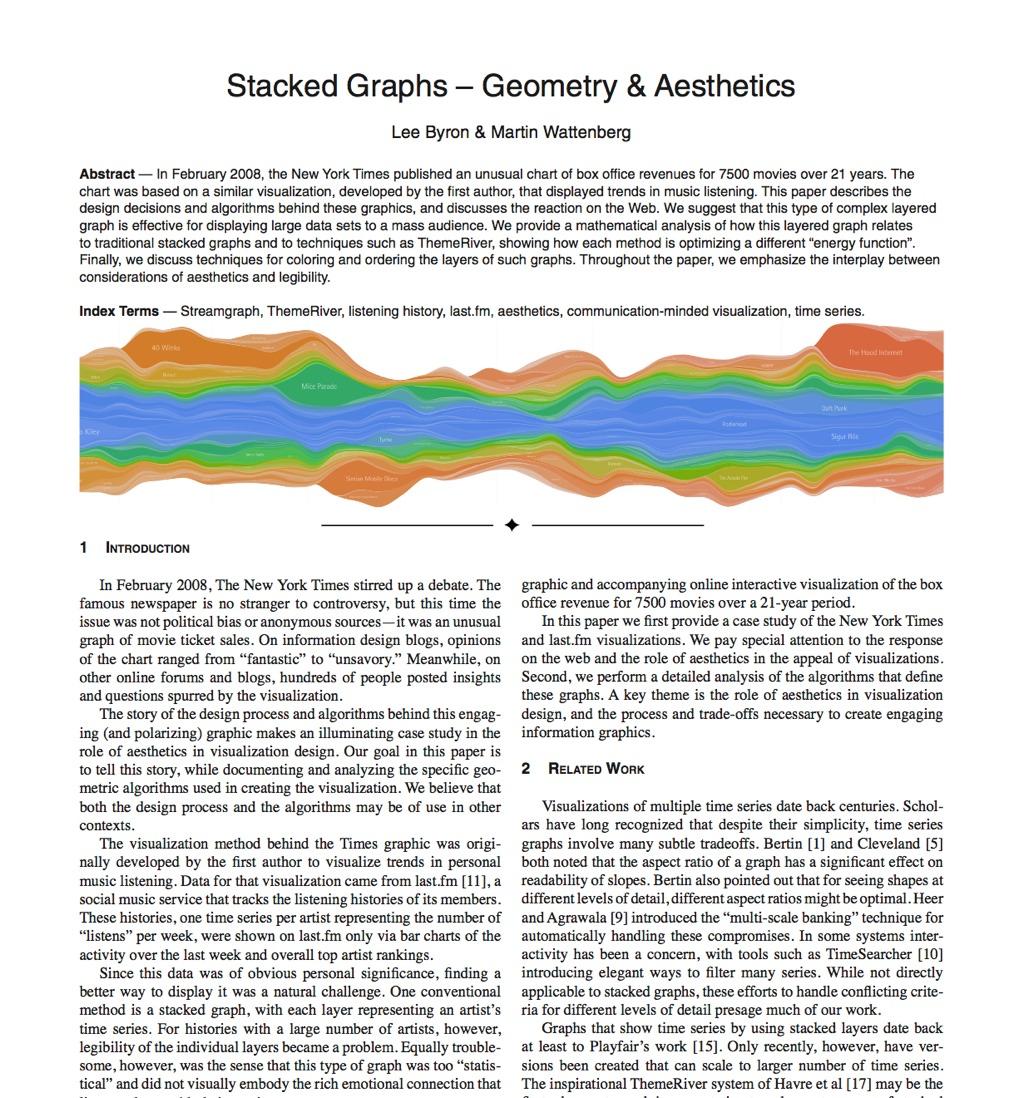
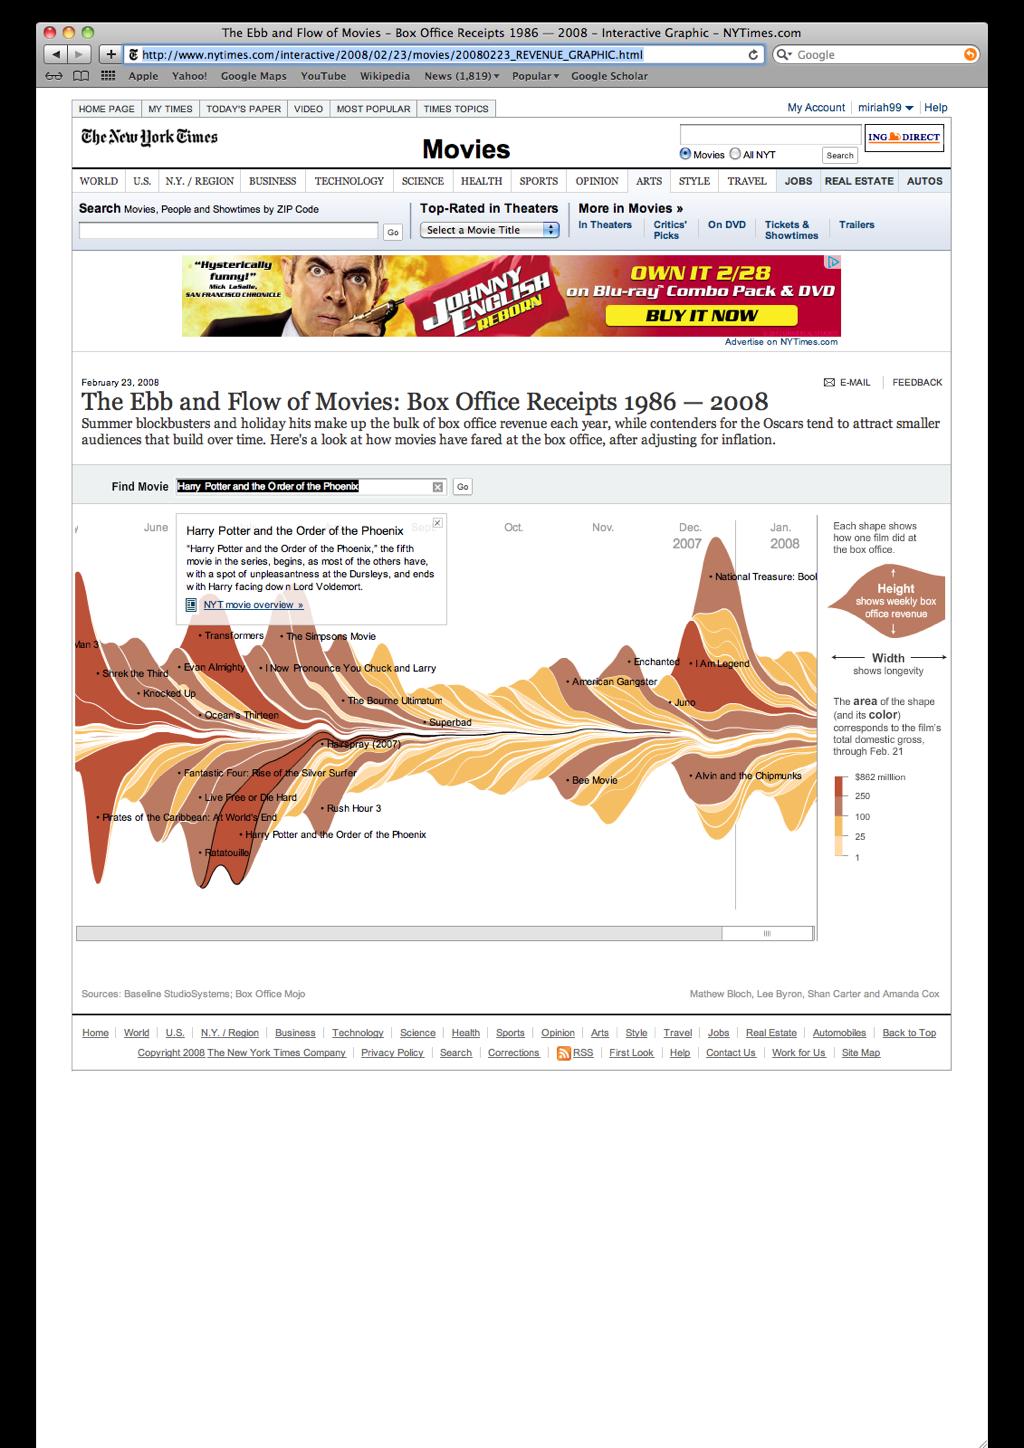
40 STREAMGRAPH - problem-driven paper - development of new technique to solve a specific problem - challenge - convey a large amount of data in a way that engages mass audiences 40 Byron 2008
41 STREAMGRAPH - problem: show personal last.fm history - want to visually embody personal connection that listeners have with their music - design considerations - use stacked graph - focus on legibility and aesthetics - abstraction - task: engage audience 41


42 DATA ABSTRACTION - original data - set of time series - derived data - layer silhouette - consider baseline - consider deviation - consider wiggliness 42 Byron 2008


43 DESIGN - visual representation: stacked graph - new technique for minimizing wiggle of layers - color: 2D colormap - hue: time of onset - saturation: popularity - labels - placed where embedded labels can be largest 43 Byron 2008

44 DESIGN - layer ordering - inside-out ordering - avoid diagonal striping effect - burst are on outside which minimizes effect on other layers - prevents drift away from x- axis 44 Byron 2008
45 EVALUATION - case study of NYTimes graphic - gathered many comments from social media sites - categorized comments - legibility issues - engagement - aethestics 45

46 COMMENTS 46
47 47
48 CRITIQUE: what do you think? 48
49 CRITIQUE - strengths - clear target problem - thorough evaluation of aesthetic and legibility issues - reached and engaged a large audience - weaknesses - stacked graphs make between comparisons difficult - both between time points and time series 49
50 THE SMARTPHONE CHALLENGE 50
51 part 6 - get back into large groups - share sketches - turn in abstraction and individual sketches 51
52 L14: Graphs and Trees REQUIRED READING 52
53 53
54 54
55 55
cs6964 March TREES & GRAPHS Miriah Meyer University of Utah
 cs6964 March 1 2012 TREES & GRAPHS Miriah Meyer University of Utah cs6964 March 1 2012 TREES & GRAPHS Miriah Meyer University of Utah slide acknowledgements: Hanspeter Pfister, Harvard University Jeff
Lecture 6: Statistical Graphics
 Lecture 6: Statistical Graphics Information Visualization CPSC 533C, Fall 2009 Tamara Munzner UBC Computer Science Mon, 28 September 2009 1 / 34 Readings Covered Multi-Scale Banking to 45 Degrees. Jeffrey
CIS 467/602-01: Data Visualization
 CIS 467/602-01: Data Visualization Tables Dr. David Koop Assignment 2 http://www.cis.umassd.edu/ ~dkoop/cis467/assignment2.html Plagiarism on Assignment 1 Any questions? 2 Recap (Interaction) Important
Parallel Coordinates ++
 Parallel Coordinates ++ CS 4460/7450 - Information Visualization Feb. 2, 2010 John Stasko Last Time Viewed a number of techniques for portraying low-dimensional data (about 3
Few s Design Guidance
 Few s Design Guidance CS 4460 Intro. to Information Visualization September 9, 2014 John Stasko Today s Agenda Stephen Few & Perceptual Edge Fall 2014 CS 4460 2 1 Stephen Few s Guidance Excellent advice
Navigating Hierarchies with Structure-Based Brushes
 Navigating Hierarchies with Structure-Based Brushes Ying-Huey Fua, Matthew O. Ward and Elke A. Rundensteiner Computer Science Department Worcester Polytechnic Institute Worcester, MA 01609 yingfua,matt,rundenst
Parallel Coordinates CS 6630 Scientific Visualization
 Parallel Coordinates CS 6630 Scientific Visualization Yang Shen u0879466 Jason Davies Example Jason s parallel coordinates is fairly effective when it comes to interaction. I like the way creating filter
CIE L*a*b* color model
 CIE L*a*b* color model To further strengthen the correlation between the color model and human perception, we apply the following non-linear transformation: with where (X n,y n,z n ) are the tristimulus
DSC 201: Data Analysis & Visualization
 DSC 201: Data Analysis & Visualization Visualization Design Dr. David Koop Definition Computer-based visualization systems provide visual representations of datasets designed to help people carry out tasks
Lecture 12: Graphs/Trees
 Lecture 12: Graphs/Trees Information Visualization CPSC 533C, Fall 2009 Tamara Munzner UBC Computer Science Mon, 26 October 2009 1 / 37 Proposal Writeup Expectations project title (not just 533 Proposal
MoVis Movie Recommendation and Visualization
 MoVis Movie Recommendation and Visualization Introduction CPSC 547 Infomation Visualization Project Ye Chen clara.yechen@gmail.com Yujie Yang yangyujie.hust@gmail.com Nowadays, movies becomes a popular
Background. Parallel Coordinates. Basics. Good Example
 Background Parallel Coordinates Shengying Li CSE591 Visual Analytics Professor Klaus Mueller March 20, 2007 Proposed in 80 s by Alfred Insellberg Good for multi-dimensional data exploration Widely used
Data Visualization (CIS/DSC 468)
") Data Visualization (CIS/DSC 468) Tabular Data Dr. David Koop Channel Considerations Discriminability Separability Visual Popout Weber's Law Luminance Perception 2 Separability Cannot treat all channels
Data Visualization (CIS/DSC 468) Tabular Data Dr. David Koop Channel Considerations Discriminability Separability Visual Popout Weber's Law Luminance Perception 2 Separability Cannot treat all channels
Week 6: Networks, Stories, Vis in the Newsroom
 Week 6: Networks, Stories, Vis in the Newsroom Tamara Munzner Department of Computer Science University of British Columbia JRNL 520H, Special Topics in Contemporary Journalism: Data Visualization Week
Computational Foundations of Cognitive Science
 Computational Foundations of Cognitive Science Lecture 16: Models of Object Recognition Frank Keller School of Informatics University of Edinburgh keller@inf.ed.ac.uk February 23, 2010 Frank Keller Computational
DSC 201: Data Analysis & Visualization
 DSC 201: Data Analysis & Visualization Exploratory Data Analysis Dr. David Koop What is Exploratory Data Analysis? "Detective work" to summarize and explore datasets Includes: - Data acquisition and input
MoVis. Movie Recommendation and Visualization. CPSC 547 Infomation Visualization Project Presentation. Ye Chen & Yujie Yang 2015/12/15
 MoVis Movie Recommendation and Visualization CPSC 547 Infomation Visualization Project Presentation Ye Chen & Yujie Yang 2015/12/15 1 Outline Introduction Why - Tasks What - Data How Demo Conclusion Limitations/comments
CS Information Visualization Sep. 2, 2015 John Stasko
 Multivariate Visual Representations 2 CS 7450 - Information Visualization Sep. 2, 2015 John Stasko Recap We examined a number of techniques for projecting >2 variables (modest number of dimensions) down
Separable Kernels and Edge Detection
 Separable Kernels and Edge Detection CS1230 Disclaimer: For Filter, using separable kernels is optional. It makes your implementation faster, but if you can t get it to work, that s totally fine! Just
Domain, task, and dataset
 CS533C Project Proposal Visualization Tool for Flow Cytometry Project Evgeny Maksakov Department of Computer Science University of British Columbia maksakov@cs.ubc.ca The project will be carried out in
Multivariate Data & Tables and Graphs
 Multivariate Data & Tables and Graphs CS 4460/7450 - Information Visualization Jan. 13, 2009 John Stasko Agenda Data and its characteristics Tables and graphs Design principles Spring 2009 CS 4460/7450
Representation: Design Idioms 1
 IAT 814 Visualization Representation: Design Idioms 1 Lyn Bartram These slides borrow heavily from T. Munzner and S. Few, and may be incompletely attributed. Work in progress. Recall: Data Abstractions
Multivariate Data & Tables and Graphs. Agenda. Data and its characteristics Tables and graphs Design principles
 Multivariate Data & Tables and Graphs CS 7450 - Information Visualization Aug. 24, 2015 John Stasko Agenda Data and its characteristics Tables and graphs Design principles Fall 2015 CS 7450 2 1 Data Data
Multiple Dimensional Visualization
 Multiple Dimensional Visualization Dimension 1 dimensional data Given price information of 200 or more houses, please find ways to visualization this dataset 2-Dimensional Dataset I also know the distances
Multidimensional Visualization and Clustering
 Multidimensional Visualization and Clustering Presentation for Visual Analytics of Professor Klaus Mueller Xiaotian (Tim) Yin 04-26 26-20072007 Paper List HD-Eye: Visual Mining of High-Dimensional Data
CS-5630 / CS-6630 Visualization for Data Science The Visualization Alphabet: Marks and Channels
 CS-5630 / CS-6630 Visualization for Data Science The Visualization Alphabet: Marks and Channels Alexander Lex alex@sci.utah.edu [xkcd] How can I visually represent two numbers, e.g., 4 and 8 Marks & Channels
Multivariate Data & Tables and Graphs. Agenda. Data and its characteristics Tables and graphs Design principles
 Topic Notes Multivariate Data & Tables and Graphs CS 7450 - Information Visualization Aug. 27, 2012 John Stasko Agenda Data and its characteristics Tables and graphs Design principles Fall 2012 CS 7450
Glyphs. Presentation Overview. What is a Glyph!? Cont. What is a Glyph!? Glyph Fundamentals. Goal of Paper. Presented by Bertrand Low
 Presentation Overview Glyphs Presented by Bertrand Low A Taxonomy of Glyph Placement Strategies for Multidimensional Data Visualization Matthew O. Ward, Information Visualization Journal, Palmgrave,, Volume
CP SC 8810 Data Visualization. Joshua Levine
 CP SC 8810 Data Visualization Joshua Levine levinej@clemson.edu Lecture 15 Text and Sets Oct. 14, 2014 Agenda Lab 02 Grades! Lab 03 due in 1 week Lab 2 Summary Preferences on x-axis label separation 10
Lecture 13: Graphs and Trees
 Lecture 13: Graphs and Trees Information Visualization CPSC 533C, Fall 2006 Tamara Munzner UBC Computer Science 24 October 2006 Readings Covered Graph Visualisation in Information Visualisation: a Survey.
Statistical graphics in analysis Multivariable data in PCP & scatter plot matrix. Paula Ahonen-Rainio Maa Visual Analysis in GIS
 Statistical graphics in analysis Multivariable data in PCP & scatter plot matrix Paula Ahonen-Rainio Maa-123.3530 Visual Analysis in GIS 11.11.2015 Topics today YOUR REPORTS OF A-2 Thematic maps with charts
Part I, Chapters 4 & 5. Data Tables and Data Analysis Statistics and Figures
 Part I, Chapters 4 & 5 Data Tables and Data Analysis Statistics and Figures Descriptive Statistics 1 Are data points clumped? (order variable / exp. variable) Concentrated around one value? Concentrated
BIO 360: Vertebrate Physiology Lab 9: Graphing in Excel. Lab 9: Graphing: how, why, when, and what does it mean? Due 3/26
 Lab 9: Graphing: how, why, when, and what does it mean? Due 3/26 INTRODUCTION Graphs are one of the most important aspects of data analysis and presentation of your of data. They are visual representations
Texture. Texture. 2) Synthesis. Objectives: 1) Discrimination/Analysis
 Synthesis. Objectives: 1) Discrimination/Analysis") Texture Texture D. Forsythe and J. Ponce Computer Vision modern approach Chapter 9 (Slides D. Lowe, UBC) Key issue: How do we represent texture? Topics: Texture segmentation Texture-based matching Texture
Texture Texture D. Forsythe and J. Ponce Computer Vision modern approach Chapter 9 (Slides D. Lowe, UBC) Key issue: How do we represent texture? Topics: Texture segmentation Texture-based matching Texture
RT_Image v0.2β User s Guide
 RT_Image v0.2β User s Guide RT_Image is a three-dimensional image display and analysis suite developed in IDL (ITT, Boulder, CO). It offers a range of flexible tools for the visualization and quantitation
MGMT 3125 Introduction to Data Visualization
 MGMT 3125 Introduction to Data Visualization John Sokol, MS Week 2 1/30/2019 Chapter 2: Choose an effective visual Agenda Chapter 2: Choose an effective visual Introduction to Tableau Week 2 action items
This research aims to present a new way of visualizing multi-dimensional data using generalized scatterplots by sensitivity coefficients to highlight
 This research aims to present a new way of visualizing multi-dimensional data using generalized scatterplots by sensitivity coefficients to highlight local variation of one variable with respect to another.
Visual Encoding Design
 CSE 442 - Data Visualization Visual Encoding Design Jeffrey Heer University of Washington Review: Expressiveness & Effectiveness / APT Choosing Visual Encodings Assume k visual encodings and n data attributes.
Information Visualization
 Information Visualization Text: Information visualization, Robert Spence, Addison-Wesley, 2001 What Visualization? Process of making a computer image or graph for giving an insight on data/information
Chapter 2: From Graphics to Visualization
 Exercises for Chapter 2: From Graphics to Visualization 1 EXERCISE 1 Consider the simple visualization example of plotting a graph of a two-variable scalar function z = f (x, y), which is discussed in
3. Multidimensional Information Visualization II Concepts for visualizing univariate to hypervariate data
 3. Multidimensional Information Visualization II Concepts for visualizing univariate to hypervariate data Vorlesung Informationsvisualisierung Prof. Dr. Andreas Butz, WS 2009/10 Konzept und Basis für n:
Structure-Based Brushes: A Mechanism for Navigating Hierarchically Organized Data and Information Spaces
 Structure-Based Brushes: A Mechanism for Navigating Hierarchically Organized Data and Information Spaces Ying-Huey Fua, Matthew O. Ward and Elke A. Rundensteiner Computer Science Department Worcester Polytechnic
Information Visualization. Jing Yang Spring Multi-dimensional Visualization (1)
") Information Visualization Jing Yang Spring 2008 1 Multi-dimensional Visualization (1) 2 1 Multi-dimensional (Multivariate) Dataset 3 Data Item (Object, Record, Case) 4 2 Dimension (Variable, Attribute)
Information Visualization Jing Yang Spring 2008 1 Multi-dimensional Visualization (1) 2 1 Multi-dimensional (Multivariate) Dataset 3 Data Item (Object, Record, Case) 4 2 Dimension (Variable, Attribute)
Grade 5 Unit 5 Addition and Multiplication with Volume and Area (5 Weeks)
") Grade 5 Unit 5 Addition and Multiplication with Volume and Area (5 Weeks) Stage Desired Results Established Goals Unit Description Students will utilize the work done in the fraction unit to explore how
Grade 5 Unit 5 Addition and Multiplication with Volume and Area (5 Weeks) Stage Desired Results Established Goals Unit Description Students will utilize the work done in the fraction unit to explore how
Gene Clustering & Classification
 BINF, Introduction to Computational Biology Gene Clustering & Classification Young-Rae Cho Associate Professor Department of Computer Science Baylor University Overview Introduction to Gene Clustering
Digital Image Processing. Image Enhancement - Filtering
 Digital Image Processing Image Enhancement - Filtering Derivative Derivative is defined as a rate of change. Discrete Derivative Finite Distance Example Derivatives in 2-dimension Derivatives of Images
8. Visual Analytics. Prof. Tulasi Prasad Sariki SCSE, VIT, Chennai
 8. Visual Analytics Prof. Tulasi Prasad Sariki SCSE, VIT, Chennai www.learnersdesk.weebly.com Graphs & Trees Graph Vertex/node with one or more edges connecting it to another node. Cyclic or acyclic Edge
Vector Visualization
 Vector Visualization Vector Visulization Divergence and Vorticity Vector Glyphs Vector Color Coding Displacement Plots Stream Objects Texture-Based Vector Visualization Simplified Representation of Vector
Evgeny Maksakov Advantages and disadvantages: Advantages and disadvantages: Advantages and disadvantages: Advantages and disadvantages:
 Today Problems with visualizing high dimensional data Problem Overview Direct Visualization Approaches High dimensionality Visual cluttering Clarity of representation Visualization is time consuming Dimensional
We will start at 2:05 pm! Thanks for coming early!
 We will start at 2:05 pm! Thanks for coming early! Yesterday Fundamental 1. Value of visualization 2. Design principles 3. Graphical perception Record Information Support Analytical Reasoning Communicate
CS Information Visualization Sep. 19, 2016 John Stasko
 Multivariate Visual Representations 2 CS 7450 - Information Visualization Sep. 19, 2016 John Stasko Learning Objectives Explain the concept of dense pixel/small glyph visualization techniques Describe
Lecture 4: Spatial Domain Transformations
 # Lecture 4: Spatial Domain Transformations Saad J Bedros sbedros@umn.edu Reminder 2 nd Quiz on the manipulator Part is this Fri, April 7 205, :5 AM to :0 PM Open Book, Open Notes, Focus on the material
CSE 5243 INTRO. TO DATA MINING
 CSE 5243 INTRO. TO DATA MINING Cluster Analysis: Basic Concepts and Methods Huan Sun, CSE@The Ohio State University 09/28/2017 Slides adapted from UIUC CS412, Fall 2017, by Prof. Jiawei Han 2 Chapter 10.
Data Visualization (DSC 530/CIS )
") Data Visualization (DSC 530/CIS 60-0) Isosurfaces & Volume Rendering Dr. David Koop Fields & Grids Fields: - Values come from a continuous domain, infinitely many values - Sampled at certain positions
Data Visualization (DSC 530/CIS 60-0) Isosurfaces & Volume Rendering Dr. David Koop Fields & Grids Fields: - Values come from a continuous domain, infinitely many values - Sampled at certain positions
Digital Image Processing (CS/ECE 545) Lecture 5: Edge Detection (Part 2) & Corner Detection
 Lecture 5: Edge Detection (Part 2) & Corner Detection") Digital Image Processing (CS/ECE 545) Lecture 5: Edge Detection (Part 2) & Corner Detection Prof Emmanuel Agu Computer Science Dept. Worcester Polytechnic Institute (WPI) Recall: Edge Detection Image processing
Digital Image Processing (CS/ECE 545) Lecture 5: Edge Detection (Part 2) & Corner Detection Prof Emmanuel Agu Computer Science Dept. Worcester Polytechnic Institute (WPI) Recall: Edge Detection Image processing
Marks. Marks can be classified according to the number of dimensions required for their representation: Zero: points. One: lines.
 Marks and channels Definitions Marks are basic geometric elements that depict items or links. Channels control the appearance of the marks. This way you can describe the design space of visual encodings
Lecture 11: High Dimensionality
 Lecture 11: High Dimensionality Information Visualization CPSC 533C, Fall 2009 Tamara Munzner UBC Computer Science Wed, 21 October 2009 1 / 46 Readings Covered Hyperdimensional Data Analysis Using Parallel
cs6964 March TOOLKITS Miriah Meyer University of Utah
 cs6964 March 8 2012 TOOLKITS Miriah Meyer University of Utah administrivia 2 feb 14-23 : proposal meetings march 7 : presentation topics due march 9 : proposals due march 27-april 3 : project updates april
3D Models and Matching
 3D Models and Matching representations for 3D object models particular matching techniques alignment-based systems appearance-based systems GC model of a screwdriver 1 3D Models Many different representations
Projekt 1 Ausarbeitung
 Projekt 1 Ausarbeitung Truong Vinh Phan Support for Interactive Visual Analytics in Various Software Packages Fakultät Technik und Informatik Department Informatik Faculty of Engineering and Computer Science
Facet: Multiple View Methods
 Facet: Multiple View Methods Large Data Visualization Torsten Möller Overview Combining views Partitioning Coordinating Multiple Side-by-Side Views Encoding Channels Shared Data Shared Navigation Synchronized
Visual Encoding Design
 CSE 442 - Data Visualization Visual Encoding Design Jeffrey Heer University of Washington Last Time: Data & Image Models The Big Picture task questions, goals assumptions data physical data type conceptual
Introduction to Geospatial Analysis
 Introduction to Geospatial Analysis Introduction to Geospatial Analysis 1 Descriptive Statistics Descriptive statistics. 2 What and Why? Descriptive Statistics Quantitative description of data Why? Allow
Data Mining Cluster Analysis: Basic Concepts and Algorithms. Slides From Lecture Notes for Chapter 8. Introduction to Data Mining
 Data Mining Cluster Analysis: Basic Concepts and Algorithms Slides From Lecture Notes for Chapter 8 Introduction to Data Mining by Tan, Steinbach, Kumar Tan,Steinbach, Kumar Introduction to Data Mining
GRID BASED CLUSTERING
 Cluster Analysis Grid Based Clustering STING CLIQUE 1 GRID BASED CLUSTERING Uses a grid data structure Quantizes space into a finite number of cells that form a grid structure Several interesting methods
Excel 2010 Worksheet 3. Table of Contents
 Table of Contents Graphs and Charts... 1 Chart Elements... 1 Column Charts:... 2 Pie Charts:... 6 Line graph 1:... 8 Line Graph 2:... 10 Scatter Charts... 12 Functions... 13 Calculate Averages (Mean):...
Data Visualization. Fall 2016
 Data Visualization Fall 2016 Information Visualization Upon now, we dealt with scientific visualization (scivis) Scivisincludes visualization of physical simulations, engineering, medical imaging, Earth
Lecture 13: Graphs/Trees
 Lecture 13: Graphs/Trees Information Visualization CPSC 533C, Fall 2009 Tamara Munzner UBC Computer Science Mon, 31 October 2011 1 / 41 Readings Covered Graph Visualisation in Information Visualisation:
EE368/CS232 Digital Image Processing Winter
 EE368/CS232 Digital Image Processing Winter 207-208 Lecture Review and Quizzes (Due: Wednesday, February 28, :30pm) Please review what you have learned in class and then complete the online quiz questions
Lecture Topic Projects
 Lecture Topic Projects 1 Intro, schedule, and logistics 2 Applications of visual analytics, basic tasks, data types 3 Introduction to D3, basic vis techniques for non-spatial data Project #1 out 4 Data
DASHBOARDPRO & DASHBOARD
 DASHBOARDPRO & DASHBOARD In a world where text rules the flow of knowledge, how do you expand the content and present it in such a way that the viewer appreciates your hard work and effort to a greater
COMP 465: Data Mining Still More on Clustering
 3/4/015 Exercise COMP 465: Data Mining Still More on Clustering Slides Adapted From : Jiawei Han, Micheline Kamber & Jian Pei Data Mining: Concepts and Techniques, 3 rd ed. Describe each of the following
Points Lines Connected points X-Y Scatter. X-Y Matrix Star Plot Histogram Box Plot. Bar Group Bar Stacked H-Bar Grouped H-Bar Stacked
 Plotting Menu: QCExpert Plotting Module graphs offers various tools for visualization of uni- and multivariate data. Settings and options in different types of graphs allow for modifications and customizations
BBS654 Data Mining. Pinar Duygulu. Slides are adapted from Nazli Ikizler
 BBS654 Data Mining Pinar Duygulu Slides are adapted from Nazli Ikizler 1 Classification Classification systems: Supervised learning Make a rational prediction given evidence There are several methods for
[Slides Extracted From] Visualization Analysis & Design Full-Day Tutorial Session 4
![[Slides Extracted From] Visualization Analysis & Design Full-Day Tutorial Session 4](/thumbs/82/85665283.jpg "[Slides Extracted From] Visualization Analysis & Design Full-Day Tutorial Session 4") [Slides Extracted From] Visualization Analysis & Design Full-Day Tutorial Session 4 Tamara Munzner Department of Computer Science University of British Columbia Sanger Institute / European Bioinformatics
[Slides Extracted From] Visualization Analysis & Design Full-Day Tutorial Session 4 Tamara Munzner Department of Computer Science University of British Columbia Sanger Institute / European Bioinformatics
Interactive Visual Exploration
 Interactive Visual Exploration of High Dimensional Datasets Jing Yang Spring 2010 1 Challenges of High Dimensional Datasets High dimensional datasets are common: digital libraries, bioinformatics, simulations,
CS535 Fall Department of Computer Science Purdue University
 Spatial Data Structures and Hierarchies CS535 Fall 2010 Daniel G Aliaga Daniel G. Aliaga Department of Computer Science Purdue University Spatial Data Structures Store geometric information Organize geometric
Data Visualization (CIS/DSC 468)
") Data Visualization (CIS/DSC 46) Volume Rendering Dr. David Koop Visualizing Volume (3D) Data 2D visualization slice images (or multi-planar reformating MPR) Indirect 3D visualization isosurfaces (or surface-shaded
Data Visualization (CIS/DSC 46) Volume Rendering Dr. David Koop Visualizing Volume (3D) Data 2D visualization slice images (or multi-planar reformating MPR) Indirect 3D visualization isosurfaces (or surface-shaded
CPSC 425: Computer Vision
 1 / 45 CPSC 425: Computer Vision Instructor: Fred Tung ftung@cs.ubc.ca Department of Computer Science University of British Columbia Lecture Notes 2015/2016 Term 2 2 / 45 Menu March 3, 2016 Topics: Hough
Components for Xcelsius. Micro Components
 Components for Xcelsius Micro Components Inovista Micro Components for Xcelsius Inovista provides a full range of spark lines, micro charts, icons, text and shape indicators that can be deployed to create
Visualization with Data Clustering DIVA Seminar Winter 2006 University of Fribourg
 Visualization with Data Clustering DIVA Seminar Winter 2006 University of Fribourg Terreaux Patrick (terreaux@gmail.com) February 15, 2007 Abstract In this paper, several visualizations using data clustering
Analytics and Visualization of Big Data
 1 Analytics and Visualization of Big Data Fadel M. Megahed Lecture 15: Clustering (Discussion Class) Department of Industrial and Systems Engineering Spring 13 Refresher: Hierarchical Clustering 2 Key
Week 4: Facet. Tamara Munzner Department of Computer Science University of British Columbia
 Week 4: Facet Tamara Munzner Department of Computer Science University of British Columbia JRNL 520M, Special Topics in Contemporary Journalism: Visualization for Journalists Week 4: 6 October 2015 http://www.cs.ubc.ca/~tmm/courses/journ15
Preprocessing Short Lecture Notes cse352. Professor Anita Wasilewska
 Preprocessing Short Lecture Notes cse352 Professor Anita Wasilewska Data Preprocessing Why preprocess the data? Data cleaning Data integration and transformation Data reduction Discretization and concept
Panning and Zooming. CS 4460/ Information Visualization April 8, 2010 John Stasko
 Panning and Zooming CS 4460/7450 - Information Visualization April 8, 2010 John Stasko Fundamental Problem Scale - Many data sets are too large to visualize on one screen May simply be too many cases May
Graph Clarity, Simplification, & Interaction
 Graph Clarity, Simplification, & Interaction http://i.imgur.com/cw19ibr.jpg https://www.reddit.com/r/cablemanagement/ Today Today s Reading: Lombardi Graphs Bezier Curves Today s Reading: Clustering/Hierarchical
1 (5 max) 2 (10 max) 3 (20 max) 4 (30 max) 5 (10 max) 6 (15 extra max) total (75 max + 15 extra)
 2 (10 max) 3 (20 max) 4 (30 max) 5 (10 max) 6 (15 extra max) total (75 max + 15 extra)") Mierm Exam CS223b Stanford CS223b Computer Vision, Winter 2004 Feb. 18, 2004 Full Name: Email: This exam has 7 pages. Make sure your exam is not missing any sheets, and write your name on every page. The
Mierm Exam CS223b Stanford CS223b Computer Vision, Winter 2004 Feb. 18, 2004 Full Name: Email: This exam has 7 pages. Make sure your exam is not missing any sheets, and write your name on every page. The
DATA ABSTRACTION & INTRO TO TABLEAU
 cs6630 September 4 2014 DATA ABSTRACTION & INTRO TO TABLEAU Miriah Meyer University of Utah 1 administrivia... 2 - design critiques due tonight - first assignment out today - there *might* be 3 seats available
10-701/15-781, Fall 2006, Final
 -7/-78, Fall 6, Final Dec, :pm-8:pm There are 9 questions in this exam ( pages including this cover sheet). If you need more room to work out your answer to a question, use the back of the page and clearly
Atypical Behavior Identification in Large Scale Network Traffic
 Atypical Behavior Identification in Large Scale Network Traffic Daniel Best {daniel.best@pnnl.gov} Pacific Northwest National Laboratory Ryan Hafen, Bryan Olsen, William Pike 1 Agenda! Background! Behavioral
> objective(s): Students will create a text-only design in either Adobe Illustrator or Photoshop
: Students will create a text-only design in either Adobe Illustrator or Photoshop") > word art > objective(s): Students will create a text-only design in either Adobe Illustrator or Photoshop > curricular focus: This lesson emphasizes the creative use of typography as the dominant artistic
> word art > objective(s): Students will create a text-only design in either Adobe Illustrator or Photoshop > curricular focus: This lesson emphasizes the creative use of typography as the dominant artistic
Image Rights Options: Using Banding, Branding, and
 Image Rights Options: Using Banding, Branding, and Watermarking Display ownership or other copyright information within your collection by using banding, branding, and watermarking options within CONTENTdm.
Graphs and Networks 2
 Topic Notes Graphs and Networks 2 CS 7450 - Information Visualization October 23, 2013 John Stasko Review Last time we looked at graph layout aesthetics and algorithms, as well as some example applications
SHOW ME THE NUMBERS: DESIGNING YOUR OWN DATA VISUALIZATIONS PEPFAR Applied Learning Summit September 2017 A. Chafetz
 SHOW ME THE NUMBERS: DESIGNING YOUR OWN DATA VISUALIZATIONS PEPFAR Applied Learning Summit September 2017 A. Chafetz Overview In order to prepare for the upcoming POART, you need to look into testing as
DATA MINING LECTURE 7. Hierarchical Clustering, DBSCAN The EM Algorithm
 DATA MINING LECTURE 7 Hierarchical Clustering, DBSCAN The EM Algorithm CLUSTERING What is a Clustering? In general a grouping of objects such that the objects in a group (cluster) are similar (or related)
Clustering CS 550: Machine Learning
 Clustering CS 550: Machine Learning This slide set mainly uses the slides given in the following links: http://www-users.cs.umn.edu/~kumar/dmbook/ch8.pdf http://www-users.cs.umn.edu/~kumar/dmbook/dmslides/chap8_basic_cluster_analysis.pdf
/5 Stacks. Displays the slice that follows the currently displayed slice. As a shortcut, press the > key.
 20-02-2018 1/5 Stacks Stacks This submenu contains commands that work with stacks. Add Slice Inserts a blank slice after the currently displayed slice. Hold down the Alt key to add the slice before the
CPSC 340: Machine Learning and Data Mining. Outlier Detection Fall 2018
 CPSC 340: Machine Learning and Data Mining Outlier Detection Fall 2018 Admin Assignment 2 is due Friday. Assignment 1 grades available? Midterm rooms are now booked. October 18 th at 6:30pm (BUCH A102
Final Exam Study Guide
 Final Exam Study Guide Exam Window: 28th April, 12:00am EST to 30th April, 11:59pm EST Description As indicated in class the goal of the exam is to encourage you to review the material from the course.
Network Traffic Measurements and Analysis
 DEIB - Politecnico di Milano Fall, 2017 Introduction Often, we have only a set of features x = x 1, x 2,, x n, but no associated response y. Therefore we are not interested in prediction nor classification,