Measuring landscape pattern
|
|
|
- Oswald Black
- 5 years ago
- Views:
Transcription
1 Measuring landscape pattern

2


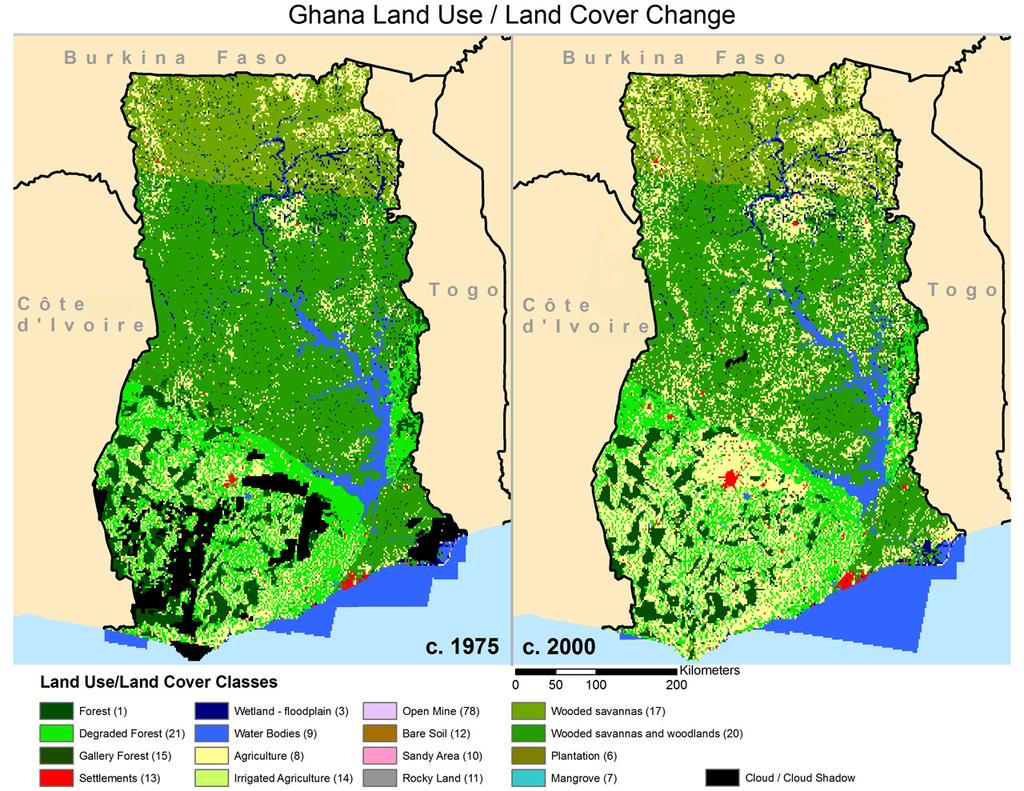
3 Why would we want to measure landscape patterns? Identify change over time Compare landscapes Compare alternative landscape scenarios Explain processes
4 Steps in Application of a Metric Spatial Data Set (orthophoto, satellite image, digital map) Scale definition Extent of analysis, resolution of elements Classification Supervised or automated (unsupervised) Application of metric Interpretation
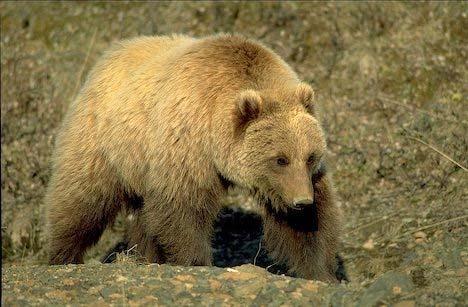
5 Number of Attribute Classes Just how diverse is the landscape in terms of defined patch elements? Southwestern U.S. Bottomland hardwoods, bald-cypress swamp, pine savanna, oak thickets, grasslands, agricultural, pine plantations, upland hardwoods, etc. (diverse) Tierra del Fuego: Tundra, southern beech forest, pampas, barren (relatively low) Antarctica Ice. Rock. More ice. 2 vascular plant spp. somewhere.

6 Quantifying Landscape Pattern Landscape Composition: What elements make up the landscape? How much of each element is there? Landscape Configuration: How are the elements of the landscape arranged? What types of shapes do they take? How do they relate to each other spatially?
7 Composition Richness Evenness Diversity Configuration Size Shape Edge length/density Isolation Fragmentation Contagion Connectivity Interspersion Dispersion

 that are defined by connected")
8 Raster and vector images Rasters consist of grid cells with individual values. Vector coverages are composed of shapes (polygons) that are defined by connected points


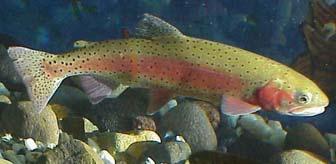
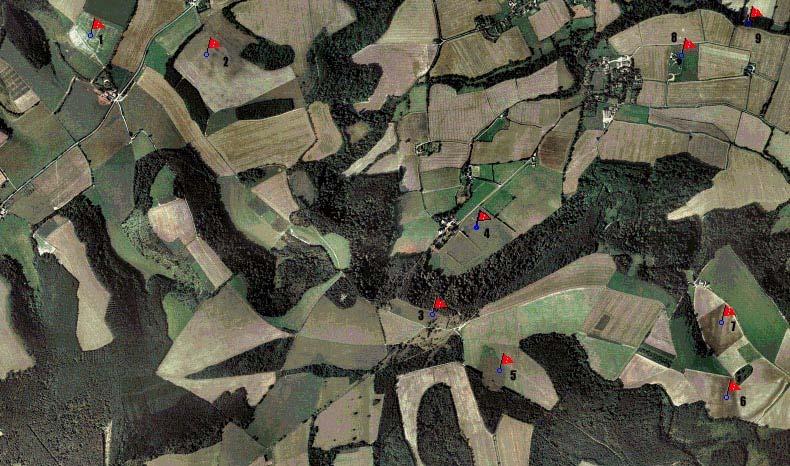
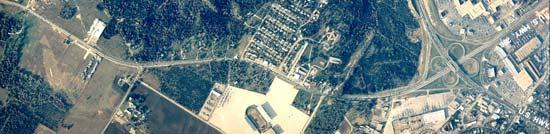
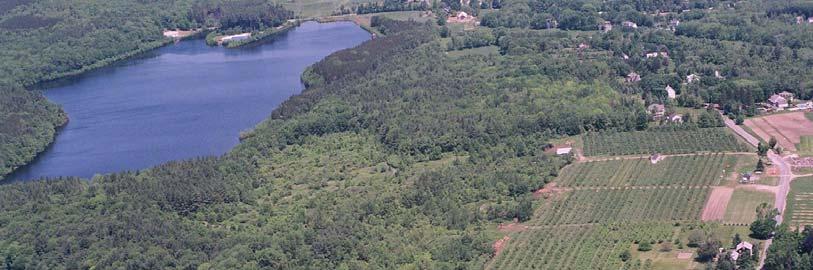
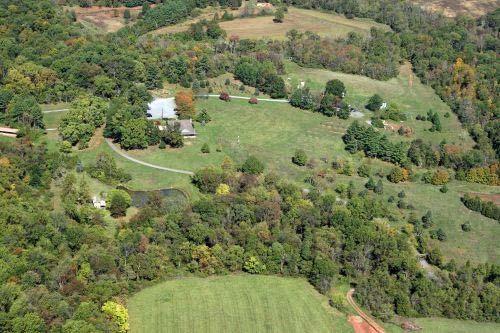
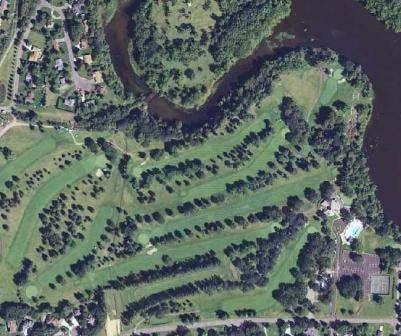
9 Defining the landscape We often use remotely sensed data to measure landscape pattern. Aerial photos Satellite imagery

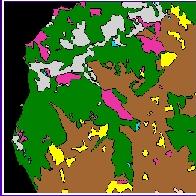
10 Classifying a landscape We often define landscapes using discrete categories. Thus we must classify images.


11 Classifying a landscape The choice of the classification scheme depends on the question being asked or the subject being addressed

12 Landscape Composition Richnessnumber of patch types Proportional coverage- % of landscape covered by each type Evennesshow evenly are the types represented - Shannon s Evenness Index - Simpson s Evenness Index Diversityhow diverse is the distribution of types - Shannon s Diversity Index - Simpson s Evenness Index -Dominance
13 Richness vs. evenness Hill (1973): all measures of biodiversity differ only in how much weight (importance) is allocated to common species vs. rare species How strongly do we want our index to differentiate between landscapes with species proportions: 20:20:20:20:20 (5 species, evenly distributed) 96:1:1:1:1 (5 species, but 1 super-common!)
14 Dominance (O Neill et al. 1988) To what extent do one or a few patch types dominate the landscape? The higher the D, (D 1 in paper), the more one or a few types dominate. Values range from 0.19 to 1.5 in O Neill paper (can be normalized to be between 0 and 1).
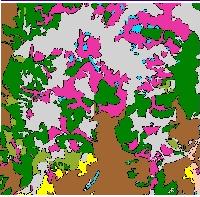
15 Landscape Composition Conifer = 75% Meadow = 10% Water = 5% Rock = 5% Roads = 5% Dominance = 1 evenness, or D 1 = ln(m) + [(p i * ln(p i )], Ln(5) + (.75*ln(.75) +.10*ln(.10) +.05 *ln(.05) +.05*ln(.05) +.05*ln(.05)) = where M = # patch types p i = fraction of M that are type i Conifer = 25% Meadow = 20% Water = 22% Rock = 21% Roads = 12% Ln(5) + (.25*ln(.25) +.20*ln(.20) +.22*ln(.22) +.21*ln(.21) +.12*ln(.12)) = 0.026

16 Landscape Configuration Patch level metrics summarize aspects of individual patches Landscape level metrics summarize entire landscapes and thus the spatial pattern of patches uments/conceptual%20background/landscape%20metr ics/landscape%20metrics.htm

17 Patch metrics Patch size distribution and density - Mean patch size - Area of the largest patch - Variation in patch size - Patch density Patch size

18 Patch metrics Edge Edge length Edge to area ratio Edge contrast


19 Patch metrics Core Area Edge effect distance Core area Number of core areas Mean core area Variation in core area Core area density Less core area More core area


20 Patch metrics Isolation/proximity Mean nearest neighbor distance Proximity index Low isolation/high proximity High isolation/low proximity

21 Landscape-level metrics Dispersion Nearest Neighbor Relative Variance Index Nearest Neighbor Index of Dispersion (Clark & Evans Statistic)
22 Contagion (Texture) Index Nothing to do with disease (unless forest pathogens involved) Just how mixed up or clumped is the landscape? Straightforward interpretation: the greater the index, the more aggregated the landscape elements unitless
23 Landscape-level metrics Contagion Contagion index Low contagion High contagion
24 Calculating the Contagion Index n n C 2n ln n i 1 j 1 P ln P i j i j Where: n= number of grid cells, P ij is probability of having a neighbor of type j for every cell of type i. In analysis of 94 quadrangles by O Neill et al. 1988, C (called D 2 in paper) ranged from 9.5 (low clumping ) to 22.8 (high clumping ).
25 Proximity Index Calculated for an individual patch Used to show relative isolation of patch from others of its kind Low values = isolated, high = close Calculated as: Where S k =area ofk th patch n k = nearest-neighbor distance between focal patch and nearest cell of patch of same type search radius is arbitrary, and depends on objectives! PX i S n k k

26 Landscape-level metrics Contrast Total Edge Edge density Edge contrast index Contrast-weighted edge density Neighborhood contrast index Floristic or type contrast Structural contrast


27


28 Landscape-level metrics Shape complexity Edge density Shape index Complex geometry Simple geometry


29 Landscape-level metrics Connectivity Connectance Patch cohesion index -Resistance - Percolation theory Like contrast, connectivity depends on the object of investigation connected with respect to
30 Connectivity Connectance Defined as the number of functional joinings Each pair of patches is either connected or not (0/1) based on a user-specified distance Distance can be Euclidean or resistance-weighted Expressed as a percent of all possible joinings between patches of the same type.
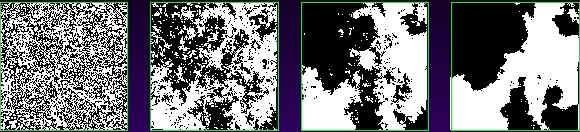
 increases. Once p = 0.5928 (0.")
31 Connectivity Percolation theory Connectivity can be inferred from patch density. Connectivity increases in a nonlinear fashion as the proportion map occupied by a given patch type (p) increases. Once p = (0.41 for the 8-neighbor rule), the largest connected cluster will span the map edge-to edge
32
33
34 Issues with measuring landscape patterns Boundary effects Scale effects Redundancy Rules / Approaches
35 Boundary Effects Nearest Neighbor? Landscape boundary
36 Boundary Effects Boundary effects Landscape extent/heterogeneity


37 Scale effects Both grain and extent affect how landscape metrics are interpreted, and must be consistent across landscapes to be compared.
38 Effects of scale on pattern measurement Relationship between extent and three landscape metrics Turner et al. 1989


39 Scale effects Edge = 1000 Coarsegrained Finegrained Edge = 1500
40 Redundancy Many measures are highly correlated Mean Patch Size = Total area Number of patches Patch Density = Number of patches Total area Edge density Core area index
41 Redundancy Riitters et al. (1995) found that only five metrics were needed to explain most of the variability in their landscapes: Number of patch types Mean edge/area ratio Contagion Average patch shape Fractal measurements
42 Riitters et al How did they do it? Calculated 55 metrics for 85 landscapes (55*85=4675) Created a table of correlation coefficients (0=no correlation, 1= perfect correlation) between the metrics (factor analysis) Used high correlation coefficients to distinguish families of indices Indices that explained most variation in data set were selected as representative indices
43 Rules / approaches 4-neighbor rule 8-neighbor rule Neighbor rules are critical in defining landscape metrics. Contrast weights will affect weighted edge indices. 6 patches 2 patches
44 Characteristics of Patch Elements Patch analysis is incomplete without examining the intrinsic nature of patches GET INTO THE PATCH! Without these metrics, a patch is just a pretty polygon on a map or GIS. Patch characteristics determine: Utility by organisms Edge effects Susceptibility to disturbance
45 Function Net Primary Productivity: = GPP (photosynthesis) Respiration = NPP Production of wildlife numbers (head of elk, young spotted owls, tailed frogs, etc.) Watershed regulation (Andrews LTER example) Silt and sediment regulation (TSS- total suspended solids) Compare regions w/ harvest vs. unharvested (control) CWD production
46 Composition Landscape elements cannot be considered without considering composition Several ways to measure this and -richness: mere number of species in a spatial context Whittaker (1977): inventory diversity: point ( m 2 ), (<1-625 ha), (gamma)( ), epsilon)(>2500 ha) -comparison of functional groups: trees, shrubs, etc. Evenness Biodiversity Indices: a composite of richness and evenness Simpson Shannon-Wiener

47 2. 1.
48
Landscape Metrics. Prof. Dr. Adrienne Grêt-Regamey Sibyl Brunner Ana Stritih
 Landscape Metrics Prof. Dr. Adrienne Grêt-Regamey Sibyl Brunner Ana Stritih Landscape structure Block 2: Landscape assessment (1) Descriptive analysis (2) Comparison of landscapes (3) Comparison of alternatives
DIGITAL IMAGE ANALYSIS. Image Classification: Object-based Classification
 DIGITAL IMAGE ANALYSIS Image Classification: Object-based Classification Image classification Quantitative analysis used to automate the identification of features Spectral pattern recognition Unsupervised
Metric Definitions (Patch Analyst Help Menu)
") Metric Definitions (Patch Analyst Help Menu) Class Area Sum of areas of all patches belonging to a given class. Example: Conifer Class Area (CA) = 359047.844+...+65819.984 CA = 69.6626 hectares If the
Metric Definitions (Patch Analyst Help Menu) Class Area Sum of areas of all patches belonging to a given class. Example: Conifer Class Area (CA) = 359047.844+...+65819.984 CA = 69.6626 hectares If the
FRAGSTATS USER GUIDELINES
 FRAGSTATS USER GUIDELINES Version 3 The main metrics (Connectivity) Background. Connectivity refers to the degree to which a landscape facilitates or impedes ecological flows (e.g., the movement of organisms
Landscape Ecology. Lab 2: Indices of Landscape Pattern
 Introduction In this lab exercise we explore some metrics commonly used to summarize landscape pattern. You will begin with a presettlement landscape entirely covered in forest. You will then develop this
GPS Located Accuracy Assessment Plots on the Modoc National Forest
 This file was created by scanning the printed publication. Errors identified by the software have been corrected; however, some errors may remain. GPS Located Accuracy Assessment Plots on the Modoc National
Welcome to PolyFrag! Summary: Basics of PolyFrag: Opening the Tool:
 Welcome to PolyFrag! Copyright: (c) 2013 University of New Hampshire License: Creative Commons Attribution-NonCommercial-ShareAlike (BY-NC-SA) license Author: Meghan Graham MacLean Summary: PolyFrag has
The behavior of landscape metrics commonly used in the study of habitat fragmentation
 Landscape Ecology 13: 167 186, 1998. 167 c 1998 Kluwer Academic Publishers. Printed in the Netherlands. The behavior of landscape metrics commonly used in the study of habitat fragmentation Christina D.
Will talk primarily about our image processing mapping efforts and not the photo interpreted data set.
 Will talk primarily about our image processing mapping efforts and not the photo interpreted data set. I am going to move quickly and touch on major points. If I picque your curiosity about something,
Land Cover Classification Techniques
 Land Cover Classification Techniques supervised classification and random forests Developed by remote sensing specialists at the USFS Geospatial Technology and Applications Center (GTAC), located in Salt
Classify Multi-Spectral Data Classify Geologic Terrains on Venus Apply Multi-Variate Statistics
 Classify Multi-Spectral Data Classify Geologic Terrains on Venus Apply Multi-Variate Statistics Operations What Do I Need? Classify Merge Combine Cross Scan Score Warp Respace Cover Subscene Rotate Translators
Image Digital Analysis for River Segmentation and Biodiversity Assessment
 Image Digital Analysis for River Segmentation and Biodiversity Assessment Joaquin Solana Gutiérrez and Silvia Merino de Miguel School of Forestry Engineering Department of Forestry Management Department
Analyzing Landscape Patterns
 Topic 9 Analyzing Landscape Patterns 9.1 Summarizing Spatial Context The previous topic introduced the idea of roving a small window throughout a map summarizing the surface configuration detected at each
Attribute Accuracy. Quantitative accuracy refers to the level of bias in estimating the values assigned such as estimated values of ph in a soil map.
 Attribute Accuracy Objectives (Entry) This basic concept of attribute accuracy has been introduced in the unit of quality and coverage. This unit will teach a basic technique to quantify the attribute
INCREASING CLASSIFICATION QUALITY BY USING FUZZY LOGIC
 JOURNAL OF APPLIED ENGINEERING SCIENCES VOL. 1(14), issue 4_2011 ISSN 2247-3769 ISSN-L 2247-3769 (Print) / e-issn:2284-7197 INCREASING CLASSIFICATION QUALITY BY USING FUZZY LOGIC DROJ Gabriela, University
Notes: Notes: Notes: Notes:
 NR406 GIS Applications in Fire Ecology & Management Lesson 2 - Overlay Analysis in GIS Gathering Information from Multiple Data Layers One of the many strengths of a GIS is that you can stack several data
Representing Geography
 Data models and axioms Chapters 3 and 7 Representing Geography Road map Representing the real world Conceptual models: objects vs fields Implementation models: vector vs raster Vector topological model
GIS Data Models. 4/9/ GIS Data Models
 GIS Data Models 1 Conceptual models of the real world The real world can be described using two conceptually different models: 1. As discrete objects, possible to represent as points, lines or polygons.
Lecture 06. Raster and Vector Data Models. Part (1) Common Data Models. Raster. Vector. Points. Points. ( x,y ) Area. Area Line.
 Common Data Models. Raster. Vector. Points. Points. ( x,y ) Area. Area Line.") Lecture 06 Raster and Vector Data Models Part (1) 1 Common Data Models Vector Raster Y Points Points ( x,y ) Line Area Line Area 2 X 1 3 Raster uses a grid cell structure Vector is more like a drawn map
Lecture 06 Raster and Vector Data Models Part (1) 1 Common Data Models Vector Raster Y Points Points ( x,y ) Line Area Line Area 2 X 1 3 Raster uses a grid cell structure Vector is more like a drawn map
Aerial photography: Principles. Visual interpretation of aerial imagery
 Aerial photography: Principles Visual interpretation of aerial imagery Overview Introduction Benefits of aerial imagery Image interpretation Elements Tasks Strategies Keys Accuracy assessment Benefits
Lab #4 Introduction to Image Processing II and Map Accuracy Assessment
 FOR 324 Natural Resources Information Systems Lab #4 Introduction to Image Processing II and Map Accuracy Assessment (Adapted from the Idrisi Tutorial, Introduction Image Processing Exercises, Exercise
Clustering CS 550: Machine Learning
 Clustering CS 550: Machine Learning This slide set mainly uses the slides given in the following links: http://www-users.cs.umn.edu/~kumar/dmbook/ch8.pdf http://www-users.cs.umn.edu/~kumar/dmbook/dmslides/chap8_basic_cluster_analysis.pdf
Spatial data and QGIS
 Spatial data and QGIS Xue Jingbo IT Center 2017.08.07 A GIS consists of: Spatial Data. Computer Hardware. Computer Software. Longitude Latitude Disease Date 26.870436-31.909519 Mumps 13/12/2008 26.868682-31.909259
Cell based GIS. Introduction to rasters
 Week 9 Cell based GIS Introduction to rasters topics of the week Spatial Problems Modeling Raster basics Application functions Analysis environment, the mask Application functions Spatial Analyst in ArcGIS
A technique for constructing monotonic regression splines to enable non-linear transformation of GIS rasters
 18 th World IMACS / MODSIM Congress, Cairns, Australia 13-17 July 2009 http://mssanz.org.au/modsim09 A technique for constructing monotonic regression splines to enable non-linear transformation of GIS
Raster Data. James Frew ESM 263 Winter
 Raster Data 1 Vector Data Review discrete objects geometry = points by themselves connected lines closed polygons attributes linked to feature ID explicit location every point has coordinates 2 Fields
IMAGINE Objective. The Future of Feature Extraction, Update & Change Mapping
 IMAGINE ive The Future of Feature Extraction, Update & Change Mapping IMAGINE ive provides object based multi-scale image classification and feature extraction capabilities to reliably build and maintain
AUTOMATIC RECOGNITION OF RICE FIELDS FROM MULTITEMPORAL SATELLITE IMAGES
 AUTOMATIC RECOGNITION OF RICE FIELDS FROM MULTITEMPORAL SATELLITE IMAGES Y.H. Tseng, P.H. Hsu and I.H Chen Department of Surveying Engineering National Cheng Kung University Taiwan, Republic of China tseng@mail.ncku.edu.tw
Class #2. Data Models: maps as models of reality, geographical and attribute measurement & vector and raster (and other) data structures
 data structures") Class #2 Data Models: maps as models of reality, geographical and attribute measurement & vector and raster (and other) data structures Role of a Data Model Levels of Data Model Abstraction GIS as Digital
Class #2 Data Models: maps as models of reality, geographical and attribute measurement & vector and raster (and other) data structures Role of a Data Model Levels of Data Model Abstraction GIS as Digital
Layer Variables for RSF-type Modelling Applications
 Layer Variables for RSF-type Modelling Applications These instructions for ArcGIS 9.x enable you to create expressions for use in Spatial Analyst s Raster Calculator that result in output grids of continuous
Data Mining Classification: Alternative Techniques. Lecture Notes for Chapter 4. Instance-Based Learning. Introduction to Data Mining, 2 nd Edition
 Data Mining Classification: Alternative Techniques Lecture Notes for Chapter 4 Instance-Based Learning Introduction to Data Mining, 2 nd Edition by Tan, Steinbach, Karpatne, Kumar Instance Based Classifiers
EAT 233/3 GEOGRAPHIC INFORMATION SYSTEM (GIS)
") EAT 233/3 GEOGRAPHIC INFORMATION SYSTEM (GIS) CO3: Ability to produce detail mapping using geographic information systems (GIS) BY : AYU WAZIRA AZHARI SPATIAL DATA & THE MODELLING Spatial Data in GIS Spatial
EAT 233/3 GEOGRAPHIC INFORMATION SYSTEM (GIS) CO3: Ability to produce detail mapping using geographic information systems (GIS) BY : AYU WAZIRA AZHARI SPATIAL DATA & THE MODELLING Spatial Data in GIS Spatial
Lecture 6: GIS Spatial Analysis. GE 118: INTRODUCTION TO GIS Engr. Meriam M. Santillan Caraga State University
 Lecture 6: GIS Spatial Analysis GE 118: INTRODUCTION TO GIS Engr. Meriam M. Santillan Caraga State University 1 Spatial Data It can be most simply defined as information that describes the distribution
Suitability Modeling with GIS
 Developed and Presented by Juniper GIS 1/33 Course Objectives What is Suitability Modeling? The Suitability Modeling Process Cartographic Modeling GIS Tools for Suitability Modeling Demonstrations of Models
Lab 12: Sampling and Interpolation
 Lab 12: Sampling and Interpolation What You ll Learn: -Systematic and random sampling -Majority filtering -Stratified sampling -A few basic interpolation methods Data for the exercise are in the L12 subdirectory.
Spatial Analysis (Vector) II
 II") Spatial Analysis (Vector) II GEOG 300, Lecture 9 Dr. Anthony Jjumba 1 A Spatial Network is a set of geographic locations interconnected in a system by a number of routes is a system of linear features
Spatial Analysis (Vector) II GEOG 300, Lecture 9 Dr. Anthony Jjumba 1 A Spatial Network is a set of geographic locations interconnected in a system by a number of routes is a system of linear features
This is the general guide for landuse mapping using mid-resolution remote sensing data
 This is the general guide for landuse mapping using mid-resolution remote sensing data February 11 2015 This document has been prepared for Training workshop on REDD+ Research Project in Peninsular Malaysia
Copyright The McGraw-Hill Companies, Inc. Permission required for reproduction or display.
 CHAPTER 11 VECTOR DATA ANALYSIS 11.1 Buffering 11.1.1 Variations in Buffering Box 11.1 Riparian Buffer Width 11.1.2 Applications of Buffering 11.2 Overlay 11.2.1 Feature Type and Overlay 11.2.2 Overlay
Introduction to Geographic Information Science. Some Updates. Last Lecture 4/6/2017. Geography 4103 / Raster Data and Tesselations.
 Geography 43 / 3 Introduction to Geographic Information Science Raster Data and Tesselations Schedule Some Updates Last Lecture We finished DBMS and learned about storage of data in complex databases Relational
A Vector Agent-Based Unsupervised Image Classification for High Spatial Resolution Satellite Imagery
 A Vector Agent-Based Unsupervised Image Classification for High Spatial Resolution Satellite Imagery K. Borna 1, A. B. Moore 2, P. Sirguey 3 School of Surveying University of Otago PO Box 56, Dunedin,
Understanding Geospatial Data Models
 Understanding Geospatial Data Models 1 A geospatial data model is a formal means of representing spatially referenced information. It is a simplified view of physical entities and a conceptualization of
Using ArcGIS for Landcover Classification. Presented by CORE GIS May 8, 2012
 Using ArcGIS for Landcover Classification Presented by CORE GIS May 8, 2012 How to use ArcGIS for Image Classification 1. Find and download the right data 2. Have a look at the data (true color/false color)
CPSC 695. Methods for interpolation and analysis of continuing surfaces in GIS Dr. M. Gavrilova
 CPSC 695 Methods for interpolation and analysis of continuing surfaces in GIS Dr. M. Gavrilova Overview Data sampling for continuous surfaces Interpolation methods Global interpolation Local interpolation
Geodatabase over Taita Hills, Kenya
 Geodatabase over Taita Hills, Kenya Anna Broberg & Antero Keskinen Abstract This article introduces the basics of geographical information systems (GIS) and explains how the Taita Hills project can benefit
Raster GIS applications
 Raster GIS applications Columns Rows Image: cell value = amount of reflection from surface DEM: cell value = elevation (also slope/aspect/hillshade/curvature) Thematic layer: cell value = category or measured
Neighbourhood Operations Specific Theory
 Neighbourhood Operations Specific Theory Neighbourhood operations are a method of analysing data in a GIS environment. They are especially important when a situation requires the analysis of relationships
VBA PROGRAMMING FOR LANDSCAPE ANALYSIS
 34 VBA PROGRAMMING FOR LANDSCAPE ANALYSIS In collaboration with Robert Rohr Objectives Develop a hypothetical raster-type landscape on a spreadsheet. Write Visual Basic for Applications code to analyze
Lecture 7 Attribute-based Operations
 Lecture 7 Attribute-based Operations Learning Objectives 7.1 What is meant by reduce information content using an attribute-based operation? Why would one want to reduce information? 7.2 What is meant
Image Segmentation. Ross Whitaker SCI Institute, School of Computing University of Utah
 Image Segmentation Ross Whitaker SCI Institute, School of Computing University of Utah What is Segmentation? Partitioning images/volumes into meaningful pieces Partitioning problem Labels Isolating a specific
Nearest Neighbor Methods for Imputing Missing Data Within and Across Scales
 Nearest Neighbor Methods for Imputing Missing Data Within and Across Scales Valerie LeMay University of British Columbia, Canada and H. Temesgen, Oregon State University Presented at the Evaluation of
Evaluation of texture features for image segmentation
 RIT Scholar Works Articles 9-14-2001 Evaluation of texture features for image segmentation Navid Serrano Jiebo Luo Andreas Savakis Follow this and additional works at: http://scholarworks.rit.edu/article
Spatial Patterns Point Pattern Analysis Geographic Patterns in Areal Data
 Spatial Patterns We will examine methods that are used to analyze patterns in two sorts of spatial data: Point Pattern Analysis - These methods concern themselves with the location information associated
Southern Ontario Interim Landcover (SIL) Data Compilation Documentation
 Data Compilation Documentation") Southern Ontario Interim Landcover (SIL) Data Compilation Documentation Introductory Datasets: Goal: To utilize all relevant corporate MNR datasets as well as external datasets that hold ecological value.
Southern Ontario Interim Landcover (SIL) Data Compilation Documentation Introductory Datasets: Goal: To utilize all relevant corporate MNR datasets as well as external datasets that hold ecological value.
Remote Sensed Image Classification based on Spatial and Spectral Features using SVM
 RESEARCH ARTICLE OPEN ACCESS Remote Sensed Image Classification based on Spatial and Spectral Features using SVM Mary Jasmine. E PG Scholar Department of Computer Science and Engineering, University College
Notes. Reminder: HW2 Due Today by 11:59PM. Review session on Thursday. Midterm next Tuesday (10/10/2017)
") 1 Notes Reminder: HW2 Due Today by 11:59PM TA s note: Please provide a detailed ReadMe.txt file on how to run the program on the STDLINUX. If you installed/upgraded any package on STDLINUX, you should
1 Notes Reminder: HW2 Due Today by 11:59PM TA s note: Please provide a detailed ReadMe.txt file on how to run the program on the STDLINUX. If you installed/upgraded any package on STDLINUX, you should
MGF 2014 Performances of UAV and WorldView-2 Images for Individual Canopy Delineation in Tropical Forest
 MGF 2014 Performances of UAV and WorldView-2 Images for Individual Canopy Delineation in Tropical Forest Hamdan Omar Div. of Forestry & Environment, Forest Research Institute Malaysia (FRIM) Malaysia Geospatial
Spatial Data Management
 Spatial Data Management [R&G] Chapter 28 CS432 1 Types of Spatial Data Point Data Points in a multidimensional space E.g., Raster data such as satellite imagery, where each pixel stores a measured value
An Introduction to Lidar & Forestry May 2013
 An Introduction to Lidar & Forestry May 2013 Introduction to Lidar & Forestry Lidar technology Derivatives from point clouds Applied to forestry Publish & Share Futures Lidar Light Detection And Ranging
Soil texture: based on percentage of sand in the soil, partially determines the rate of percolation of water into the groundwater.
 Overview: In this week's lab you will identify areas within Webster Township that are most vulnerable to surface and groundwater contamination by conducting a risk analysis with raster data. You will create
DIGITAL MYLAR: A TOOL TO ATTRIBUTE VEGETATION POLYGON FEATURES OVER HIGH-RESOLUTION IMAGERY INTRODUCTION
 DIGITAL MYLAR: A TOOL TO ATTRIBUTE VEGETATION POLYGON FEATURES OVER HIGH-RESOLUTION IMAGERY Jess T. Clark, Remote Sensing Analyst Mark V. Finco, Ph.D., Senior Scientist USDA Forest Service, Remote Sensing
Automatic Segmentation of Semantic Classes in Raster Map Images
 Automatic Segmentation of Semantic Classes in Raster Map Images Thomas C. Henderson, Trevor Linton, Sergey Potupchik and Andrei Ostanin School of Computing, University of Utah, Salt Lake City, UT 84112
Contents of Lecture. Surface (Terrain) Data Models. Terrain Surface Representation. Sampling in Surface Model DEM
 Data Models. Terrain Surface Representation. Sampling in Surface Model DEM") Lecture 13: Advanced Data Models: Terrain mapping and Analysis Contents of Lecture Surface Data Models DEM GRID Model TIN Model Visibility Analysis Geography 373 Spring, 2006 Changjoo Kim 11/29/2006 1
Lecture 13: Advanced Data Models: Terrain mapping and Analysis Contents of Lecture Surface Data Models DEM GRID Model TIN Model Visibility Analysis Geography 373 Spring, 2006 Changjoo Kim 11/29/2006 1
Land managers need increased temporal and spatial
 Society for Range Management Image Interpreter Tool: An ArcGIS Tool for Estimating Vegetation Cover From High-Resolution Imagery By T. Scott Schrader and Michael C. Duniway Land managers need increased
Lab 9. Julia Janicki. Introduction
 Lab 9 Julia Janicki Introduction My goal for this project is to map a general land cover in the area of Alexandria in Egypt using supervised classification, specifically the Maximum Likelihood and Support
Spatial Data Management
 Spatial Data Management Chapter 28 Database management Systems, 3ed, R. Ramakrishnan and J. Gehrke 1 Types of Spatial Data Point Data Points in a multidimensional space E.g., Raster data such as satellite
Middle School Math Course 3 Correlation of the ALEKS course Middle School Math 3 to the Illinois Assessment Framework for Grade 8
 Middle School Math Course 3 Correlation of the ALEKS course Middle School Math 3 to the Illinois Assessment Framework for Grade 8 State Goal 6: Number Sense 6.8.01: 6.8.02: 6.8.03: 6.8.04: 6.8.05: = ALEKS
Machine Learning Applications in Exploration and Mining
 Machine Learning Applications in Exploration and Mining Tom Carmichael, Brenton Crawford, Liam Webb. QEC - The role of data in discovery 28 th February 2018 www.solvegeosolutions.com Outline Where and
Copyright The McGraw-Hill Companies, Inc. Permission required for reproduction or display.
 Chapter 8. ATTRIBUTE DATA INPUT AND MANAGEMENT 8.1 Attribute Data in GIS 8.1.1 Type of Attribute Table 8.1.2 Database Management 8.1.3 Type of Attribute Data Box 8.1 Categorical and Numeric Data 8.2 The
Learning Compact and Effective Distance Metrics with Diversity Regularization. Pengtao Xie. Carnegie Mellon University
 Learning Compact and Effective Distance Metrics with Diversity Regularization Pengtao Xie Carnegie Mellon University 1 Distance Metric Learning Similar Dissimilar Distance Metric Wide applications in retrieval,
Introducing ArcScan for ArcGIS
 Introducing ArcScan for ArcGIS An ESRI White Paper August 2003 ESRI 380 New York St., Redlands, CA 92373-8100, USA TEL 909-793-2853 FAX 909-793-5953 E-MAIL info@esri.com WEB www.esri.com Copyright 2003
Introduction to Clustering and Classification. Psych 993 Methods for Clustering and Classification Lecture 1
 Introduction to Clustering and Classification Psych 993 Methods for Clustering and Classification Lecture 1 Today s Lecture Introduction to methods for clustering and classification Discussion of measures
Probability An Example
 Probability An Example For example, suppose we have a data set where in six cities, we count the number of malls located in that city present: Each count of the # of malls in a city is an event # of Malls
Alaska Department of Transportation Roads to Resources Project LiDAR & Imagery Quality Assurance Report Juneau Access South Corridor
 Alaska Department of Transportation Roads to Resources Project LiDAR & Imagery Quality Assurance Report Juneau Access South Corridor Written by Rick Guritz Alaska Satellite Facility Nov. 24, 2015 Contents
Lecturer 2: Spatial Concepts and Data Models
 Lecturer 2: Spatial Concepts and Data Models 2.1 Introduction 2.2 Models of Spatial Information 2.3 Three-Step Database Design 2.4 Extending ER with Spatial Concepts 2.5 Summary Learning Objectives Learning
Chapter 6: Cluster Analysis
 Chapter 6: Cluster Analysis The major goal of cluster analysis is to separate individual observations, or items, into groups, or clusters, on the basis of the values for the q variables measured on each
Applying Supervised Learning
 Applying Supervised Learning When to Consider Supervised Learning A supervised learning algorithm takes a known set of input data (the training set) and known responses to the data (output), and trains
Image Segmentation. Srikumar Ramalingam School of Computing University of Utah. Slides borrowed from Ross Whitaker
 Image Segmentation Srikumar Ramalingam School of Computing University of Utah Slides borrowed from Ross Whitaker Segmentation Semantic Segmentation Indoor layout estimation What is Segmentation? Partitioning
United State Department of Agriculture Forest Service Southwestern Region\Region 3 CAD Standards Manual Version 1.0
 United State Department of Agriculture Forest Service Southwestern Region\Region 3 CAD Standards Manual Version 1.0 3/12/2010 Prepared for: Bart Matthews US Forest Service Southwestern Regional Office
Using SAS to Fit AmeriFlux Data to Ecosystem Seasonality Models
 Paper 2462-2018 Using SAS to Fit AmeriFlux Data to Ecosystem Seasonality Models Tracy Song-Brink, North Carolina State University ABSTRACT In ecosystem science research, we have several models to define
Review of Cartographic Data Types and Data Models
 Review of Cartographic Data Types and Data Models GIS Data Models Raster Versus Vector in GIS Analysis Fundamental element used to represent spatial features: Raster: pixel or grid cell. Vector: x,y coordinate
CHAPTER 4: CLUSTER ANALYSIS
 CHAPTER 4: CLUSTER ANALYSIS WHAT IS CLUSTER ANALYSIS? A cluster is a collection of data-objects similar to one another within the same group & dissimilar to the objects in other groups. Cluster analysis
RASTER ANALYSIS GIS Analysis Fall 2013
 RASTER ANALYSIS GIS Analysis Fall 2013 Raster Data The Basics Raster Data Format Matrix of cells (pixels) organized into rows and columns (grid); each cell contains a value representing information. What
Raster Analysis and Functions. David Tenenbaum EEOS 465 / 627 UMass Boston
 Raster Analysis and Functions Local Functions By-cell operations Operated on by individual operators or by coregistered grid cells from other themes Begin with each target cell, manipulate through available
By Colin Childs, ESRI Education Services. Catalog
 s resolve many traditional raster management issues By Colin Childs, ESRI Education Services Source images ArcGIS 10 introduces Catalog Mosaicked images Sources, mosaic methods, and functions are used
7 th Grade STAAR Crunch March 30, 2016
 Reporting Category UMATHX Suggested Lessons and Activities Access UMath X with the URL that your group was given. Login with a valid user name and password. Category 1:Numbers, Operations, and Quantitative
Clustering in Data Mining
 Clustering in Data Mining Classification Vs Clustering When the distribution is based on a single parameter and that parameter is known for each object, it is called classification. E.g. Children, young,
Feature Descriptors. CS 510 Lecture #21 April 29 th, 2013
 Feature Descriptors CS 510 Lecture #21 April 29 th, 2013 Programming Assignment #4 Due two weeks from today Any questions? How is it going? Where are we? We have two umbrella schemes for object recognition
Image Classification. Introduction to Photogrammetry and Remote Sensing (SGHG 1473) Dr. Muhammad Zulkarnain Abdul Rahman
 Dr. Muhammad Zulkarnain Abdul Rahman") Image Classification Introduction to Photogrammetry and Remote Sensing (SGHG 1473) Dr. Muhammad Zulkarnain Abdul Rahman Classification Multispectral classification may be performed using a variety of methods,
Image Classification Introduction to Photogrammetry and Remote Sensing (SGHG 1473) Dr. Muhammad Zulkarnain Abdul Rahman Classification Multispectral classification may be performed using a variety of methods,
Image Segmentation. Ross Whitaker SCI Institute, School of Computing University of Utah
 Image Segmentation Ross Whitaker SCI Institute, School of Computing University of Utah What is Segmentation? Partitioning images/volumes into meaningful pieces Partitioning problem Labels Isolating a specific
Multi-temporal LIDAR data for forestry an approach to investigate timber yield changes
 Multi-temporal LIDAR data for forestry an approach to investigate timber yield changes UniSA Stefan Peters, Jixue Liu, David Bruce, Jiuyong Li ForestrySA Jim O Hehir, Mary-Anne Larkin, Anthony Hay 1 Why
7 Fractions. Number Sense and Numeration Measurement Geometry and Spatial Sense Patterning and Algebra Data Management and Probability
 7 Fractions GRADE 7 FRACTIONS continue to develop proficiency by using fractions in mental strategies and in selecting and justifying use; develop proficiency in adding and subtracting simple fractions;
AN INTEGRATED APPROACH TO AGRICULTURAL CROP CLASSIFICATION USING SPOT5 HRV IMAGES
 AN INTEGRATED APPROACH TO AGRICULTURAL CROP CLASSIFICATION USING SPOT5 HRV IMAGES Chang Yi 1 1,2,*, Yaozhong Pan 1, 2, Jinshui Zhang 1, 2 College of Resources Science and Technology, Beijing Normal University,
Multiple-Choice Questionnaire Group C
 Family name: Vision and Machine-Learning Given name: 1/28/2011 Multiple-Choice naire Group C No documents authorized. There can be several right answers to a question. Marking-scheme: 2 points if all right
Image Classification. RS Image Classification. Present by: Dr.Weerakaset Suanpaga
 Image Classification Present by: Dr.Weerakaset Suanpaga D.Eng(RS&GIS) 6.1 Concept of Classification Objectives of Classification Advantages of Multi-Spectral data for Classification Variation of Multi-Spectra
Terrain Tile Texture Production: Overview of the Process
 Page 1 Terrain Tile Texture Production: Overview of the Process Last updated: 4/6/2010 9:02 PM CONTENT PIPELINE AREA: Terrain Tiles AUTHOR - ORIGIN: Peter Lewis (petlewis) STAKE HOLDERS: RELATED DOCUMENTS:
Haralick Parameters for Texture feature Extraction
 Haralick Parameters for Texture feature Extraction Ms. Ashwini Raut1 raut.ashu87@gmail.com Mr.Saket J. Panchbhai2 ayur.map.patel@gmail.com Ms. Ketki S. Palsodkar3 chaitanya.dhondrikar96@gmail.com Ms.Ankita
Expanding the conceptual, mathematical and practical methods for map comparison
 Expanding the conceptual, mathematical and practical methods for map comparison Robert Gilmore Pontius Jr and John Connors Clark University School of Geography 95 Main Street Tel.: + 58 793 776; Fax: +
Centrality Book. cohesion.
 Cohesion The graph-theoretic terms discussed in the previous chapter have very specific and concrete meanings which are highly shared across the field of graph theory and other fields like social network
Hybrid Model with Super Resolution and Decision Boundary Feature Extraction and Rule based Classification of High Resolution Data
 Hybrid Model with Super Resolution and Decision Boundary Feature Extraction and Rule based Classification of High Resolution Data Navjeet Kaur M.Tech Research Scholar Sri Guru Granth Sahib World University
CS 534: Computer Vision Segmentation and Perceptual Grouping
 CS 534: Computer Vision Segmentation and Perceptual Grouping Ahmed Elgammal Dept of Computer Science CS 534 Segmentation - 1 Outlines Mid-level vision What is segmentation Perceptual Grouping Segmentation