CPSC 695. Methods for interpolation and analysis of continuing surfaces in GIS Dr. M. Gavrilova
|
|
|
- Griffin Martin
- 5 years ago
- Views:
Transcription
1 CPSC 695 Methods for interpolation and analysis of continuing surfaces in GIS Dr. M. Gavrilova
2 Overview Data sampling for continuous surfaces Interpolation methods Global interpolation Local interpolation Continuous surface analysis
3 Visualization and analysis of continuous data Visualization of continuous data (terrain models, soil samples, etc) requires a variety of methods from: Computer graphics Statistics Mathematics Computational geometry
4 Interpolation Interpolation is a first step for representing a continuous surface when only sample data is available. It is used when: The discretized surface has a different level of resolution, cell size or orientation When a continuous surface is represented by a different data model that required When the data do not cover the domain of interest completely
5 Data sources for interpolation Aerial photos Scanners Satellite images Point samples Digitized maps

6 Sampling Different types of sampling are used to collect data
7 Methods for interpolation Interpolation methods Global interpolation Classification models Trend surfaces on geometric coordinates Regression models on multiple attributes Local interpolation Delaunay triangulation based Linear and inverse distance weighting Thin plate splines
8 Global classification models Used for prediction of values of attributes. ANOVA standard analysis of variance method: z(x 0 )=m+alpha k +epsilon, Where z is the attribute value at location x 0, m is the mean of z values, alpha k is the deviation between m and the mean of z values over a smaller unit k, and epsilon is residual error of measurement (noise). Assumption: no correlation between measurements within units, changes take place on the boundaries that are sharp, within units data is very consistent.
9 Global regression model using trend surfaces Regression model uses continuous function to predict unknown values: Can be linear z(x)=b 0 +b 1 x+e, Quadratic z(x)=b 0 +b 1 x+ b 2 x 2 +e or any higher degree polynomial (used in 3D modeling), e is an error. Trend surfaces that result are also suitable for smoothing the data.
10 Regression models on multiple attributes Regression model can be based on two or more attributes, especially is their relationship is easy to establish: z(x)=b 0 +b 1 P 1 +b 2 P 2 +e, where P 1, P 2 are independent properties. Ex: level of zinc in the soil and distance to river
11 Local interpolation methods Based on proximity Thiessen polygons (Voronoi regions) Interpolate over polygons (Voronoi regions), more precise predictor!

12 Voronoi regions
13 Inverse distance interpolation Inverse distance interpolators combine notion of proximity (VD) and the gradual change of trend surfaces by adding some distance-weighted attributes to the interpolation formula. Results more smooth interpolation.
14 Splines (a) local adjustments result in local changes (b) sharp corners can be improved by using exact splines (c) selecting break points has significant impact on splines
15 Splines Splines are piece-wise function. Interpolation values can be calculated more quickly. Thin plate splines sometimes produce unrealistically smooth surfaces.
,")
16 Inverse distance vs. spline Inverse distance interpolations (ac), spline interpolation (d)
17 DEM
18 DEM
 and Delaunay triangulation")
19 DEM DEM generated from splines (left) and Delaunay triangulation (right)

20 Spatial filtering

21 Spatial filtering Low-pass filter the value for the cell is computed as average of other cells High-pass-continuous surface low pass

22 Spatial filtering Window size has effect on filtering

23 Smoothing of maps
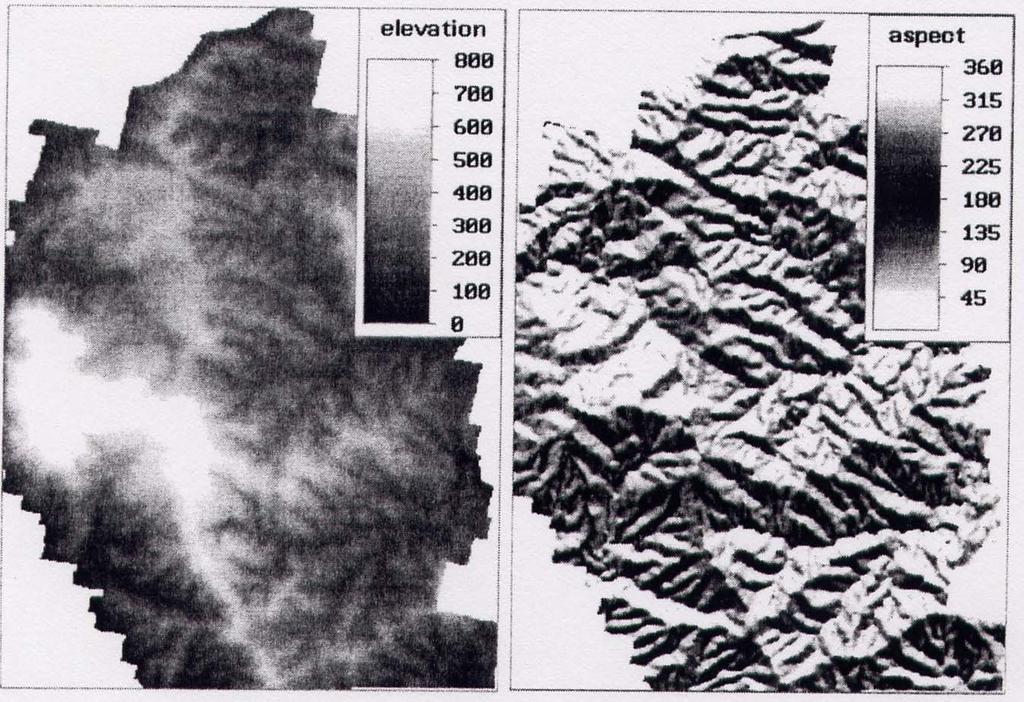
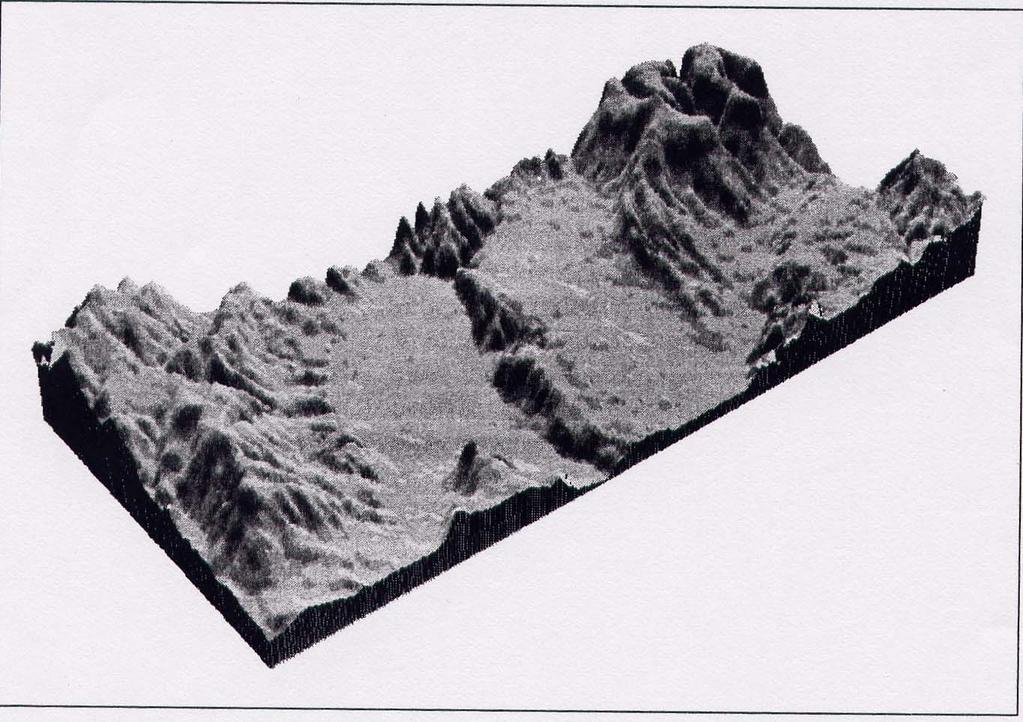
24 Other spatial operations Slope, profile convexity and other derivatives of the surface can be extracted Surface topology, networks can be derived Improvements to visual quality of maps can be achieved
What can we represent as a Surface?
 Geography 38/42:376 GIS II Topic 7: Surface Representation and Analysis (Chang: Chapters 13 & 15) DeMers: Chapter 10 What can we represent as a Surface? Surfaces can be used to represent: Continuously
Surface Analysis with 3D Analyst
 2013 Esri International User Conference July 8 12, 2013 San Diego, California Technical Workshop Surface Analysis with 3D Analyst Khalid H. Duri Esri UC2013. Technical Workshop. Why use 3D GIS? Because
Spatial Analysis and Modeling (GIST 4302/5302) Guofeng Cao Department of Geosciences Texas Tech University
 Guofeng Cao Department of Geosciences Texas Tech University") Spatial Analysis and Modeling (GIST 4302/5302) Guofeng Cao Department of Geosciences Texas Tech University 1 Outline of This Week Last topic, we learned: Spatial autocorrelation of areal data Spatial regression
Spatial Analysis and Modeling (GIST 4302/5302) Guofeng Cao Department of Geosciences Texas Tech University 1 Outline of This Week Last topic, we learned: Spatial autocorrelation of areal data Spatial regression
Statistical surfaces and interpolation. This is lecture ten
 Statistical surfaces and interpolation This is lecture ten Data models for representation of surfaces So far have considered field and object data models (represented by raster and vector data structures).
Class #2. Data Models: maps as models of reality, geographical and attribute measurement & vector and raster (and other) data structures
 data structures") Class #2 Data Models: maps as models of reality, geographical and attribute measurement & vector and raster (and other) data structures Role of a Data Model Levels of Data Model Abstraction GIS as Digital
Class #2 Data Models: maps as models of reality, geographical and attribute measurement & vector and raster (and other) data structures Role of a Data Model Levels of Data Model Abstraction GIS as Digital
IMPROVING THE ACCURACY OF DIGITAL TERRAIN MODELS
 STUDIA UNIV. BABEŞ BOLYAI, INFORMATICA, Volume XLV, Number 1, 2000 IMPROVING THE ACCURACY OF DIGITAL TERRAIN MODELS GABRIELA DROJ Abstract. The change from paper maps to GIS, in various kinds of geographical
DIGITAL TERRAIN MODELS
 DIGITAL TERRAIN MODELS 1 Digital Terrain Models Dr. Mohsen Mostafa Hassan Badawy Remote Sensing Center GENERAL: A Digital Terrain Models (DTM) is defined as the digital representation of the spatial distribution
EECS 556 Image Processing W 09. Interpolation. Interpolation techniques B splines
 EECS 556 Image Processing W 09 Interpolation Interpolation techniques B splines What is image processing? Image processing is the application of 2D signal processing methods to images Image representation
Surface Creation & Analysis with 3D Analyst
 Esri International User Conference July 23 27 San Diego Convention Center Surface Creation & Analysis with 3D Analyst Khalid Duri Surface Basics Defining the surface Representation of any continuous measurement
Surfaces, meshes, and topology
 Surfaces from Point Samples Surfaces, meshes, and topology A surface is a 2-manifold embedded in 3- dimensional Euclidean space Such surfaces are often approximated by triangle meshes 2 1 Triangle mesh
Dijkstra's Algorithm
 Shortest Path Algorithm Dijkstra's Algorithm To find the shortest path from the origin node to the destination node No matrix calculation Floyd s Algorithm To find all the shortest paths from the nodes
Geol 588. GIS for Geoscientists II. Zonal functions. Feb 22, Zonal statistics. Interpolation. Zonal statistics Sp. Analyst Tools - Zonal.
 Zonal functions Geol 588 GIS for Geoscientists II Feb 22, 2011 Zonal statistics Interpolation Zonal statistics Sp. Analyst Tools - Zonal Choose correct attribute for zones (usually: must be unique ID for
Watershed Sciences 4930 & 6920 GEOGRAPHIC INFORMATION SYSTEMS
 HOUSEKEEPING Watershed Sciences 4930 & 6920 GEOGRAPHIC INFORMATION SYSTEMS Quizzes Lab 8? WEEK EIGHT Lecture INTERPOLATION & SPATIAL ESTIMATION Joe Wheaton READING FOR TODAY WHAT CAN WE COLLECT AT POINTS?
CPSC 695. Geometric Algorithms in Biometrics. Dr. Marina L. Gavrilova
 CPSC 695 Geometric Algorithms in Biometrics Dr. Marina L. Gavrilova Biometric goals Verify users Identify users Synthesis - recently Biometric identifiers Courtesy of Bromba GmbH Classification of identifiers
Introduction to 3D Analysis. Jinwu Ma Jie Chang Khalid Duri
 Introduction to 3D Analysis Jinwu Ma Jie Chang Khalid Duri Area & Volume 3D Analyst Features Detect Change Determine Cut/Fill Calculate Surface Area & Volume Data Management Data Creation Data Conversion
Lecture 6: GIS Spatial Analysis. GE 118: INTRODUCTION TO GIS Engr. Meriam M. Santillan Caraga State University
 Lecture 6: GIS Spatial Analysis GE 118: INTRODUCTION TO GIS Engr. Meriam M. Santillan Caraga State University 1 Spatial Data It can be most simply defined as information that describes the distribution
Geostatistics Predictions with Deterministic Procedures
 Instituto Superior de Estatística e Gestão de Informação Universidade Nova de Lisboa Master of Science in Geospatial Technologies Geostatistics Predictions with Deterministic Procedures Carlos Alberto
Moving Beyond Linearity
 Moving Beyond Linearity Basic non-linear models one input feature: polynomial regression step functions splines smoothing splines local regression. more features: generalized additive models. Polynomial
DIGITAL TERRAIN MODELLING. Endre Katona University of Szeged Department of Informatics
 DIGITAL TERRAIN MODELLING Endre Katona University of Szeged Department of Informatics katona@inf.u-szeged.hu The problem: data sources data structures algorithms DTM = Digital Terrain Model Terrain function:
Spatial Analysis (Vector) II
 II") Spatial Analysis (Vector) II GEOG 300, Lecture 9 Dr. Anthony Jjumba 1 A Spatial Network is a set of geographic locations interconnected in a system by a number of routes is a system of linear features
Spatial Analysis (Vector) II GEOG 300, Lecture 9 Dr. Anthony Jjumba 1 A Spatial Network is a set of geographic locations interconnected in a system by a number of routes is a system of linear features
Topic 5: Raster and Vector Data Models
 Geography 38/42:286 GIS 1 Topic 5: Raster and Vector Data Models Chapters 3 & 4: Chang (Chapter 4: DeMers) 1 The Nature of Geographic Data Most features or phenomena occur as either: discrete entities
GIS Data Models. 4/9/ GIS Data Models
 GIS Data Models 1 Conceptual models of the real world The real world can be described using two conceptually different models: 1. As discrete objects, possible to represent as points, lines or polygons.
Tutorial (Intermediate level): Dense Cloud Classification and DTM generation with Agisoft PhotoScan Pro 1.1
: Dense Cloud Classification and DTM generation with Agisoft PhotoScan Pro 1.1") Tutorial (Intermediate level): Dense Cloud Classification and DTM generation with Agisoft PhotoScan Pro 1.1 This tutorial illustrates how to perform dense point cloud classification in manual and automatic
Tutorial (Intermediate level): Dense Cloud Classification and DTM generation with Agisoft PhotoScan Pro 1.1 This tutorial illustrates how to perform dense point cloud classification in manual and automatic
Data Mining Classification: Alternative Techniques. Lecture Notes for Chapter 4. Instance-Based Learning. Introduction to Data Mining, 2 nd Edition
 Data Mining Classification: Alternative Techniques Lecture Notes for Chapter 4 Instance-Based Learning Introduction to Data Mining, 2 nd Edition by Tan, Steinbach, Karpatne, Kumar Instance Based Classifiers
M. Andrea Rodríguez-Tastets. I Semester 2008
 M. -Tastets Universidad de Concepción,Chile andrea@udec.cl I Semester 2008 Outline refers to data with a location on the Earth s surface. Examples Census data Administrative boundaries of a country, state
Investigation of Sampling and Interpolation Techniques for DEMs Derived from Different Data Sources
 Investigation of Sampling and Interpolation Techniques for DEMs Derived from Different Data Sources FARRAG ALI FARRAG 1 and RAGAB KHALIL 2 1: Assistant professor at Civil Engineering Department, Faculty
CPSC 695. Data Quality Issues M. L. Gavrilova
 CPSC 695 Data Quality Issues M. L. Gavrilova 1 Decisions Decisions 2 Topics Data quality issues Factors affecting data quality Types of GIS errors Methods to deal with errors Estimating degree of errors
Integrated Math I. IM1.1.3 Understand and use the distributive, associative, and commutative properties.
 Standard 1: Number Sense and Computation Students simplify and compare expressions. They use rational exponents and simplify square roots. IM1.1.1 Compare real number expressions. IM1.1.2 Simplify square
Lecture 9. Raster Data Analysis. Tomislav Sapic GIS Technologist Faculty of Natural Resources Management Lakehead University
 Lecture 9 Raster Data Analysis Tomislav Sapic GIS Technologist Faculty of Natural Resources Management Lakehead University Raster Data Model The GIS raster data model represents datasets in which square
Machine Learning / Jan 27, 2010
 Revisiting Logistic Regression & Naïve Bayes Aarti Singh Machine Learning 10-701/15-781 Jan 27, 2010 Generative and Discriminative Classifiers Training classifiers involves learning a mapping f: X -> Y,
Lecture 7 Digitizing. Dr. Zhang Spring, 2017
 Lecture 7 Digitizing Dr. Zhang Spring, 2017 Model of the course Using and making maps Navigating GIS maps Map design Working with spatial data Geoprocessing Spatial data infrastructure Digitizing File
L7 Raster Algorithms
 L7 Raster Algorithms NGEN6(TEK23) Algorithms in Geographical Information Systems by: Abdulghani Hasan, updated Nov 216 by Per-Ola Olsson Background Store and analyze the geographic information: Raster
GIS Tools - Geometry. A GIS stores data as different layers of information Different feature types are stored in individual files.
 A Definition of GIS GIS is a system of hardware, software, and procedures designed to support the capture, management, manipulation, analysis, modeling and display of spatially referenced data for solving
Maps as Numbers: Data Models
 Maps as Numbers: Data Models vertices E Reality S E S arcs S E Conceptual Models nodes E Logical Models S Start node E End node S Physical Models 1 The Task An accurate, registered, digital map that can
Data handling 3: Alter Process
 Introduction Geo information Science (GRS 10306) Data handling 3: Alter Process 2009/2010 CGI GIRS 2 Alter / process / analysis / operations definition Query a data handling class of operators which doesn
Algorithms for GIS csci3225
 Algorithms for GIS csci3225 Laura Toma Bowdoin College Spatial data types and models Spatial data in GIS satellite imagery planar maps surfaces networks point cloud (LiDAR) Spatial data in GIS satellite
Quadratic and cubic b-splines by generalizing higher-order voronoi diagrams
 Quadratic and cubic b-splines by generalizing higher-order voronoi diagrams Yuanxin Liu and Jack Snoeyink Joshua Levine April 18, 2007 Computer Science and Engineering, The Ohio State University 1 / 24
Geo372 Vertiefung GIScience. Spatial Interpolation
 Geo372 Vertiefung GIScience Spatial Interpolation Herbstsemester Ross Purves Last week We looked at data quality and integration We saw how uncertainty could be introduced by the concepts we chose, by
Linear Methods for Regression and Shrinkage Methods
 Linear Methods for Regression and Shrinkage Methods Reference: The Elements of Statistical Learning, by T. Hastie, R. Tibshirani, J. Friedman, Springer 1 Linear Regression Models Least Squares Input vectors
Lesson 5 overview. Concepts. Interpolators. Assessing accuracy Exercise 5
 Interpolation Tools Lesson 5 overview Concepts Sampling methods Creating continuous surfaces Interpolation Density surfaces in GIS Interpolators IDW, Spline,Trend, Kriging,Natural neighbors TopoToRaster
Module 4: Index Structures Lecture 16: Voronoi Diagrams and Tries. The Lecture Contains: Voronoi diagrams. Tries. Index structures
 The Lecture Contains: Voronoi diagrams Tries Delaunay triangulation Algorithms Extensions Index structures 1-dimensional index structures Memory-based index structures Disk-based index structures Classification
Voronoi Diagrams in the Plane. Chapter 5 of O Rourke text Chapter 7 and 9 of course text
 Voronoi Diagrams in the Plane Chapter 5 of O Rourke text Chapter 7 and 9 of course text Voronoi Diagrams As important as convex hulls Captures the neighborhood (proximity) information of geometric objects
Subdivision Surfaces
 Subdivision Surfaces 1 Geometric Modeling Sometimes need more than polygon meshes Smooth surfaces Traditional geometric modeling used NURBS Non uniform rational B-Spline Demo 2 Problems with NURBS A single
Getting Started with Spatial Analyst. Steve Kopp Elizabeth Graham
 Getting Started with Spatial Analyst Steve Kopp Elizabeth Graham Workshop Overview Fundamentals of using Spatial Analyst What analysis capabilities exist and where to find them How to build a simple site
Restricted Bathymetric Tracklines Interpolation
 Restricted Bathymetric Tracklines Interpolation Wenli Li, W. Randolph Franklin, Salles V. G. Magalhães, Marcus V. A. Andrade Rensselaer Polytechnic Institute liw9@rpi.edu, mail@wrfranklin.org, vianas2@rpi.edu,
Nearest Neighbor Predictors
 Nearest Neighbor Predictors September 2, 2018 Perhaps the simplest machine learning prediction method, from a conceptual point of view, and perhaps also the most unusual, is the nearest-neighbor method,
Lab 12: Sampling and Interpolation
 Lab 12: Sampling and Interpolation What You ll Learn: -Systematic and random sampling -Majority filtering -Stratified sampling -A few basic interpolation methods Videos that show how to copy/paste data
Geostatistics 2D GMS 7.0 TUTORIALS. 1 Introduction. 1.1 Contents
 GMS 7.0 TUTORIALS 1 Introduction Two-dimensional geostatistics (interpolation) can be performed in GMS using the 2D Scatter Point module. The module is used to interpolate from sets of 2D scatter points
Understanding Gridfit
 Understanding Gridfit John R. D Errico Email: woodchips@rochester.rr.com December 28, 2006 1 Introduction GRIDFIT is a surface modeling tool, fitting a surface of the form z(x, y) to scattered (or regular)
Creating Surfaces. Steve Kopp Steve Lynch
 Steve Kopp Steve Lynch Overview Learn the types of surfaces and the data structures used to store them Emphasis on surface interpolation Learn the interpolation workflow Understand how interpolators work
Lecture 8. Vector Data Analyses. Tomislav Sapic GIS Technologist Faculty of Natural Resources Management Lakehead University
 Lecture 8 Vector Data Analyses Tomislav Sapic GIS Technologist Faculty of Natural Resources Management Lakehead University Vector Data Analysis Vector data analysis involves one or a combination of: Measuring
Subdivision Surfaces
 Subdivision Surfaces 1 Geometric Modeling Sometimes need more than polygon meshes Smooth surfaces Traditional geometric modeling used NURBS Non uniform rational B-Spline Demo 2 Problems with NURBS A single
FMA901F: Machine Learning Lecture 3: Linear Models for Regression. Cristian Sminchisescu
 FMA901F: Machine Learning Lecture 3: Linear Models for Regression Cristian Sminchisescu Machine Learning: Frequentist vs. Bayesian In the frequentist setting, we seek a fixed parameter (vector), with value(s)
Other Voronoi/Delaunay Structures
 Other Voronoi/Delaunay Structures Overview Alpha hulls (a subset of Delaunay graph) Extension of Voronoi Diagrams Convex Hull What is it good for? The bounding region of a point set Not so good for describing
Raster model. Raster model. Resolution. Value and data types. Structure and storage. Cell. Values. Data
 Raster model. Resolution. Values and data types 3. Storage. Fitting rasters 5. Map algebra 6. Interpolation 7. Conversion vectorraster 8. Vector vs. raster Raster model Divides the space into a regular
Topic 3: GIS Models 10/2/2017. What is a Model? What is a GIS Model. Geography 38/42:477 Advanced Geomatics
 Geography 38/42:477 Advanced Geomatics Topic 3: GIS Models What is a Model? Simplified representation of real world Physical, Schematic, Mathematical Map GIS database Reduce complexity and help us understand
Topics in Machine Learning
 Topics in Machine Learning Gilad Lerman School of Mathematics University of Minnesota Text/slides stolen from G. James, D. Witten, T. Hastie, R. Tibshirani and A. Ng Machine Learning - Motivation Arthur
Geometric Rectification of Remote Sensing Images
 Geometric Rectification of Remote Sensing Images Airborne TerrestriaL Applications Sensor (ATLAS) Nine flight paths were recorded over the city of Providence. 1 True color ATLAS image (bands 4, 2, 1 in
Algorithms and Modern Computer Science
 Algorithms and Modern Computer Science Dr. Marina L. Gavrilova Dept of Comp. Science, University of Calgary, AB, Canada, T2N1N4 My Research Interests Computer modeling and simulation Computational geometry
Four equations are necessary to evaluate these coefficients. Eqn
 1.2 Splines 11 A spline function is a piecewise defined function with certain smoothness conditions [Cheney]. A wide variety of functions is potentially possible; polynomial functions are almost exclusively
Möbius Transformations in Scientific Computing. David Eppstein
 Möbius Transformations in Scientific Computing David Eppstein Univ. of California, Irvine School of Information and Computer Science (including joint work with Marshall Bern from WADS 01 and SODA 03) Outline
A technique for constructing monotonic regression splines to enable non-linear transformation of GIS rasters
 18 th World IMACS / MODSIM Congress, Cairns, Australia 13-17 July 2009 http://mssanz.org.au/modsim09 A technique for constructing monotonic regression splines to enable non-linear transformation of GIS
Image Processing, Analysis and Machine Vision
 Image Processing, Analysis and Machine Vision Milan Sonka PhD University of Iowa Iowa City, USA Vaclav Hlavac PhD Czech Technical University Prague, Czech Republic and Roger Boyle DPhil, MBCS, CEng University
Getting Started with Spatial Analyst. Steve Kopp Elizabeth Graham
 Getting Started with Spatial Analyst Steve Kopp Elizabeth Graham Spatial Analyst Overview Over 100 geoprocessing tools plus raster functions Raster and vector analysis Construct workflows with ModelBuilder,
Introduction to GIS 2011
 Introduction to GIS 2011 Digital Elevation Models CREATING A TIN SURFACE FROM CONTOUR LINES 1. Start ArcCatalog from either Desktop or Start Menu. 2. In ArcCatalog, create a new folder dem under your c:\introgis_2011
Introduction to the Mathematical Concepts of CATIA V5
 CATIA V5 Training Foils Introduction to the Mathematical Concepts of CATIA V5 Version 5 Release 19 January 2009 EDU_CAT_EN_MTH_FI_V5R19 1 About this course Objectives of the course Upon completion of this
Spatial Interpolation & Geostatistics
 (Z i Z j ) 2 / 2 Spatial Interpolation & Geostatistics Lag Lag Mean Distance between pairs of points 1 Tobler s Law All places are related, but nearby places are related more than distant places Corollary:
Dgp _ lecture 2. Curves
 Dgp _ lecture 2 Curves Questions? This lecture will be asking questions about curves, their Relationship to surfaces, and how they are used and controlled. Topics of discussion will be: Free form Curves
CS-235 Computational Geometry
 CS-235 Computational Geometry Computer Science Department Fall Quarter 2002. Computational Geometry Study of algorithms for geometric problems. Deals with discrete shapes: points, lines, polyhedra, polygonal
Thoughts on Representing Spatial Objects. William A. Huber Quantitative Decisions Rosemont, PA
 Thoughts on Representing Spatial Objects William A. Huber Quantitative Decisions Rosemont, PA Overview 1. Some Ways to Structure Space 2. What to Put into a Grid 3. Objects and Fields 4. Hybrid Structures
Spatial Interpolation - Geostatistics 4/3/2018
 Spatial Interpolation - Geostatistics 4/3/201 (Z i Z j ) 2 / 2 Spatial Interpolation & Geostatistics Lag Distance between pairs of points Lag Mean Tobler s Law All places are related, but nearby places
GEOGRAPHIC INFORMATION SYSTEMS Lecture 24: Spatial Analyst Continued
 GEOGRAPHIC INFORMATION SYSTEMS Lecture 24: Spatial Analyst Continued Spatial Analyst - Spatial Analyst is an ArcGIS extension designed to work with raster data - in lecture I went through a series of demonstrations
17/07/2013 RASTER DATA STRUCTURE GIS LECTURE 4 GIS DATA MODELS AND STRUCTURES RASTER DATA MODEL& STRUCTURE TIN- TRIANGULAR IRREGULAR NETWORK
 RASTER DATA STRUCTURE GIS LECTURE 4 GIS DATA MODELS AND STRUCTURES Space is subdivided into regular grids of square grid cells or other forms of polygonal meshes known as picture elements (pixels) the
B A
 GIS in Water Resources Exercise #3 Solution Part 1. Slope Calculations 1.1 Hand Calculation (Point A only): (i) ESRI Slope Cell Referencing 45.4 46.1 47 48.6 47.7 45 46.1 46.4 B 47.9 47.4 45.1 45.8 46.8
Computational Geometry. Definition, Application Areas, and Course Overview
 Computational Geometry Definition, Application Areas, and Course Overview Computational Geometry is a subfield of the Design and Analysis of Algorithms Computational Geometry is a subfield of the Design
v. 8.4 Prerequisite Tutorials Watershed Modeling Advanced DEM Delineation Techniques Time minutes
 v. 8.4 WMS 8.4 Tutorial Modeling Orange County Rational Method GIS Learn how to define a rational method hydrologic model for Orange County (California) from GIS data Objectives This tutorial shows you
Data Analysis and Solver Plugins for KSpread USER S MANUAL. Tomasz Maliszewski
 Data Analysis and Solver Plugins for KSpread USER S MANUAL Tomasz Maliszewski tmaliszewski@wp.pl Table of Content CHAPTER 1: INTRODUCTION... 3 1.1. ABOUT DATA ANALYSIS PLUGIN... 3 1.3. ABOUT SOLVER PLUGIN...
Contents of Lecture. Surface (Terrain) Data Models. Terrain Surface Representation. Sampling in Surface Model DEM
 Data Models. Terrain Surface Representation. Sampling in Surface Model DEM") Lecture 13: Advanced Data Models: Terrain mapping and Analysis Contents of Lecture Surface Data Models DEM GRID Model TIN Model Visibility Analysis Geography 373 Spring, 2006 Changjoo Kim 11/29/2006 1
Lecture 13: Advanced Data Models: Terrain mapping and Analysis Contents of Lecture Surface Data Models DEM GRID Model TIN Model Visibility Analysis Geography 373 Spring, 2006 Changjoo Kim 11/29/2006 1
13.472J/1.128J/2.158J/16.940J COMPUTATIONAL GEOMETRY
 13.472J/1.128J/2.158J/16.940J COMPUTATIONAL GEOMETRY Lecture 23 Dr. W. Cho Prof. N. M. Patrikalakis Copyright c 2003 Massachusetts Institute of Technology Contents 23 F.E. and B.E. Meshing Algorithms 2
Multiple-Choice Test Spline Method Interpolation COMPLETE SOLUTION SET
 Multiple-Choice Test Spline Method Interpolation COMPLETE SOLUTION SET 1. The ollowing n data points, ( x ), ( x ),.. ( x, ) 1, y 1, y n y n quadratic spline interpolation the x-data needs to be (A) equally
Representing Geography
 Data models and axioms Chapters 3 and 7 Representing Geography Road map Representing the real world Conceptual models: objects vs fields Implementation models: vector vs raster Vector topological model
Lecture 11 Combinatorial Planning: In the Plane
 CS 460/560 Introduction to Computational Robotics Fall 2017, Rutgers University Lecture 11 Combinatorial Planning: In the Plane Instructor: Jingjin Yu Outline Convex shapes, revisited Combinatorial planning
Implementation of Flight Simulator using 3-Dimensional Terrain Modeling
 Implementation of Flight Simulator using 3-Dimensional Terrain Modeling 1 1, First Author School of Computer Engineering, Hanshin University, Osan City, S. Korea, stryoo@hs.ac.kr Abstract During the last
Multiple Regression White paper
 +44 (0) 333 666 7366 Multiple Regression White paper A tool to determine the impact in analysing the effectiveness of advertising spend. Multiple Regression In order to establish if the advertising mechanisms
Generalized Additive Models
 :p Texts in Statistical Science Generalized Additive Models An Introduction with R Simon N. Wood Contents Preface XV 1 Linear Models 1 1.1 A simple linear model 2 Simple least squares estimation 3 1.1.1
Spectral Surface Reconstruction from Noisy Point Clouds
 Spectral Surface Reconstruction from Noisy Point Clouds 1. Briefly summarize the paper s contributions. Does it address a new problem? Does it present a new approach? Does it show new types of results?
PROPERTIES OF NATURAL ELEMENT COORDINATES ON ANY POLYHEDRON
 PROPRTIS OF NATURAL LMNT COORDINATS ON ANY POLYHDRON P. Milbradt and T. Fröbel Institute of Computer Science in Civil ngineering, Univercity of Hanover, 3067, Hanover, Germany; PH (+49) 5-76-5757; FAX
Uncertainty analysis in spatial environmental modelling. Kasia Sawicka Athens, 29 Mar 2017
 Uncertainty analysis in spatial environmental modelling Kasia Sawicka Athens, 29 Mar 2017 Uncertainty propagation overview Input ± U Model (± U) Output ± U Input data Model parameters Model structure Solution
Kurt Mehlhorn, MPI für Informatik. Curve and Surface Reconstruction p.1/25
 Curve and Surface Reconstruction Kurt Mehlhorn MPI für Informatik Curve and Surface Reconstruction p.1/25 Curve Reconstruction: An Example probably, you see more than a set of points Curve and Surface
Research on Impact of Ground Control Point Distribution on Image Geometric Rectification Based on Voronoi Diagram
 Available online at www.sciencedirect.com Procedia Environmental Sciences 11 (2011) 365 371 Research on Impact of Ground Control Point Distribution on Image Geometric Rectification Based on Voronoi Diagram
Curve fitting. Lab. Formulation. Truncation Error Round-off. Measurement. Good data. Not as good data. Least squares polynomials.
 Formulating models We can use information from data to formulate mathematical models These models rely on assumptions about the data or data not collected Different assumptions will lead to different models.
Lab 12: Sampling and Interpolation
 Lab 12: Sampling and Interpolation What You ll Learn: -Systematic and random sampling -Majority filtering -Stratified sampling -A few basic interpolation methods Data for the exercise are in the L12 subdirectory.
Interpolation - 2D mapping Tutorial 1: triangulation
 Tutorial 1: triangulation Measurements (Zk) at irregular points (xk, yk) Ex: CTD stations, mooring, etc... The known Data How to compute some values on the regular spaced grid points (+)? The unknown data
Outline. Reconstruction of 3D Meshes from Point Clouds. Motivation. Problem Statement. Applications. Challenges
 Reconstruction of 3D Meshes from Point Clouds Ming Zhang Patrick Min cs598b, Geometric Modeling for Computer Graphics Feb. 17, 2000 Outline - problem statement - motivation - applications - challenges
Geometric Correction of Imagery
 Geometric Correction of Imagery Geometric Correction of Imagery Present by: Dr.Weerakaset Suanpaga D.Eng(RS&GIS) The intent is to compensate for the distortions introduced by a variety of factors, so that
Accuracy, Support, and Interoperability. Michael F. Goodchild University of California Santa Barbara
 Accuracy, Support, and Interoperability Michael F. Goodchild University of California Santa Barbara The traditional view Every object has a true position and set of attributes with enough time and resources
DATA MODELS IN GIS. Prachi Misra Sahoo I.A.S.R.I., New Delhi
 DATA MODELS IN GIS Prachi Misra Sahoo I.A.S.R.I., New Delhi -110012 1. Introduction GIS depicts the real world through models involving geometry, attributes, relations, and data quality. Here the realization
CDAA No. 4 - Part Two - Multiple Regression - Initial Data Screening
 CDAA No. 4 - Part Two - Multiple Regression - Initial Data Screening Variables Entered/Removed b Variables Entered GPA in other high school, test, Math test, GPA, High school math GPA a Variables Removed
Extracting Elevation from Air Photos
 Extracting Elevation from Air Photos TUTORIAL A digital elevation model (DEM) is a digital raster surface representing the elevations of a terrain for all spatial ground positions in the image. Traditionally
Reference
 Leaning diary: research methodology 30.11.2017 Name: Juriaan Zandvliet Student number: 291380 (1) a short description of each topic of the course, (2) desciption of possible examples or exercises done