Image Classification. Introduction to Photogrammetry and Remote Sensing (SGHG 1473) Dr. Muhammad Zulkarnain Abdul Rahman
|
|
|
- Ami Clarke
- 6 years ago
- Views:
Transcription
1 Image Classification Introduction to Photogrammetry and Remote Sensing (SGHG 1473) Dr. Muhammad Zulkarnain Abdul Rahman
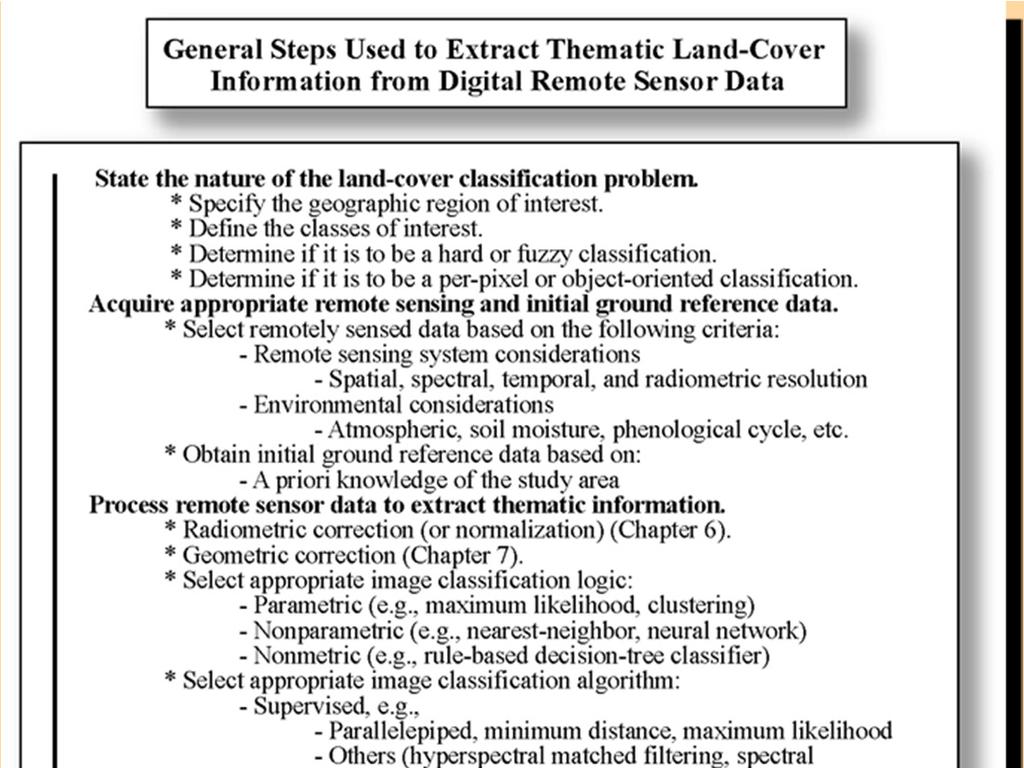
2 Classification Multispectral classification may be performed using a variety of methods, including: Algorithms based on parametric and nonparametric statistics that use ratio-and interval-scaled data and nonmetric methods that can also incorporate nominal scale data; The use of supervised or unsupervised classification logic; The use of hard or soft (fuzzy) set classification logic to create hard or fuzzy thematic output products; The use of per-pixel or object-oriented classification logic, and Hybrid approaches.
3 Classification Parametricmethods such as maximum likelihood classification and unsupervised clustering assume normally distributed remote sensor data and knowledge about the forms of the underlying class density functions. Nonparametric methods such as nearest-neighbor classifiers, fuzzy classifiers, and neural networks may be applied to remote sensor data that are not normally distributedand without the assumption that the forms of the underlying densities are known. Nonmetricmethods such as rule-based decision tree classifiers can operate on both real-valued data (e.g., reflectance values from 0 to 100%) and nominal scaled data (e.g., class 1 = forest; class 2 = agriculture).
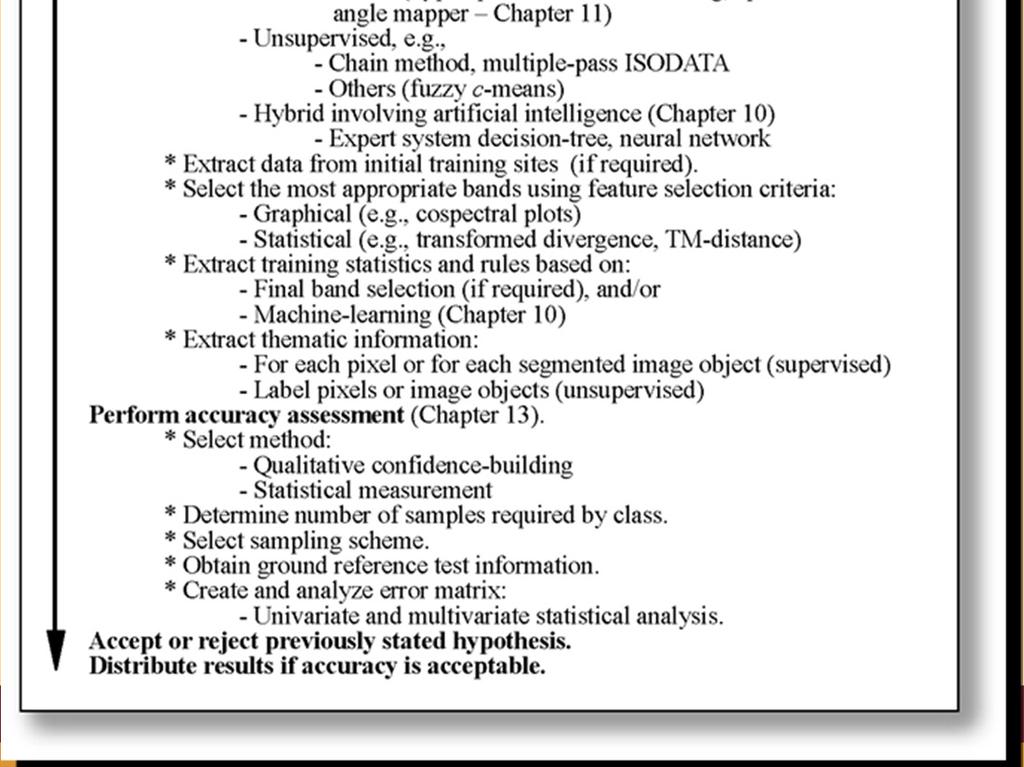
4 Supervised classification Supervised classification -the identityand locationof some of the land-cover types (e.g., urban, agriculture, or wetland) are known a priori through a combination of fieldwork, interpretation of aerial photography, map analysis, and personal experience. The analystattempts to locate specific sites in the remotely sensed data that represent homogeneous examples of these known landcover types. These areas = training sites, because the spectral characteristics of these known areas are used to train the classification algorithm for eventual land-cover mapping of the remainder of the image. Univariateand multivariatestatistical parameters (means, standard deviations, covariance matrices, correlation matrices, etc.) are calculated for each training site. Every pixel both within and outside the training sites is then evaluated and assigned to the class of which it has the highest likelihood of being a member.
5 Unsupervised classification Unsupervised classification-the identities of land-cover typesto be specified as classes within a scene are not generally knowna priori because ground reference information is lacking or surface features within the scene are not well defined. The computer is instructed to group pixels with similar spectral characteristics into unique clusters according to some statistically determined criteria. The analyst then re-labels and combines the spectral clustersinto information classes.
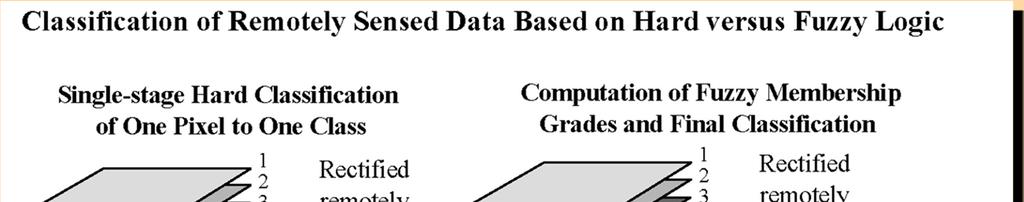
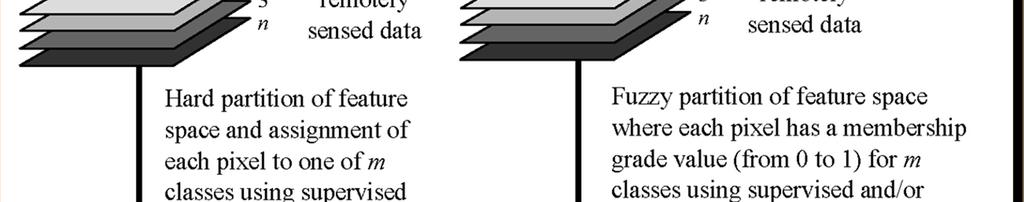
6 Hard vs. Fuzzy Classification Supervised and unsupervised classification algorithms typically use hard classification logic to produce a classification map that consists of hard, discrete categories(e.g., forest, agriculture). Conversely, it is also possible to use fuzzy set classification logic, which takes into account the heterogeneous and imprecise nature of the real world
7 Per-pixel vs. Object-oriented Classification In the past, most digital image classification was based on processing the entire scene pixel by pixel (per-pixel classification) Object-oriented classification -allow the analyst to decompose the scene into many relatively homogenous image objects (referred to as patches or segments) using a multi-resolution image segmentation process. The various statistical characteristics of these homogeneous image objects in the scene are then subjected to traditional statistical or fuzzy logic classification. Object-oriented classification based on image segmentation is often used for the analysis of high-spatial-resolution imagery (e.g., 1x1 m Space Imaging IKONOS and 0.61x0.61 m Digital Globe QuickBird).
8
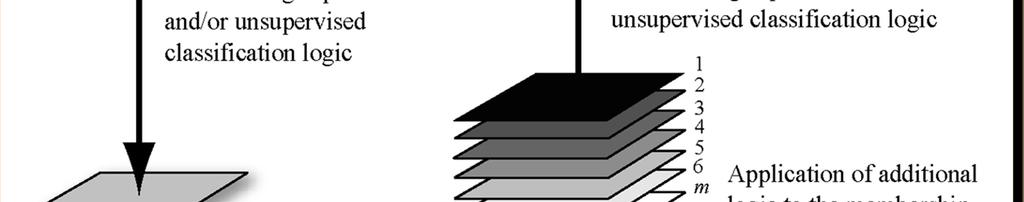
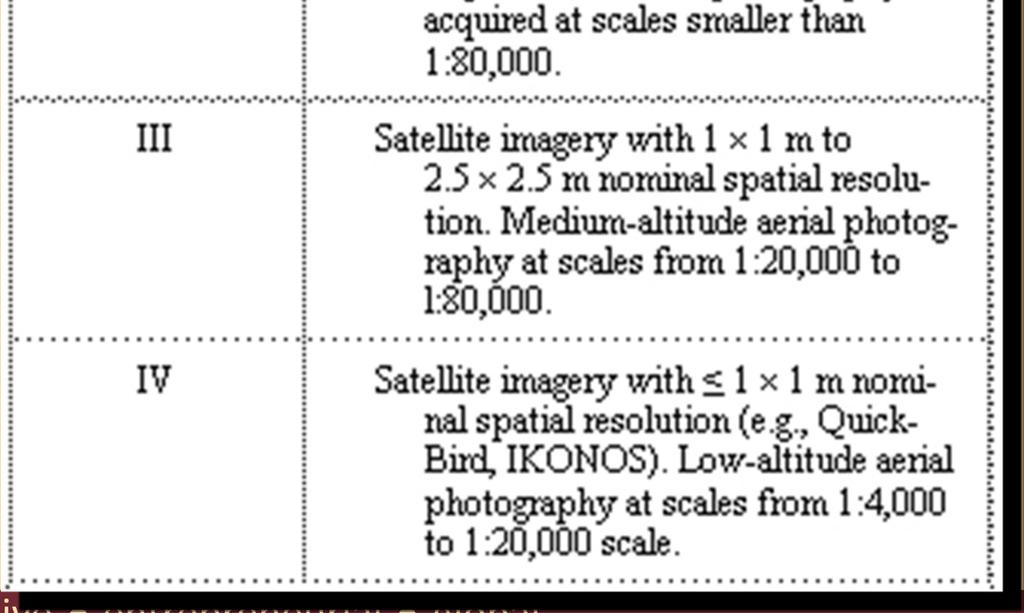
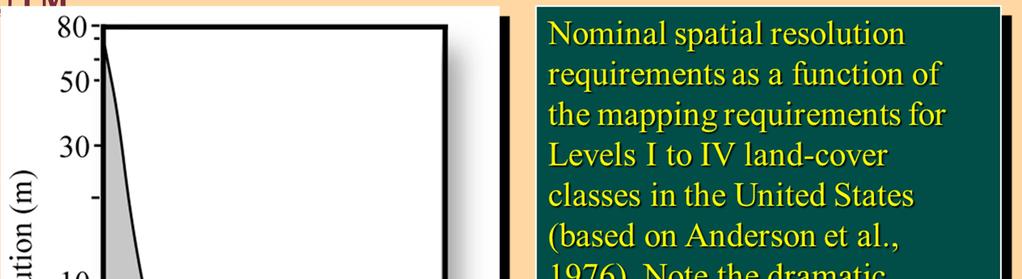
9
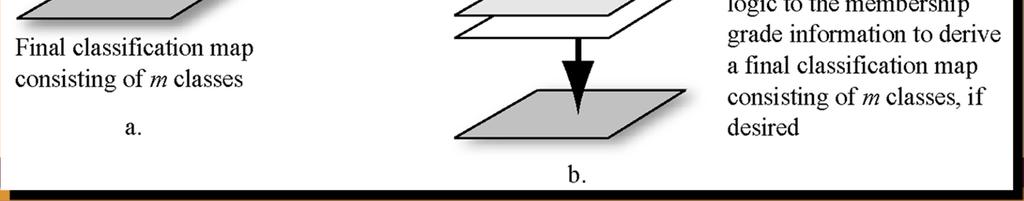
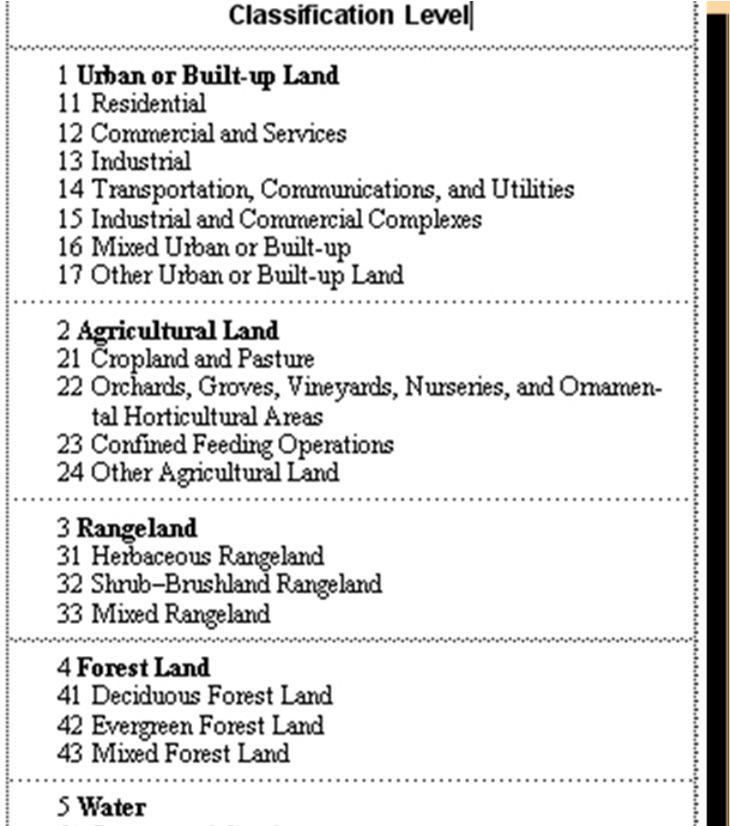
10 Land-use and Land-cover Classification Schemes Land cover refers to the type of material present on the landscape (e.g., water, sand, crops, forest, wetland, humanmade materials such as asphalt). Land use refers to what people do on the land surface (e.g., agriculture, commerce, settlement).
11

12
13 Training Site Selection and Statistics Extraction An analyst may select training sites within the image that are representative of the land-cover or land-use classes of interest after the classification scheme is adopted. The training data should be of value if the environment from which they were obtained is relatively homogeneous. For example, if all the soils in a grassland region are composed of welldrained sandy-loam soil, then it is likely that grassland training data collected throughout the region would be representative. However, if the soil conditions change across the study area (e.g., onehalf of the region has a perched water table with moist near-surface soil), it is likely that grassland training data acquired in the dry-soil part of the study area will not be representative of the spectral conditions for grassland found in the moist-soil portion of the study area. This is called a geographic signature extension problem, meaning that it may not be possible to extend the grassland remote sensing training data through x, y space.
14 Training Site Selection and Statistics Extraction The easiest way to remedy this situation is to apply geographical stratification during the early stages of a project. At this time all significant environmental factors that contribute to geographic signature extension problems should be identified, such as differences in soil type, water turbidity, crop species (e.g., two strains of wheat), unusual soil moisture conditions possibly caused by a thunderstorm that did not uniformly deposit its precipitation, scattered patches of atmospheric haze, and so on. Such environmental conditions should be carefully annotated on the imagery and the selection of training sites made based on the geographic stratification of these data -it may be necessary to train the classifier over relatively short geographic distances. Each individual stratum may have to be classified separately. The final classification map of the entire region will then be a composite of the individual stratum classifications. However, if environmental conditions are homogeneous or can be held constant (e.g., through band ratioingor atmospheric correction), it may be possible to extend signatures vast distances in space, significantly reducing the training cost and effort. Additional research is required before the concept of geographic and temporal (through time) signature extension is fully understood.
15 Training Site Selection and Statistics Extraction Once spatial and temporal signature extension factors have been considered, the analyst selects representative training sites for each class and collects the spectral statistics for each pixel found within each training site. Each site is usually composed of many pixels. The general rule is that if training data are being extracted from n bands then >10npixels of training data are collected for each class. This is sufficient to compute the variance covariance matrices required by some classification algorithms.
16 Training Site Selection and Statistics Extraction There are a number of ways to collect the training site data, including: Collection of in situ information such as forest type, height, percentcanopy closure, and diameter-at-breast-height (dbh) measurements, leaf-area-index (LAI) On-screen selection of polygonal training data, and/or On-screen seeding of training data.
17 Selecting the Optimum Bands for Image Classification: Feature Selection Once the training statistics have been systematically collected from each band for each class of interest, a judgment is often made to determine the bands (channels) that are most effective in discriminating each class from all others. This process is commonly called feature selection. The goal is to delete from the analysis the bands that provide redundant spectral information. In this way the dimensionality(i.e., the number of bands to be processed) in the dataset may be reduced. This minimizes the cost of the digital image classification process (but should not affect the accuracy). Feature selection may involve both statistical and graphicalanalysis to determine the degree of between-class separabilityin the remote sensor training data. Using statistical methods, combinations of bands are normally ranked according to their potential ability to discriminate each class from all others using nbands at a time.
18 Plot of the Charleston, SC, Landsat TM training statistics for five classes measured in bands 4 and 5 displayed as cospectral parallelepipeds. The upper and lower limit of each parallelepiped is±1σ. The parallelepipeds are superimposed on a feature space plot of bands 4 and 5.
19 Select the Appropriate Classification Algorithm Various supervised classification algorithms may be used to assign an unknown pixel to one of mpossible classes. The choice of a particular classifier or decision rule depends on the nature of the input data and the desired output. Parametricclassification algorithms assumes that the observed measurement vectors X c obtained for each class in each spectral band during the training phase of the supervised classification are Gaussian; that is, they are normally distributed. Nonparametric classification algorithms make no such assumption. Several widely adopted nonparametric classification algorithms include: one-dimensional density slicing parallepiped, minimum distance, nearest-neighbor, neural network or expert system analysis. The most widely adopted parametric classification algorithms is the: maximum likelihood.
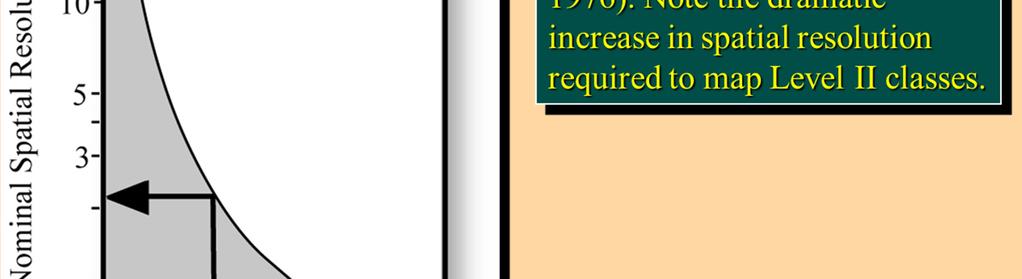
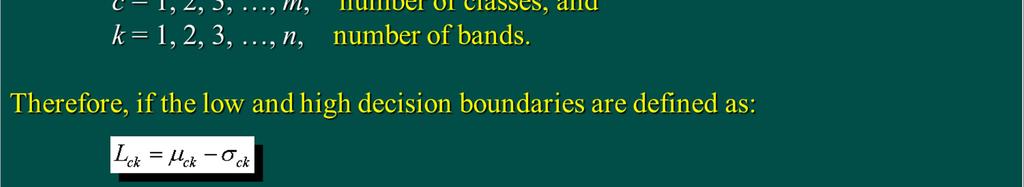
20 Select the Appropriate Classification Algorithm Parallelepiped Classification Algorithm This is a widely used digital image classification decision rule based on simple Boolean and/or logic. Training data in nspectral bands are used to perform the classification. Brightness values from each pixel of the multispectral imagery are used to produce an n-dimensional mean vector, M c = (µ ck, µ c2, µ c3,, µ cn ) with µ ck being the mean value of the training data obtained for class cin band kout of mpossible classes, as previously defined. σ ck is the standard deviation of the training data class c of band kout of mpossible classes.
21
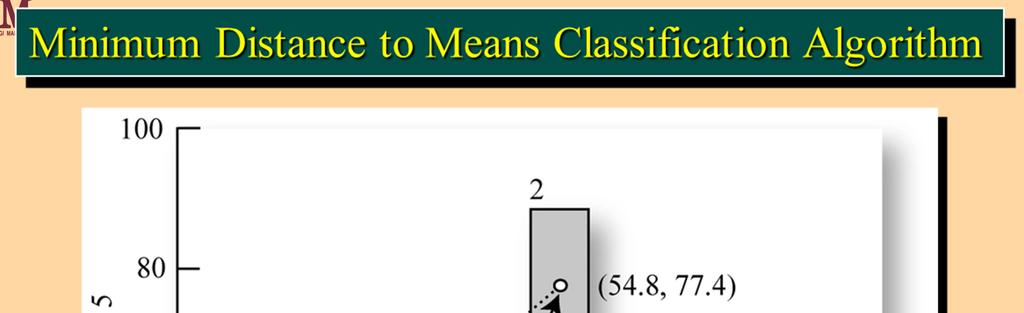
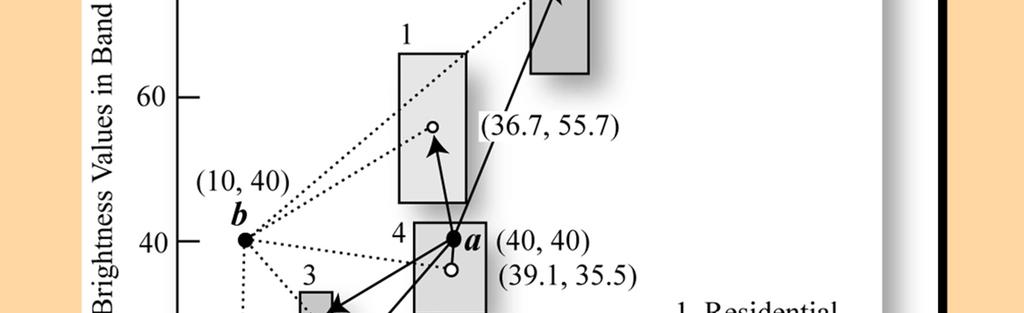
22 Parallelepiped Classification Algorithm Points aand bare pixels in the image to be classified. Pixel ahas a brightness value of 40 in band 4 and 40 in band 5. Pixel bhas a brightness value of 10 in band 4 and 40 in band 5. The boxes represent the parallelepiped decision rule associated with a ±1σclassification. The vectors (arrows) represent the distance from aand bto the mean of all classes in a minimum distance to meansclassification algorithm. Refer to Tables 9-8 and 9-9 for the results of classifying points aand busing both classification techniques.
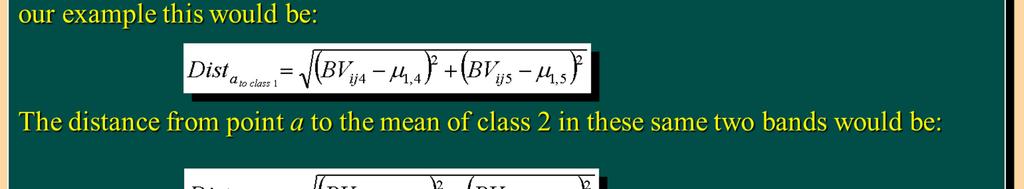
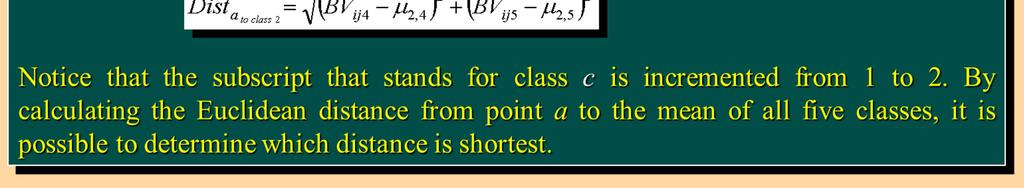
23 Minimum Distance to Means Classification Algorithm The minimum distance to means decision rule is computationally simple and commonly used. When used properly it can result in classification accuracy comparable to other more computationally intensive algorithms such as the maximum likelihood algorithm. Like the parallelepiped algorithm, it requires that the user provide the mean vectors for each class in each bandµckfrom the training data. To perform a minimum distance classification, a program must calculate the distance to each mean vector µckfrom each unknown pixel (BVijk). It is possible to calculate this distance using Euclidean distance based on the Pythagorean theorem or round the block distance measures. In this discussion we demonstrate the method of minimum distance classification using Euclidean distance measurements applied to the two unknown points (a and b).

24 Minimum Distance to Means Classification Algorithm
25
26 Maximum Likelihood Classification Algorithm The aforementioned classifiers were based primarily on identifying decision boundaries in feature space based on training class multispectral distancemeasurements. The maximum likelihood decision ruleis based on probability. It assigns each pixel having pattern measurements or features Xto the class iwhose units are most probable or likely to have given rise to feature vector X. In other words, the probability of a pixel belonging to each of a predefined set of m classes is calculated, and the pixel is then assigned to the class for which the probability is the highest. The maximum likelihood decision ruleis one of the most widely used supervised classification algorithms.
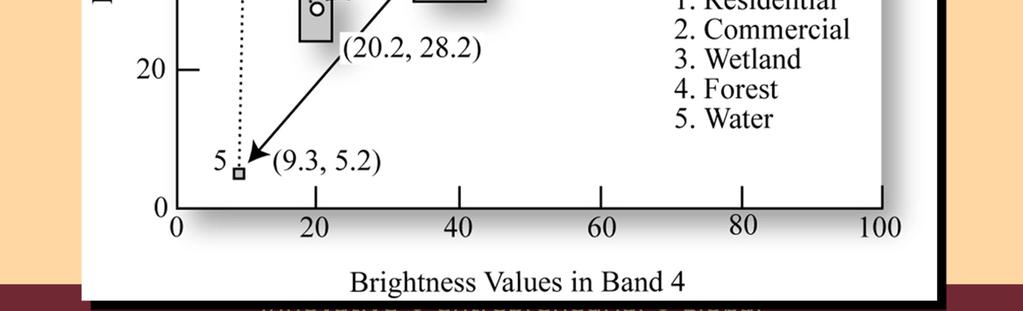
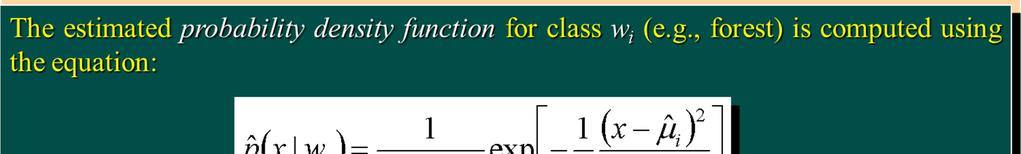
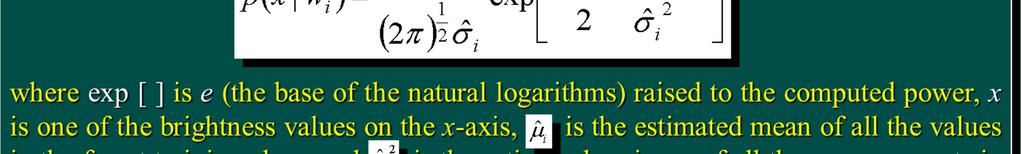
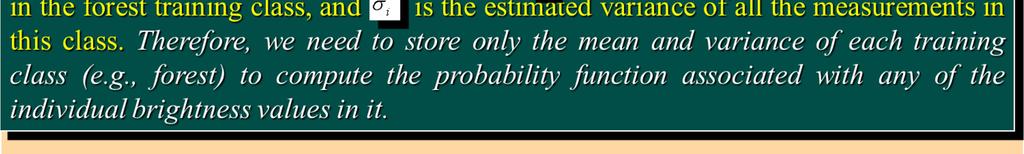
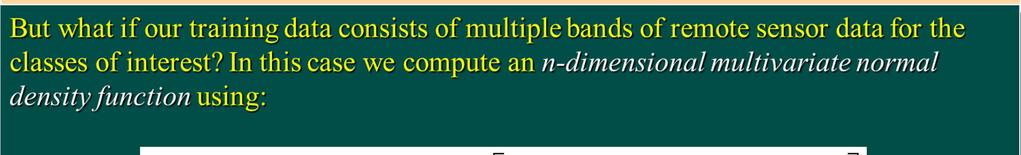
27 Maximum Likelihood Classification Algorithm The maximum likelihood procedure assumes that the training data statistics for each class in each band are normally distributed (Gaussian). Training data with bi-or n-modal histograms in a single band are not ideal. In such cases the individual modes probably represent unique classes that should be trained upon individually and labeled as separate training classes. This should then produce unimodal, Gaussian training class statistics that fulfill the normal distribution requirement. But how do we obtain the probability information we will need from the remote sensing training data we have collected? The answer lies first in the computation of probability density functions.we will demonstrate usinga single class of training data based on a single band of imagery.
28 For example, consider the hypothetical histogram (data frequency distribution) of forest training data obtained in band k. We could choose to store the values contained in this histogram in the computer, but a more elegant solution is to approximate the distribution by a normal probability density function (curve),as shown superimposed on the histogram.
29

30
31 For example, consider this illustration where the bi-variate probability density functionsof six hypothetical classes are arrayed in red and near-infrared feature space. It is bi-variatebecause two bands are used. Note how the probability density function values appear to be normally distributed (i.e., bell-shaped). The vertical axis is associated with the probability of an unknown pixel measurement vector Xbeing a member of one of the classes. In other words, if an unknown measurement vector has brightness values such that it lies within the wetland region, it has a high probability of being wetland. data.

32 Jensen, 2011
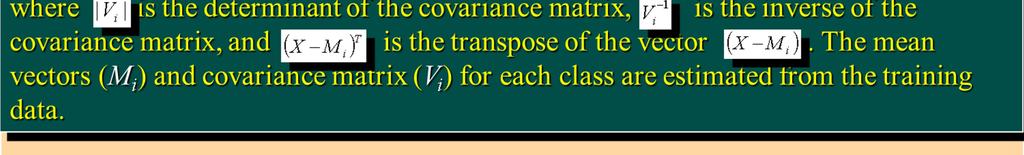
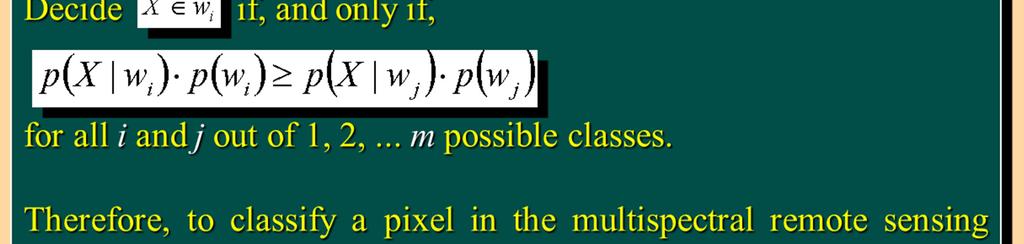
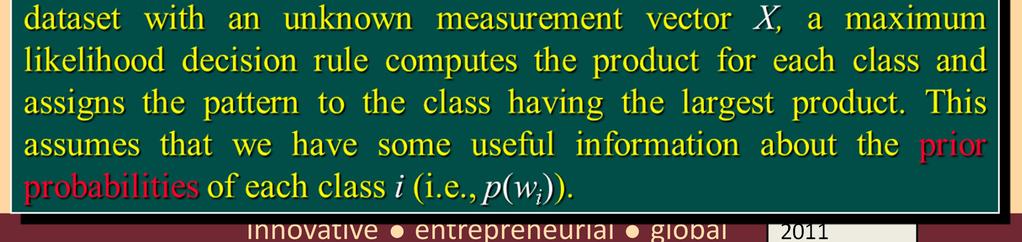
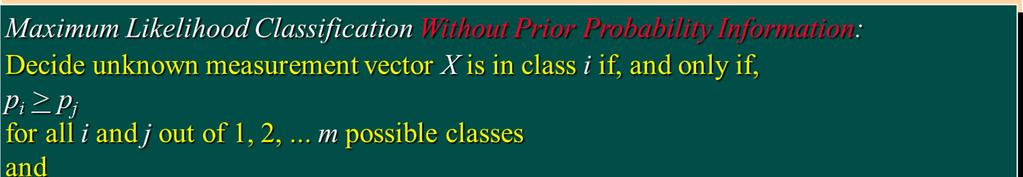
33 Maximum Likelihood Classification Without Prior Probability Information In practice, we rarely have prior information about whether one class (e.g., forest) is expected to occur more frequently in a scene thananyotherclass(e.g.,60%ofthesceneshouldbeforest). Thisiscalledclassaprioriprobabilityinformation(i.e.,p(w i )). Therefore, most applications of the maximum likelihood decision rule assume that each class has an equal probability of occurring in the landscape. Thismakesitpossibletoremovethepriorprobabilityterm(p(w i ))in the previous equation and develop a simplified decision rule that can be applied to the unknown measurement vector X for each pixel in the scene:
34
35
36 What happens when the probability density functions of two or more training classes overlap in feature space? For example, consider two hypothetical normally distributed probability density functions associated with forest and agriculture training data measured in bands 1 and 2. In this case, pixel Xwould be assigned to forest because the probability density of unknown measurement vector X is greater for forest than for agriculture.
Data: a collection of numbers or facts that require further processing before they are meaningful
 Digital Image Classification Data vs. Information Data: a collection of numbers or facts that require further processing before they are meaningful Information: Derived knowledge from raw data. Something
DIGITAL IMAGE ANALYSIS. Image Classification: Object-based Classification
 DIGITAL IMAGE ANALYSIS Image Classification: Object-based Classification Image classification Quantitative analysis used to automate the identification of features Spectral pattern recognition Unsupervised
Digital Image Classification Geography 4354 Remote Sensing
 Digital Image Classification Geography 4354 Remote Sensing Lab 11 Dr. James Campbell December 10, 2001 Group #4 Mark Dougherty Paul Bartholomew Akisha Williams Dave Trible Seth McCoy Table of Contents:
(Refer Slide Time: 0:51)
") Introduction to Remote Sensing Dr. Arun K Saraf Department of Earth Sciences Indian Institute of Technology Roorkee Lecture 16 Image Classification Techniques Hello everyone welcome to 16th lecture in
Introduction to Remote Sensing Dr. Arun K Saraf Department of Earth Sciences Indian Institute of Technology Roorkee Lecture 16 Image Classification Techniques Hello everyone welcome to 16th lecture in
Introduction to digital image classification
 Introduction to digital image classification Dr. Norman Kerle, Wan Bakx MSc a.o. INTERNATIONAL INSTITUTE FOR GEO-INFORMATION SCIENCE AND EARTH OBSERVATION Purpose of lecture Main lecture topics Review
Classify Multi-Spectral Data Classify Geologic Terrains on Venus Apply Multi-Variate Statistics
 Classify Multi-Spectral Data Classify Geologic Terrains on Venus Apply Multi-Variate Statistics Operations What Do I Need? Classify Merge Combine Cross Scan Score Warp Respace Cover Subscene Rotate Translators
Land Cover Classification Techniques
 Land Cover Classification Techniques supervised classification and random forests Developed by remote sensing specialists at the USFS Geospatial Technology and Applications Center (GTAC), located in Salt
Image Classification. RS Image Classification. Present by: Dr.Weerakaset Suanpaga
 Image Classification Present by: Dr.Weerakaset Suanpaga D.Eng(RS&GIS) 6.1 Concept of Classification Objectives of Classification Advantages of Multi-Spectral data for Classification Variation of Multi-Spectra
Lab 9. Julia Janicki. Introduction
 Lab 9 Julia Janicki Introduction My goal for this project is to map a general land cover in the area of Alexandria in Egypt using supervised classification, specifically the Maximum Likelihood and Support
Figure 1: Workflow of object-based classification
 Technical Specifications Object Analyst Object Analyst is an add-on package for Geomatica that provides tools for segmentation, classification, and feature extraction. Object Analyst includes an all-in-one
Lab #4 Introduction to Image Processing II and Map Accuracy Assessment
 FOR 324 Natural Resources Information Systems Lab #4 Introduction to Image Processing II and Map Accuracy Assessment (Adapted from the Idrisi Tutorial, Introduction Image Processing Exercises, Exercise
Geomatica II Course guide
 Course guide Geomatica Version 2017 SP4 2017 PCI Geomatics Enterprises, Inc. All rights reserved. COPYRIGHT NOTICE Software copyrighted by PCI Geomatics Enterprises, Inc., 90 Allstate Parkway, Suite 501
A Comparative Study of Conventional and Neural Network Classification of Multispectral Data
 A Comparative Study of Conventional and Neural Network Classification of Multispectral Data B.Solaiman & M.C.Mouchot Ecole Nationale Supérieure des Télécommunications de Bretagne B.P. 832, 29285 BREST
Remote Sensing & Photogrammetry W4. Beata Hejmanowska Building C4, room 212, phone:
 Remote Sensing & Photogrammetry W4 Beata Hejmanowska Building C4, room 212, phone: +4812 617 22 72 605 061 510 galia@agh.edu.pl 1 General procedures in image classification Conventional multispectral classification
Lecture 11: Classification
 Lecture 11: Classification 1 2009-04-28 Patrik Malm Centre for Image Analysis Swedish University of Agricultural Sciences Uppsala University 2 Reading instructions Chapters for this lecture 12.1 12.2 in
An Approach To Classify The Object From The Satellite Image Using Image Analysis Tool
 IJIRST International Journal for Innovative Research in Science & Technology Volume 1 Issue 4 September 2014 ISSN(online) : 2349-6010 An Approach To Classify The Object From The Satellite Image Using Image
Classification. Vladimir Curic. Centre for Image Analysis Swedish University of Agricultural Sciences Uppsala University
 Classification Vladimir Curic Centre for Image Analysis Swedish University of Agricultural Sciences Uppsala University Outline An overview on classification Basics of classification How to choose appropriate
Classification (or thematic) accuracy assessment. Lecture 8 March 11, 2005
 accuracy assessment. Lecture 8 March 11, 2005") Classification (or thematic) accuracy assessment Lecture 8 March 11, 2005 Why and how Remote sensing-derived thematic information are becoming increasingly important. Unfortunately, they contain errors.
Classification (or thematic) accuracy assessment Lecture 8 March 11, 2005 Why and how Remote sensing-derived thematic information are becoming increasingly important. Unfortunately, they contain errors.
A Vector Agent-Based Unsupervised Image Classification for High Spatial Resolution Satellite Imagery
 A Vector Agent-Based Unsupervised Image Classification for High Spatial Resolution Satellite Imagery K. Borna 1, A. B. Moore 2, P. Sirguey 3 School of Surveying University of Otago PO Box 56, Dunedin,
HYPERSPECTRAL REMOTE SENSING
 HYPERSPECTRAL REMOTE SENSING By Samuel Rosario Overview The Electromagnetic Spectrum Radiation Types MSI vs HIS Sensors Applications Image Analysis Software Feature Extraction Information Extraction 1
Aardobservatie en Data-analyse Image processing
 Aardobservatie en Data-analyse Image processing 1 Image processing: Processing of digital images aiming at: - image correction (geometry, dropped lines, etc) - image calibration: DN into radiance or into
Classifying. Stuart Green Earthobservation.wordpress.com MERMS 12 - L4
 Classifying Stuart Green Earthobservation.wordpress.com Stuart.Green@Teagasc.ie MERMS 12 - L4 Classifying Replacing the digital numbers in each pixel (that tell us the average spectral properties of everything
The Gain setting for Landsat 7 (High or Low Gain) depends on: Sensor Calibration - Application. the surface cover types of the earth and the sun angle
 depends on: Sensor Calibration - Application. the surface cover types of the earth and the sun angle") Sensor Calibration - Application Station Identifier ASN Scene Center atitude 34.840 (34 3'0.64"N) Day Night DAY Scene Center ongitude 33.03270 (33 0'7.72"E) WRS Path WRS Row 76 036 Corner Upper eft atitude
Sensor Calibration - Application Station Identifier ASN Scene Center atitude 34.840 (34 3'0.64"N) Day Night DAY Scene Center ongitude 33.03270 (33 0'7.72"E) WRS Path WRS Row 76 036 Corner Upper eft atitude
SLIDING WINDOW FOR RELATIONS MAPPING
 SLIDING WINDOW FOR RELATIONS MAPPING Dana Klimesova Institute of Information Theory and Automation, Prague, Czech Republic and Czech University of Agriculture, Prague klimes@utia.cas.c klimesova@pef.czu.cz
INF 4300 Classification III Anne Solberg The agenda today:
 INF 4300 Classification III Anne Solberg 28.10.15 The agenda today: More on estimating classifier accuracy Curse of dimensionality and simple feature selection knn-classification K-means clustering 28.10.15
Structural Analysis of Aerial Photographs (HB47 Computer Vision: Assignment)
") Structural Analysis of Aerial Photographs (HB47 Computer Vision: Assignment) Xiaodong Lu, Jin Yu, Yajie Li Master in Artificial Intelligence May 2004 Table of Contents 1 Introduction... 1 2 Edge-Preserving
Structural Analysis of Aerial Photographs (HB47 Computer Vision: Assignment) Xiaodong Lu, Jin Yu, Yajie Li Master in Artificial Intelligence May 2004 Table of Contents 1 Introduction... 1 2 Edge-Preserving
Remote Sensing Introduction to the course
 Remote Sensing Introduction to the course Remote Sensing (Prof. L. Biagi) Exploitation of remotely assessed data for information retrieval Data: Digital images of the Earth, obtained by sensors recording
Spectral Classification
 Spectral Classification Spectral Classification Supervised versus Unsupervised Classification n Unsupervised Classes are determined by the computer. Also referred to as clustering n Supervised Classes
EVALUATION OF CONVENTIONAL DIGITAL CAMERA SCENES FOR THEMATIC INFORMATION EXTRACTION ABSTRACT
 EVALUATION OF CONVENTIONAL DIGITAL CAMERA SCENES FOR THEMATIC INFORMATION EXTRACTION H. S. Lim, M. Z. MatJafri and K. Abdullah School of Physics Universiti Sains Malaysia, 11800 Penang ABSTRACT A study
Quality assessment of RS data. Remote Sensing (GRS-20306)
") Quality assessment of RS data Remote Sensing (GRS-20306) Quality assessment General definition for quality assessment (Wikipedia) includes evaluation, grading and measurement process to assess design,
Quality assessment of RS data Remote Sensing (GRS-20306) Quality assessment General definition for quality assessment (Wikipedia) includes evaluation, grading and measurement process to assess design,
APPLICATION OF SOFTMAX REGRESSION AND ITS VALIDATION FOR SPECTRAL-BASED LAND COVER MAPPING
 APPLICATION OF SOFTMAX REGRESSION AND ITS VALIDATION FOR SPECTRAL-BASED LAND COVER MAPPING J. Wolfe a, X. Jin a, T. Bahr b, N. Holzer b, * a Harris Corporation, Broomfield, Colorado, U.S.A. (jwolfe05,
IMAGINE Objective. The Future of Feature Extraction, Update & Change Mapping
 IMAGINE ive The Future of Feature Extraction, Update & Change Mapping IMAGINE ive provides object based multi-scale image classification and feature extraction capabilities to reliably build and maintain
This is the general guide for landuse mapping using mid-resolution remote sensing data
 This is the general guide for landuse mapping using mid-resolution remote sensing data February 11 2015 This document has been prepared for Training workshop on REDD+ Research Project in Peninsular Malaysia
Application of nonparametric Bayesian classifier to remote sensing data. Institute of Parallel Processing, Bulgarian Academy of Sciences
 Application of nonparametric Bayesian classifier to remote sensing data Nina Jeliazkova, nina@acad.bg, +359 2 979 6606 Stela Ruseva, stela@acad.bg, +359 2 979 6606 Kiril Boyanov, boyanov@acad.bg Institute
LAND COVER MAPPING BY AN OPTIMISED OBJECT-ORIENTED APPROACH. CASE OF STUDY: MEDITERRANEAN LANDSCAPES
 EARSeL eproceedings 9, 2/2010 42 LAND COVER MAPPING BY AN OPTIMISED OBJECT-ORIENTED APPROACH. CASE OF STUDY: MEDITERRANEAN LANDSCAPES Javier Sánchez, Estíbaliz Martínez, Agueda Arquero, and Diego Renza
Unsupervised and Self-taught Learning for Remote Sensing Image Analysis
 Unsupervised and Self-taught Learning for Remote Sensing Image Analysis Ribana Roscher Institute of Geodesy and Geoinformation, Remote Sensing Group, University of Bonn 1 The Changing Earth https://earthengine.google.com/timelapse/
AN INTEGRATED APPROACH TO AGRICULTURAL CROP CLASSIFICATION USING SPOT5 HRV IMAGES
 AN INTEGRATED APPROACH TO AGRICULTURAL CROP CLASSIFICATION USING SPOT5 HRV IMAGES Chang Yi 1 1,2,*, Yaozhong Pan 1, 2, Jinshui Zhang 1, 2 College of Resources Science and Technology, Beijing Normal University,
CHAPTER 5 OBJECT ORIENTED IMAGE ANALYSIS
 85 CHAPTER 5 OBJECT ORIENTED IMAGE ANALYSIS 5.1 GENERAL Urban feature mapping is one of the important component for the planning, managing and monitoring the rapid urbanized growth. The present conventional
Prof. Vidya Manian Dept. of Electrical l and Comptuer Engineering. INEL6007(Spring 2010) ECE, UPRM
 ECE, UPRM") Inel 6007 Introduction to Remote Sensing Chapter 5 Spectral Transforms Prof. Vidya Manian Dept. of Electrical l and Comptuer Engineering Chapter 5-1 MSI Representation Image Space: Spatial information
Inel 6007 Introduction to Remote Sensing Chapter 5 Spectral Transforms Prof. Vidya Manian Dept. of Electrical l and Comptuer Engineering Chapter 5-1 MSI Representation Image Space: Spatial information
Defining Remote Sensing
 Defining Remote Sensing Remote Sensing is a technology for sampling electromagnetic radiation to acquire and interpret non-immediate geospatial data from which to extract information about features, objects,
Object-Based Classification & ecognition. Zutao Ouyang 11/17/2015
 Object-Based Classification & ecognition Zutao Ouyang 11/17/2015 What is Object-Based Classification The object based image analysis approach delineates segments of homogeneous image areas (i.e., objects)
Using ArcGIS for Landcover Classification. Presented by CORE GIS May 8, 2012
 Using ArcGIS for Landcover Classification Presented by CORE GIS May 8, 2012 How to use ArcGIS for Image Classification 1. Find and download the right data 2. Have a look at the data (true color/false color)
Pattern Recognition & Classification
 CEE 6150: Digital Image Processing 1 Classification Supervised parallelpiped minimum distance maximum likelihood (Bayes Rule) > non-parametric > parametric Unsupervised (clustering) K-Means ISODATA support
COMBINING HIGH SPATIAL RESOLUTION OPTICAL AND LIDAR DATA FOR OBJECT-BASED IMAGE CLASSIFICATION
 COMBINING HIGH SPATIAL RESOLUTION OPTICAL AND LIDAR DATA FOR OBJECT-BASED IMAGE CLASSIFICATION Ruonan Li 1, Tianyi Zhang 1, Ruozheng Geng 1, Leiguang Wang 2, * 1 School of Forestry, Southwest Forestry
Attribute Accuracy. Quantitative accuracy refers to the level of bias in estimating the values assigned such as estimated values of ph in a soil map.
 Attribute Accuracy Objectives (Entry) This basic concept of attribute accuracy has been introduced in the unit of quality and coverage. This unit will teach a basic technique to quantify the attribute
Discriminate Analysis
 Discriminate Analysis Outline Introduction Linear Discriminant Analysis Examples 1 Introduction What is Discriminant Analysis? Statistical technique to classify objects into mutually exclusive and exhaustive
Remote Sensing Image Analysis via a Texture Classification Neural Network
 Remote Sensing Image Analysis via a Texture Classification Neural Network Hayit K. Greenspan and Rodney Goodman Department of Electrical Engineering California Institute of Technology, 116-81 Pasadena,
Classification. Vladimir Curic. Centre for Image Analysis Swedish University of Agricultural Sciences Uppsala University
 Classification Vladimir Curic Centre for Image Analysis Swedish University of Agricultural Sciences Uppsala University Outline An overview on classification Basics of classification How to choose appropriate
Chapter Seventeen: Classification of Remotely Sensed Imagery Introduction. Supervised Versus Unsupervised Classification
 Chapter Seventeen: Classification of Remotely Sensed Imagery Introduction Classification is the process of developing interpreted maps from remotely sensed images. As a consequence, classification is perhaps
Supervised vs. Unsupervised Learning
 Clustering Supervised vs. Unsupervised Learning So far we have assumed that the training samples used to design the classifier were labeled by their class membership (supervised learning) We assume now
Introduction to Remote Sensing
 Introduction to Remote Sensing Spatial, spectral, temporal resolutions Image display alternatives Vegetation Indices Image classifications Image change detections Accuracy assessment Satellites & Air-Photos
INTEGRATION OF TREE DATABASE DERIVED FROM SATELLITE IMAGERY AND LIDAR POINT CLOUD DATA
 INTEGRATION OF TREE DATABASE DERIVED FROM SATELLITE IMAGERY AND LIDAR POINT CLOUD DATA S. C. Liew 1, X. Huang 1, E. S. Lin 2, C. Shi 1, A. T. K. Yee 2, A. Tandon 2 1 Centre for Remote Imaging, Sensing
Combining Human and Computer Interpretation Capabilities to Analyze ERTS Imagery
 Purdue University Purdue e-pubs LARS Symposia Laboratory for Applications of Remote Sensing 10-1-1973 Combining Human and Computer Interpretation Capabilities to Analyze ERTS Imagery J. D. Nichols University
Unsupervised Learning and Clustering
 Unsupervised Learning and Clustering Selim Aksoy Department of Computer Engineering Bilkent University saksoy@cs.bilkent.edu.tr CS 551, Spring 2009 CS 551, Spring 2009 c 2009, Selim Aksoy (Bilkent University)
Nonlinear data separation and fusion for multispectral image classification
 Nonlinear data separation and fusion for multispectral image classification Hela Elmannai #*1, Mohamed Anis Loghmari #2, Mohamed Saber Naceur #3 # Laboratoire de Teledetection et Systeme d informations
Clustering and Dissimilarity Measures. Clustering. Dissimilarity Measures. Cluster Analysis. Perceptually-Inspired Measures
 Clustering and Dissimilarity Measures Clustering APR Course, Delft, The Netherlands Marco Loog May 19, 2008 1 What salient structures exist in the data? How many clusters? May 19, 2008 2 Cluster Analysis
PARALLEL CLASSIFICATION ALGORITHMS
 PARALLEL CLASSIFICATION ALGORITHMS By: Faiz Quraishi Riti Sharma 9 th May, 2013 OVERVIEW Introduction Types of Classification Linear Classification Support Vector Machines Parallel SVM Approach Decision
Hybrid Model with Super Resolution and Decision Boundary Feature Extraction and Rule based Classification of High Resolution Data
 Hybrid Model with Super Resolution and Decision Boundary Feature Extraction and Rule based Classification of High Resolution Data Navjeet Kaur M.Tech Research Scholar Sri Guru Granth Sahib World University
The Feature Analyst Extension for ERDAS IMAGINE
 The Feature Analyst Extension for ERDAS IMAGINE Automated Feature Extraction Software for GIS Database Maintenance We put the information in GIS SM A Visual Learning Systems, Inc. White Paper September
Statistical Analysis of Metabolomics Data. Xiuxia Du Department of Bioinformatics & Genomics University of North Carolina at Charlotte
 Statistical Analysis of Metabolomics Data Xiuxia Du Department of Bioinformatics & Genomics University of North Carolina at Charlotte Outline Introduction Data pre-treatment 1. Normalization 2. Centering,
Supervised vs unsupervised clustering
 Classification Supervised vs unsupervised clustering Cluster analysis: Classes are not known a- priori. Classification: Classes are defined a-priori Sometimes called supervised clustering Extract useful
Prepare a stem-and-leaf graph for the following data. In your final display, you should arrange the leaves for each stem in increasing order.
 Chapter 2 2.1 Descriptive Statistics A stem-and-leaf graph, also called a stemplot, allows for a nice overview of quantitative data without losing information on individual observations. It can be a good
Advanced Processing Techniques and Classification of Full-waveform Airborne Laser...
 f j y = f( x) = f ( x) n j= 1 j Advanced Processing Techniques and Classification of Full-waveform Airborne Laser... 89 A summary of the proposed methods is presented below: Stilla et al. propose a method
Geometric Rectification of Remote Sensing Images
 Geometric Rectification of Remote Sensing Images Airborne TerrestriaL Applications Sensor (ATLAS) Nine flight paths were recorded over the city of Providence. 1 True color ATLAS image (bands 4, 2, 1 in
Files Used in This Tutorial. Background. Feature Extraction with Example-Based Classification Tutorial
 Feature Extraction with Example-Based Classification Tutorial In this tutorial, you will use Feature Extraction to extract rooftops from a multispectral QuickBird scene of a residential area in Boulder,
Nearest Clustering Algorithm for Satellite Image Classification in Remote Sensing Applications
 Nearest Clustering Algorithm for Satellite Image Classification in Remote Sensing Applications Anil K Goswami 1, Swati Sharma 2, Praveen Kumar 3 1 DRDO, New Delhi, India 2 PDM College of Engineering for
Unsupervised Learning : Clustering
 Unsupervised Learning : Clustering Things to be Addressed Traditional Learning Models. Cluster Analysis K-means Clustering Algorithm Drawbacks of traditional clustering algorithms. Clustering as a complex
FIELD-BASED CLASSIFICATION OF AGRICULTURAL CROPS USING MULTI-SCALE IMAGES
 FIELD-BASED CLASSIFICATION OF AGRICULTURAL CROPS USING MULTI-SCALE IMAGES A. OZDARICI a, M. TURKER b a Middle East Technical University (METU), Graduate School of Natural and Applied Sciences, Geodetic
Measuring landscape pattern
 Measuring landscape pattern Why would we want to measure landscape patterns? Identify change over time Compare landscapes Compare alternative landscape scenarios Explain processes Steps in Application
Data Fusion. Merging data from multiple sources to optimize data or create value added data
 Data Fusion Jeffrey S. Evans - Landscape Ecologist USDA Forest Service Rocky Mountain Research Station Forestry Sciences Lab - Moscow, Idaho Data Fusion Data Fusion is a formal framework in which are expressed
Normalized Texture Motifs and Their Application to Statistical Object Modeling
 Normalized Texture Motifs and Their Application to Statistical Obect Modeling S. D. Newsam B. S. Manunath Center for Applied Scientific Computing Electrical and Computer Engineering Lawrence Livermore
Spatial Information Based Image Classification Using Support Vector Machine
 Spatial Information Based Image Classification Using Support Vector Machine P.Jeevitha, Dr. P. Ganesh Kumar PG Scholar, Dept of IT, Regional Centre of Anna University, Coimbatore, India. Assistant Professor,
Unsupervised Learning and Clustering
 Unsupervised Learning and Clustering Selim Aksoy Department of Computer Engineering Bilkent University saksoy@cs.bilkent.edu.tr CS 551, Spring 2008 CS 551, Spring 2008 c 2008, Selim Aksoy (Bilkent University)
Clustering. Supervised vs. Unsupervised Learning
 Clustering Supervised vs. Unsupervised Learning So far we have assumed that the training samples used to design the classifier were labeled by their class membership (supervised learning) We assume now
EVALUATION OF THE THEMATIC INFORMATION CONTENT OF THE ASTER-VNIR IMAGERY IN URBAN AREAS BY CLASSIFICATION TECHNIQUES
 EVALUATION OF THE THEMATIC INFORMATION CONTENT OF THE ASTER-VNIR IMAGERY IN URBAN AREAS BY CLASSIFICATION TECHNIQUES T. G. Panagou a *, G. Ch. Miliaresis a a TEI, Dpt. of Topography, 3 P.Drakou Str., Thiva,
CS6716 Pattern Recognition
 CS6716 Pattern Recognition Prototype Methods Aaron Bobick School of Interactive Computing Administrivia Problem 2b was extended to March 25. Done? PS3 will be out this real soon (tonight) due April 10.
Artificial Neural Networks Lab 2 Classical Pattern Recognition
 Artificial Neural Networks Lab 2 Classical Pattern Recognition Purpose To implement (using MATLAB) some traditional classifiers and try these on both synthetic and real data. The exercise should give some
SD 372 Pattern Recognition
 SD 372 Pattern Recognition Lab 2: Model Estimation and Discriminant Functions 1 Purpose This lab examines the areas of statistical model estimation and classifier aggregation. Model estimation will be
INCREASING CLASSIFICATION QUALITY BY USING FUZZY LOGIC
 JOURNAL OF APPLIED ENGINEERING SCIENCES VOL. 1(14), issue 4_2011 ISSN 2247-3769 ISSN-L 2247-3769 (Print) / e-issn:2284-7197 INCREASING CLASSIFICATION QUALITY BY USING FUZZY LOGIC DROJ Gabriela, University
Lab 5: Image Analysis with ArcGIS 10 Unsupervised Classification
 Lab 5: Image Analysis with ArcGIS 10 Unsupervised Classification Peter E. Price TerraView 2010 Peter E. Price All rights reserved Revised 03/2011 Revised for Geob 373 by BK Feb 28, 2017. V3 The information
Network Traffic Measurements and Analysis
 DEIB - Politecnico di Milano Fall, 2017 Introduction Often, we have only a set of features x = x 1, x 2,, x n, but no associated response y. Therefore we are not interested in prediction nor classification,
Introduction to Pattern Recognition Part II. Selim Aksoy Bilkent University Department of Computer Engineering
 Introduction to Pattern Recognition Part II Selim Aksoy Bilkent University Department of Computer Engineering saksoy@cs.bilkent.edu.tr RETINA Pattern Recognition Tutorial, Summer 2005 Overview Statistical
University of Florida CISE department Gator Engineering. Data Preprocessing. Dr. Sanjay Ranka
 Data Preprocessing Dr. Sanjay Ranka Professor Computer and Information Science and Engineering University of Florida, Gainesville ranka@cise.ufl.edu Data Preprocessing What preprocessing step can or should
Remote Sensed Image Classification based on Spatial and Spectral Features using SVM
 RESEARCH ARTICLE OPEN ACCESS Remote Sensed Image Classification based on Spatial and Spectral Features using SVM Mary Jasmine. E PG Scholar Department of Computer Science and Engineering, University College
DZD DPZ 9 Clasification. Jiří Horák - Tomáš Peňáz Institut geoinformatiky VŠB-TU Ostrava
 DZD DPZ 9 Clasification Jiří Horák - Tomáš Peňáz Institut geoinformatiky VŠB-TU Ostrava Basic principles of classification Classification process assigning certain information meaning to image elements
SOFT COMPUTING-NEURAL NETWORKS ENSEMBLES
 SOFT COMPUTING-NEURAL NETWORKS ENSEMBLES 1 K.Venu Gopala Rao, 2 P.Prem Chand, 3 M.V.Ramana Murthy 1 Department of Computer Science&Engg, GNITS, Hyderabad-500 008, A.P. 2 Department of Computer Science&Engg,
Supervised Classification High-Resolution Remote-Sensing Image Based on Interval Type-2 Fuzzy Membership Function
 remote sensing Article Supervised Classification High-Resolution Remote-Sensing Image Based on Interval Type-2 Fuzzy Membership Function Chunyan Wang 1, Aigong Xu 2, * Xiaoli Li 2 ID 1 School Mining Industry
Hands on Exercise Using ecognition Developer
 1 Hands on Exercise Using ecognition Developer 2 Hands on Exercise Using ecognition Developer Hands on Exercise Using ecognition Developer Go the Windows Start menu and Click Start > All Programs> ecognition
GEOBIA for ArcGIS (presentation) Jacek Urbanski
 Jacek Urbanski") GEOBIA for ArcGIS (presentation) Jacek Urbanski INTEGRATION OF GEOBIA WITH GIS FOR SEMI-AUTOMATIC LAND COVER MAPPING FROM LANDSAT 8 IMAGERY Presented at 5th GEOBIA conference 21 24 May in Thessaloniki.
GEOBIA for ArcGIS (presentation) Jacek Urbanski INTEGRATION OF GEOBIA WITH GIS FOR SEMI-AUTOMATIC LAND COVER MAPPING FROM LANDSAT 8 IMAGERY Presented at 5th GEOBIA conference 21 24 May in Thessaloniki.
Estimating the wavelength composition of scene illumination from image data is an
 Chapter 3 The Principle and Improvement for AWB in DSC 3.1 Introduction Estimating the wavelength composition of scene illumination from image data is an important topics in color engineering. Solutions
Raster Classification with ArcGIS Desktop. Rebecca Richman Andy Shoemaker
 Raster Classification with ArcGIS Desktop Rebecca Richman Andy Shoemaker Raster Classification What is it? - Classifying imagery into different land use/ land cover classes based on the pixel values of
Data Preprocessing. Data Preprocessing
 Data Preprocessing Dr. Sanjay Ranka Professor Computer and Information Science and Engineering University of Florida, Gainesville ranka@cise.ufl.edu Data Preprocessing What preprocessing step can or should
ECE 176 Digital Image Processing Handout #14 Pamela Cosman 4/29/05 TEXTURE ANALYSIS
 ECE 176 Digital Image Processing Handout #14 Pamela Cosman 4/29/ TEXTURE ANALYSIS Texture analysis is covered very briefly in Gonzalez and Woods, pages 66 671. This handout is intended to supplement that
Temporal Modeling and Missing Data Estimation for MODIS Vegetation data
 Temporal Modeling and Missing Data Estimation for MODIS Vegetation data Rie Honda 1 Introduction The Moderate Resolution Imaging Spectroradiometer (MODIS) is the primary instrument on board NASA s Earth
ENVI Classic Tutorial: A Quick Start to ENVI Classic
 ENVI Classic Tutorial: A Quick Start to ENVI Classic A Quick Start to ENVI Classic 2 Files Used in this Tutorial 2 Getting Started with ENVI Classic 3 Loading a Gray Scale Image 3 Familiarizing Yourself
IMAGE CLASSIFICATION WITH A REGION BASED APPROACH IN HIGH SPATIAL RESOLUTION IMAGERY
 IMAGE CLASSIFICATION WITH A REGION BASED APPROACH IN HIGH SPATIAL RESOLUTION IMAGERY Jong Yeol Lee a, Timothy A. Warner b a Korea Research Institute for Human Settlements, 1591-6, Kwanyang-Dong, Dongan-Gu,
Applying Supervised Learning
 Applying Supervised Learning When to Consider Supervised Learning A supervised learning algorithm takes a known set of input data (the training set) and known responses to the data (output), and trains
Unsupervised Learning
 Outline Unsupervised Learning Basic concepts K-means algorithm Representation of clusters Hierarchical clustering Distance functions Which clustering algorithm to use? NN Supervised learning vs. unsupervised
IMPROVING 2D CHANGE DETECTION BY USING AVAILABLE 3D DATA
 IMPROVING 2D CHANGE DETECTION BY USING AVAILABLE 3D DATA C.J. van der Sande a, *, M. Zanoni b, B.G.H. Gorte a a Optical and Laser Remote Sensing, Department of Earth Observation and Space systems, Delft
Computer Vision. Exercise Session 10 Image Categorization
 Computer Vision Exercise Session 10 Image Categorization Object Categorization Task Description Given a small number of training images of a category, recognize a-priori unknown instances of that category