Controlling Execution Time Variability Using COTS for Safety Critical Systems
|
|
|
- Shana Goodwin
- 6 years ago
- Views:
Transcription
 DISCIPLINE : Physique - Systèmes Embarqués THÈSE DE DOCTORAT soutenance le 10/07/2014 par Jingyi BIN Controlling Execution Time Variability Using COTS for Safety Critical Systems")
 Rapporteurs : Laurent PAUTET Professeur (LTCI, Télécom ParisTech) Michel AUGUIN Directeur de Recherche (Université de Nice) Examinateurs : Alain MERIGOT Professeur (IEF, Université")
1 UNIVERSITÉ PARIS-SUD ÉCOLE DOCTORALE : Sciences et Technologie de l Information, des Télécommunications et des Systèmes Institut d Electronique Fondamentale (IEF) Thales Research & Technology - France (TRT) DISCIPLINE : Physique - Systèmes Embarqués THÈSE DE DOCTORAT soutenance le 10/07/2014 par Jingyi BIN Controlling Execution Time Variability Using COTS for Safety Critical Systems Directeur de thèse : Alain MERIGOT Professeur (IEF, Université Paris-sud) Co-encadrant : Sylvain GIRBAL Ingénieur (TRT) Composition du jury : Président : Daniel ETIEMBLE Professeur (Université Paris-sud) Rapporteurs : Laurent PAUTET Professeur (LTCI, Télécom ParisTech) Michel AUGUIN Directeur de Recherche (Université de Nice) Examinateurs : Alain MERIGOT Professeur (IEF, Université Paris-sud) Claire PAGETTI Chargée de recherche (ONERA) Sylvain GIRBAL Ingénieur (TRT)
2 I would like to dedicate this thesis to my loving parents BIN Wenjin and XU Zhanchun and my loving husband WANG Weijia. Although my parents were not with me in France during my PhD study, their words of encouragement and push for tenacity kept me moving on. They are always my most trusted supporters. My dear husband was the one who has accompanied me everyday during these three years to share my happiness, anxiousness and depression. I feel so thankful to him for understanding me and helping me when I was losing the confidence. He is the witness throughout the process.
3 Acknowledgements I would like to express the deepest appreciation to my PhD adviser Professor Alain Mérigot who has given me constructive advices and guidances during my PhD study. In addition, he has shown a great patience and warm encouragements when my thesis did not move on smoothly. Without his constant help, I would not have finished my thesis. I would like to give the most sincere appreciation to my co-adviser Dr. Sylvain Girbal and co-workers Dr. Daniel Gracia Pérez and Dr. Arnaud Grassat in Thales Research & Technology (TRT). All of them has helped me greatly in the technique domain of research and shown me serious, proactive altitude of researchers. Additionally, Sylvain taught me other professional capabilities, like making a simple and efficient slides ppt and a convincing presentation, which are also helpful in the future work. I also would like to show my gratitude to the head of Embedded Systems Lab in TRT - Philippe BONNOT who has shown so much concern for my PhD progress and helped me a lot to adapt to the company s affaires. Besides, I would like to thank all the colleagues in Embedded Systems Lab in TRT. Without their help and concern, I would not have happily integrated into the group during these three years. Last, I would like to thank all the commitee members of my defense: Prof. Daniel ETIEMBLE who accepted our invitation as the commitee president, Prof. Michel AUGUIN and Prof. Laurent PAUTET who gave thoughtful and detailed comments as my thesis reviewers, Dr. Claire PAGETTI who provided encouraging and constructive feedback as the examiner. I appreciate all of them for their questions and remarks during my thesis defense.
4 Abstract While relying during the last decade on single-core Commercial Off- The-Shelf (COTS) architectures despite their inherent runtime variability, the safety critical industry is now considering a shift to multicore COTS in order to match the increasing performance requirement. However, the shift to multi-core COTS worsens the runtime variability issue due to the contention on shared hardware resources. Standard techniques to handle this variability such as resource over-provisioning cannot be applied to multi-cores as additional safety margins will offset most if not all the multi-core performance gains. A possible solution would be to capture the behavior of potential contention mechanisms on shared hardware resources relatively to each application co-running on the system. However, the features on contention mechanisms are usually very poorly documented. In this thesis, we introduce measurement techniques based on a set of dedicated stressing benchmarks and architecture hardware monitors to characterize (1) the architecture, by identifying the shared hardware resources and revealing their associated contention mechanisms. (2) the applications, by learning how they behave relatively to shared resources. Based on such information, we propose a technique to estimate the WCET of an application in a pre-determined co-running context by simulating the worst case contention on shared resources produced by the application s co-runners.
5 Contents Contents iv List of Figures viii List of Tables xii Listings xiii Introduction A Context 3 A.1 Context A.1.1 Safety-critical Domain A.1.2 Worst Case Execution Time (WCET) A.1.3 Evolution of Architectures A.1.4 Challenge of Using Multi-cores for Safety-critical Applications 7 A.1.5 Objectives A.2 State of the Art A.2.1 WCET Analysis in Single-cores A Static Analysis A Measurement-based Analysis A Commercial WCET Tools A.2.2 In-house Approach for the WCET Estimate A.2.3 COTS Approach for the WCET Estimate A.2.4 Performance Evaluation A.2.5 Conclusion A.3 Target Platform - QorIQ P A.3.1 Structure of the P A.3.2 Hardware Monitors in the e500mc Core A Performance Monitoring Example Using PMRs A.3.3 Hardware Monitors in the Platform P A P4080 Memory Map Overview A Local Address Map Example A The Use of Platform Hardware Monitors iv
6 CONTENTS A.3.4 P4080 Configurations A Cache Partitioning in the P A Compromise of Different Configurations A.3.5 Conclusion of Target Platform A.4 Software Environment - CodeWarrior A.4.1 Creating Projects in CodeWarrior A.4.2 Building Projects in CodeWarrior A.4.3 Debugging Projects in CodeWarrior A.5 Contribution B Quantifying Runtime Variability 48 B.1 Overview B.2 Applications under Study B.2.1 Applications from Mibench Suite B.2.2 Industrial Applications B.3 Resource Stressing Benchmarks B.4 Quantifying Runtime Variability B.4.1 Experimental Scenario B.4.2 Representing Runtime Variability Using Violin Plots B.4.3 Quantification Using Stressing Benchmarks C Architecture and Application Characterization 59 C.1 Characterization Methodology C.2 Measurement Techniques C.2.1 Hardware Monitors C.2.2 Stressing Benchmarks C.3 Experimental Setup C.3.1 Architecture Characterization C Identifying Shared Hardware Resources C Identifying Undisclosed Features and the Shared Resource Availability C Identifying the Optimal Configuration C.3.2 Application Characterization C Identifying Sensitive Shared Resources C Capturing the Shared Resource Usage C Determining Possible Co-running Applications using Resource Usages C.3.3 Design Space C.4 Implementation v
7 CONTENTS C.4.1 Measurement Framework C.4.2 Synchronization of Multi-cores Using the Interprocessor Interrupt (IPI) C Use of the Interprocessor Interrupt C Framework of Synchronizing Hardware Monitor Collections Using IPI C.4.3 Software Development Using CodeWarrior C Automating the Debugging Session for a Single Experiment within CodeWarrior C Automating Experiments outside CodeWarrior C Generation Process C Configuration Process C Execution Process C.5 Architecutre Characterization Results C.5.1 Identifying Shared Hardware Resources C.5.2 Identifying Undisclosed Features C.5.3 Identifying the Optimal Configuration C.5.4 Selecting the Adequate Mapping C.5.5 Quantify the Shared Resource Availability C.6 Application Characterization Results C.6.1 Optimal Number of Iterations to Capture Variability C.6.2 Identifying the Sensitivity to Shared Resources C.6.3 Capturing the Shared Resource Usage C.6.4 Determining Possible Co-running Applications using Resource Usages C.7 Conclusion D Alternative technique to Estimate the WCET 102 D.1 WCET Estimation Methodology D.2 Experimental Setup D.2.1 Experimental Scenario D.2.2 Measurement Techniques D Hardware Monitors D Stressing Benchmarks D.3 Global Signature D.3.1 Defining Global Signatures D.3.2 Using Global Signatures D.3.3 Limitation of Global Signatures D.4 Local Signature D.4.1 Defining and Collecting Local Signatures vi
8 CONTENTS D Collecting Local Signatures Using Fixed-Interval Timer (FIT) D Implementing the FIT Interrupt D Collecting Local Signatures D.4.2 Using Local Signatures D.5 Conclusion E Conclusion 127 E.1 Conclusion E.2 Future work F Appendix 133 Source Code of Stressing benchmark TCL Script of Automating Debugging Session Python Script of Automating Experiments References vii
9 List of Figures A.1.1 Estimation of the Worst-Case Execution Time, and the over-estimation problem A.1.2 Evolution of architecture and corresponding average time and WCET 6 A.1.3 Evolution of code size in space, avionic and automotive embedded systems A.2.1 Basic notions related to timing analysis. The lower curve represents a subset of measured executions. Its minimum and maximum are the minimal observed execution times and maximal observed execution times. The darker curve, an envelope of the former, represents the times of all executions. Its minimum and maximum are the best case and worst case execution times, abbreviated BCET and WCET A.2.2 Workflow of ait WCET analyzer A.3.1 Freescale P4080 block diagram A.3.2 The flowchart of using PMRs A.3.3 Local address map example A.4.1 Various pages that the CodeWarrior Project wizard displays. (a) Project name and location page, (b) Processor page, (c) Build settings page, (d) Launch configuration page, (e) Hardware page and (f) Trace configuration page A.4.2 The Debugger Shell view B.2.1 B.4.1 Distributions of main classes of instructions for each Mibench benchmark Example of violin plot to represent runtime distribution of two different applications viii
10 LIST OF FIGURES B.4.2 Runtime variability over 600 iterations of reference applications running (a) standalone, (b) concurrently with 2 benchmarks stressing the shared memory path, and (c) concurrently with 7 benchmarks stressing this resource C.1.1 Overview of the analysis process C.2.1 The cache access pattern with different STRIDE (one cache line=64bytes) 64 C.3.1 Selected configurations of P4080 (a) single controller non-partitioned, (b) single controller partitioned, (c) dual controller non-partitioned and (d) dual controller partitioned C.4.1 Examples of using doorbell. Top: single core to single core; Bottom: single core to multi-cores C.4.2 The framework of synchronizing hardware monitor collections C.4.3 The flowchart of automating debugging session of a single experiment within CodeWarrior C.4.4 The flowchart of automating experiments outside CodeWarrior C.5.1 The runtime variability of the core #1 while 8 co-running L1 data cache stressing benchmarks, 8 co-running L2 cache stressing benchmarks and 8 co-running L3 cache stressing benchmarks C.5.2 Runtime variability while mapping three instances of a stressing benchmark on different cores C.5.3 Three types of mapping under the 4-core cluster effect C.5.4 Runtime variability of one of the stressing benchmarks while varying the number of co-running instances C.5.5 Comparing the runtime variability of different balancing techniques. 87 C.5.6 Performance slowdown versus CoreNet load to identify CoreNet maximum bandwidth and saturation behavior. (a) Total CoreNet load while running 2 co-runners in the 1st cluster, (b) Total CoreNet load while running 3 co-runners in the 1st cluster, (c) Total CoreNet load while running 4 co-runners in the 1st cluster C.5.7 Performance slowdown versus CoreNet load while 4 co-runners balanced in two clusters to identify CoreNet topology. (a) Performance slowdown versus total CoreNet load, (b) Performance slowdown versus CoreNet load of Cluster C.5.8 Performance slowdown versus CoreNet load while 6 co-runners balanced in two clusters to identify CoreNet topology. (a) Performance slowdown versus total CoreNet load, (b) Performance slowdown versus CoreNet load of Cluster ix
11 LIST OF FIGURES C.5.9 Performance slowdown versus CoreNet load while 8 co-runners balanced in two clusters to identify CoreNet topology. (a) Performance slowdown versus total CoreNet load, (b) Performance slowdown versus CoreNet load of Cluster C.5.10 Runtime variability versus DDR controller accesses to identify each DDR controller maximum bandwidth C.6.1 Runtime variability collected with different number of iterations for application Adpcm C.6.2 The sensitivity of applications to (a) the CoreNet, (b) the DDR.. 97 C.6.3 Performance slowdown with difference number of co-running AD- PCM D.1.1 The upper bound estimation methodology D.3.1 Evaluating the global signatures against the performance slowdown induced by co-running with 3 instances of ADPCM, CRC32, FFT, SHA, patricia, susan, airborne radar, pedestrian detection versus their equivalent stressing benchmarks. Blue violin plots represent the runtime variability while co-running with stressing benchmarks. The red marks denote the maximum runtime while co-running with the original applications D.3.2 The example showing limitations of global signatures D.4.1 D.4.2 D.4.3 D.4.4 D.4.5 The mechanism of collecting local signatures using the FIT interrupt.115 Variation of the number of CoreNet transaction per cpu cycle during ADPCM full run using time slot (a) T, (b) T/2, (c) T/4 and (d) T/8. The black line denotes the mean value of the CoreNet transaction per cpu cycle Variation of the number of CoreNet transaction per cycle during the full run of (a) ADPCM, (b) CRC32, (c) FFT, (d) SHA, (e) Patricia, (f) Susan, (g) Airborne radar, (h) Pedestrian detection. The black line denotes the mean value of the collected metric Variation of the number of DDR read per cycle during the full run of (a) ADPCM, (b) CRC32, (c) FFT, (d) SHA, (e) Patricia, (f) Susan, (g) Airborne radar, (h) Pedestrian detection. The black line denotes the mean value of the collected metric Variation of the number of DDR write per cylce during the full run of (a) ADPCM, (b) CRC32, (c) FFT, (d) SHA, (e) Patricia, (f) Susan, (g) Airborne radar, (h) Pedestrian detection. The black line denotes the mean value of the collected metric x
12 LIST OF FIGURES D.4.6 Evaluating the local signatures against the performance slowdown induced by co-running with 3 instances of ADPCM, CRC32, FFT, SHA, patricia, susan, airborne radar, pedestrian detection versus their equivalent stressing benchmarks. Blue violin plots represent the runtime variability while co-running with stressing benchmarks. The red marks denote the maximum runtime while co-running with the original applications xi
13 List of Tables A.3.1 Freescale P4080 specifications A.3.2 e500mc Performance Monitor Registers A.3.3 Instructions for reading and writing the PMRs A.3.4 Event types A.3.5 Some performance monitor event selection of the e500mc A.3.6 Local Access Window Setting Example A.3.7 Four configurations of P A.4.1 Description of ecd.exe tool command build C.2.1 The main events used in the characterization C.3.1 Order of magnitude of the design space C.5.1 Worst execution times (in ms) for the monitored core while varing the number of running benchmarks C.6.1 CoreNet and DDR loads of standalone application D.3.1 Global signature of target applications D.3.2 Evaluating global signature accuracy in terms of over-margin value and upper-bounding ability D.4.1 Stressing benchmarks identified with local signatures D.4.2 Evaluating local signature accuracy in terms of over-margin value and over-bounding ability xii
14 Listings A.3.1 Example code of using PMRs A.3.2 CPC1 partitioning example C.2.1 General framework of memory-path stressing benchmarks C.4.1 Measurement framework using hardware monitors C.4.2 Example of framework of scenario generation process Example source code of stressing benchmark Example TCL script of automating debugging session Example Python script of automating experiments xiii
15 Introduction In recent years, most of the research in computer architectures has concentrated on delivering average-case performance, but high performance is not the only criterion for some type of applications. For example, hard real-time systems have to satisfy stringent timing constraints, which needs a reliable guarantee based on the Worst Case Execution Time (WCET) to make sure that required deadlines can be respected. Missing deadlines may cause huge damages and loss of lives in safety-critical systems, like the avionic, healthcare and so forth. As a consequence, the performance predictability is more required than high performance in the safety-critical domain. However, considering the increasing processing performance requirement in safety-critical industries, the next generation architectures have to guarantee the predictability while providing the sufficient average performance. Based on this point, multi-core Commercial Off-The-Shelf (COTS) architectures are considered as an appropriate candidate to provide a long-term answer to the increasing performance demand with an acceptable power consumption and weight. In addition, compared to in-house solutions which aim at proposing new predictable architectures, COTS solutions have lower Non-Recurring-Engineering (NRE) costs and shorter Time-To-Market (TTM). Despite above advantages of multi-core COTS architectures, they have a critical issue to the safety-critical domain - reduced predictability due to the contention of co-running applications on shared hardware resources within multiple cores, like the interconnect bus and the memory. There are thus many related on-going researches concentrating on estimating the performance variability by analysing the interference on concurrent shared resources. Since multi-core COTS are inherently very complex with some undisclosed contention mechanisms and the behavior of applications on shared resources is also a gray- or black-box to users, the variability estimation is very difficult in such circumstance. In the thesis, we proposed two approaches to overcome the difficulty for the overall objective - estimate the execution time variability of co-running safetycritical applications on a multi-core COTS architecture. We first presented a methodology characterizing the underlying architecture and applications to learn 1
16 LISTINGS undisclosed hardware features, especially the contention mechanisms on shared resources, and to master how an application behaves relatively to shared resources. Based on the characterized information, we then proposed an alternative technique to estimate the WCET of an application when it ran with a set of pre-determined applications by simulating the worst case contention on shared resources produced by co-runners. Compared to the state of the art using the measurement-based approach, our approach can provide a tighter estimation of the execution time upper bound. To clearly present the proposed approaches, the remaining thesis is organised as below: Part A - Context: Present the research context, the state of the art, our target architecture platform with the corresponding software environment and our contributions. Part B - Quantifying Runtime Variability: Demonstrate the variability that an application may experience while co-running with others due to the contention on shared hardware resources in multi-cores. To better understand the organized experiments, we also present our used applications and stressing benchmarks. Part C - Architecture and Application Characterization: Present first the characterization methodology, and second the measurement techniques, and third experimental setup with all the experiment designs and implementations, and fourthly the experimental results which are splitted into the architecture section and the application section. Part D - Alternative Technique of WCET: Present first the methodology, and second the measurement techniques, and third the two detailed estimation methods with experimental results. Part E - Conclusion: Conclude the achievements throughout the thesis and propose some constructive future work based on the estimation results. 2
17 Part A Context 3
18 Chapter A.1 Context A.1.1 Safety-critical Domain Safety-critical domains [6] such as the avionic, automotive, space, healthcare or robotic industry are characterized by stringent hard real-time constraints which are usually defined as a set of deadlines to respect. To ensure the correct functionality of a safety-critical application, we should make sure that such application can finish its execution before a required dealine. Missing a single deadline may have some catastrophic consequence (i.e. the air crash and the explosion in a nuclear station) on the user or the environment and should be avoided at all cost. Therefore, the time predictability is a major concern instead of delivering high average performance. In order to ensure that an critical application can finish execution before its required deadline, we usually determine its Worst Case Execution Time(WCET) which has to be guaranteed shorter than this deadline. A.1.2 Worst Case Execution Time (WCET) A real-time system consists of a number of tasks and each task typically shows a certain variation of execution times depending on the input data or different behavior of the environment. The WCET of a task is defined as its longest execution time. In most cases, it is quite impossible to exhaustively explore all possible execution times and thereby determine the exact WCET. Today, there are some practical methods to compute the WCET. In singlecore architectures, this WCET computation usually relies on analysis tools based on static program analysis tools [38, 27], detailed hardware model, as well as measurement techniques through execution or simulation [15]. However, these analysis techniques and tools are not currently able to provide an exact computa- 4
19 A.1. CONTEXT tion of the WCET, especially for multi-cores, only delivering an estimated upper bound, introducing some safety margins as depicted in Figure A.1.1. estimated WCET distribution exact WCET measured WCET over margin safety margin execution time Figure A.1.1: Estimation of the Worst-Case Execution Time, and the over-estimation problem In Figure A.1.1, the red curve is the real execution time distribution, and the blue one represents measured execution time distribution observed during experiments. As we explained above that it is quite impossible to exhaustively explore all possible execution times through experiments, the real distribution is thereby an envelope of the measured one. That s why the measured WCET is shorter than the real one in Figure A.1.1. In order to make a sure over-bound the real WCET, we add a safety margin to the measured WCET to get estimated WCET which is used to compare with a pre-determined deadline. A.1.3 Evolution of Architectures The evolution of architectures is mainly targeting the consumer electronic market that represents 97% of the overall market. As this consumer electronic market is mostly driven by best-effort performances, the design complexity has increased by integrating more and more high-performance techniques into architectures. Figure A.1.2 shows the evolution of architectures and how the average time and the WCET vary according to such evolution. A cache is a smaller, faster memory physically existing between the CPU and the memory to temporarily store the copy of data so that future request for that data can be served faster. Most modern CPUs have multiple independent levels of cache with small fast caches backed up by larger, slower caches to deal with a fundamental tradeoff between cache latency and hit rate. 5


20 A.1. CONTEXT Figure A.1.2: Evolution of architecture and corresponding average time and WCET A pipeline is a concept inspired from assembly line where a set of processing elements are connected in series so that they can be arranged in parallel. Pipelining doesn t decrease the processing time of a single instruction, but it can apply the parallelism among a series of instructions to increase the throughput of CPUs. Based on pipelining, a superscalar pipeline further increases the CPU throughput by executing more than one instruction during a clock cycle by simultaneously dispatching multiple instructions to redundant functional units on the processor. In addition, an out-of-order execution can make use of instruction cycles which would be wasted because of some types of operations with costly delay. For example, a processor can avoid being idle while data read from memory for the next instruction. From the early 2000s, considering higher-clock-speeds-produced exponential increasing thermal and power dissipation along with design complexity increases in single-cores, processor design trends shifted to multi-cores. The motivation of multi-cores design is the parallelism of processors that can address the issue 6
21 A.1. CONTEXT of power while maintaining performance where higher data throughput may be achieved with lower voltage and frequency. Thanks to above techniques, the average time decreased step by step in the blue right column of Figure A.1.2. Compared to the average time, the WCET time decreased much slower due to the runtime variability source brought by above design techniques, like cache misses, structural or data hazards during pipeline executions and the contention on shared hardware resources in multi-cores and so forth. A.1.4 Challenge of Using Multi-cores for Safetycritical Applications Figure A.1.3 shows the roadmap of code size in safety-critical industries where the code size of avionics increased from 10 4 magnitude in 1970s upto 10 7 in 2000s. This exponential increase of code size implicates the exponential needs in performance and functionalities [1, 6, 5] in the industries. To match the performance requirement, multi-cores have been considered as a potential platform candidate taking account of their increasing average performance. code size (insn) A300B Voyager A300FF A310 A320 Galileo A330 Pathfinder Cassini Mars Explorer A380 space avionic automotive x Figure A.1.3: systems Evolution of code size in space, avionic and automotive embedded However, as multi-cores are mostly driven by the consumer electronic market which aims at best-effort performances, the use of multi-cores will make safety- 7
22 A.1. CONTEXT critical industries to face more and more runtime variability issues while offering the increasing performance. Shared Resource Problem In nowaday multi-cores, each core has its private resources, like L1 D/I caches, but all the cores usually share the last level cache and the same main memory through a common interconnect bus. If users run several applications independently in different cores in a multicore, such applications have to share the same hardware resources, like the interconnect bus and the memory, even though they do not communicate the data with each other. For example, two applications want to access to the interconnect at the same time, the interconnect has to decide which one should go first. The interconnect arbitration may add a delay to both application s execution time. This delay thus results in the runtime variability. Despite all the improvements in the WCET estimation domain [19, 10] over the last decades, the over-estimation remained mostly constant as the predictability of the architecture decreased [38], thus making the use of WCET analysis tools difficult for real industrial programs running on multi-core architectures [18, 21]. Possible interference on shared hardware resources among co-running tasks significantly increases the complexity of timing analysis, forcing it to have a full knowledge of co-running tasks at software level, and detailed resource contention models at hardware level. Unfortunately, the underlying multi-core architecture and co-running applications both usually behave as a gray- or black-box to users. Undisclosed Hardware Feature Problem Embedded architectures come with detailed ISA and block diagram, but many aspects of the micro-architecture remain undisclosed such as the exact SoC network topology, contention, arbitration and prefetcher mechanisms. If such information is not necessary to guarantee correct functional behavior, it could have a significant impact on the timing behavior, that is as much important for safety-critical real-time systems. For instance, the Freescale QorIQ platform P4080 presented in chapter A.3 has no information about the exact behavior and the topology of its shared interconnect. Since the lack of the understanding about contention mechnisms of these important resources which can be potential performance bottlenecks in the context of co-running applications, we are hardly able to predict the performance variability derived from the contention on these shared resources. As a consequence, black-box multi-cores prevent users to accurately understand and predict co-running application behavior/performance on it. In addition to architectures, co-running applications are also black-box. We do not know how a standalone application behaves on shared hardware resources, not to mention the interference of co-running applications on shared resources. 8
23 A.1. CONTEXT A.1.5 Objectives Considering the challenge of using multi-cores to estimate the runtime variability of co-running safety-critical applications, we proposed two approaches in this thesis to: Characterize the underlying architecture to discover its undisclosed features, especially the shared resource related mechanisms and characterize target applications to observe their behavior on shared resources. Estimate the execution time upper bound of co-running applications based on the information of characterizations. 9
24 Chapter A.2 State of the Art In this chapter, we present first the WCET analysis on single-cores to introduce static and measurement based techniques computing upper bounds on execution times. Second, we present several representative proposals about designing new architectures with less runtime variability. Third, we detail some work on the WCET estimation using multi-core Commercial Off-The-Shelf (COTS) architectures. Last, we present different methods of performance evaluation which provides the behavior information of applications, allowing users to apply during the WCET estimation. A.2.1 WCET Analysis in Single-cores Hard real-time systems need to satisfy stringent timing constraints [1, 6, 5]. In general, upper bounds on the execution time are needed to show the satisfaction of these contraints. Figure A.2.1 proposed in [38] by Wilhelm et al. facilitate the understanding of timing analysis by depicting some real-time properties. A real-time system consists of a number of tasks and each task typically shows a certain variation of execution times depending on the input data or different behavior of the environment. The upper curve refers to the distribution of all the possible execution times of a task where the BCET (Best Case Execution Time) and the WCET (Worst Case Execution Time) are respectively the shortest execution time and the longest execution time. Most of the time, the BCET and WCET can not be accurately determined by exhausting all the possible executions. Therefore, the industries usually measure the end-to-end execution times of a task only for a partial set of all the possible executions to estimate the execution time bound. This measured execution time distribution is depicted by the lower curve in Figure A.2.1 where we have the minimal observed execution time which usually overestimates the BCET and the maximal observed execution time 10

25 A.2. STATE OF THE ART which usually underestimates the WCET. The upper and lower timing bounds are computed by the methods exploring all the possible executions. The upper bound provides the worst case guarantee to envelope the worst case performance. There are thus two criteria for timing analysis methods: Safety: Making sure that the WCET is greater than any possible execution time. Tightness: Keeping the real worst case execution time close to the upper bound. A large overestimation implies a great resource over-provision. Figure A.2.1: Basic notions related to timing analysis. The lower curve represents a subset of measured executions. Its minimum and maximum are the minimal observed execution times and maximal observed execution times. The darker curve, an envelope of the former, represents the times of all executions. Its minimum and maximum are the best case and worst case execution times, abbreviated BCET and WCET. To compute the WCET on single-core processors [38, 18], two main classes of methods have been adopted: the static analysis and the measurement-based analysis (dynamic timing analysis). A Static Analysis Static analysis methods [38] perform some analysis on the application code to extract possible control flow paths which are then combined with an abstract model of the system to compute the upper bound of all the execution times. This analysis do not rely on executing code on real hardware or on a simulator. Therefore, static methods are able to produce bounds allowing safe schedulability analysis of hard real-time systems. There are three key components in static methods: 11
26 A.2. STATE OF THE ART Control-flow Analysis The purpose of control-flow analysis is to determine all the possible execution paths of a task under analysis. The input of this analysis can be the task s control flow graph (CFG), call graph and some additional information such as maximum iterations of loops and so forth. We can finally obtain the actually feasible paths, including the conditional dependencies by eliminating infeasible and mutually exclusive paths. All the flow information performs as behavioral contraints of the task. There are different matured techniques to automate the flow analysis, like the pattern matching method, Bound-T method for loops analysis. The result of control-flow analysis is an annotated syntax tree for the structure- based approaches in the bound calculation, and a set of flow facts about the transitions of the control-flow graph. These flow facts are translated into a system of constraints for the methods using Implicit Path Enumeration (IPET) in the bound calculation. Processor-behavior Analysis The execution time of a task depends on the selected hardware behavior, like the pipeline structure, historical states of the cache and the arbitration mode of the bus, which can be derived from the abstract processor model, the memory hierarchy and the interconnect bus. The abstract processor model depends on the class of used processor. For some simple processors without the pipeline and caches, the timing construction is simple to abstract. Even for processors with a simple scalar pipeline, maybe a cache, the abstract also can be achieved by analyzing different hardware features separately, since there are no timing anomalies. However, for complex processors, some high performance enhancing techniques prevent to create the timing construction. For example, out-of-order executions produce timing anomalies making a cache hit resulting in a longer execution time than a cache miss, which can be hardly modeled. Most approaches use Data Flow Analysis, a static program-analysis technique, to get static knowledge about the contents of caches, the occupancy of functional units and processor queues, and of states of branch-prediction units. Bound Calculation The purpose of this phase is to compute an upper bound of all execution times of the whole task based on the flow and timing information derived in the previous phases. There are three main classes of methods proposed in literature: structure-based, path-based, and techniques using Implicit Path Enumeration (IPET). In the structure-based method, the annotated syntax tree derived in the flow analysis is traversed from bottom to up to 12
27 A.2. STATE OF THE ART first determine the execution time bound of each basic block and second combine all the computed bounds to deduct the upper bound of the whole task. The path-based calculation is to find the longest execution path based on the CFG with timing nodes derived in previous phases to determine the upper bound. In IPET, the flow of a program is modeled as an assignment of values to execution count variables. The values reflect the total number of executions of each node for an execution of the task. Each entity with a count variable also has a time variable giving the contribution of that part of the program to the total execution time. The upper bound is computed by maximizing the sum of products of count variables and time variables. Although the static analysis can offer a sound and safe bound, there are some limitations during the processor-behavior analysis. First, the contention on shared resources can not be accurately modeled. In addition, the knowledge of the hardware is usually limited for users. As a consequence, the measurement-based analysis is proposed to overcome it. A Measurement-based Analysis Measurement-based methods [38] replace the processor-behavior analysis in the static methods by performing measurements on the target hardware (or a detailed simulator) to estimate the WCET. This analysis usually measures the execution times of code segments, typically of CFG basic blocks. As in the static analysis, the measurement-based analysis also use the control flow analysis to find all possible paths and then use the bound calculation to combine the measured times of the code segments into an overall time bound. However, the measured execution times of basic blocks would be unsafe if only a subset of input data or initial states were considered. Unsafe execution times may produce an unsafe upper bound which can not be accepted by safety-critical industries but can be used to provide a picture of the actual variability of the execution time of the application. A Commercial WCET Tools ait ait WCET Analyzer is the first software tool of the well-known statical industiral tool AbsInt [9] designed in the IST project DAEDALUS according to the requirements of Airbus France for validating the timing behavior of critical avionic software, including the flight control software of the A380, the worlds largest passenger aircraft. The purpose of ait tool is to obtain upper bounds for the execution times of code snippets (tasks) in executable by statically analyzing a tasks intrinsic cache and pipeline behavior based on formal cache and pipeline models. 13
![A.2. STATE OF THE ART The workflow of ait is shown in Figure A.2.2 proposed in [38].](/docs-images/72/66934094/images/28-0.jpg "The analysis is composed of three main steps: 1) Reconstruct CFG from the given executable program and then translate the CFG into CRL (Control Flow Representation Language, a human-readable")
28 A.2. STATE OF THE ART The workflow of ait is shown in Figure A.2.2 proposed in [38]. The analysis is composed of three main steps: 1) Reconstruct CFG from the given executable program and then translate the CFG into CRL (Control Flow Representation Language, a human-readable intermediate format designed to simplify analysis and optimization at executable/assembly level) served as input of the next step. 2) Value analysis determines potential values in the processor registers for any possible program point. The analysis results are used to identify possible addresses of memory accesses for cache analysis, to determine infeasible paths resulting from conditions being true or false at any point of the analysed program, and to analyse loop bounds. The following cache analysis statically analyze the cache behavior of a program using a formal model examining sure hits and potential misses. The pipeline analysis models the prpcessor s pipeline behavior based on the current state of the pipeline, the resources in use, the contents in prefetch queues and the results obtained during cache analysis. It aims at finding the WCET estimate of each basic block of the program. 3) Bound calculation based on the path analysis determines the worst-case execution path of the program relying on the timing information of each basic block. Figure A.2.2: Workflow of ait WCET analyzer. ait includes automatic analysis to determine the targets of indirect calls and branches and to determine the upper bounds of iterations of loops. However, this 14
29 A.2. STATE OF THE ART analysis does not work in all cases. If it fails, the users have to supply annotations. In addition, ait relies on the standard calling convention that may not be respected by some code. In this case, the users have to provide additional annotations describing control flow properties of the program. RapiTime RapiTime [19, 38] is a measurement-based tool aiming at medium to large real-time embedded systems on advanced processors. It targets the automotive electronics, avionics and telecommunications industries. RapiTime derives timing information of each basic block of the program from the measurements, and then combines all the measurement results according to the structure of the program to estimate the longest path of the program. RapiTime not only computes the upper bound of the program as a single value but also gets the whole probability distribution of the execution time of the longest path in the program. The input of RapiTime can be either source code files or binary code files, and the users have to provide test data for measurements. Compared to the static tools, RapiTime does not rely on the processor model, so it can model any processing unit based on its measurement results. However, the limitation is also put on the measurement. It has to extract the execution traces of basic blocks in the running system using code instrumentations or other measurement mechanisms. Regarding source code level, RapiTime cannot analyse programs with recursions and with non-statically analyzable function pointers. SymTA/P (SYMbolic Timing Analysis for Processes) SymTA/P [16, 38] is a hybrid approach combining the static and measurement-based analysis to obtain lower and upper execution time bounds of C programs running on microcontrollers. The key concept of SymTA/P is to combine platform independent path analysis on source code level and platform dependent measurement methodology on object code level using an actual target architecture. SymTA/P uses symbolic analysis on the abstract syndax tree to identify single feasible paths (SFP). SFP is a sequence of basic blocks where the execution sequence is invariant to input data. The result of the analysis is a CFG with nodes containing SFPs or basic blocks that are part of a multiple feasible paths. In the second step, the execution time of each node is estimated on an off-the-shelf processor simulator or an evaluation board by instrumenting C code with measurement points that mark the beginning and the end of each node. However, such measurement can not ensure a safe initial state in all cases, so an additional time delay is added to cover a potential underestimation during such measurement by many techniques. The longest and the shortest paths in the CFG are found by IPET introduced in Section A
30 A.2. STATE OF THE ART However, data-dependent execution times of single instructions are not explicitly considered. The input data has to cover the worst case regarding datadependent instruction execution time, which means that the input data has to generate complete branch coverage. In addition, there is no sub-function analysis during cache-analysis. Each function is analysed seperately (assuming an empty cache at function start), and there is no interference assumed when a function is called. A.2.2 In-house Approach for the WCET Estimate As we stated in Chapter A.1, multi-core architectures provide high average performance and are increasingly considered as execution platforms for embedded systems in the safety-critical domain. However, the performance variability, namely the reduced predictability is a critical issue that should be avoided in the safetycritical context. To increase the performance predictability, two different approaches have been advocated. The first is the in-house approach and the second is the COTS approach. We present, in this section, some related work about the former and in the next section about the latter. With the advent of multi-core architectures the WCET analysis methods for single-cores are no longer able to estimate WCETs due to the shared hardware resources and mechanisms (network-on-chip, memory coherency,... ) which add too much performance uncertainty. In order to provide tight WCETs the research community has mainly focused on in-house approach which aims at proposing new and more predictable multi-core architectures implementing proper isolation mechanisms to separate the use of shared resources and provide a adequate level of determinism, as in multiple european and american projects Predator [26], Merasa [33] / parmerasa [34] and Prets [7]. The Merasa project aims to achieve a breakthrough in hardware design, hard real-time support in system software and the WCET analysis tools for embedded multicore processors. The project focuses on developing multicore processor designs for hard real-time embedded systems and techniques to gurantee the analyzability and timing predictability of every feature provided by the processor. Intertask interferences in mainstream multicores provoke the main difficulty in analyzing timing behaviour, which renders multicores unusable in safety-related real-time embedded systems. In this context, MERASA architecture is designed in [33] to make analysis of each task independent from coscheduled tasks and allow safe and tight worst-case execution time (WCET) estimation. The general MERASA multicore architecture is based on SMT cores and is capable of running both hard real-time (HRT) and non hard real-time (NHRT) threads. However, 16
31 A.2. STATE OF THE ART HRT threads receive the highest priority in the fetch stage, the real-time issue stage, and the intracore real-time arbiter. Moreover, each HRT task has access to its local dynamic instruction scratchpad (D-ISP) and data scratchpad (DSP), private instruction, and data cache partitions. Thanks to these tailors, HRT threads are isolated from NHRT threads. In addition, analyzable real-time memory controller (AMC) is proposed to minimize the impact of memory intertask interferences on the WCET. With respect to WCET techniques and tools, the MERASA project uses a static WCET tool and a measurement-based WCET tool to evaluate impact of intertask inference on WCET estimation. The philosophy of the Prets project [7] is to propose very predictable architectures whose temporal behavior is as easily controlled as their logical function. The timing control research thus spans all abstraction layers in computing, including programming languages, the ISA level, the memory hierarchy, the interconnect architecture, the DRAM design and so forth. B.Lickly et al. [20] focus on integrating timing instructions to a thread-interleaved pipeline and a predictable memory system. With respect to pipeline, based on SPARC v8 ISA, PRET architecture implements a six-stage thread-interleaved pipeline that supports six independent hardware threads. Each thread has its own register file, local on-chip memory (scratchpad memories (SPMs)) and assigned off-chip memory. The thread controller schedules the threads according to a round-robin policy. This pipeline eliminates dependencies among instructions in the same thread. However, structural hazards do exist, which will stall the pipeline. To avoid to stall the whole pipeline, a replay mechanism is used by repeatedly replaying the stalling thread until it can continue. Moreover, in order to provide precise timing control to software, a deadline instruction is offered to allow the programmer to set a lower bound deadline on the execution time of a segment of code through accessing cycle-accurate timers. With respect to memory system, PRET replaces caches with SPMs which are managed by software through direct memory access (DMA) transfers, thus avoiding unpredictability of hardware replacement policies. In order to isolate off-chip memory access among each thread, a memory wheel is provided to determine which thread is allowed to access memory through a fixed round robin schedule, which finally ensure a predictable timing. Although all above timing control techniques are able to ensure the real-time constraints of the design with ease, the timing constraints have to be calculated by hand whenever the code is optimized or modified. The lack of the automated tool for calculating and verifying timing constraints prevent the realistic programming for this PRET. In [3], the Prets authors discuss techniques of temporal isolation on multiprocessing architectures at the microarchitecture level, the memory architecture, the network-on-chip (NoC), and the instruction-set architecture (ISA). At the microarchitecture level, temporal interference can be removed by assigning a 17
32 A.2. STATE OF THE ART top priority to hard real-time threads or using virtual multiprocessor or threadinterleaved pipeline. At the memory level, partitioned caches can be applied to avoid the interference in the cache by pre-allocating a fixed cache region to each core or application. In addition, scratchpad memories (SPMs) are an alternative to caches. SPMs provide constant latency access times and the contents are under software control. For the next lower level of the memory, dynamic random access memory (DRAM) controller allocates private banks to different clients. At the NoC level, there are two approaches: one is time-division multiple-access (TDMA), and the other is priority-based mechanism. At the ISA level, some new instructions with temporal semantics considered as ISA extensions are proposed to enable control over timing. Reineke et al. [29] propose a novel dynamic random access memory (PRET DRAM) controller is proposed in which the DRAM device is considered as multiple resources shared between one or more clients individually. The physical address space is partitioned following the internal structure of the DRAM device, ie., its ranks and banks. The DRAM controller is split into a backend and a frontend. The frontend connects to the processor, and the backend issues commands to the independent resources in DRAM module with a periodic and pipelined fashion. Therefore, a bank parallelism is realized and interference amongst the resources is removed. The Proartis project [4] proposes an interesting approach for the WCET problem on multi-cores by proposing architecture designs with randomness. Thanks to the randomness properties of such designs probabilistic approaches can be applied to compute accurate WCETs. The advantage of these in-house approaches is that they can address temporal and spatial isolation directly, which makes few or no modification in terms of the software, like the operating system. However, hardware modifications especially complex modifications lead to high custom silicon cost and a long time-to-market (TTM). From my best knowledge, there is no MERASA or PRET architecture commercialised in the market. Furthermore, for these in-house architectures, the high predictability is achieved at the cost of their average performance, which makes them not able to sustain the increasing performance requirement shown in Figure A.1.3. A.2.3 COTS Approach for the WCET Estimate COTS architectures refer to the commercial components that we can directly get in the market. Therefore, compared to in-house solutions, COTS architectures reduce both the non-recurring engineering costs (NRE) and the TTM [2]. Considering these advantages and multi-core COTS s high average performance 18
33 A.2. STATE OF THE ART safety-critical industries have been seeking the methods to achieving the worst case timing analysis based on multi-core COTS. The critical issue of using multicore COTS is reduced predictability resulting from the interference among corunning appications on shared resources. The performance in the context of co-running applications is mostly slown down either by concurrent accesses to a shared bus/memory or by changed states of shared caches. Pellizzoni et al. [24] propose a methodology computing upper bounds to task delay due to memory contention. The methodology adopts task model based on superblocks. Each task is composed of a sequence of superblocks characterised by a cache profile C i ={µ min i, µ max i, exec L i, exec U i }. µ min i, µ max i are the minimum and maximum number of access requests to the main memory, and exec L i, exec U i are lower and upper bounds on computation time for superblock s i. To bound the amount of concurrently requested access time for a given superblock, all possible interleavings of its bus accesses with concurrent access sequences have to be taken into account. As this may be computationally infeasible, an arrival curve α i (t) is introduced in the article based on the cache profiles of all the tasks executed on the processing unit i (PE i ). α i (t) bounds the maximal amount of access time required by concurrent tasks running on PE i to perform operations in the main memory in a time interval t. Arrival curves are then combined with a representation of cache behavior of the task under analysis to generate a delay bound. The principle of delay analysis is to construct the worst-case scenario which is the scenario that maximizes the latency of a request based on the memory arbitration scheme. For round-robin arbitration, the worst-case scenario is that all other processing units are allowed to perform one access before the PE i is allowed to do so. In First Come First Served (FCFS) arbitration, an interference bound has to additionally take into account the maximum number of access requests that can be released at the same time by concurrent processing units if this number is greater than one. Pellizzoni et al. finally give a delay bound equation that was evaluated through an extensive simulations to derive the delay bounds. In addition to [24], superblocks are also applied in [30, 23] to analyse the delay bounds due to the contention on shared bandwidth resources. However, this approach requires the bounds on the amount of computation time and the access times and delays to be compositional, which means that the approach should rely on timing compositional hardware architectures [39]. Unfortunately, many existing hardware architectures exhibit domino effects and timing anomalies and are thus out of the scope of such an approach. Compared to the bandwidth resources, like the interconnect bus, which bring the runtime delay via their arbitration mechanisms when different applications request them at the same time, there is another type of shared resources, like caches. When one application changes the state of a resource, another application using that resource will suffer from a slowdown. Unfortunately, the behavior of 19
34 A.2. STATE OF THE ART current shared caches is hard to predict statically. Cache accesses from different cores are typically served on a first-come first-served basis. Their interleaving thus depends on the relative execution speeds of the applications running on these cores, which depend on their cache performance, which in turn depends on the cache state. This cyclic dependency between the interleaving of the accesses and the cache state makes precise and efficient analysis hard or even impossible in general. Chi Xu et al. in [40] propose CAMP, a fast and accurate shared cache aware performance model for multi-core processors. CAMP estimates the performace degradation due to cache contention of processes running on chip multiprocessors (CMPs). The model uses non-linear equilibrium equations in a least-recentlyused (LRU) and pseudo-lru last level cache, taking into account process reuse distance histograms, cache access frequencies and miss rate aware performance degradation. CAMP models both cache miss rate and performance degradation as functions of process effective cache size, which is in turn a function of the memory access behavior of other processes sharing the cache. CAMP can be used to accurately predict the effective cache sizes of processes running simultaneously on CMPs, allowing the performance prediction. Fedorova et al. [8] describe a new operating system scheduling algorithm that improves performance isolation on chip multiprocessors (CMP). This algorithm is a cache-fair algorithm ensuring that the application runs as quickly as it would under fair cache allocation, regardless of how the cache is actually allocated. Zhao et al. [41] presented an approach to dynamic scheduling that is based on their CacheScouts monitoring architecture. This architecture provides hardware performance counters for shared caches that can detect how much cache space individual tasks use, and how much sharing and contention there is between individual tasks. An approach to static scheduling in a hard real-time context is presented by Guan et al. [13]. They extend the classical real-time scheduling problem by associating with each task a required cache partition size. They propose an associated scheduling algorithm, Cache-Aware Non-preemptive Fixed Priority Scheduling, FPCA and a linear programming formulation that determines whether a given task set is schedulable under FPCA. For higher efficiency, they also introduce a more efficient heuristic schedulability test that may reject schedulable task sets. All these above proposals are static analysis of shared resources to try to provide a sound and safe bound in a co-running context. In addition to them, there are measurement-based approaches that aim at quantifying the slowdown a task experiences when different tasks are executed in parallel. In a single-core setting, a measurement-based estimate is obtained by adding a safety-margin to the longest observed execution time. However, it is not possible to directly extend such measurement-based timing analysis from the single-core to the multi-core 20
35 A.2. STATE OF THE ART setting because of increased variability of the runtime. Radojković et al. [28] propose benchmarks that stress a variety of possibly shared resources, including functional units, the memory hierarchy, especially the caches at different levels and the bandwidth to the main memory. These benchmarks are called resource stressing benchmarks which aim at maximizing the load on a resource or a set of resources. The interference a resource stressing benchmark causes on a certain resource is meant to be an upper bound to the interference any real co-runner could cause. Therefore the slowdown a program experiences due to interferences on a certain resource when co-running with a resource stressing benchmark bounds the slowdown that could occur with respect to this resource in any real workload. Resource stressing benchmarks are thus considered as a good metric to obtain a workload-independent estimate of the performance slowdown. The authors applied resource stressing benchmarks in multithreaded processors to 1) estimate the upper limit of a performance slowdown due to different shared-resource contention for simultaneously-running tasks. 2) quantify time-critical applications sensitivity to different shared-resource contention. 3) determine if a given multithreaded processor is a good candidate to meet the required timing contraints. Experiments are carried out on three architectures with different shared resources in order to show the varying timing predictability, depending on the degree of resource sharing. One architecture Atom Z530 offers hyperthreading, and the resources from the front-end of the pipeline to the memory bandwidth are shared. For the second architecture Pentium D, the only shared resource is the bandwidth to the main memory between two cores whereas for the third architecture Core2Quad, the L2 cache is shared as well. In order to show the variance of the possible slowdown, measurements are taken for three different scenarios. In the first scenario, only resource stressing benchmarks are executed concurrently to estimate the worst possible slowdown independently of the application. In the other cases, the application is either executed with another co-running application or with different co-running resource-stressing benchmarks. The experimental results of the first scenario reveal that the techniques like hyperthreading are impractical for hard real-time applications due to a possible significant slowdown caused by the contention on all the shared resources. The measurements for the different scenarios reveal that the slowdown due to co-running resource stressing benchmarks drastically exceeds the slowdown measured in workloads only consisting of real applications. This implies that the workload- independent slowdown determined with co-running resource stressing benchmarks yields a very overestimated upper bound to the slowdown in any real workload. Therefore, the analysis result might be not very useful in practice. Another measurement-based approach proposed by Nowotsch and Paulitsch [22] quantifies the impact of integration of multiple independent applications 21
36 A.2. STATE OF THE ART onto multi-core platforms using resource stressing benchmarks. Measurements are carried out on the Freescale P4080 multi-core processor, and access two key parameters: influences introduced by multiple cores concurrently accessing network and memory and additional overhead introduced by coherency mechanisms. Several scenarios are considered: 1. configure L3 caches to SRAM in order to compare accesses to SRAM and DDR memory when coherency flag in turned off 2. compare accesses to SRAM and DDR memory in case of static coherency enabled (i.e. only checks whether memory blocks in the local caches are coherent) 3. compare accesses to SRAM and DDR memory in case of dynamic coherency enabled (i.e. not only checks, but also explicit memory operations enforcing coherency) The outcomes show that the time for concurrent accesses to DDR memory scales very badly with the number of concurrent cores, in contrast to SRAM. Concerning the different cache coherency settings, the results show that even without coherent accesses, static coherency induces an overhead in execution time that should be considered in timing analysis. The impact of dynamic coherency strongly depends on the type of memory operation (read or write). In case of read with concurrent read, dynamic coherency does not cause any slowdown compared to static coherency. For write operations, the execution is slown down significantly in case of dynamic coherency, regardless of the concurrent operation. This can be explained by the fact that after a write operation, coherency actions are required to keep the memory hierarchy consistent. Throughout all the evaluation results, the article points out that multi-core COTS may be used for safety-critical applications, but the WCET may be a factor of the number of cores being used. The static approach is always highly complex due to the large number of potential hardware features to be considered during modeling. For complex architectures, several simplifications and unrealistic assumptions have to be set in order to derive a safe modeling, which hinders its widespread use in industries. The measurement-based approach is a good complement to the static approach by searching the worst case interference of co-running tasks to estimate the upper bound. However, compared to the static approach, there is a lack of formal proofs to support the measurement-based approach. In addition, measured execution times might not be reproduced in the next measurement because of the variability. Therefore, the measurement usually has to be repeated to cover the worst-case scenario. 22
37 A.2. STATE OF THE ART A.2.4 Performance Evaluation The purpose of the performance evaluation is to monitor how an application behaves on an architecture. This monitoring information allows us to identify possible bottlenecks of performance which guide us to maximize the performance through various optimizations. In addition, it is also useful for characterizing workloads, allowing us to quantify hardware resource utilization at application level and providing some clues to better understand the runtime variability. There are broadly two distinguished profiling techniques: sampling and instrumentation. Sampling Techniques In the sampling approach, the measurement tool stops the target application in fixed intervals or at specific events and samples the program counter as the application progresses to measure performance aspects statistically by triggering relevant interrupts. At this point, additional information about hardware and program state can also be recorded. By unwinding the stack-frames, the tool is then able to roughly pinpoint the corresponding source position from the debug information. The SimPoint tool [31, 25] is an automatic technique relying on sampling techniques to find and exploit program phase behavior to guide program analysis, optimization and simulation. During the phase analysis, different metrics of the program are captured within each fixed interval or variable-sized interval to classify the intervals within the programs execution that have similar behavior/- metrics as the same phase. Instrumentation Techniques In the instrumentation approach, the target program is augmented with measurement points, called probes which are mostly installed at all entries and exists of a given function, to gather the necessary information. For example, the inserted hooks allow the profiler to maintain a shadow stack at runtime. The stack stores the time at which a function is entered, which is subtracted from the time when the function returns. The accumulated differences precisely capture how much time was spent in each function. There are several well-known program profiling tool based on the instrumentation. Valgrind [35] provides a generic infrastructure for supervising the execution of programs by providing a way to instrument programs in very precise ways, making it relatively easy to support activities such as dynamic error detection and profiling. The most used tool in Valgrind is memcheck which inserts extra instrumentation code around almost all instructions, which keeps track of the memory state, lile its validity and addressability. In addition, Joint Test Action Group (JTAG) which is propably the most widely used debug interface applies 23
38 A.2. STATE OF THE ART the processor instrumentation to examine and modify the internal and external states of a system s registers, memory and I/O space. Both sampling and instrumentation are in principle capable of gathering the same information, though each of them has proper advantages and drawbacks. We can easily control measurement dilation under sampling by adjusting the sampling frequency. However, as sampling is performed outside of the scope of the observed application, important events occurring in between sampling points may potentially be missed. In contrast, the instrumentation approach where an event will always be observed provides deterministic and reproducible results, but automatic placement of event-probes is difficult to control and has tendencies to fail for current C++ codes due to immense overhead. In the thesis, we propose methodologies characterizing architecture and applications, and computing the runtime upper bound based on the performance evaluation using hardware monitors. Hardware monitors are essentially a group of special purpose registers implemented in most recent architectures include some special on-chip hardware to count hardware related activities. The collected hardware monitors information provides performance information [32] on the applications, the operating system, and the underlying hardware behavior. The special purpose registers available from the micro-architecture instructionset are confined to count on-die related events. In some architectures, it would imply not being able to gather some events related to the last cache level, as well as the interconnect, and the DDR controller. As contention on these resources can actually be the bottleneck of the architecture, we cannot afford not collecting this information. However for recent embedded architectures, the integrators are proposing some monitoring facilities at platform level. These monitoring features are most of the time dedicated to debugging through proprietary hardware probes but allow to count events at all the platform levels, including the number of DRAM refresh, page switch, and so on. This ability is a proof of the existence of some additional (most of the time undocumented) platform-level hardware counters that could be exploited through some reverse-engineering. A.2.5 Conclusion There are two complementary timing analysis methods for single-cores: the static and the measurement-based method. Although the static analysis is able to provide a sound and safe execution time bound, the processor-behavior analysis can not be achieved for some complex processors with out-of-order executions which 24
39 A.2. STATE OF THE ART produce timing anomalies. In addition, the static analysis supposes that it has a complete and detailed behavior description of the analysed architecture. Unfortunately, this is not the case of COTS architectures which typically only provide a high level description. The measurement-based analysis is an alternative method to estimate the WCET by replacing the processor-behavior analysis with performing measurements on the target hardware or a detailed simulator. However, the measurement-based analysis would offer an unsafe bound if only a subset of execution paths and states were considered. Multi-core architectures are increasingly considered as execution platforms for safety-critical systems since they offer a good energy-performance tradeoff. However, they produce the increased performance variability that should be analysed and controlled in the safety-critical domain. Considering the increasing complexity of timing analysis caused by the interference on shared resources in multi-cores, the static and measurement-based analysis for single-cores are no longer usable for multi-cores. For multi-cores, both approaches are not scalabale: the static analysis has to face a state explosion which is impossible to be all covered during modeling, and the measurement-based analysis has to suffer sequential consistency problems. To achieve timing analysis in multi-cores, two approaches have been advocated: the in-house approach and the COTS approach. For the in-house approach, the projects (Predator [26], Merasa [33] / parmerasa [34] and Prets [7]) propose new architectures dealing with the intertask interferences on WCET to finally reduce the performance variability. The advantage of the approach is that it directly addresses temporal and spatial isolation in hardwares, and frequently requires few or no modifications to softwares. However, the hardware modifications can make the new architecture prohibitively costly and long TTM. In contrast to the in-house approach, the COTS approach has lower NRE cost and shorter TTM while leaving the timing analysis difficult due to its complex hardware behavior. The timing analysis using COTS can be splitted into two categories: the static analysis and the measurement-based analysis. The static analysis concentrates on deriving analytic and formal models on accessing shared resources in the co-running context, which provides an upper bound capable of proof. The measurement-based analysis applies resource stressing benchmarks to quantify the possible maximum co-running performance slowdown which is used to bound the execution time of real co-running applications. The measurementbased analysis is, at the most time, too pessimist. The slowdown an application experiences with co-running resource-stressing benchmarks is significantly higher compared to with co-running real applications [28]. Compared to the static analysis, the measurement-based analysis is more straitforward and can be always evaluated through a series of experiments directly in hardware platforms, while the static analysis is always highly complex 25
40 A.2. STATE OF THE ART due to the large number of potential features to be considered and thus often tested via simulations with several unrealistic assumptions. In this thesis, we propose a measurement-based approach to estimate the runtime variability of co-running safety-critical applications on a COTS multicore architecture. The contribution is described in Chapter A.5. 26
41 Chapter A.3 Target Platform - QorIQ P4080 The selection of processors for future safety-critical applications depends on some essential factors related to the manufacturer and the processor design. For example, avionic industries select a manufacturer which has experience in the avionic domain and is involved in the certification process. In addition, the manufacturer is expected to have a sufficient life expectancy and ensure a long-term support, including willing to exchange the information related to the processor design, debug and test. In the side of the processor design, the industries will evaluate the desired candidate according to a series of technical critiria aiming at identifying undesirable features and correlated mitigation means. According to above selection rules, the Freescale s QorIQ P4080 is a potential candidate of the next generation processor for future avionic applications, because Freescale is a long-term provider in the avionic domain and it launched a project MCFA (Multi-Core For Avionics) collaborating with avionics manufacturers to facilitate their certification of systems using multicore processors. In this context, airbus keeps a long term relationship with Freescale about PowerPC based systems. Moreover, predecessors of the QorIQ line have been used in multiple aircraft applications. Therefore, we selected the P4080 as the target platform to evaluate the experiments, and we present the P4080 structure and features in this chapter. A.3.1 Structure of the P4080 The P4080 Development System [12] is the 8-core Freescale s QorIQ platform. It belongs to the P4 series which is a high performance networking platform, designed for backbone networking and enterprise level switching and routing. As shown in Figure A.3.1, the system is composed of eight e500mc PowerPC cores coupled with private L1 data+instruction caches and a private L2 unified cache. 27
42 A.3. TARGET PLATFORM - QORIQ P4080 A shared memory architecture including two banks of L3 cache and two associated DDR controllers is built around the CoreNet fabric. Additionally, several different peripherals are implemented around the CoreNet fabric. The CoreNet fabric is a key design component of the QorIQ P4 platform. It manages full coherency of the caches and provides scalable on-chip, point-to-point connectivity supporting concurrent traffic to and from multiple resources connected to the fabric, eliminating single-point bottlenecks for non-competing resources. This eliminates bus contention and latency issues associated with scaling shared bus/shared memory architectures that are common in other multi-core approaches. We concentrated on the e500mc cores and the shared memory architecture P4080 Features without using other perpherals. The features of the e500mc and the shared 1.1 Block Diagram memory are depicted in Table A.3.1. Figure 1 shows the major functional units within the P4080. eopenpic PreBoot Loader Security Monitor Internal BootROM Power Mgmt SD/MMC SPI 2x DUART 4x I 2 C 2x USB 2.0/ULPI Clocks/Reset GPIO CCSR QorIQ P4080 elbc Test Port/ SAP PAMU Security 4.0 Pattern Match Engine 2.0 Queue Mgr Buffer Mgr 128-kbyte Backside L2 Cache Power Architecture e500mc Core 32 D-Cache Frame Manager 10GE 1GE 1GE 32-kbyte I-Cache 1GE 1GE CoreNet Coherency Fabric Frame Manager 1GE 1GE 10GE 1GE 1GE 1024-kbyte Frontside L3 Cache 1024-kbyte Frontside L3 Cache PAMU PAMU PAMU PAMU Parse, Classify, Distribute Buffer Parse, Classify, Distribute Buffer RapidIO Message Unit (RMU) PCIe 18-Lane 5-GHz SERDES 64-bit DDR2/DDR3 Memory Controller 64-bit DDR2/DDR3 Memory Controller Peripheral Access Mgmt Unit 2x DMA PCIe srio srio PCIe Real Time Debug Watchpoint Cross Trigger Perf Monitor Aurora CoreNet Trace 1.2 Operational Parameters Figure A.3.1: Freescale P4080 block diagram Figure 1. P4080 Preliminary Block Diagram Top speed bin e500mc core frequency of 1.5 GHz at 1.0 V Core supply voltage options: All cores 1.0-V Two cores up to 1.0-V to achieve higher frequencies Up to 6 cores down to.9-v for lower power consumption at lower frequencies Maximum memory data rates of 1066 MHz (DDR2), 1600 MHz (DDR3) DDR: 1.8-V for DDR2, 1.5-V for DDR3 (conforms to JEDEC standard) Local bus: 3.3-, 2.5-, or 1.8-V Operating junction temperature range is 0 105C. Max Power dissipation target <30 W: 8 x 1.5 GHz, 1.0-V operation Package: 1295-pin FC-PBGA (flip-chip plastic ball grid array) A.3.2 Hardware Monitors in the e500mc Core Each e500mc PowerPC core provides a special set of registers for the performance monitoring called Performance Monitor Registers (PMR). The performance monitor provides the ability to count predefined core related events, for example cache misses, mispredicted branches, or the number of cycles an exe- 28 QorIQ P4080 Communications Processor Product Brief, Rev. 1
43 A.3. TARGET PLATFORM - QORIQ P4080 Core Pipeline Distributed L1 caches Distributed L2 cache Performance monitors Shared L3 cache (x2) Memory controller Interconnect 8 Power Architecture e500mc at 1.5GHz 7-stage pipeline, superscalar, out-of-order 32kb, 8-way associative, 64-byte line, PLRU 128kb, 8-way associative, 64-byte line, PLRU 162 available events 4 performance monitor counters per core 1MB, 32-way associative, 64-byte line, PLRU Two DDR memory controllers CoreNet Coherency Fabric Table A.3.1: Freescale P4080 specifications cution unit stalls. According to the manual of e500mc, there are totally 162 available events. Each core has ability to collect four of these 162 events at a given time. In the P4080, the PMRs can be classified in three types: The Performance Monitor Counter registers (PMC) which are used to count selected software-selectable events. The Performance Monitor Global Control register (PMGC) which controls the counting of performance monitor events. It is mainly used to freeze/unfreeze all the counters. The Performance Monitor Local Control registers (PMLC) which controls each individual performance monitor counter, including freeze/unfreeze each counter, select desired events for each counter, enable/disable the performance monitor interrupt for each counter and etc. Each PMR has its own PMR number (PMRn) and comes in two versions, one that is read- and writable in the supervisor mode and one that is only readable from the user mode. Table A.3.2 lists all the PMRs and their PMRn in the supervior mode and the user mode. The first step to use PMRs for monitoring is to configure the PMGC0 and PMLCs to control the performance counters and to select desired events. However, writing to the PMGC0 and PMLCs is only legal in the supervisor mode, which means that we can realise the write operations either on the bareboard of the P4080 or using a kernel module on the Linux environment implemented on the P4080. Considering that using kernel modules is more complicated and may produce unexpected overhead during monitoring, we finally used the bareboard method to avoid these drawbacks. In order to interact with the PMRs, the P4080 provides a pair of assembly instructions mtpmr/mfpmr to move to and from the PMRs. The instructions are shown in Table A
44 A.3. TARGET PLATFORM - QORIQ P4080 Name Supervisor User Abbreviation PMRn Abbreviation PMRn Performance monitor counter 0 PMC0 16 UPMC0 0 Performance monitor counter 1 PMC1 17 UPMC1 1 Performance monitor counter 2 PMC2 18 UPMC2 2 Performance monitor counter 3 PMC3 19 UPMC3 3 Performance monitor local control a0 PMLCa0 144 UPMLCa0 128 Performance monitor local control a1 PMLCa1 145 UPMLCa1 129 Performance monitor local control a2 PMLCa2 146 UPMLCa2 130 Performance monitor local control a3 PMLCa3 147 UPMLCa3 131 Performance monitor local control b0 PMLCb0 272 UPMLCb0 256 Performance monitor local control b1 PMLCb1 273 UPMLCb1 257 Performance monitor local control b2 PMLCb2 274 UPMLCb2 258 Performance monitor local control b3 PMLCb3 275 UPMLCb3 259 Performance monitor globam control 0 PMGC0 400 UPMGC0 384 Table A.3.2: e500mc Performance Monitor Registers Name Mnemonics Syntax Move From Performance Monitor Register mfpmr rd, PMRn Move To Performance Monitor Register mtpmr PMRn, rs Table A.3.3: Instructions for reading and writing the PMRs Event selection is specified through an event-select field in the PMLCan registers listed in Table A.3.2. Table A.3.4 describes event types used in Table A.3.5. Table A.3.5 lists some encodings for the selectable events to be monitored and establishes a correlation between each counter, events to be traced, and the pattern required for the desired selection. Event type Label Descriptions Reference Ref:# Shared across counters PMC0PMC3. Applicable to most microprocessors. Counter Com:# Shared across counters PMC0PMC3. Fairly specific to e500 microarchitectures. Counter-specific C[0:3]:# Counted only on one or more specific counters. The notation indicates the counter to which an event is assigned. For example, an event assigned to counter PMC2 is shown as C2:#. Table A.3.4: Event types A Performance Monitoring Example Using PMRs We provide a simple example to explain how to use PMRs in this section. We first show the flowchart of using PMRs in Figure A.3.2. The example is a simple benchmark where we traverse all the elements of an array. For this benchmark, we want to monitor the processor cycles and data L1 cache misses using per- 30
45 A.3. TARGET PLATFORM - QORIQ P4080 Numbers Events Spec/ Nonspec Count Description General Events Ref:0 Nothing Nonspec Register counter holds current value Ref:1 Processor cycles Nonspec Every processor cycle Ref:2 Instructions completed Nonspec Completed instructions 0,1 or 2 per cycle Com:3 Micro-ops completed Nonspec Completed micro-ops Com:4 Instructions fetched Spec Fetched instructions 0,1,2,3 or 4 per cycle (instructions written to the IQ) Com:5 Micro-ops decoded Spec Micro-ops decoded Com:6 PM EVENT transitions Spec 0 to 1 transitions on the pm event input Com:7 PM EVENT cycles Spec Processor cycles that occur when the pm event input is asserted... Load/Store, Data Cache, and Data Line Fill Buffer (DLFB) Events Com:27 Loads translated Spec cacheable loads micro-ops translated Com:28 Stores translated Spec cacheable stores micro-ops translated... Com:41 Data L1 cache reloads Spec Counts cache reloads for any reason. Typically used to determine data cache miss rate (along with loads/stores completed)... Bus Interface Unit (BIU) Interface Usage Events Com:67 BIU master requests Spec Master transaction starts (number of Aout sent to CoreNet) Com:68 BIU master global requests Spec Master transaction starts that are global (M=1)(number of Aout with M=1 sent to CoreNet). For e500mc Rev 1.x and Rev 2.x this event is not supported Com:69 BIU master data-side requests Spec Master data-side transaction starts (number of D-side Aout sent to CoreNet)... Snoop Events Com:72 Snoop requests N/A Externally generated snoop requests (number of Ain from CoreNet not from self)... Table A.3.5: Some performance monitor event selection of the e500mc formance counters. From the description of the example, we know that we can monitor these two events at the same time using two performance counters. Here we select the PMC0 (PMR16) and the PMC1 (PMR17) listed in Table A.3.2 respectively for the processor cycles and data L1 cache misses. Accordingly, we should configure the PMLCa0 (PMR144) and the PMLCa1 (PMR145) to respectively select the event processor cycles whose identification number is 1 and the event L1 cache misses whose number is 41 as shown in Table A.3.5. After determining the performance counters to be used, we begin to configure all the necessary PMRs following the procedures in the flowchart in Figure A.3.2. The source code of the example is shown in Listing A.3.1. Listing A.3.1: Example code of using PMRs / Freeze counters / l i s 14, 0 x8000 ; // s e t g e n e r a l r e g i s t e r r14 to // the value 0 x mtpmr 400, 1 4 ; //PMGC0=r14=0x to // f r e e z e a l l the counters / I n i t i a l i z e counters / 31
46 A.3. TARGET PLATFORM - QORIQ P4080 l i 14, 0 ; // s e t r14 to zero mtpmr 16, 1 4 ; // i n i t i a l i z e PMC0 to zero mtpmr 17, 1 4 ; // i n i t i a l i z e PMC1 to zero / S e l e c t d e s i r e d events / l i s 14, 1 ; // s e t r14 to 1 which i s the number // o f the event p r o c e s s o r c y c l e s mtpmr 144, 1 4 ; // c o n f i g u r e PMLCa0 to s e l e c t // the p r o c e s s o r c y c l e s l i s 14, 4 1 ; // s e t r14 to 41 which i s the number // o f the event data L1 cache misses mtpmr 145, 1 4 ; // c o n f i g u r e PMLCa1 to s e l e c t // the data L1 cache misses / Enable counters / l i 14, 0 ; // s e t r14 to zero mtpmr 400, 1 4 ; //PMGC0=r14=0x0 to u n f r e e z e / enable // a l l the counters {benchmark e x e c u t e s... } / Freeze counters / l i s 14, 0 x8000 ; mtpmr 400, 1 4 ; / Read counters to get the event v a l ue s / mfpmr 14, 1 6 ; // read the value o f the PMC0 to r14 mfpmr 15, 1 7 ; // read the value o f the PMC1 to r15 A.3.3 Hardware Monitors in the Platform P4080 Besides the core-related performance monitoring, the P4080 has the ability to monitor the platform related activities. In the P4080, an infrastructure is integrated to support run control, performance monitoring and tracing. This infrastructure is called Advanced QorIQ Platform Debug Architecture (APDA). The functionality of the APDA is modular. The P4080 has five functional areas and each of them has its own functionspecific debug logic that forwards information to cross-functional facilities to coordinate run control, performance monitoring, and tracing operations. Five function areas are illustrated below: 32
47 A.3. TARGET PLATFORM - QORIQ P4080 Enter supervisor mode Freeze counters Initialize counters Select events Unfreeze/enable counters Run tasks (Supervisor or user mode) Freeze counters (Supervisor mode) Read counters Figure A.3.2: The flowchart of using PMRs CoreNet - platform coherency fabric and platform cache DDR - external memory Data Path (Frame Manager and Queue Manager) - network packet processing and queuing OCeaN (PCI-Express and Serial RapidIO) - interface to high-speed serial peripherals e500mc processor cores The cross-functional debug components are as follows: Event Processing Unit (EPU) - event selection, combining, counting, crosstriggering, and run-control interface Nexus Port Controller (NPC) - central ingress and egress point for Nexus commands and trace data Nexus Concentrator (NXC) - trace filtering, arbitration, and message formatting 33
48 A.3. TARGET PLATFORM - QORIQ P4080 Nexus Aurora Link (NAL) - high-speed serial debug link over SerDes lanes The NPC, NXC and NAL are not covered in the thesis, but the EPU is briefly presented as it is the heart of the APDA. The EPU houses the platform performance monitoring function and enables the performance characterization through a set of event counters and their associated performance counter control registers. It allows the user to select, control performance events by configuring corresponding registers similarly with the core-related performance monitors PMRs. There are a maximum of 2048 event signals that can be routed to the 32 platform performance counters. Some events can be combined with each other to produce a new event. It thus provides a high flexibility to users for performance monitoring. We concentrated on three function areas: the e500mc, the CoreNet and the DDR. The performance monitoring for the e500mc is to use PMRs located in the e500mc as presented in Section A.3.2. To monitor performance activities of the CoreNet and the DDR, we configure relevant registers of debug components to select desired events. Unfortunately, the CoreNet area debug is not documented in the reference manual. As a consequence, we have no ability to monitor the activities related to the CoreNet and the L3 cache. We finally used APDA to monitor DDR concerning activities. A P4080 Memory Map Overview Before explaining how to use platform hardware monitors, we first present the P4080 memory map which will be used for platform hardware monitors configurations. In the P4080, there are several address domains within the device, including: Logical, virtual, and physical (real) address spaces within the Power Architecture core(s) Internal local address space Internal Configuration, Control, and Status Register (CCSR) address space, which is a special-purpose subset of the internal local address space Internal Debug Control and Status Register (DCSR) address space, which is another special-purpose set of registers mapped in the internal local address space External memory, I/O, and configuration address spaces of the serial RapidIO link 34
49 A.3. TARGET PLATFORM - QORIQ P4080 External memory, I/O, and configuration address spaces of the PCI Express links The MMU in the core handles translation of logical (effective) addresses, into virtual addresses, and ultimately to the physical addresses for the local address space. The local address map is defined by a set of 32 Local Access Windows (LAWs). Each of these windows maps a region of the local address space to a specified target interface, such as the DDR controller, DCSR, CCSR or other targets. Each LAW is defined by a pair of base address registers that specify the starting address for the window, and an attribute register that specifies whether the mapping is enabled, the size of the window, a coherency subdomain, and the target interface for that window. The concerning registers are described as below: LAWn base address register high (LAW LAWBARHn): It identifies bits 0 3 of the 36-bit base address of local access window n. LAWn base address register low (LAW LAWBARLn): It identifies bits 4 23 of the 36-bit base address of local access window n. LAWn attribute register (LAW LAWARn): It is composed of four main fields: A EN: Enable this window. TRGT ID: Target identifier identifying the target interface when a transaction hits in the address range defined by this window. CSD ID: Coherency subdomain identifier identifying a group of one or more partitions that have access to the address space defined by this access window. SIZE: Identifies the size of the window from the starting address. Local Address Map Example Figure A.3.3 shows a typical local address map example, and Table A.3.6 shows the setting of LAWs corresponding to the each address segment in the example. A The Use of Platform Hardware Monitors To control the debug components of APDA for monitoring, we configure dedicated registers in the Configuration, Control and Status Register map (CCSR), and the Debug Configuration Control and Status Register map (DCSR) presented in Section A The DCSR and CCSR both belong to the internal local address 35
50 A.3. TARGET PLATFORM - QORIQ P DDR SDRAM Memory 0x0_8000_0000 0x0_A000_0000 Local bus SRAM I/O CCSR PCI Express 1 PCI Express 2 Local Bus DSP 0x0_A000_0000 0x0_B000_0000 0x0_C000_0000 0x0_FFFF_FFFF Boot window Figure A.3.3: Local address map example Window Base Address Size Target Interface 0 0x h 2Gbytes DDR 1 0x h 1Mbytes Local bus controller (elbc)-sram 2 0x0 A h 256Mbytes PCI Express 1 3 0x0 B h 256Mbytes PCI Express 2 4 0x0 C h 256Mbytes Local bus controller (elbc)-dsp 5-9 Unused Table A.3.6: Local Access Window Setting Example space in the P4080. Usually, the CCSR address range has been defined in the initialization file of the P4080, but the DCSR is not specified. Therefore, to access to registers mapped in the DCSR, the overall mechanism is shown as the following: 1. Open a LAW for the DCSR by configuring LAW registers presented in Section A The target ID in LAW LAWARn should be set to select the DCSR, and the size of the DCSR is 4Mbytes. 2. Configure appropriate MMUs to allow the access from e500mc cores to the DCSR address range. 3. Configure relevant registers in the defined DCSR map to monitor the desired platform events. The flowchart of this procedure is the same with using PMRs shown in Figure A.3.2. For example, to monitor the event DDR1 read, we should configure relevant registers of the EPU and of the DDR debug component. If we want to further 36
51 A.3. TARGET PLATFORM - QORIQ P4080 specify the event DDR1 read issued from core1, we should additionally configure the registers of the NXC to indicate the source of the DDR read. We succeeded in monitoring DDR events with the help of the reference manual of the platform debug. But the reference manual is not publicly available. It is provided only to authorized debug hardware and software vendors. Therefore, we can not present the detail of register configurations for the event monitoring. A.3.4 P4080 Configurations Most multi-core COTS provide some amount of configurability to adapt users requirements. For example, caches help to reduce data transfer time between cores and the main memory to improve the overall system performance, but they also bring the performance variability when they are shared among co-running applications. To improve the predictability, most embedded architectures allow to simply disable caches, some provide some degree of hardware partitioning, and few allow the caches to be configured as SRAM memories. However, most applications from Thales today do not allow us to completely disable the cache for the performance reason, so we concentrate on the cache partitioning to increase the predictability. A Cache Partitioning in the P4080 The P4080 platform provides us with two shared L3 caches each connected to a dedicated DDR controller. Beyond allowing us to enable one or both of the L3 cache / DDR controller pairs, the P4080 L3 cache offers some hardware partitioning support, allowing us to shift from a cache fully shared by the cores to a cache where each core has a dedicated pre-allocated memory space. All the configurations of L3 caches is set by programming CoreNet platform cache (CPC) registers which are mapped in the CCSR area. The CPC partitioning is thus achieved through specific configuration control registers in this area. The CPC registers used for paritioning are described as below: CPC partition ID register n (CPCPIRn): It indicates the partition ID which equates to the CSD ID assigned by the LAWs. CPC partition allocation register n (CPCPARn): It controls the CPC allocation for different data and instruction transactions. For example, it decides whether data store transactions that miss in the CPC will attempt to allocate in one of the ways defined by the corresponding CPCPWRn. 37
52 A.3. TARGET PLATFORM - QORIQ P4080 CPC partition way register n (CPCPWRn): It decides which partition way(s) can be allocated to transactions that match the PID defined in the corresponding CPCPIRn. The overall partitioning mechanism involves CPC registers and LAW registers presented in Section A.3.3.1, which is concluded as follows: 1. A transaction matches a LAW whose target ID is the memory complex 1 or 2 (DDR controller1 or controller2). 2. LAW LAWAR[CSD ID] identifies the coherency sub-domain. 3. The selected CSD ID is searched through CPC partitioning control registers (CPCPIRn, CPCPARn, CPCPWRn) to find which way(s) of the CPC has been allocated to this transaction. CPC Partitioning Example We provide a simple example to demonstrate how to map a DDR area of 256M (0x x00FFFFFFF) to eight ways 0 7 of the CPC1 (L3 cache 1). The example is depicted in Listing A.3.2. Listing A.3.2: CPC1 partitioning example # 1. LAW28 matches DDR1 256M 0 x x0FFFFFFF # Bits 0 3 o f 0x00FFFFFFF i s a l l 0 LAW LAWBARH28 = 0 x # Bits 4 23 o f 0 x i s a l l 0 LAW LAWBARL28 = 0 x # EN=1, TRGT ID=ID o f DDR1, CSD ID=1, SIZE=256M LAW LAWAR28 = 0 x b # 2. P a r t i t i o n 1 8 ways 0 7 o f CPC1 f o r LAW28 # PID=CSD ID=1 CPC1 CPCPIR0 = 0 x # All the types o f t r a n s a c t i o n s can a l l o c a t e 8 ways d e f i n e d by CPC1 CPCPWR0 CPC1 CPCPAR0 = 0xFFFFFFFF # A l l o c a t e 0 7 ways to LAW28 CPC1 CPCPWR0 = 0 xff A Compromise of Different Configurations Different configurations may result in different overall performance and different performance variability. However, a configuration can hardly satisfy all the 38
53 A.3. TARGET PLATFORM - QORIQ P4080 desired requirements, which makes us to compromise in terms of some less significant demand. For example, we have two different configurations of P4080 as below: Config1: we enable one L3 cache and its associated DDR controller. The L3 cache is not partitioned, which means that all the cores share the same L3 cache. Config2: we enable one L3 cache and its associated DDR controller. The L3 cache is partitioned into eight identical segments and each of them is allocated to one core. Therefore, each core has its proper L3 cache storage. If we want to test the overall performance and the variability of an application when it runs with other applications independently in different cores under the Config1 and the Config2 in P4080, we can predict in design time that: the Config1 will in principle provide better overall performance by better fitting asymmetric load balancing scenario while providing more performance variability because of the shared cache line evictions due to interferences of other cores on the L3 cache. the Config2 will provide less performance variability, namely better predictability by preventing cache line evictions due to other cores, because each core has its private pre-allocated L3 cache. However, the Config2 may degrade the overall performance by providing less allocated cache area due to the partition. Considering the impact of configurations on the behavior in the co-running context, we evaluated different configurations to identify the most suitable one for safety-critical applications. Table A.3.7 lists the selected configurations tested in the thesis. The configuration details and relevant results are shown in Section C and Section C.5.3. A.3.5 Conclusion of Target Platform As the next generation processor candidate in the avionic domain, the P4080 is an eight-core platform based on PowerPC developped by Freescale. In the P4080, there are a series of hardware monitors implemented in e500mc cores and in the platform. The core related hardware monitors allow us to collect 162 events, including CPU CYCLES, L1 cache misses..., while platform related monitors capturing DDR events, like DDR read, DDR write, DDR page closing..., by configuring relevant registers within cores or in the CCSR and DCSR internal 39
54 A.3. TARGET PLATFORM - QORIQ P4080 configuration level 3 cache #ddr size associativity controllers single controller 1MB, shared by 8 cores 32-way 1 non-partitioned single controller partitioned 128KB, per core 4-way 1 dual controller 2 (1MB, shared by 4 cores) 32-way 2 non-partitioned dual controller 256KB per core 8-way 2 partitioned Table A.3.7: Four configurations of P4080 address space. Since there are only four hardware monitors in each core, we are able to collect a maximum of four events per core at the same time. For some event which can not be counted by only one 32 bit monitor, we have to combine two monitors as a chained counter to count the overflow of the event. In this case, the number of events which can be simultaneously collected is less than four. In addition to the core-related events, the platform-related events which can be simultaneously collected are also limited due to the limited number of counters in the EPU and the limited number of components (i.e. comparators, filters...) in the NXC. As a consequence, we should make a compromise among simultaneously collected events. In addition, the P4080 supports different hardware configurations adapting to users requirements. We can enable one or both of the L3 cache / DDR controller pairs and further partition shared L3 caches through configuring CPC and DDR concerning registers along the CCSR space. Although there are many peripherals implemented around the CoreNet in the P4080, we only concentrated on P4080 s e500mc cores and the shared memorypath resources: the CoreNet, L3 caches and DDRs throughout the thesis. To facilitate the use of hardware monitors and eliminate unexpected overheads during the events collection, we realised all the experiments on the bareboard of P4080 without any operating system. 40
55 Chapter A.4 Software Environment - CodeWarrior The CodeWarrior [11] is an integrated development environment (IDE) for the creation of software that runs on a number of embedded systems. In the Code- Warrior toolset, the Editor, Compiler, Linker, Debugger, and other software modules operate within IDE. The IDE oversees the control and execution of the tools. We used CodeWarrior to develop our applications and benchmarks and we downloaded the binary files.elf into the P4080 using CodeWarrior USB TAP which enables P4080 debugging via a JTAG port while connected to our host computer via USB. We present, in this chapter, different development stages in the CodeWarrior to implement applications into the P4080. A.4.1 Creating Projects in CodeWarrior The CodeWarrior provides a project manager to organize all the files related to the project. The first step of CodeWarrior development process is to create a new project using the project wizard. The CodeWarrior Project wizard presents a series of pages that prompt you for the features and settings to be used when making your program. This wizard also helps you specify other settings, such as whether the program executes on a simulator rather than actual hardware. The users can create all the projects according to their experimental setup. For example, throughout the thesis, we run one application per core in barebone P4080, so we generate a new project with main settings described below: Processor type: P target hardware. 41
56 A.4. SOFTWARE ENVIRONMENT - CODEWARRIOR Processing model: AMP (one project per core) - Select this option to generate a separate project for each selected core. Tool chain: Bareboard: GCC EABI e500mc - Select to execute the program on the bareboard. Debugger connection type: Hardware - Select to execute the program on the target hardware. Trace configuration: Disable trace and profile for the project to avoid the interference noise. All the features and settings selected in the above example during the project creation are graphically illustrated in Figure A.4.1. For each new project, the CodeWarrior automatically configures the P4080 by generating an initialization file and a memory configuration file. We can directly compile a new project and then run/debug it on the P4080. The default configuration set by the CodeWarrior is the one in the first row of Table A.3.7. However, this stationery project is designed to get you up and running quickly with the CodeWarrior for Power Architecture Development Studio. We can absolutely modify the initialization file to adapt to our own demands. For example, to get different configurations of the P4080 described in Table A.3.7, we re-configured registers related to L3 caches and DDR controllers in the initialization file. According to the readme.txt file generated in each new project in AMP model, the first core s project (core 0) is responsible for initializing the board. The projects for other than the first core only initialize core specific options, not the whole platform. Therefore launching projects for other cores requires that the core 0 s project is running. A.4.2 Building Projects in CodeWarrior There are two modes of building projects in CodeWarrior: the graphic interface mode and the command line mode. Graphic Interface Mode In the CodeWarrior, we can build all the projects in a workspace using option Build All in Project menu from the CodeWarrior IDE menu bar. Considering that building the entire workspace can take a long time and often there are only a few projects that really matter to a user at a given time, we can also build only the selected projects by right-clicking on the selected project in the CodeWarrior Projects view and selecting Build Project from the context menu. 42

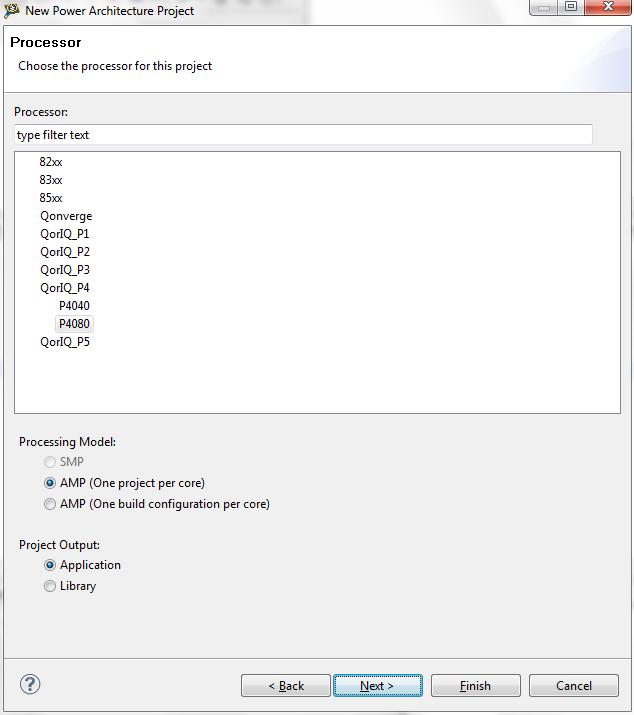


57 A.4. SOFTWARE ENVIRONMENT - CODEWARRIOR (a) (b) (c) (d) 43
 Project name and location page, (b) Processor page, (c) Build settings page, (d) Launch configuration page, (e) Hardware page and (f) Trace configuration page.")

58 A.4. SOFTWARE ENVIRONMENT - CODEWARRIOR (e) (f) Figure A.4.1: Various pages that the CodeWarrior Project wizard displays. (a) Project name and location page, (b) Processor page, (c) Build settings page, (d) Launch configuration page, (e) Hardware page and (f) Trace configuration page. Command Line Mode A new command line tool, ecd.exe, is installed along with the CodeWarrior installation that allows you to run build commands. The command line mode allows us to build projects through a script from outside of the CodeWarrior, which helps automate our experiments. The command build is described in following Table A.4.1. build Builds a set of C/C++ projects. Multiple-project flags can be passed on the same command invocation. The build tool output is generated on the command line, and the build result is returned by ecd.exe return code, as 0 for success, and -1 for failure Syntax ecd.exe -build [-verbose] [-cleanall] [ -project path [- config name -allconfig] -cleanbuild] Parameter -cleanbuild The -cleanbuild command applies to the preceding -project only -cleanall The -cleanall command applies to all -project flags -config The build configuration name. If the -config flag isn t specified, the default build configuration is used Table A.4.1: Description of ecd.exe tool command build 44

59 A.4. SOFTWARE ENVIRONMENT - CODEWARRIOR A.4.3 Debugging Projects in CodeWarrior There are also two modes of debugging projects similar to building projects modes: the graphic interface mode and the command line mode. Graphic Interface Mode The CodeWarrior Project wizard sets the debugger settings of the project s launch configurations to default values. We can change these default values based on our requirements from the CodeWarrior IDE menu bar by selecting Run -> Debug Configurations. To launch a debugging session and select a debugging operation, like Step into, we can click relevant options from the Run menu. Command Line Mode The CodeWarrior supports a command-line interface to some of its features including the debugger. We can use the command-line interface together with the TCL scripting engine. The Debugger Shell view is used to issue command lines to the IDE. For example, you type the command debug in this window to start a debugging session. The window lists the standard output and standard error streams of command-line activity. Figure A.4.2 shows the Debugger Shell view. The command line mode helps us automate the experiments. Figure A.4.2: The Debugger Shell view. We will show how to use the CodeWarrior for software developments in Section C
60 Chapter A.5 Contribution The overall objective of the thesis is to estimate the runtime variability of corunning safety-critical applications on a COTS multi-core architecture. Our proposal will allow us to first learn undocumented features of the underlying architecture and applications relatively to shared hardware resources. second compute a runtime upper bound of an application co-running with a set of pre-determined applications with gathered shared resource concerning information. Our proposed approach to achieve the objective is the measurement-based analysis using COTS according to the classification concluded in the state of the art A.2.5. Similar with [28, 22], we also use resource stressing benchmarks to quantify the co-running performance slowdown. However, compared to [28] where Radojković et al. only rely on measured execution time to derive the resource sensitivity of an application, we are using hardware monitors to capture the shared resource related activities of an application, which allows us not only to observe the sensitivity on shared resources, but also to learn the application s utilization of each shared resource. In addition, Radojković et al. estimate the upper bound of a target application while co-running with other real applications by co-running the target application with resource stressing benchmarks without taking account of the behavior on shared resources of the real co-running applications. Similarly, the authors [22] use resource stressing benchmarks to derive the performance slowdown caused by concurrent accesses to the network and memory under different hardware configurations, and consider the tested maximum slowdown as the worst case slowdown that real applications will experience. However, there is neither a proof nor a formal argument why a specific resource stressing benchmark puts maximum load on the resource. In case of 46
61 A.5. CONTRIBUTION several possible co-runners, these arguments become even more difficult because of the combined interferences. Another concern demonstrated via experimental results in [28, 22] is that the estimated upper bound is too pessimist compared with the longest measured execution time of co-running real applications. In our approach, hardware monitors can provide a proof showing if a resource stressing benchmark or co-running resource stressing benchmarks saturate the resource. Besides, the utilizations of shared resources of each co-running application can help us to design stressing benchmarks simulating the worst case interference on shared resources, which results in a safer and tighter upper bound estimate. To clearly present our methodologies and concerning experiments, the remaining thesis is organized as below: Part B - Quantifying Runtime Variability: Demonstrate the variability that an application may experience while co-running with others due to the contention on shared hardware resources in multi-cores. To better understand the organized experiments, we also present our used applications and stressing benchmarks. Part C - Architecture and Application Characterization: Present first the characterization methodology, and second the measurement techniques, and third experimental setup with all the experiment designs and implementations, and fourthly the experimental results which are splitted into the architecture section and the application section. Part D - Alternative Technique of WCET: Present first the methodology, and second the measurement techniques, and third the two detailed estimation methods with experimental results. Part E - Conclusion: Conclude the thesis and propose some future work based on our estimation results. 47
62 Part B Quantifying Runtime Variability 48
63 Chapter B.1 Overview In Chapter A.1 we explained that using multi-core COTS may bring about unsustainable runtime variability for co-running applications because of contention on shared hardware resources, which might not be accepted in safety-critical context. To better estimate this variability, we designed a group of experiments to quantify the variability, which shown us upto which extent the co-running performance can be slown down. The concept of the quantification is to capture the runtime variability on a target application when it runs with a set of stressing benchmarks on the P4080. We first present applications under analysis for the experiments in Chapter B.2, and then introduce dedicated stressing benchmarks used as co-runners in Chapter B.3.Finally, we explain the experimental setup and analyse the results in Chapter B.4. 49
64 Chapter B.2 Applications under Study B.2.1 Applications from Mibench Suite As a proxy for various independent applications co-running on a safety-critical system, we used a subset of the MiBench benchmark suite [14], a set of embedded benchmarks from various domains of the embedded market: automotive, consumer, office, networking, security and telecommunication. Considering that we run the experiments on the bareboard P4080, we have to modify the Mibench benchmarks to be portable for barebone testing by eliminating operating system requirements such as system calls and dynamic memory management. We finally selected a subset of 7 Mibench benchmarks: ADPCM, CRC32, FFT, blowfish, SHA, patricia, and susan which are easier to be ported for barebone testing on the P4080 hardware platform. Although these seven benchmarks are not realtime as expected for the safety-critical domain, it is not an issue to apply them for characterizing the runtime variability. ADPCM (telecommunication): Adaptive Differential Pulse Code Modulation (ADPCM) is a variation of the well-known standard Pulse Code Modulation (PCM) that varies the size of the quantization step, to allow further reduction of the required bandwidth for a given signal-to-noise ratio. CRC32 (telecommunication): This benchmark performs a 32-bit Cyclic Redundancy Check (CRC) on a file. CRC checks are is an error-detecting code commonly used in data transmission. FFT (telecommunication): Fast Fourier Transform (FFT) on an array of data. Fourier transform converts digital signal from time space to frequency space to find the frequencies contained in the signal. blowfish (security): This benchmark is a symmetric block cipher with a variable length key. 50
: Patricia tries are used to represent routing tables in network applications.")
65 B.2. APPLICATIONS UNDER STUDY SHA (security): Secure Hash Algorithm (SHA) is a family of cryptographic hash functions used in the secure exchange of cryptographic keys and for generating digital signatures. patricia (network): Patricia tries are used to represent routing tables in network applications. This benchmark provides functions for inserting nodes, removing nodes, and searching in a Patricia trie designed for IP addresses and netmasks. susan (automotive): It is an image recognition package. It was developed for recognizing corners and edges in an image. Figure B.2.1 shows the instructions (load/store, branches, integer and floating point) distribution of each Mibench benchmark, which can guide us to preunderstand their features before use them for our own purpose. For example, the benchmarks with low portion of load/store instructions will be not suitable for analysing the impact on the memory-path resources. Figure B.2.1: Distributions of main classes of instructions for each Mibench benchmark. B.2.2 Industrial Applications We completed above suite of small benchmarks with two larger industrial-level applications developed internally at Thales including additional hard real-time constraints: 51
ait: WORST-CASE EXECUTION TIME PREDICTION BY STATIC PROGRAM ANALYSIS
 ait: WORST-CASE EXECUTION TIME PREDICTION BY STATIC PROGRAM ANALYSIS Christian Ferdinand and Reinhold Heckmann AbsInt Angewandte Informatik GmbH, Stuhlsatzenhausweg 69, D-66123 Saarbrucken, Germany info@absint.com
Mastering The Behavior of Multi-Core Systems to Match Avionics Requirements
 www.thalesgroup.com Mastering The Behavior of Multi-Core Systems to Match Avionics Requirements Hicham AGROU, Marc GATTI, Pascal SAINRAT, Patrice TOILLON {hicham.agrou,marc-j.gatti, patrice.toillon}@fr.thalesgroup.com
CONTENTION IN MULTICORE HARDWARE SHARED RESOURCES: UNDERSTANDING OF THE STATE OF THE ART
 CONTENTION IN MULTICORE HARDWARE SHARED RESOURCES: UNDERSTANDING OF THE STATE OF THE ART Gabriel Fernandez 1, Jaume Abella 2, Eduardo Quiñones 2, Christine Rochange 3, Tullio Vardanega 4 and Francisco
SIC: Provably Timing-Predictable Strictly In-Order Pipelined Processor Core
 SIC: Provably Timing-Predictable Strictly In-Order Pipelined Processor Core Sebastian Hahn and Jan Reineke RTSS, Nashville December, 2018 saarland university computer science SIC: Provably Timing-Predictable
Overview of Potential Software solutions making multi-core processors predictable for Avionics real-time applications
 Overview of Potential Software solutions making multi-core processors predictable for Avionics real-time applications Marc Gatti, Thales Avionics Sylvain Girbal, Xavier Jean, Daniel Gracia Pérez, Jimmy
Impact of Resource Sharing on Performance and Performance Prediction: A Survey
 Impact of Resource Sharing on Performance and Performance Prediction: A Survey Andreas Abel, Florian Benz, Johannes Doerfert, Barbara Dörr, Sebastian Hahn, Florian Haupenthal, Michael Jacobs, Amir H. Moin,
Hardware Support for WCET Analysis of Hard Real-Time Multicore Systems
 Hardware Support for WCET Analysis of Hard Real-Time Multicore Systems Marco Paolieri Barcelona Supercomputing Center (BSC) Barcelona, Spain marco.paolieri@bsc.es Eduardo Quiñones Barcelona Supercomputing
Timing analysis and timing predictability
 Timing analysis and timing predictability Architectural Dependences Reinhard Wilhelm Saarland University, Saarbrücken, Germany ArtistDesign Summer School in China 2010 What does the execution time depends
WCET-Aware C Compiler: WCC
 12 WCET-Aware C Compiler: WCC Jian-Jia Chen (slides are based on Prof. Heiko Falk) TU Dortmund, Informatik 12 2015 年 05 月 05 日 These slides use Microsoft clip arts. Microsoft copyright restrictions apply.
Contents. Preface xvii Acknowledgments. CHAPTER 1 Introduction to Parallel Computing 1. CHAPTER 2 Parallel Programming Platforms 11
 Preface xvii Acknowledgments xix CHAPTER 1 Introduction to Parallel Computing 1 1.1 Motivating Parallelism 2 1.1.1 The Computational Power Argument from Transistors to FLOPS 2 1.1.2 The Memory/Disk Speed
Main Points of the Computer Organization and System Software Module
 Main Points of the Computer Organization and System Software Module You can find below the topics we have covered during the COSS module. Reading the relevant parts of the textbooks is essential for a
Improving Real-Time Performance on Multicore Platforms Using MemGuard
 Improving Real-Time Performance on Multicore Platforms Using MemGuard Heechul Yun University of Kansas 2335 Irving hill Rd, Lawrence, KS heechul@ittc.ku.edu Abstract In this paper, we present a case-study
Design and Analysis of Real-Time Systems Predictability and Predictable Microarchitectures
 Design and Analysis of Real-Time Systems Predictability and Predictable Microarcectures Jan Reineke Advanced Lecture, Summer 2013 Notion of Predictability Oxford Dictionary: predictable = adjective, able
Computer Architecture
 Computer Architecture Pipelined and Parallel Processor Design Michael J. Flynn Stanford University Technische Universrtat Darmstadt FACHBEREICH INFORMATIK BIBLIOTHEK lnventar-nr.: Sachgebiete: Standort:
The Automatic Design of Batch Processing Systems
 The Automatic Design of Batch Processing Systems by Barry Dwyer, M.A., D.A.E., Grad.Dip. A thesis submitted for the degree of Doctor of Philosophy in the Department of Computer Science University of Adelaide
PERFORMANCE ANALYSIS OF REAL-TIME EMBEDDED SOFTWARE
 PERFORMANCE ANALYSIS OF REAL-TIME EMBEDDED SOFTWARE PERFORMANCE ANALYSIS OF REAL-TIME EMBEDDED SOFTWARE Yau-Tsun Steven Li Monterey Design Systems, Inc. Sharad Malik Princeton University ~. " SPRINGER
Static WCET Analysis: Methods and Tools
 Static WCET Analysis: Methods and Tools Timo Lilja April 28, 2011 Timo Lilja () Static WCET Analysis: Methods and Tools April 28, 2011 1 / 23 1 Methods 2 Tools 3 Summary 4 References Timo Lilja () Static
Hardware-Software Codesign. 9. Worst Case Execution Time Analysis
 Hardware-Software Codesign 9. Worst Case Execution Time Analysis Lothar Thiele 9-1 System Design Specification System Synthesis Estimation SW-Compilation Intellectual Prop. Code Instruction Set HW-Synthesis
Computer Architecture
 Computer Architecture Slide Sets WS 2013/2014 Prof. Dr. Uwe Brinkschulte M.Sc. Benjamin Betting Part 10 Thread and Task Level Parallelism Computer Architecture Part 10 page 1 of 36 Prof. Dr. Uwe Brinkschulte,
IMPROVING TIMING ANALYZABILITY THROUGH SOURCE CODE ANALYSIS AND TESTABILITY TRANSFORMATIONS IN REAL-TIME SYSTEMS. David Barrientos Velasco
 IMPROVING TIMING ANALYZABILITY THROUGH SOURCE CODE ANALYSIS AND TESTABILITY TRANSFORMATIONS IN REAL-TIME SYSTEMS David Barrientos Velasco IMPROVING TIMING ANALYZABILITY THROUGH SOURCE CODE ANALYSIS AND
ESE532: System-on-a-Chip Architecture. Today. Message. Real Time. Real-Time Tasks. Real-Time Guarantees. Real Time Demands Challenges
 ESE532: System-on-a-Chip Architecture Day 9: October 1, 2018 Real Time Real Time Demands Challenges Today Algorithms Architecture Disciplines to achieve Penn ESE532 Fall 2018 -- DeHon 1 Penn ESE532 Fall
FROM TIME-TRIGGERED TO TIME-DETERMINISTIC REAL-TIME SYSTEMS
 FROM TIME-TRIGGERED TO TIME-DETERMINISTIC REAL-TIME SYSTEMS Peter Puschner and Raimund Kirner Vienna University of Technology, A-1040 Vienna, Austria {peter, raimund}@vmars.tuwien.ac.at Abstract Keywords:
Sireesha R Basavaraju Embedded Systems Group, Technical University of Kaiserslautern
 Sireesha R Basavaraju Embedded Systems Group, Technical University of Kaiserslautern Introduction WCET of program ILP Formulation Requirement SPM allocation for code SPM allocation for data Conclusion
History-based Schemes and Implicit Path Enumeration
 History-based Schemes and Implicit Path Enumeration Claire Burguière and Christine Rochange Institut de Recherche en Informatique de Toulouse Université Paul Sabatier 6 Toulouse cedex 9, France {burguier,rochange}@irit.fr
Parallel Computing: Parallel Architectures Jin, Hai
 Parallel Computing: Parallel Architectures Jin, Hai School of Computer Science and Technology Huazhong University of Science and Technology Peripherals Computer Central Processing Unit Main Memory Computer
Automatic Qualification of Abstract Interpretation-based Static Analysis Tools. Christian Ferdinand, Daniel Kästner AbsInt GmbH 2013
 Automatic Qualification of Abstract Interpretation-based Static Analysis Tools Christian Ferdinand, Daniel Kästner AbsInt GmbH 2013 2 Functional Safety Demonstration of functional correctness Well-defined
Evaluating Static Worst-Case Execution-Time Analysis for a Commercial Real-Time Operating System
 Evaluating Static Worst-Case Execution-Time Analysis for a Commercial Real-Time Operating System Daniel Sandell Master s thesis D-level, 20 credits Dept. of Computer Science Mälardalen University Supervisor:
Multithreading: Exploiting Thread-Level Parallelism within a Processor
 Multithreading: Exploiting Thread-Level Parallelism within a Processor Instruction-Level Parallelism (ILP): What we ve seen so far Wrap-up on multiple issue machines Beyond ILP Multithreading Advanced
Timing Anomalies and WCET Analysis. Ashrit Triambak
 Timing Anomalies and WCET Analysis Ashrit Triambak October 20, 2014 Contents 1 Abstract 2 2 Introduction 2 3 Timing Anomalies 3 3.1 Retated work........................... 4 3.2 Limitations of Previous
CPU Scheduling. Operating Systems (Fall/Winter 2018) Yajin Zhou ( Zhejiang University
 Yajin Zhou ( Zhejiang University") Operating Systems (Fall/Winter 2018) CPU Scheduling Yajin Zhou (http://yajin.org) Zhejiang University Acknowledgement: some pages are based on the slides from Zhi Wang(fsu). Review Motivation to use threads
Operating Systems (Fall/Winter 2018) CPU Scheduling Yajin Zhou (http://yajin.org) Zhejiang University Acknowledgement: some pages are based on the slides from Zhi Wang(fsu). Review Motivation to use threads
OVERHEADS ENHANCEMENT IN MUTIPLE PROCESSING SYSTEMS BY ANURAG REDDY GANKAT KARTHIK REDDY AKKATI
 CMPE 655- MULTIPLE PROCESSOR SYSTEMS OVERHEADS ENHANCEMENT IN MUTIPLE PROCESSING SYSTEMS BY ANURAG REDDY GANKAT KARTHIK REDDY AKKATI What is MULTI PROCESSING?? Multiprocessing is the coordinated processing
Introduction CHAPTER. Practice Exercises. 1.1 What are the three main purposes of an operating system? Answer: The three main puropses are:
 1 CHAPTER Introduction Practice Exercises 1.1 What are the three main purposes of an operating system? Answer: The three main puropses are: To provide an environment for a computer user to execute programs
Scheduling the Intel Core i7
 Third Year Project Report University of Manchester SCHOOL OF COMPUTER SCIENCE Scheduling the Intel Core i7 Ibrahim Alsuheabani Degree Programme: BSc Software Engineering Supervisor: Prof. Alasdair Rawsthorne
Predictable Programming on a Precision Timed Architecture
 Predictable Programming on a Precision Timed Architecture Ben Lickly, Isaac Liu, Hiren Patel, Edward Lee, University of California, Berkeley Sungjun Kim, Stephen Edwards, Columbia University, New York
2 TEST: A Tracer for Extracting Speculative Threads
 EE392C: Advanced Topics in Computer Architecture Lecture #11 Polymorphic Processors Stanford University Handout Date??? On-line Profiling Techniques Lecture #11: Tuesday, 6 May 2003 Lecturer: Shivnath
ECE519 Advanced Operating Systems
 IT 540 Operating Systems ECE519 Advanced Operating Systems Prof. Dr. Hasan Hüseyin BALIK (10 th Week) (Advanced) Operating Systems 10. Multiprocessor, Multicore and Real-Time Scheduling 10. Outline Multiprocessor
Computer Architecture: Multi-Core Processors: Why? Onur Mutlu & Seth Copen Goldstein Carnegie Mellon University 9/11/13
 Computer Architecture: Multi-Core Processors: Why? Onur Mutlu & Seth Copen Goldstein Carnegie Mellon University 9/11/13 Moore s Law Moore, Cramming more components onto integrated circuits, Electronics,
CS 426 Parallel Computing. Parallel Computing Platforms
 CS 426 Parallel Computing Parallel Computing Platforms Ozcan Ozturk http://www.cs.bilkent.edu.tr/~ozturk/cs426/ Slides are adapted from ``Introduction to Parallel Computing'' Topic Overview Implicit Parallelism:
Multiprocessors and Thread-Level Parallelism. Department of Electrical & Electronics Engineering, Amrita School of Engineering
 Multiprocessors and Thread-Level Parallelism Multithreading Increasing performance by ILP has the great advantage that it is reasonable transparent to the programmer, ILP can be quite limited or hard to
An Overview of MIPS Multi-Threading. White Paper
 Public Imagination Technologies An Overview of MIPS Multi-Threading White Paper Copyright Imagination Technologies Limited. All Rights Reserved. This document is Public. This publication contains proprietary
Cluster-based approach eases clock tree synthesis
 Page 1 of 5 EE Times: Design News Cluster-based approach eases clock tree synthesis Udhaya Kumar (11/14/2005 9:00 AM EST) URL: http://www.eetimes.com/showarticle.jhtml?articleid=173601961 Clock network
CPU Scheduling. Daniel Mosse. (Most slides are from Sherif Khattab and Silberschatz, Galvin and Gagne 2013)
") CPU Scheduling Daniel Mosse (Most slides are from Sherif Khattab and Silberschatz, Galvin and Gagne 2013) Basic Concepts Maximum CPU utilization obtained with multiprogramming CPU I/O Burst Cycle Process
CPU Scheduling Daniel Mosse (Most slides are from Sherif Khattab and Silberschatz, Galvin and Gagne 2013) Basic Concepts Maximum CPU utilization obtained with multiprogramming CPU I/O Burst Cycle Process
Performance Optimization for an ARM Cortex-A53 System Using Software Workloads and Cycle Accurate Models. Jason Andrews
 Performance Optimization for an ARM Cortex-A53 System Using Software Workloads and Cycle Accurate Models Jason Andrews Agenda System Performance Analysis IP Configuration System Creation Methodology: Create,
Computer Architecture: Multi-Core Processors: Why? Prof. Onur Mutlu Carnegie Mellon University
 Computer Architecture: Multi-Core Processors: Why? Prof. Onur Mutlu Carnegie Mellon University Moore s Law Moore, Cramming more components onto integrated circuits, Electronics, 1965. 2 3 Multi-Core Idea:
Written Exam / Tentamen
 Written Exam / Tentamen Computer Organization and Components / Datorteknik och komponenter (IS1500), 9 hp Computer Hardware Engineering / Datorteknik, grundkurs (IS1200), 7.5 hp KTH Royal Institute of
Dissecting Execution Traces to Understand Long Timing Effects
 Dissecting Execution Traces to Understand Long Timing Effects Christine Rochange and Pascal Sainrat February 2005 Rapport IRIT-2005-6-R Contents 1. Introduction... 5 2. Long timing effects... 5 3. Methodology...
Timing Analysis of Parallel Software Using Abstract Execution
 Timing Analysis of Parallel Software Using Abstract Execution Björn Lisper School of Innovation, Design, and Engineering Mälardalen University bjorn.lisper@mdh.se 2014-09-10 EACO Workshop 2014 Motivation
Design of a System-on-Chip Switched Network and its Design Support Λ
 Design of a System-on-Chip Switched Network and its Design Support Λ Daniel Wiklund y, Dake Liu Dept. of Electrical Engineering Linköping University S-581 83 Linköping, Sweden Abstract As the degree of
TDT Coarse-Grained Multithreading. Review on ILP. Multi-threaded execution. Contents. Fine-Grained Multithreading
 Review on ILP TDT 4260 Chap 5 TLP & Hierarchy What is ILP? Let the compiler find the ILP Advantages? Disadvantages? Let the HW find the ILP Advantages? Disadvantages? Contents Multi-threading Chap 3.5
AN4777 Application note
 Application note Implications of memory interface configurations on low-power STM32 microcontrollers Introduction The low-power STM32 microcontrollers have a rich variety of configuration options regarding
Lecture 11: SMT and Caching Basics. Today: SMT, cache access basics (Sections 3.5, 5.1)
") Lecture 11: SMT and Caching Basics Today: SMT, cache access basics (Sections 3.5, 5.1) 1 Thread-Level Parallelism Motivation: a single thread leaves a processor under-utilized for most of the time by doubling
Lecture 11: SMT and Caching Basics Today: SMT, cache access basics (Sections 3.5, 5.1) 1 Thread-Level Parallelism Motivation: a single thread leaves a processor under-utilized for most of the time by doubling
MEMORY/RESOURCE MANAGEMENT IN MULTICORE SYSTEMS
 MEMORY/RESOURCE MANAGEMENT IN MULTICORE SYSTEMS INSTRUCTOR: Dr. MUHAMMAD SHAABAN PRESENTED BY: MOHIT SATHAWANE AKSHAY YEMBARWAR WHAT IS MULTICORE SYSTEMS? Multi-core processor architecture means placing
Large-Scale Network Simulation Scalability and an FPGA-based Network Simulator
 Large-Scale Network Simulation Scalability and an FPGA-based Network Simulator Stanley Bak Abstract Network algorithms are deployed on large networks, and proper algorithm evaluation is necessary to avoid
Like scalar processor Processes individual data items Item may be single integer or floating point number. - 1 of 15 - Superscalar Architectures
 Superscalar Architectures Have looked at examined basic architecture concepts Starting with simple machines Introduced concepts underlying RISC machines From characteristics of RISC instructions Found
Twos Complement Signed Numbers. IT 3123 Hardware and Software Concepts. Reminder: Moore s Law. The Need for Speed. Parallelism.
 Twos Complement Signed Numbers IT 3123 Hardware and Software Concepts Modern Computer Implementations April 26 Notice: This session is being recorded. Copyright 2009 by Bob Brown http://xkcd.com/571/ Reminder:
Single-Path Programming on a Chip-Multiprocessor System
 Single-Path Programming on a Chip-Multiprocessor System Martin Schoeberl, Peter Puschner, and Raimund Kirner Vienna University of Technology, Austria mschoebe@mail.tuwien.ac.at, {peter,raimund}@vmars.tuwien.ac.at
Integration of Mixed Criticality Systems on MultiCores: Limitations, Challenges and Way ahead for Avionics
 Integration of Mixed Criticality Systems on MultiCores: Limitations, Challenges and Way ahead for Avionics TecDay 13./14. Oct. 2015 Dietmar Geiger, Bernd Koppenhöfer 1 COTS HW Evolution - Single-Core Multi-Core
Supra-linear Packet Processing Performance with Intel Multi-core Processors
 White Paper Dual-Core Intel Xeon Processor LV 2.0 GHz Communications and Networking Applications Supra-linear Packet Processing Performance with Intel Multi-core Processors 1 Executive Summary Advances
Worst Case Analysis of DRAM Latency in Hard Real Time Systems
 Worst Case Analysis of DRAM Latency in Hard Real Time Systems by Zheng Pei Wu A thesis presented to the University of Waterloo in fulfillment of the thesis requirement for the degree of Master of Applied
HSA Foundation! Advanced Topics on Heterogeneous System Architectures. Politecnico di Milano! Seminar Room (Bld 20)! 15 December, 2017!
! 15 December, 2017!") Advanced Topics on Heterogeneous System Architectures HSA Foundation! Politecnico di Milano! Seminar Room (Bld 20)! 15 December, 2017! Antonio R. Miele! Marco D. Santambrogio! Politecnico di Milano! 2
Advanced Topics on Heterogeneous System Architectures HSA Foundation! Politecnico di Milano! Seminar Room (Bld 20)! 15 December, 2017! Antonio R. Miele! Marco D. Santambrogio! Politecnico di Milano! 2
Final Lecture. A few minutes to wrap up and add some perspective
 Final Lecture A few minutes to wrap up and add some perspective 1 2 Instant replay The quarter was split into roughly three parts and a coda. The 1st part covered instruction set architectures the connection
CHAPTER 3 ASYNCHRONOUS PIPELINE CONTROLLER
 84 CHAPTER 3 ASYNCHRONOUS PIPELINE CONTROLLER 3.1 INTRODUCTION The introduction of several new asynchronous designs which provides high throughput and low latency is the significance of this chapter. The
Multicore computer: Combines two or more processors (cores) on a single die. Also called a chip-multiprocessor.
 on a single die. Also called a chip-multiprocessor.") CS 320 Ch. 18 Multicore Computers Multicore computer: Combines two or more processors (cores) on a single die. Also called a chip-multiprocessor. Definitions: Hyper-threading Intel's proprietary simultaneous
CS 320 Ch. 18 Multicore Computers Multicore computer: Combines two or more processors (cores) on a single die. Also called a chip-multiprocessor. Definitions: Hyper-threading Intel's proprietary simultaneous
Micro-Architectural Attacks and Countermeasures
 Micro-Architectural Attacks and Countermeasures Çetin Kaya Koç koc@cs.ucsb.edu Çetin Kaya Koç http://koclab.org Winter 2017 1 / 25 Contents Micro-Architectural Attacks Cache Attacks Branch Prediction Attack
Multiprocessor scheduling, part 1 -ChallengesPontus Ekberg
 Multiprocessor scheduling, part 1 -ChallengesPontus Ekberg 2017-10-03 What is a multiprocessor? Simplest answer: A machine with >1 processors! In scheduling theory, we include multicores in this defnition
GEO BASED ROUTING FOR BORDER GATEWAY PROTOCOL IN ISP MULTI-HOMING ENVIRONMENT
 GEO BASED ROUTING FOR BORDER GATEWAY PROTOCOL IN ISP MULTI-HOMING ENVIRONMENT Duleep Thilakarathne (118473A) Degree of Master of Science Department of Electronic and Telecommunication Engineering University
Analytic Performance Models for Bounded Queueing Systems
 Analytic Performance Models for Bounded Queueing Systems Praveen Krishnamurthy Roger D. Chamberlain Praveen Krishnamurthy and Roger D. Chamberlain, Analytic Performance Models for Bounded Queueing Systems,
CEC 450 Real-Time Systems
 CEC 450 Real-Time Systems Lecture 6 Accounting for I/O Latency September 28, 2015 Sam Siewert A Service Release and Response C i WCET Input/Output Latency Interference Time Response Time = Time Actuation
Module 18: "TLP on Chip: HT/SMT and CMP" Lecture 39: "Simultaneous Multithreading and Chip-multiprocessing" TLP on Chip: HT/SMT and CMP SMT
 TLP on Chip: HT/SMT and CMP SMT Multi-threading Problems of SMT CMP Why CMP? Moore s law Power consumption? Clustered arch. ABCs of CMP Shared cache design Hierarchical MP file:///e /parallel_com_arch/lecture39/39_1.htm[6/13/2012
Embedded Systems Lecture 11: Worst-Case Execution Time. Björn Franke University of Edinburgh
 Embedded Systems Lecture 11: Worst-Case Execution Time Björn Franke University of Edinburgh Overview Motivation Worst-Case Execution Time Analysis Types of Execution Times Measuring vs. Analysing Flow
What are Embedded Systems? Lecture 1 Introduction to Embedded Systems & Software
 What are Embedded Systems? 1 Lecture 1 Introduction to Embedded Systems & Software Roopa Rangaswami October 9, 2002 Embedded systems are computer systems that monitor, respond to, or control an external
Motivation for Parallelism. Motivation for Parallelism. ILP Example: Loop Unrolling. Types of Parallelism
 Motivation for Parallelism Motivation for Parallelism The speed of an application is determined by more than just processor speed. speed Disk speed Network speed... Multiprocessors typically improve the
Ensuring Schedulability of Spacecraft Flight Software
 Ensuring Schedulability of Spacecraft Flight Software Flight Software Workshop 7-9 November 2012 Marek Prochazka & Jorge Lopez Trescastro European Space Agency OUTLINE Introduction Current approach to
Honorary Professor Supercomputer Education and Research Centre Indian Institute of Science, Bangalore
 COMPUTER ORGANIZATION AND ARCHITECTURE V. Rajaraman Honorary Professor Supercomputer Education and Research Centre Indian Institute of Science, Bangalore T. Radhakrishnan Professor of Computer Science
A Feasibility Study for Methods of Effective Memoization Optimization
 A Feasibility Study for Methods of Effective Memoization Optimization Daniel Mock October 2018 Abstract Traditionally, memoization is a compiler optimization that is applied to regions of code with few
Improving Cache Performance and Memory Management: From Absolute Addresses to Demand Paging. Highly-Associative Caches
 Improving Cache Performance and Memory Management: From Absolute Addresses to Demand Paging 6.823, L8--1 Asanovic Laboratory for Computer Science M.I.T. http://www.csg.lcs.mit.edu/6.823 Highly-Associative
Designing Predictable Real-Time and Embedded Systems
 Designing Predictable Real-Time and Embedded Systems Juniorprofessor Dr. Jian-Jia Chen Karlsruhe Institute of Technology (KIT), Germany 0 KIT Feb. University 27-29, 2012 of at thetu-berlin, State of Baden-Wuerttemberg
In examining performance Interested in several things Exact times if computable Bounded times if exact not computable Can be measured
 System Performance Analysis Introduction Performance Means many things to many people Important in any design Critical in real time systems 1 ns can mean the difference between system Doing job expected
DISTRIBUTED REAL-TIME SYSTEMS
 Distributed Systems Fö 11/12-1 Distributed Systems Fö 11/12-2 DISTRIBUTED REAL-TIME SYSTEMS What is a Real-Time System? 1. What is a Real-Time System? 2. Distributed Real Time Systems 3. Predictability
Multithreaded Processors. Department of Electrical Engineering Stanford University
 Lecture 12: Multithreaded Processors Department of Electrical Engineering Stanford University http://eeclass.stanford.edu/ee382a Lecture 12-1 The Big Picture Previous lectures: Core design for single-thread
Predictable hardware: The AURIX Microcontroller Family
 Predictable hardware: The AURIX Microcontroller Family Worst-Case Execution Time Analysis WCET 2013, July 9, 2013, Paris, France Jens Harnisch (Jens.Harnisch@Infineon.com), Infineon Technologies AG, Automotive
PowerVR Hardware. Architecture Overview for Developers
 Public Imagination Technologies PowerVR Hardware Public. This publication contains proprietary information which is subject to change without notice and is supplied 'as is' without warranty of any kind.
Parallel Computing. Parallel Computing. Hwansoo Han
 Parallel Computing Parallel Computing Hwansoo Han What is Parallel Computing? Software with multiple threads Parallel vs. concurrent Parallel computing executes multiple threads at the same time on multiple
Operating Systems: Internals and Design Principles. Chapter 2 Operating System Overview Seventh Edition By William Stallings
 Operating Systems: Internals and Design Principles Chapter 2 Operating System Overview Seventh Edition By William Stallings Operating Systems: Internals and Design Principles Operating systems are those
Chapter 5. Introduction ARM Cortex series
 Chapter 5 Introduction ARM Cortex series 5.1 ARM Cortex series variants 5.2 ARM Cortex A series 5.3 ARM Cortex R series 5.4 ARM Cortex M series 5.5 Comparison of Cortex M series with 8/16 bit MCUs 51 5.1
Lecture: SMT, Cache Hierarchies. Topics: SMT processors, cache access basics and innovations (Sections B.1-B.3, 2.1)
") Lecture: SMT, Cache Hierarchies Topics: SMT processors, cache access basics and innovations (Sections B.1-B.3, 2.1) 1 Thread-Level Parallelism Motivation: a single thread leaves a processor under-utilized
Lecture: SMT, Cache Hierarchies Topics: SMT processors, cache access basics and innovations (Sections B.1-B.3, 2.1) 1 Thread-Level Parallelism Motivation: a single thread leaves a processor under-utilized
Cache Memories. From Bryant and O Hallaron, Computer Systems. A Programmer s Perspective. Chapter 6.
 Cache Memories From Bryant and O Hallaron, Computer Systems. A Programmer s Perspective. Chapter 6. Today Cache memory organization and operation Performance impact of caches The memory mountain Rearranging
4. Hardware Platform: Real-Time Requirements
 4. Hardware Platform: Real-Time Requirements Contents: 4.1 Evolution of Microprocessor Architecture 4.2 Performance-Increasing Concepts 4.3 Influences on System Architecture 4.4 A Real-Time Hardware Architecture
Embedded Systems Dr. Santanu Chaudhury Department of Electrical Engineering Indian Institute of Technology, Delhi
 Embedded Systems Dr. Santanu Chaudhury Department of Electrical Engineering Indian Institute of Technology, Delhi Lecture - 13 Virtual memory and memory management unit In the last class, we had discussed
Real-Time Component Software. slide credits: H. Kopetz, P. Puschner
 Real-Time Component Software slide credits: H. Kopetz, P. Puschner Overview OS services Task Structure Task Interaction Input/Output Error Detection 2 Operating System and Middleware Application Software
Computer Architecture Review. ICS332 - Spring 2016 Operating Systems
 Computer Architecture Review ICS332 - Spring 2016 Operating Systems ENIAC (1946) Electronic Numerical Integrator and Calculator Stored-Program Computer (instead of Fixed-Program) Vacuum tubes, punch cards
Part IV. Chapter 15 - Introduction to MIMD Architectures
 D. Sima, T. J. Fountain, P. Kacsuk dvanced Computer rchitectures Part IV. Chapter 15 - Introduction to MIMD rchitectures Thread and process-level parallel architectures are typically realised by MIMD (Multiple
The Nios II Family of Configurable Soft-core Processors
 The Nios II Family of Configurable Soft-core Processors James Ball August 16, 2005 2005 Altera Corporation Agenda Nios II Introduction Configuring your CPU FPGA vs. ASIC CPU Design Instruction Set Architecture
Basics of Performance Engineering
 ERLANGEN REGIONAL COMPUTING CENTER Basics of Performance Engineering J. Treibig HiPerCH 3, 23./24.03.2015 Why hardware should not be exposed Such an approach is not portable Hardware issues frequently
Error Detection by Code Coverage Analysis without Instrumenting the Code
 Error Detection by Code Coverage Analysis without Instrumenting the Code Erol Simsek, isystem AG Exhaustive testing to detect software errors constantly demands more time within development cycles. Software
MULTIPROCESSORS AND THREAD LEVEL PARALLELISM
 UNIT III MULTIPROCESSORS AND THREAD LEVEL PARALLELISM 1. Symmetric Shared Memory Architectures: The Symmetric Shared Memory Architecture consists of several processors with a single physical memory shared
Challenges of Analyzing Parametric CFD Results. White Paper Published: January
 Challenges of Analyzing Parametric CFD Results White Paper Published: January 2011 www.tecplot.com Contents Introduction... 3 Parametric CFD Analysis: A Methodology Poised for Growth... 4 Challenges of
CIS 1.5 Course Objectives. a. Understand the concept of a program (i.e., a computer following a series of instructions)
") By the end of this course, students should CIS 1.5 Course Objectives a. Understand the concept of a program (i.e., a computer following a series of instructions) b. Understand the concept of a variable
By the end of this course, students should CIS 1.5 Course Objectives a. Understand the concept of a program (i.e., a computer following a series of instructions) b. Understand the concept of a variable
Chapter 6: CPU Scheduling. Operating System Concepts 9 th Edition
 Chapter 6: CPU Scheduling Silberschatz, Galvin and Gagne 2013 Chapter 6: CPU Scheduling Basic Concepts Scheduling Criteria Scheduling Algorithms Thread Scheduling Multiple-Processor Scheduling Real-Time
15-740/ Computer Architecture, Fall 2011 Midterm Exam II
 15-740/18-740 Computer Architecture, Fall 2011 Midterm Exam II Instructor: Onur Mutlu Teaching Assistants: Justin Meza, Yoongu Kim Date: December 2, 2011 Name: Instructions: Problem I (69 points) : Problem