FATHOM Model for Florida Bay: Overview and Calibration/Verification Exercise
|
|
|
- Tracy Daniel
- 5 years ago
- Views:
Transcription
1 FATHOM Model for Florida : Overview and Calibration/Verification Exercise October 2-3, 13 Frank Marshall, Bill Nuttle, Jack Cosby Flux Accounting and Tidal Hydrology at the Ocean Margin The FATHOM Model Version 6.

2 G. E. P. Box Essentially, all models are wrong, but some models are useful. Box, G. E. P., and Draper, N. R., (1987), Empirical Model Building and Response Surfaces
3 Outline of Presentation Overview of FATHOM Update on FATHOM calibration/verification (calver) project Coupling FATHOM to hydrologic models
4 What is FATHOM? Dynamic, spatially explicit, mass-balance salinity and water quality model of Florida Accounts for water and salt budgets in each of 4 well-mixed basins Designed to investigate circulation, salinity, and water quality responses in Florida to runoff, climate, and tides, given the bathymetry


5 Model Structure The banks and shoals effectively divide Florida into a network of interconnected basins Exchange between the basins is limited / controlled by the shallow banks and the presence of islands in the bay. Based on bathymetric data for the bay, 4 distinct basins form the basic structure and domain of the FATHOM model. Transfer of water and solutes between basins is controlled by the bathymetry of the banks.
6 FATHOM groups Model Goodnessof-fit Observed flows as input Simulated vs Observed Salinity
7 Model Goodness-offit observed flow inputs Region Region Region Salinity (psu) Joe Fathom 13 SERC Salinity (psu) Long Sound Fathom 7 SERC 8 4 Region Salinity (psu) Little Blackwater Sound Fathom 8 SERC Salinity (psu) Manatee Fathom 6 SERC Salinity (psu) Little Madeira Fathom 14-1 SERC 11 Salinity (psu) Barnes Sound Fathom SERC Efficiency % All Seasons Wet Seasons Dry Seasons Salinity (psu) Blackwater Sound Fathom 9 SERC Ave sim-obs All Seasons Wet Seasons Dry Seasons
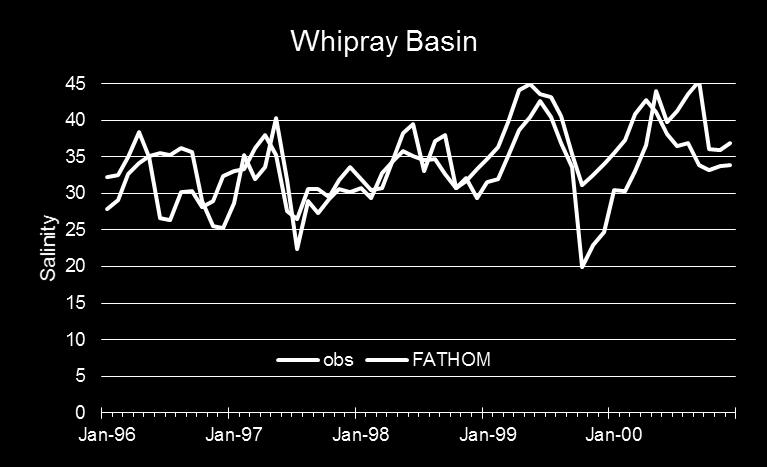
8 Model Goodness-offit observed flow inputs Region Region Region Salinity (psu) Duck Key Fathom 47 SERC Salinity (psu) Park Key Fathom 1 SERC 23 4 Region Salinity (psu) Terrapin Fathom -26 SERC Salinity (psu) Whipray Basin Fathom 34 SERC Salinity (psu) Butternut Key Fathom SERC 24 Salinity (psu) Garfield/Rankin Fathom 37 SERC Efficiency % All Seasons Wet Seasons Dry Seasons Ave sim-obs All Seasons Wet Seasons Dry Seasons
9 Model Goodness-offit observed flow inputs Region Region Region Salinity (psu) Captain Key Fathom 19 SERC Salinity (psu) Porpoise Lake Fathom 29 SERC Region Salinity (psu) Murray Key Fathom 42 SERC Salinity (psu) Johnson Key Basin Fathom 39 SERC Salinity (psu) Peterson Keys Fathom 3 SERC Salinity (psu) Rabbit Key Basin Fathom 38 SERC Efficiency % All Seasons Wet Seasons Dry Seasons Salinity (psu) Twin Key Basin Fathom 32 SERC Ave sim-obs All Seasons Wet Seasons Dry Seasons
10 Applications of FATHOM Using Model-Produced Inputs ENP CESI project used SFWMM calver flows as input 12 SFWMD Florida MFL -year review used SFWMM calver flows as input and other CERP alternatives Results: FATHOM salinity output had some issues For these reason this calver exercise was commissioned
11 Progress To-date: FATHOM Florida Salinity Model Calibration and Verification Concept: Improve boundary conditions, freshwater distribution, and bathymetry before updating Manning coefficient Steps: Assemble SFWMM cal/ver data (completed) Improve western boundary conditions regressions (completed) Review freshwater input distribution along north shore (completed) Review treatment of shallowest depth classes (bathymetry) (completed) Review Manning s N between basins, modify as needed (9%) Use calibrated model in example run (%) Document upgrades (%)
12 Step 1: Assemble SFWMM calver data SFWMM calver data stage and flow: For model goodness-of-fit evaluations: data used to match availability of USGS creek flows Other data used: SERC salinity, USGS creek flows, ENP stage, wind, sea surface elevation, rain (Flamingo, Tavernier, Royal Palm)
13 Step 2: Improve western boundary New Models conditions regressions R 2 for previous model SERC = (1.47*p33_depth) - (.2*T21lag2) - (2.31 * kwwatlevlag2), R 2 =.7 (.6) SERC26 = (.1*T21lag2) - (-1.91*kwwatlevlag2) - (1.*p33_depth) - (1.62*P33_depthlag3), R 2 =.74 (.6) SERC27 = (.2*T21lag2) - (1.13*kwwatlevlag3) - (1.83*P33_depthlag1) + (1.8*kwwatlev), R 2 =.6 (.) SECR28 = (3.3*P33_depthlag2) + (.*vwndmialag1) - (.33*vwndkwlag1), R 2 =.6 (.42)
14 Step 3: Review freshwater input distribution along north shore Reconnaissance trip to verify locations and conditions for freshwater inputs to Florida Analyzed and interpreted Google Earth satellite imagery Reviewed and analyzed USGS observed creek flow data Evaluated SFWMM calver structure data total SFWMM flows are about ½ of USGS observed total flows for 1996-
15 Step 3, cont.: Flows from SFWMM are only similar for seasonal patterns to observed flows total SFWMM flows are about ½ of observed flows LMDBQ1 LMDBQ2 LMDBQ S197 JOEBQ2 JOEBQ1 Reg 3 Reg 4 Reg Reg 2 Reg 1 1 Reg 6 Reg 11 Reg 9 Reg 8 Reg 7 FATHOM Runoff Regions (for model inputs)
16 Step 3, cont.: SFWMM was calibrated to stage, not flow; so SFWMM calver stage data is best SFWMM output Best flow data are USGS observed creek flows Therefore - MLR models of observed creek flows prepared from observed stage data MLR-modeled flows were used with SFWMM calver stage data to produce calver flow simulations, which were input to FATHOM
17 USGS Creek Flows Monitoring began in 1996 at: Highway Creek Trout Creek Mud Creek Taylor River Mouth McCormick Creek These data used for MLR model development Monitoring at other stations began in 1999 and later Data from used for model development
18 Observed USGS Flow Data Receiving Water USGS Flow Station SFWMM X X X X X X X X SERC Data X X X X X X X X X X X X X X X X X X X Manatee Manatee X X X X X X X X X Long Sound Highway Creek X X X X X X X X X X X X X X X X Long Sound Oregon Creek X X X X X X X X X X X Long Sound Stillwater Creek X X X X X X X X X X X X X Long Sound Highway Creek X X X X X X X X X X X Little Madeira Homestead X X X X X X Little Madeira Taylor River Mouth X X X X X X X X X X X X X X X X Joe JB_1e X X X X X X X X Joe JB_2E X X X X X X X X X X X Joe JB_c X X X Joe JB_8w X X X X X X X X X X X Eagle Key Basin Mud Creek X X X X X X X X X X X X X X X X Deer Key Basin Trout Creek X X X X X X X X X X X X X X X X Rankin Lake Alligator Creek X X X X X Terrapin Mccormack Creek X X X X X X X X X X X X X X
 = -")

19 Flow Models - WHC Highway Creek (WHC) is one of 4 Long Sound inputs Region 2 WHC (cfs) = *CP + 7.*EVER *G *NP6-4.9Ever6lag1 R 2 =.64, RMSE = 32 cfs, N = 16
 Trout Creek (cfs) = -8.1 + 331.*EVER7 + 33.4*P3-9.")

20 Flow Models Trout Creek Trout Creek is Joe discharge to Deer Key Basin (Region 3) Trout Creek (cfs) = *EVER *P3-9.3*NP *P *cplag1-31.4*Ever7lag1-6.2*G3273lag *NP46lag3 R 2 =.71, RMSE =17 cfs, N = 16 NOTE: Y-axis scale is different than others
 Mud Creek (cfs) = 9.")

21 Flow Models Mud Creek Mud Creek is input to Eagle Key Basin (Region ) Mud Creek (cfs) = *CP *P3-21.1*NP *NP62lag2-4.9*P33lag1-33.6*P37lag2 R 2 =.8, = 26 cfs, N = 16.
 = -26.4 + 4.3*E146 + 32.8*EVER7 + 44.7*P3-28.3*NP62 -.9*P33lag1 R 2 =.8, RMSE =.")
22 Flow Models Taylor River Mouth Taylor River Mouth is one of 2 inputs to Little Madeira (Region 6) tr_mouth (cfs) = *E *EVER *P3-28.3*NP62 -.9*P33lag1 R 2 =.8, RMSE =.3 cfs, N = 16
23 Flow Models McCormick Creek McCormick Creek is input to Terrapin (Region 8) McCormick Creek (cfs) = *E *P3-4.6*P *R *P33lag1 R 2 =.62, RMSE = 37.7 cfs, N = 16.
 assumed to be equal to Trout Creek flow to begin, and adjusted based on FATHOM salinity output Little Madeira (Region 4) = 1.")
24 Step 3: Regional Flow Inputs Factors were used to simulate some regional flows based on observed post 1996 data Region 1 inputs (S197) direct use of SFWMM calver data Long Sound (Region 2) = 2.4*WHC Joe (Region 3) assumed to be equal to Trout Creek flow to begin, and adjusted based on FATHOM salinity output Little Madeira (Region 4) = 1.7*Taylor River Mouth Region = Mud Creek Terrapin (Region 8) = Mccormack Creek Rankin Lake (Region 11) = 1.*McCormack Creek Regions 3, 7,9,, and 12 have no inflows


25 Modeling Issues with Observed and Model-Produced Flows - Observed USGS data include many negative flow values - MLR flow models from stage as independent variable also produce negative flows - FATHOM cannot handle negative flows - So: all negative flows are set equal to before input to FATHOM Note scale difference
26 Step 4: Review treatment of shallowest depth classes became part of Step
27 Step : Review Manning s N between basins, modify as needed Used best available information on flows to set N USGS observed data Concept for variation of N by depth class ( depth classes: Un-calibrated N distribution:. for all depth classes Shallowest shoals: highest resistance to flow, highest N, lowest flux (flow per unit time) Deepest shoals: lowest resistance to flow, lowest N, highest flux Mid-depth transition from high N to low N values New distribution
28 Manning Equation Coefficient Manning Equation Coefficient Depth (ft) Region 1 Region 2 Region
29 Final Step Used best Manning s N distribution FATHOM used in iterative fashion Flows modified until salinity was reasonably similar to observed salinity (1996-) In the end, total calver flows = 1.4 * USGS flows


30 Region


31 Region


32 Region


33 Region


34 Region

35 ern Region
36 Observed vs Simulated Calver, 1996, N=6 Region Basin SERC station Observed Average FATHOM Average R-sq RMSE Mean Absolute Error Little Blackwater Sound Blackwater Sound Barnes Sound Manatee s Long Sound Joe Little Madeira Terrapin Rankin Lake Whipray Basin Duck Key Basin Park Key Basin Butternut Key Basin Captain Key Basin Porpoise Key Basin Peterson Key Basin Rabbit Key Johnson Key
37 Work Remaining After finalizing details (i.e. some additional runs to improve goodness-of-fit), use SFWMM input for a CERP run Compare output to observed data Can FATHOM detect change?
38 Work Remaining Current FATHOM Documentation Appendix B to be updated
39 Other Potential Model-Produced Inputs TIME stage BISECT flows, stage RSM / RSNSM MIKE SHE Paleo data Others?
40 Coupling FATHOM with TIME Flows TIME flows for primary creeks used like observed input data with best Manning s N values (depth-class distribution) Output compared for 1996-
41 MAE: USGS = 6. Calver = 7.2 TIME = 4.9 MAE: USGS = 4.2 Calver = 4.1 TIME = 4. MAE: USGS = 6.4 Calver = 4.9 TIME = 4. MAE: USGS =.4 Calver = 4. TIME =.4
42 Unresolved Issues for future work Better fix for negative flows Expand FATHOM domain upstream until flow is essentially unidirectional Requires re-programming of FATHOM new code, not too difficult Extension of calver stage data to allows for 9 years of data comparison instead of 4 Revisions to evaporation may be needed
43 Overall Summary of Work Boundary salinity models upgraded Input flows upgraded Manning N upgraded Negative flows handled Comparisons to previous SFWMM coupled out put indicates that these upgrades have significantly improved FATHOM output using SFWMM input data
44 Summary some details Low confidence in SFWMM flows do not recommend using them Stage-to-flow models worked much better use these To better handle negative flows, structural improvements to the model are necessary Additional improvements may be possible with final iterations, review of output, and analysis by other members of team (Nuttle, Cosby)
45 Initial Findings region only responds to Long Sound flows Region responds mostly to outputs from Joe and Little Madeira, may respond slightly to flows from McCormack and Alligator Creeks; also rainfall Region responds (ex: Whipray Basin) mostly to flows from McCormack and Alligator Creeks ern Region also appears to respond somewhat to flows from McCormack and Alligator Creeks


46 THANKS! Flux Accounting and Tidal Hydrology at the Ocean Margin The FATHOM Model Version 6.
20 April Re: South Florida Coastal Water Quality Monitoring Network Oct. Dec Quarterly Report for SFWMD Contract #
 Southeast Environmental Research Center OE-148 Florida International University, Miami, FL 33199 305-348-3095, 305-348-4096 fax, http://serc.fiu.edu Michael Wright SFWMD Water Quality Analysis Division
South Florida Coastal Water Quality Monitoring Network Jan. - Mar Quarterly Report for SFWMD Contract
 Florida International University FIU Digital Commons SERC Research Reports Southeast Environmental Research Center 5-12-2008 South Florida Coastal Water Quality Monitoring Network Jan. - Mar. 2007 Quarterly
The CaMa-Flood model description
 Japan Agency for Marine-Earth cience and Technology The CaMa-Flood model description Dai Yamazaki JAMTEC Japan Agency for Marine-Earth cience and Technology 4 th ep, 2015 Concepts of the CaMa-Flood development
MIKE 21 Flow Model FM. Sand Transport Module. Step-by-step training guide: Coastal application
 MIKE 21 Flow Model FM Sand Transport Module Step-by-step training guide: Coastal application MIKE 2017 DHI headquarters Agern Allé 5 DK-2970 Hørsholm Denmark +45 4516 9200 Telephone +45 4516 9333 Support
Introduction to MIKE FLOOD
 Introduction to MIKE FLOOD HYDROEUROPE, Sophia-Antipolis, February 2011 Julie Landrein, DHI Denmark Introduction to MIKE FLOOD - Introduction to MIKE FLOOD - 1D Modelling: MIKE 11, MIKE URBAN - 2D Modelling:
MIKE 21 Flow Model FM. Mud Transport Module. Step-by-step training guide
 MIKE 21 Flow Model FM Mud Transport Module Step-by-step training guide MIKE 2017 DHI headquarters Agern Allé 5 DK-2970 Hørsholm Denmark +45 4516 9200 Telephone +45 4516 9333 Support +45 4516 9292 Telefax
Comparison of multiple point and single point calibration performance for the Saginaw River Watershed
 Comparison of multiple point and single point calibration performance for the Saginaw River Watershed Fariborz Daneshvar, A 1. Pouyan Nejadhashemi 1, Matthew R. Herman 1 1 Department of Biosystems and
2D Large Scale Automated Engineering for FEMA Floodplain Development in South Dakota. Eli Gruber, PE Brooke Conner, PE
 2D Large Scale Automated Engineering for FEMA Floodplain Development in South Dakota Eli Gruber, PE Brooke Conner, PE Project Acknowledgments FEMA Region 8 Staff: Brooke Conner, PE Casey Zuzak, GISP Ryan
2. AREAL PHOTOGRAPHS, SATELLITE IMAGES, & TOPOGRAPHIC MAPS
 LAST NAME (ALL IN CAPS): FIRST NAME: 2. AREAL PHOTOGRAPHS, SATELLITE IMAGES, & TOPOGRAPHIC MAPS Instructions: Refer to Exercise 3 in your Lab Manual on pages 47-64 to answer the questions in this work
Uncertainty Analysis: Parameter Estimation. Jackie P. Hallberg Coastal and Hydraulics Laboratory Engineer Research and Development Center
 Uncertainty Analysis: Parameter Estimation Jackie P. Hallberg Coastal and Hydraulics Laboratory Engineer Research and Development Center Outline ADH Optimization Techniques Parameter space Observation
The most recent CMS-Wave code developed is Version 3.2. Several new capabilities and advanced features in this version include:
 B8. Using CMS-Wave The most recent CMS-Wave code developed is Version 3.2. Several new capabilities and advanced features in this version include: Full-plane wind-generation of waves Automatic wave run-up
MIKE 21/3 Coupled Model FM. Step-by-step training guide: Coastal application
 MIKE 21/3 Coupled Model FM Step-by-step training guide: Coastal application MIKE 2017 DHI headquarters Agern Allé 5 DK-2970 Hørsholm Denmark +45 4516 9200 Telephone +45 4516 9333 Support +45 4516 9292
October 27, Jim Ruff Manager Mainstem Passage and River Operations
 Bill Bradbury Chair Oregon Henry Lorenzen Oregon W. Bill Booth Idaho James A. Yost Idaho Jennifer Anders Vice Chair Montana Pat Smith Montana Tom Karier Washington Phil Rockefeller Washington October 27,
Modeling Khowr-e Musa Multi-Branch Estuary Currents due to the Persian Gulf Tides Using NASIR Depth Average Flow Solver
 Journal of the Persian Gulf (Marine Science)/Vol.1/No.1/September 2010/6/45-50 Modeling Khowr-e Musa Multi-Branch Estuary Currents due to the Persian Gulf Tides Using NASIR Depth Average Flow Solver Sabbagh-Yazdi,
MIKE 21 Flow Model FM. Parallelisation using GPU. Verification report
 MIKE 21 Flow Model FM Parallelisation using GPU Verification report MIKE by DHI 2014 DHI headquarters Agern Allé 5 DK-2970 Hørsholm Denmark +45 4516 9200 Telephone +45 4516 9333 Support +45 4516 9292 Telefax
MIKE 21 & MIKE 3 Flow Model FM. Hydrodynamic Module. Step-by-step training guide
 MIKE 21 & MIKE 3 Flow Model FM Hydrodynamic Module Step-by-step training guide MIKE 2017 DHI headquarters Agern Allé 5 DK-2970 Hørsholm Denmark +45 4516 9200 Telephone +45 4516 9333 Support +45 4516 9292
CHAPTER 7 FLOOD HYDRAULICS & HYDROLOGIC VIVEK VERMA
 CHAPTER 7 FLOOD HYDRAULICS & HYDROLOGIC VIVEK VERMA CONTENTS 1. Flow Classification 2. Chezy s and Manning Equation 3. Specific Energy 4. Surface Water Profiles 5. Hydraulic Jump 6. HEC-RAS 7. HEC-HMS
Overview of the SMS (v11.0)
") Overview of the SMS (v11.0) Mitchell Brown Civil Engineering Technician Mitchell.E.Brown@erdc.dren.mil June 11-15, 2012 CMS Shark River Inlet, NJ CPT Grays Harbor, WA Wood Wood chips Flour Other US Army
Overview of the SMS (v11.0) Mitchell Brown Civil Engineering Technician Mitchell.E.Brown@erdc.dren.mil June 11-15, 2012 CMS Shark River Inlet, NJ CPT Grays Harbor, WA Wood Wood chips Flour Other US Army
v TUFLOW-2D Hydrodynamics SMS Tutorials Time minutes Prerequisites Overview Tutorial
 v. 12.2 SMS 12.2 Tutorial TUFLOW-2D Hydrodynamics Objectives This tutorial describes the generation of a TUFLOW project using the SMS interface. This project utilizes only the two dimensional flow calculation
COMPARISON OF NUMERICAL HYDRAULIC MODELS APPLIED TO THE REMOVAL OF SAVAGE RAPIDS DAM NEAR GRANTS PASS, OREGON
 COMPARISON OF NUMERICAL HYDRAULIC MODELS APPLIED TO THE REMOVAL OF SAVAGE RAPIDS DAM NEAR GRANTS PASS, OREGON Jennifer Bountry, Hydraulic Engineer, Bureau of Reclamation, Denver, CO, jbountry@do.usbr.gov;
MIKE 21 FLOW MODEL FM
 MIKE 21 FLOW MODEL FM Hydrodynamic Module User Guide DHI Software 2005 Software development by : xxx Written by: AJS C:\MIKEZero\Dev\source\Manuals\MIKE_FM\HD\MIKE_FM_HD_Cover.fm 29 July 2005 10:43 am
River inundation modelling for risk analysis
 River inundation modelling for risk analysis L. H. C. Chua, F. Merting & K. P. Holz Institute for Bauinformatik, Brandenburg Technical University, Germany Abstract This paper presents the results of an
v SMS 11.2 Tutorial ADCIRC Analysis Prerequisites Overview Tutorial Time minutes
 v. 11.2 SMS 11.2 Tutorial ADCIRC Analysis Objectives This lesson reviews how to prepare a mesh for analysis and run a solution for ADCIRC. It will cover preparation of the necessary input files for the
Verification and Validation of HEC-RAS 5.1
 Verification and Validation of HEC-RAS 5.1 Gary Brunner 1, P.E., D. WRE, M.ASCE Dr. Alex Sanchez 1 Dr. Tom Molls 2 Dr. David Parr 3 1. USACE Hydrologic Engineering Center, Davis, CA 2. David Ford Consulting
GPU - Next Generation Modeling for Catchment Floodplain Management. ASFPM Conference, Grand Rapids (June 2016) Chris Huxley
 Chris Huxley") GPU - Next Generation Modeling for Catchment Floodplain Management ASFPM Conference, Grand Rapids (June 2016) Chris Huxley Presentation Overview 1. What is GPU flood modeling? 2. What is possible using
GPU - Next Generation Modeling for Catchment Floodplain Management ASFPM Conference, Grand Rapids (June 2016) Chris Huxley Presentation Overview 1. What is GPU flood modeling? 2. What is possible using
Agenda. Background Connecting to model Running the model Viewing results Running what if scenarios
 Agenda Background Connecting to model Running the model Viewing results Running what if scenarios Background Don Pedro Reservoir Temperature model Danish Hydraulic Institute (DHI) MIKE software 3 dimensional
Efficiency and Accuracy of Importing HEC RAS Datafiles into PCSWMM and SWMM5
 5 Efficiency and Accuracy of Importing HEC RAS Datafiles into PCSWMM and SWMM5 Karen Finney, Rob James, William James and Tiehong Xiao An advantage of USEPA s SWMM5 is its capability to dynamically model
AK Hydro Data Editing Standards
 AK Hydro Data Editing Standards as defined by The Alaska Hydrography Technical Working Group I. General Requirements A. Minimum Mapping Units 1. Lake, Pond, Swamp, Glacier, Ice and 2D Stream polygons must
GMS 8.3 Tutorial MODFLOW LAK Package Use the MODFLOW Lake (LAK3) package to simulate mine dewatering
 package to simulate mine dewatering") v. 8.3 GMS 8.3 Tutorial Use the MODFLOW Lake (LAK3) package to simulate mine dewatering Objectives Learn the steps involved in using the MODFLOW Lake (LAK3) package interface in GMS. Use the LAK3 package
v. 8.3 GMS 8.3 Tutorial Use the MODFLOW Lake (LAK3) package to simulate mine dewatering Objectives Learn the steps involved in using the MODFLOW Lake (LAK3) package interface in GMS. Use the LAK3 package
How to correct and complete discharge data Main text
 Table of Contents. General 2. Completion from another record at the same station 3. Interpolating discharge gaps of short duration 4. Interpolating gaps during recessions 5. Interpolation using regression
MODFLOW Lake Package GMS TUTORIALS
 GMS TUTORIALS MODFLOW Lake Package This tutorial illustrates the steps involved in using the Lake (LAK3) Package as part of a MODFLOW simulation. The Lake Package is a more sophisticated alternative to
Use of evaporation and streamflow data in hydrological model calibration
 Use of evaporation and streamflow data in hydrological model calibration Jeewanthi Sirisena* Assoc./Prof. S. Maskey Prof. R. Ranasinghe IHE-Delft Institute for Water Education, The Netherlands Background
1. Introduction. 2. Area of Study. Volume 6 Issue 10, October Mahdi Mustafa Ali 1, Alaa S. Mahdi 2
 Determining and Measuring the Shift of the Tigris Riverbanks at the Baghdad University Camp between the Years 1962-2013 Using the Geometrical Method and GIS Mahdi Mustafa Ali 1, Alaa S. Mahdi 2 1 Surveying
Representing Detail in Large Hydraulic Models: Lower Thames and Humber Estuary. Neil Hunter, Kevin Haseldine and Matthew Scott
 Representing Detail in Large Hydraulic Models: Lower Thames and Humber Estuary Neil Hunter, Kevin Haseldine and Matthew Scott Overview What do we mean by detail? Lower Thames Humber Estuary How is software
A Tool for Rapid Configuration of A River Model
 A Tool for Rapid Configuration of A River Model Cheryl Ann Blain, Robert S. Linzell, Alan D. Weidemann and Paul E. Lyon Oceanography Division, Code 7322 Naval Research Laboratory, Stennis Space Center,
Comparing HEC-RAS v5.0 2-D Results with Verification Datasets
 Comparing HEC-RAS v5.0 2-D Results with Verification Datasets Tom Molls 1, Gary Brunner 2, & Alejandro Sanchez 2 1. David Ford Consulting Engineers, Inc., Sacramento, CA 2. USACE Hydrologic Engineering
2D Model Implementation for Complex Floodplain Studies. Sam Crampton, P.E., CFM Dewberry
 2D Model Implementation for Complex Floodplain Studies Sam Crampton, P.E., CFM Dewberry 2D Case Studies Case Study 1 Rain-on-Grid 2D floodplain simulation for unconfined flat topography in coastal plain
Initial Analysis of Natural and Anthropogenic Adjustments in the Lower Mississippi River since 1880
 Richard Knox CE 394K Fall 2011 Initial Analysis of Natural and Anthropogenic Adjustments in the Lower Mississippi River since 1880 Objective: The objective of this term project is to use ArcGIS to evaluate
v SMS 12.2 Tutorial ADCIRC Analysis Requirements Time minutes Prerequisites Overview Tutorial
 v. 12.2 SMS 12.2 Tutorial Analysis Objectives This tutorial reviews how to prepare a mesh for analysis and run a solution for. It will cover preparation of the necessary input files for the circulation
RESCDAM DEVELOPMENT OF RESCUE ACTIONS BASED ON DAM BREAK FLOOD ANALYSI A PREVENTION PROJECT UNDER THE EUROPEAN COMMUNITY ACTION PROGRAMME
 RESCDAM DEVELOPMENT OF RESCUE ACTIONS BASED ON DAM BREAK FLOOD ANALYSI A PREVENTION PROJECT UNDER THE EUROPEAN COMMUNITY ACTION PROGRAMME 1-DIMENSIONAL FLOW SIMULATIONS FOR THE KYRKÖSJÄRVI DAM BREAK HAZARD
5PRESENTING AND DISSEMINATING
 5PRESENTING AND DISSEMINATING INFORMATION This chapter presents information and guidance on how to present and disseminate marine water quality monitoring data to the program s intended audience. Section
Day 1. HEC-RAS 1-D Training. Rob Keller and Mark Forest. Break (9:45 am to 10:00 am) Lunch (12:00 pm to 1:00 pm)
 Lunch (12:00 pm to 1:00 pm)") Day 1 HEC-RAS 1-D Training Rob Keller and Mark Forest Introductions and Course Objectives (8:00 am to 8:15 am) Introductions: Class and Content Module 1 Open Channel Hydraulics (8:15 am to 9:45 am) Lecture
Day 1 HEC-RAS 1-D Training Rob Keller and Mark Forest Introductions and Course Objectives (8:00 am to 8:15 am) Introductions: Class and Content Module 1 Open Channel Hydraulics (8:15 am to 9:45 am) Lecture
Integrated Groundwater Surface Water Modeling of the Green Swamp, Florida
 Integrated Groundwater Surface Water Modeling of the Green Swamp, Florida Data Management Challenges and Opportunities Peter J. Singhofen, P.E. Gordon L. McClung, P.E Streamline Technologies, Inc. 1900
1.0 INTRODUCTION. Subject: Peaking Analysis
 Memo Date: Friday, Project: NorthWestern Energy Operations Modeling of Hydros To: John Vandaveer, NorthWestern Energy From: Rick Miller, HDR Subject: Peaking Analysis 1.0 INTRODUCTION The goal of this
UNDERSTAND HOW TO SET UP AND RUN A HYDRAULIC MODEL IN HEC-RAS CREATE A FLOOD INUNDATION MAP IN ARCGIS.
 CE 412/512, Spring 2017 HW9: Introduction to HEC-RAS and Floodplain Mapping Due: end of class, print and hand in. HEC-RAS is a Hydrologic Modeling System that is designed to describe the physical properties
Objectives This tutorial will introduce how to prepare and run a basic ADH model using the SMS interface.
 v. 12.1 SMS 12.1 Tutorial Objectives This tutorial will introduce how to prepare and run a basic ADH model using the SMS interface. Prerequisites Overview Tutorial Requirements ADH Mesh Module Scatter
Provided by the author(s) and NUI Galway in accordance with publisher policies. Please cite the published version when available.
 and NUI Galway in accordance with publisher policies. Please cite the published version when available.") Provided by the author(s) and NUI Galway in accordance with publisher policies. Please cite the published version when available. Title Galway Bay bathymetry comparison from Admiralty Chart and LiDAR datasets.
Provided by the author(s) and NUI Galway in accordance with publisher policies. Please cite the published version when available. Title Galway Bay bathymetry comparison from Admiralty Chart and LiDAR datasets.
Appendix E. HEC-RAS and HEC-Ecosystem Functions Models
 Appendix E HEC-RAS and HEC-Ecosystem Functions Models 1 Appendix E: Modeled Reaches for the Connecticut River Watershed application of HEC-RAS Separate from the report for the Decision Support System of
INTERNATIONAL JOURNAL OF CIVIL AND STRUCTURAL ENGINEERING Volume 2, No 3, 2012
 INTERNATIONAL JOURNAL OF CIVIL AND STRUCTURAL ENGINEERING Volume 2, No 3, 2012 Copyright 2010 All rights reserved Integrated Publishing services Research article ISSN 0976 4399 Efficiency and performances
v RMA2 Steering Module SMS Tutorials Requirements Time Prerequisites Objectives
 v. 12.2 SMS 12.2 Tutorial Objectives Learn how to use revision cards for a spin down simulation in RMA2. Prerequisites Overview Tutorial RMA2 Tutorial Requirements RMA2 GFGEN Mesh Module Time 30 60 minutes
v SMS 11.1 Tutorial BOUSS2D Prerequisites Overview Tutorial Time minutes
 v. 11.1 SMS 11.1 Tutorial BOUSS2D Objectives This lesson will teach you how to use the interface for BOUSS-2D and run the model for a sample application. As a phase-resolving nonlinear wave model, BOUSS-2D
Using 2D Schemes to Model Energy Losses at Structures and Bends Beware of Pretty Images!
 Using 2D Schemes to Model Energy Losses at Structures and Bends Beware of Pretty Images! Bill Syme BMT WBM Software Business Manager 2D: Looks impressive, but is it accurate? 2 Form Losses Energy dissipated
MIKE 21 & MIKE 3 FLOW MODEL FM. Hydrodynamic Module. Short Description
 MIKE 21 & MIKE 3 FLOW MODEL FM Short Description MIKE213_HD_FM_Short_Description.docx/ AJS/EBR/2011Short_Descriptions.lsm/2011-06-10 MIKE 21 & MIKE 3 FLOW MODEL FM Agern Allé 5 DK-2970 Hørsholm Denmark
Instruction with Hands-on Practice: Grid Generation and Forcing
 Instruction with Hands-on Practice: Grid Generation and Forcing Introduction For this section of the hands-on tutorial, we will be using a merged dataset of bathymetry points. You will need the following
A Framework for Incorporating Uncertainty Sources in SWAT Modeling
 A Framework for Incorporating Uncertainty Sources in SWAT Modeling Haw Yen X. Wang, D. G. Fontane, R. D. Harmel, M. Arabi July 30, 2014 2014 International SWAT Conference Pernambuco, Brazil Outline Overview
DATABASE ON SALINITY PATTERNS IN FLORIDA BAY *
 DATABASE ON SALINITY PATTERNS IN FLORIDA BAY * N. Rishe, M. Chekmasov, M. Chekmasova, D. Hernandez, A. Roque, N. Terekhova, A. Zhyzhkevych High Performance Database Research Center, School of Computer
RegCM-ROMS Tutorial: Introduction to ROMS Ocean Model
 RegCM-ROMS Tutorial: Introduction to ROMS Ocean Model Ufuk Utku Turuncoglu ICTP (International Center for Theoretical Physics) Earth System Physics Section - Outline Outline Introduction Grid generation
Appendix B. Figure 1. Canal System and Baseline Development
 Survey Tide Correction Program Conceptual Description Appendix B The Survey Tide Correction program developed in the University of Florida Coastal and Oceanographic Engineering Department by Bill Miller
Field Data Recovery in Tidal System Using Artificial Neural Networks (ANNs)
") Field Data Recovery in Tidal System Using Artificial Neural Networks (ANNs) by Bernard B. Hsieh and Thad C. Pratt PURPOSE: The field data collection program consumes a major portion of a modeling budget.
Field Data Recovery in Tidal System Using Artificial Neural Networks (ANNs) by Bernard B. Hsieh and Thad C. Pratt PURPOSE: The field data collection program consumes a major portion of a modeling budget.
v CMS-Flow SMS Tutorials Requirements Time Prerequisites Objectives
 v. 12.2 SMS 12.2 Tutorial Objectives This lesson demonstrates how to prepare a grid and run a solution using. Prerequisites SMS Overview Requirements Map Module Cartesian Grid Module Scatter Module Time
WRAP-HYD. Initial Manipulations of IN and/or EV Records
 WRAP- The purpose of WRAP- is to facilitate developing hydrology-related input data for WRAP-SIM. The rology data program provides a set of optional routines to read, modify, and create files of naturalized
Hydraulics and Floodplain Modeling Modeling with the Hydraulic Toolbox
 v. 9.1 WMS 9.1 Tutorial Hydraulics and Floodplain Modeling Modeling with the Hydraulic Toolbox Learn how to design inlet grates, detention basins, channels, and riprap using the FHWA Hydraulic Toolbox
HEC-RAS. A Tutorial (Model Development of a Small Flume)
") HEC-RAS A Tutorial (Model Development of a Small Flume) HEC-RAS Hydraulic Engineering Center:River Analysis System 1-D step backwater model Utilizes energy equation to compute water surface elevation for
HEC-RAS A Tutorial (Model Development of a Small Flume) HEC-RAS Hydraulic Engineering Center:River Analysis System 1-D step backwater model Utilizes energy equation to compute water surface elevation for
MLEP Intermediate GPS Workshop Exercise Two Using Maps
 During this exercise, you will scale coordinates from a map and enter them into the GPS receiver. This requires a ruler (provided) and all calculations require a paper and pencil. During this exercise,
Aswani K. Volety, Michael Savarese, Greg Tolley, Lesli Haynes, Amanda Booth; Coastal Watershed Institute,
 Aswani K. Volety, Michael Savarese, Greg Tolley, Lesli Haynes, Amanda Booth; Coastal Watershed Institute, Florida Gulf Coast University William Arnold; Florida Wildlife Research Institute Patricia Goodman,
MEMORANDUM. Corona Subdivision XP Storm Evaluation. Date: March 5, Curt Bates, City of Petaluma. David S. Smith, P.E., WEST Consultants, Inc.
 MEMORANDUM Project: Corona Subdivision XP Storm Evaluation Subject: Results Summary Date: March 5, 2013 To: Curt Bates, City of Petaluma No. C056132 EXP. 12/31/14 From: David S. Smith, P.E., WEST Consultants,
Prof. B.S. Thandaveswara. The computation of a flood wave resulting from a dam break basically involves two
 41.4 Routing The computation of a flood wave resulting from a dam break basically involves two problems, which may be considered jointly or seperately: 1. Determination of the outflow hydrograph from the
Estimation of Evapotranspiration Over South Florida Using Remote Sensing Data. Shafiqul Islam Le Jiang Elfatih Eltahir
 Estimation of Evapotranspiration Over South Florida Using Remote Sensing Data Shafiqul Islam Le Jiang Elfatih Eltahir Outline Introduction Proposed methodology Step-by by-step procedure Demonstration of
MIKE 3 Flow Model FM. MIKE ECO Lab Module. Step-by-step training guide
 MIKE 3 Flow Model FM MIKE ECO Lab Module Step-by-step training guide MIKE 2017 DHI headquarters Agern Allé 5 DK-2970 Hørsholm Denmark +45 4516 9200 Telephone +45 4516 9333 Support +45 4516 9292 Telefax
2D Hydrodynamic Model for Reservoirs: Case Study High Aswan Dam Reservoir
 D Hydrodynamic Model for Reservoirs: Case Study High Aswan Dam Reservoir M. M. Soliman 1, M. A. Gad, Ashraf M. El-Moustafa 3 Abstract High Aswan Dam (HAD) is one of the most important projects in the history
WMS 10.0 Tutorial Hydraulics and Floodplain Modeling HY-8 Modeling Wizard Learn how to model a culvert using HY-8 and WMS
 v. 10.0 WMS 10.0 Tutorial Hydraulics and Floodplain Modeling HY-8 Modeling Wizard Learn how to model a culvert using HY-8 and WMS Objectives Define a conceptual schematic of the roadway, invert, and downstream
Unstructured grid modelling
 Unstructured grid modelling Intercomparison between several finite element and finite volume approaches to model the North Sea tides Silvia Maßmann 1, Alexey Androsov 1, Sergey Danilov 1 and Jens Schröter
Kansas Geological Survey
 Kansas Geological Survey Recent MODFLOW developments for groundwater modeling Ashok KC and Marios Sophocleous Case Study P=0.0055 m/day T=0.001 m/day E=0.0005 m/day 100 m 98 m -4 m 3 /day 95 m 25 m 25
25 Using Numerical Methods, GIS & Remote Sensing 1
 Module 6 (L22 L26): Use of Modern Techniques es in Watershed Management Applications of Geographical Information System and Remote Sensing in Watershed Management, Role of Decision Support System in Watershed
Section Graphs of the Sine and Cosine Functions
 Section 5. - Graphs of the Sine and Cosine Functions In this section, we will graph the basic sine function and the basic cosine function and then graph other sine and cosine functions using transformations.
APPENDIX C ESTUARY INFLOW EVALUATION
 APPENDIX C ESTUARY INFLOW EVALUATION Integrated Delaware River Basin Model: OASIS, DYNHYD5 and TOXI5 Documentation of Model Integration January 2008 Page 2 Introduction Up to this point several standalone
Watershed Modeling National Streamflow Statistics Program (NSS) Interface
 Interface") v. 9.1 WMS 9.1 Tutorial Watershed Modeling National Streamflow Statistics Program (NSS) Interface Use the NSS interface to estimate peak flows at different recurrence intervals Objectives Delineate a basin
v. 9.1 WMS 9.1 Tutorial Watershed Modeling National Streamflow Statistics Program (NSS) Interface Use the NSS interface to estimate peak flows at different recurrence intervals Objectives Delineate a basin
Coastal impact of a tsunami Review of numerical models
 Coastal impact of a tsunami Review of numerical models Richard Marcer 2 Content Physics to simulate Different approaches of modelling 2D depth average Full 3D Navier-Stokes 3D model Key point : free surface
Urban Floodplain modeling- Application of Two-Dimensional Analyses to Refine Results
 Urban Floodplain modeling- Application of Two-Dimensional Analyses to Refine Results Prabharanjani Madduri, P.E., CFM Mathini Sreetharan, Ph.D., P.E., CFM Hydraulic modeling of urban areas and issues Modeling
Hydrologic Modeling using HEC-HMS
 Hydrologic Modeling using HEC-HMS CE 412/512 Spring 2017 Introduction The intent of this exercise is to introduce you to the structure and some of the functions of the HEC-Hydrologic Modeling System (HEC-HMS),
Upper Trinity River Corridor Development Certificate Model Updates. Flood Management Task Force Meeting April 20, 2018
 Upper Trinity River Corridor Development Certificate Model Updates Flood Management Task Force Meeting April 20, 2018 Agenda Review of the Phase II Upper Trinity Watershed CDC Model Development Hydrology
MIKE 1D. What is included in MIKE 1D 2017?
 MIKE 1D What is included in MIKE 1D 2017? MIKE 2017 DHI headquarters Agern Allé 5 DK-2970 Hørsholm Denmark +45 4516 9200 Telephone +45 4516 9333 Support +45 4516 9292 Telefax mike@dhigroup.com www.mikepoweredbydhi.com
v SMS 12.2 Tutorial Observation Prerequisites Requirements Time minutes
 v. 12.2 SMS 12.2 Tutorial Observation Objectives This tutorial will give an overview of using the observation coverage in SMS. Observation points will be created to measure the numerical analysis with
Creating a Custom DEM and Measuring Bathymetric Change for the Multnomah Channel & Willamette River Confluence
 Creating a Custom DEM and Measuring Bathymetric Change for the Multnomah Channel & Willamette River Confluence Meara Butler Josh Schane GEOG 593 Fall 2012 Multnomah Channel begins three miles upstream
Integrated 2D Surface-Groundwater Modeling of the Green Swamp, Florida
 Integrated 2D Surface-Groundwater Modeling of the Green Swamp, Florida Peter J. Singhofen, P.E. Gordon L. McClung, P.E Streamline Technologies, Inc. 1900 Town Plaza Ct. Winter Springs, FL 32708 407-679-1696
HawkEye III - A new deep penetrating bathymetric LIDAR system
 Please insert a picture (Insert, Picture, from file). Size according to grey field (10 cm x 25.4 cm). Scale picture: highlight, pull corner point Cut picture: highlight, choose the cutting icon from the
Hysteresis in River Discharge Rating Curves. Histerésis en las curvas de gasto en ríos (caudal/calado) Madrid, March 25, 2013
 Madrid, March 25, 2013") Hysteresis in River Discharge Rating Curves Histerésis en las curvas de gasto en ríos (caudal/calado) Madrid, March 25, 2013 Marian Muste and Kyutae Lee IIHR Hydroscience & Engineering The University of
Hysteresis in River Discharge Rating Curves Histerésis en las curvas de gasto en ríos (caudal/calado) Madrid, March 25, 2013 Marian Muste and Kyutae Lee IIHR Hydroscience & Engineering The University of
A Comparative Study of HEC-RAS 2D, TUFLOW, & Mike 21 Model Benchmark Testing
 A Comparative Study of HEC-RAS 2D, TUFLOW, & Mike 21 Model Benchmark Testing June 2016 Presented by: Murari Paudel, PhD, PE, CFM Soledad B Roman, EIT John Prichard, PE, CFM Wood Rodgers Inc. Sacramento,
Algebra 2CP S1 Final Exam Information. Your final exam will consist of two parts: Free Response and Multiple Choice
 Algebra 2CP Name Algebra 2CP S1 Final Exam Information Your final exam will consist of two parts: Free Response and Multiple Choice Part I: Free Response: Five questions, 10 points each (50 points total),
Summary of Observed Channel Dimensions in Mardi Gras Pass in the Bohemia Spillway, Southeast Louisiana: Surveys January 14, & 24, 2014
 Summary of Observed Channel Dimensions in Mardi Gras Pass in the Bohemia Spillway, Southeast Louisiana: Surveys January 14, & 24, 2014 By Felix Cretini B.A. Ezra Boyd, Ph.D. Andy Baker, M.S. Theryn Henkel,
Prepared for CIVE 401 Hydraulic Engineering By Kennard Lai, Patrick Ndolo Goy & Dr. Pierre Julien Fall 2015
 Prepared for CIVE 401 Hydraulic Engineering By Kennard Lai, Patrick Ndolo Goy & Dr. Pierre Julien Fall 2015 Contents Introduction General Philosophy Overview of Capabilities Applications Computational
ENV3104 Hydraulics II 2017 Assignment 1. Gradually Varied Flow Profiles and Numerical Solution of the Kinematic Equations:
 ENV3104 Hydraulics II 2017 Assignment 1 Assignment 1 Gradually Varied Flow Profiles and Numerical Solution of the Kinematic Equations: Examiner: Jahangir Alam Due Date: 27 Apr 2017 Weighting: 1% Objectives
Watershed Modeling HEC-HMS Interface
 v. 10.1 WMS 10.1 Tutorial Learn how to set up a basic HEC-HMS model using WMS Objectives Build a basic HEC-HMS model from scratch using a DEM, land use, and soil data. Compute the geometric and hydrologic
EcoGEnIE: A practical course in global ocean ecosystem modelling
 EcoGEnIE: A practical course in global ocean ecosystem modelling Lesson zero.c: Ocean circulation and Atlantic overturning stability Stuff to keep in mind: Nothing at all keep your mind completely empty
A procedure for determining the characteristic value of a geotechnical parameter
 ISGSR 2011 - Vogt, Schuppener, Straub & Bräu (eds) - 2011 Bundesanstalt für Wasserbau ISBN 978-3-939230-01-4 A procedure for determining the characteristic value of a geotechnical parameter A. J. Bond
PRACTICAL UNIT 1 exercise task
 Practical Unit 1 1 1 PRACTICAL UNIT 1 exercise task Developing a hydraulic model with HEC RAS using schematic river geometry data In the course of practical unit 1 we prepare the input for the execution
Full Plane STWAVE: SMS Graphical Interface
 Full Plane STWAVE: SMS Graphical Interface by Jane McKee Smith and Alan Zundel PURPOSE: The purpose of this Coastal and Hydraulics Engineering Technical Note (CHETN) is to describe the graphical interface
COMPARISON BETWEEN MIKE 21 FM, DELFT3D AND DELFT3D FM FLOW MODELS OF WESTERN PORT BAY, AUSTRALIA
 COMPARISON BETWEEN MIKE 21 FM, DELFT3D AND DELFT3D FM FLOW MODELS OF WESTERN PORT BAY, AUSTRALIA Andrew M. Symonds 1, Thomas Vijverberg 2, Sander Post 4, Bart-Jan van der Spek 3, Johan Henrotte 2 and Marius
FINITE DIFFERENCE SPREADSHEETS OF YOUR MODELS
 FINITE DIFFERENCE SPREADSHEETS OF YOUR MODELS #1: Always indicate units. Units always need to be consistent in xls and modflow xyzwkq etc Cell size can easily be adjusted to make a reasonable size for
Use the MODFLOW Lake (LAK3) package to simulate mine dewatering
 package to simulate mine dewatering") v. 10.3 GMS 10.3 Tutorial Use the MODFLOW Lake (LAK3) package to simulate mine dewatering Objectives Learn the steps involved in using the MODFLOW Lake (LAK3) package interface in GMS. This tutorial will
v. 10.3 GMS 10.3 Tutorial Use the MODFLOW Lake (LAK3) package to simulate mine dewatering Objectives Learn the steps involved in using the MODFLOW Lake (LAK3) package interface in GMS. This tutorial will