Flowlogic. User Manual Version GraphLogic: Developed by scientists, for scientists. Graphing and Statistical Analysis.
|
|
|
- Virginia Pope
- 5 years ago
- Views:
Transcription

1 Flowlogic Flow Cytometry Analysis Software Developed by scientists, for scientists User Manual Version GraphLogic: Graphing and Statistical Analysis
2 TABLE OF CONTENTS GraphLogic Graphing and Statistical Analysis... 3 Overview... 3 The GraphLogic File Inspector... 3 Workspace Folders... 4 Data Workspace... 6 Adding FCS-linked Data... 7 Selecting gate and parameter statistics... 8 Importing PlateLogic and Advanced Analysis Datasets... 9 The Workspace Right-Click Menu... 9 Add Plate Data... 9 Add Cell Cycle, Proliferation, Curve Fit and Kinetics table data Clear Selected Copy Cut Paste Paste Transpose Set Group Name Set Column Name Exporting Table Importing Data from CSV Files Manually Adding Data Workspace Toolbar The Formula Field Coloring Text and Cells Split and Merge Cells Text Alignment Font Settings Decimal Places Population Statistic Menus Defining Replicates Gate/Value Display Adding Data to a Table Folder for Statistical Analysis and Graphing Performing Statistical Analyses Analysis Groups Analysis Type Post Analysis Type Creating a Graph Graph Types Editing Graphs


3 GraphLogic Graphing and Statistical Analysis Overview GraphLogic provides the ability to store, arrange and manipulate data derived from the FCS files and imported from other sources. This is achieved using the Workspace and Table subfolders, which themselves contain Analysis and Graph sheets. The GraphLogic File Inspector The File Inspector within GraphLogic appears similarly to that in GateLogic but with a limited number of options available in the right click menu. The primary purpose of the GraphLogic File Inspector is to display the Files rather than the gating hierarchy (subpopulations can be selected within the workspace. Files are generally dragged and dropped into the Workspace in experimental groups (see page 7). Right clicking within the File Inspector produces a menu that provides options for tagging and sorting, selecting particular files, revealing and hiding the gating hierarchy and renaming files or gates. The menu appears as shown: 3

4 Tag choose to add tags (user defined or a range of auto-tags) to highlighted samples. Once samples have been tagged, use the filter option in the tag menu to display a select number of samples based on their tags. Show/Hide Gates hiding gates results in only the file name being displayed. Showing gates reveals all levels of the gating hierarchy. In GraphLogic, it is generally only necessary to view the files themselves, with the ability to show gates only necessary to be reminded of the gating hierarchy without having to click back to GraphLogic. Select All/Inverse select all highlights every row. The same result can be achieved with the keyboard shortcut Ctrl/ A. Select Inverse highlights all but the files that are selected before clicking Inverse. Rename rename individual files or gates by typing in a new name or choose from the original FCS file name or sample name created during acquisition. Workspace Folders Data existing in the Workspace arranged within graph templates (see page 7) can be dragged and dropped into Table folders from which graphs are automatically generated and displayed in the Graph Display Window. Statistical tests can also be performed on data in the graph table folder in a few easy steps. As the FCS derived data in the tables remains linked to GraphLogic, all graphs and statistical analyses are updated automatically. Data can also be imported from CSV files or typed directly into the spreadsheet. Data contained in the Workspace can also be exported as a CSV file or as a MS Excel (.xlxs) file, with the latter exporting with all color and formatting. Right click menu for the GraphLogic folder: The GraphLogic folder contains all subfolders. By default, one Workspace folder containing a Table folder with the associated Analysis and Graph sheets are created. Additional Workspace folders (with a table, analysis and graph) can be created by right clicking on the GraphLogic folder, followed by Add Workspace. 4
5 Right click menu for the Workspace folder: Workspace folders can be renamed using the first option in the right click menu. Additionally, new Table folders can be added to a single Workspace folder. In this way, multiple graphs can be generated and statistics test performed from all of the data in one Workspace spreadsheet. There is also an option to clone a given Workspace and all of its subfolders. This can be very useful if you have a lot of formatting and calculations in one Workspace that you wish to apply to another. Once a Workspace has been cloned, the data can be deleted and new files or information can be imported. Finally, a Workspace can be deleted or removed using the last option, Remove Selected, in the right click menu. Right click menu for the Table folder: When FCS files are dragged into the Workspace, the naming template is automatically created around the data. When this same data is dragged into a Table, the Table folder name will take the name in the Table cell form the Workspace. However, if you are importing non-fcs data, you have removed the Table name from the Workspace or you wish to change it, this can be done from the Rename option in the right click menu. Other options include adding additional analyses and graphs. Whist only one data set can be added to each Table folder, allowing multiple analysis and graph icons means that the same data can be displayed two or more different ways at the same time and different statistical tests can be performed without having overwrite that which has already been done. Tables can also be cloned. This is useful if you have formatted graphs and performed particular statistical tests. The easiest way to replicate this is to clone a Table and then drag the new data into the clone. This will then update all current graphs and statistics. 5
6 As an alternative to dragging selected data into a Table, data can be copied from the Workspace, (right click Copy) and pasted into the Table (Right Click on Table folder Paste). This is useful if there is a lot of data in the Workspace and dragging becomes impractical. As with Workspaces, individual Table folders can be deleted by right clicking on the desired folder and choosing Remove Selected from the menu. Right click menu for the Analysis icon: Right click menu for the Graph icon: Data Workspace The Workspace is a spreadsheet that can accept FCS data, which remains linked to the original gates so that any adjustments in GateLogic are automatically updated in the GraphLogic Workspace. In addition, non-fcs data can be imported from CSV files and numbers and text can be typed directly into the cells. Common editing features exist, allowing cells and text to be colored, the merging and splitting of cells, changing the font type, style and size, changing text and number alignment within cells and selecting the number of decimal places to be displayed. A detailed description of each of these features can be found from page 18. 6


7 Functions can be applied to any data in the Workspace, such as adding, subtracting, multiplying or dividing one cell by another. The equation defining the calculation is created in the formula field at the top of the Workspace. Adding FCS-linked Data The feature that makes the GraphLogic Workspace so useful is the ability to drag in FCS files, or import files contained in a plate, and then display any gate or parameter statistic using the drop-down menus at the top of the Workspace. Data can then be dragged into a Workspace Table, which automatically generates a graph. Statistical analyses can also be performed with a few clicks. In addition, FCS-linked data in the Workspace can be duplicated and set to a different gate or parameter statistic whilst maintaining all other generated graphs and tables. 7


8 When FCS files are dragged into the Workspace, a template is automatically created with titles for the Table (dataset) name, the experimental group names and the sample count. Table name: the table name refers to the table containing the dataset that the associated graph is derived from. For example, this could be Lymphocytes %Parent. Group names: the group name relate to the experimental groups, which are reflected as separate bars in a bar graph, for example. This is unrelated to the groups created for group analysis. In the same example, there might be two groups: treatment and control. Sample number: this refers to individual samples within each experimental group, or the n value. Graphs can be created by highlighting the gate/parameter statistics (within the red border above) or the entire data table (within the green border) and dragging them directly to a Table folder in the window. If the data exists within the template, as shown above, the Table name and group names will automatically be applied to the Table folder and graph, respectively. Updating these names in the Workspace after the data has been added to the table and a graph has been created will update the naming of these elements. Selecting gate and parameter statistics When FCS files are dragged into the Workspace, by default the value for each sample will be , relating to the %Parent, All Events. Use the drop-down windows above the table to select the population (gate) and the type of statistic (event count, %parent, %total, mean, etc.) to graph. Finally, you can specify the number of replicates performed. 8
9 Importing PlateLogic and Advanced Analysis Datasets An alternative method for adding FCS-derived data into a GraphLogic Workspace is to import files that are already arranged in plates within PlateLogic. This is achieved via the right click menu in the GraphLogic Workspace, as described below. The same process can be used to import data generated after performing cell cycle, proliferation, curve fitting and kinetics analyses. Once any of these datasets have been imported into a GraphLogic Workspace, the data can be rearranged for graphing and statistical analysis. Data imported via PlateLogic remains linked to the gates and so any adjustment to gates in GateLogic will update the data in GraphLogic. If an adjustment is made to the gates used to derive the cycle, proliferation, curve fitting and kinetics analyses after importing into GraphLogic, re-import the data to display the updated values. The Workspace Right-Click Menu Add Plate Data Files that have been imported into a plate in PlateLogic can be added directly to the Worksheet in GraphLogic right clicking, choosing Add Plate table and selecting the desired plate by name. The data will be imported into the Worksheet in the same arrangement as the files exist in the plate. Files can be added to a plate before gating or at any time after gates have been created. 9


10 There is no need to define the statistics in PlateLogic as the selection can be made in GraphLogic. The data remains linked to the gates in GraphLogic and so will update automatically if a gate is adjusted. The same plate can be imported multiple times or an imported dataset can be copied and pasted elsewhere in the Workspace. The data from either form of duplication can be changed using the drop-down menus to define a different population or statistic. When importing plate data, the table structure with a Table name, Group names and Sample counts will automatically be created in preparation for generating a graph. 10
11 Add Cell Cycle, Proliferation, Curve Fit and Kinetics table data Data derived from Cell Cycle, Proliferation, Curve Fit and Kinetics analyses can be added to the GraphLogic Workspace by right clicking, choosing the analysis type and selecting the dataset based on the Experiment Folder name where the files are located. Clear Selected Selecting Clear Selected cells from the right click menu after highlighting in the Workspace will clear all data, formulae, font formatting, cell alignment and color settings. Copy Cells can be copied, by highlighting and selecting Copy from the right click menu, and be pasted elsewhere in the same Workspace, in a different Workspace or into a Table folder. This process copies all data, formulae, font formatting, cell alignment and color settings. The original, copied data will remain after replicated data is pasted to another position in the Workspace. Cut The Cut function removes the data in the selected cells, along with all formulae, font formatting, cell alignment and color settings and pastes it to the specified destination. When pasted, the Cut data will overwrite all data and formatting in the location where they are pasted. Paste The Paste function adds the Copied or Cut data to a specified location in the same orientation. Paste Transpose The Paste Transpose function flips the orientation so that Row 1 becomes Column 1, Row 2 becomes Column 2, etc. Data can only be transposed within the Workspace and not into a Table folder. Set Group Name The group name for a data set can be set using several different references. This is achieved by selecting the cells containing the group titles to be renamed, right clicking and selecting Set Group Name and one of: Via Gate Via Parent + Gate Via CSV file 11

12 Via Gate This function is for data derived from FCS files that are dragged into the Workspace from the File Inspector or imported via a plate. To rename the Group, highlight the Group Name cells, right click and select Set Group Name Via Gate. The Group name will then be updated with the gate name, which is displayed it the gate drop down menu in the toolbar. Via Parent + Gate This function is also for data derived from FCS files that are dragged into the Workspace from the File Inspector or imported via a plate. It functions in the same way as the Via Gate option but adds the parent gate name before the population gate name. Via CSV file This function allows groups to be named from a.csv file. Multiple Group Name cells can be named at once, as long as they are highlighted prior to naming. This feature can be very useful if the same experimental groups are used consistently over a number of analyses or experiments. It is important, however, to set up the.csv file in the correct format. The names in the.csv file need to be listed horizontally, with one name per cell if created in a spreadsheet or having each name separated by a comma if created with a text editor. However, FlowLogic will apply these names vertically, assuming each experimental group is displayed one on top of the next. In addition, only the selected number of Group name cells will be named, even if the list in the.csv file is longer. For example, if the names in the.csv file are Group A, Group B, Group C, Group D and Group E but only two cells are highlighted in the Workspace, only the names Group A and Group B will be applied. Similarly, if more cells are highlighted than names exist in the CSV file, not all cells will be renamed. 12


13 It is also possible to set up a.csv file with spaces between the names. For example, here is a.csv file with a gap between Group 2 and Group 3 : When cells A3 to A7 are highlighted and this.csv file is imported, the third name, corresponding to cell A5, is left blank. 13


14 Set Column Name The column name for a data set can be set using several different references. The column name refers to the title above each sample, which are numbered by default. Select the cells containing the group titles to be renamed, right clicking and selecting Set Column Name and one of: Via Count Via $SRC Via $CELLS Via TAG Via CSV file Via $SRC This function allows columns to be named from the $SRC keyword contained in the FCS file. This keyword can differ from cytometer to cytometer and can be defined at the time of acquisition with certain acquisition programs. Via $CELLS This is another keyword contained in the FCS file. Via TAG tags applied to a sample can be used to name the column titles. If multiple tags have been applied to a sample, these will all be listed in the column name. Via CSV file naming columns via a.csv file works in a similar way to naming the groups. Select the column titles to be named, right click and choose Set Column Name Via CSV file. The names in the.csv file need to be listed horizontally and any spaces in the.csv file will result in a cell being missed in the Workspace. Exporting Table The Workspace table can be exported as either a.csv file or Excel XML Workbooks (*.xlsx) file. The.csv export option will record all text and numbers in the displayed table format without any formatting. Formulae will not be saved in the.csv file, only the resulting value displayed in the cell. The.xlsx file will save all the text and numbers along with text and cell formatting, such as coloring, alignment within cells, font style/type/size and formulae. Importing Data from CSV Files Data saved in the.csv file format can be imported into the Workspace by right clicking in the destination cell and selecting Import data via CSV. 14

, then click in the formula field, click cell B3 followed by")
15 Manually Adding Data Data can also be added to the Workspace by selecting a cell and typing text and numbers with the keyboard. Workspace Toolbar The Formula Field Formulae can be created to apply mathematical functions to selected cells. Addition, subtraction, multiplication and division of cells, typed values or a combination of both can be performed by defining the equation in the formula field in the toolbar above the Workspace. Examples of each of these situations are as follow: To add the values in cells B3 and B4, select a destination cell (B6 in this example), then click in the formula field, click cell B3 followed by B4, click inside the formula field again and finish by pressing enter on the keyboard. To add a series of numbers and display the result in one cell, select a destination cell, then click in the formula field and type the equation, e.g Then press enter on the keyboard and the result (3) will be displayed in the destination cell. 15

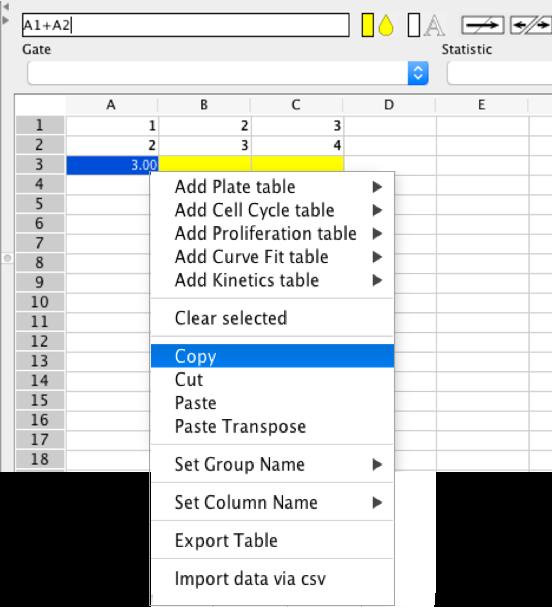
16 To multiple a cell by a number (e.g. B3*100), select a destination cell (B5 in this example), then click in the formula field, click cell B3 and in the formula field type *100. Finish by pressing enter on the keyboard. The final value will be calculated and displayed in the destination cell. Much more complex formulae can be created using all combinations of mathematical functions (+, -, *, /). If a formula has been created based on the relationship between a specific selection of cells and numbers, it can be copied and pasted to a new selection of cells, with the formula in the new cells referring to cells with the same spatial relationship. To copy a cell, right click in the cell and select Copy. Then, select the destination cells, right click and select Paste. For example, if the formula in A3 is A1+A2, then copying A3 to B3 and C3 will result in: A3=A1+A2 B3=B1+B2 C3=C1+C2 16


17 17

.")

18 Coloring Text and Cells Color can be applied to cells and text in the Workspace spreadsheet. This can be achieved using the icons in the toolbar. Each function (background color and foreground/text color) has two associated icons: select color (the colored rectangle icon) and apply color (drop icon for cells and A icon for text). To color the cell (background), highlight the cells to be colored and click the background color selection icon. This will open a color palette. Click to choose the desired color and then click OK. This will apply the chosen color to the highlighted cells. You will notice that the Select Color and Apply Color icons have taken the most recent color choice. To continue filling cells with the same color, simply highlight the cells and click the Drop icon. 18

19 The same process applies to coloring text within cells. Text is colored black by default but to change the text color, highlight the desired cells and click the select color icon next to the A icon. Choose a color and click OK. The A icon is now colored with the most recent selection. To continue to color text with the selected color, highlight the desired cells and click the A icon. Split and Merge Cells Multiple cells in the Workspace can be merged to form a single larger cell and merged cells can be split back into their original components. To merge or split cells, highlight them in the Workspace and then click the appropriate button in the toolbar. Cells running horizontally, vertically or a block spanning a number of columns and rows can be merged (are subsequently split). Text Alignment Text can be aligned to either the left, centre or right of a cell using the three icons in the toolbar. To change the alignment, select the cell(s) and click on the appropriate icon. Font Settings Three font setting options can be accessed in the toolbar, being the font type, size and style. To change the font settings, highlight the cells in the Workspace and select from the different options in the font settings drop down menus. 19

20 Decimal Places The number of decimal places that are displayed in individual cells can be set by selecting the cell(s) and choosing an option ranging from no decimal places through to ten. Individual cells within the same Workspace can be set to display different numbers of decimal places. Population Statistic Menus The population statistics menu allows for the selection of specific gate and parameter statistics to be displayed for a single FCS sample, or a group of FCS samples, that have been dragged into the Workspace. To define a statistic, highlight the cell or cells containing data derived from an imported FCS file and select the desired gate, statistic and parameter (if applicable). The value in the cell will update to reflect the defined statistic and can be changed to any other statistic without having to re-import the sample. The statistics will also update following any changes or adjustments to the defining gates in GateLogic. The Population Statistic Menus can also be used to verify the statistic in a selected cell. Clicking on any cell containing FCS-derived data will prompt the three population statistic menus to display the gate, statistic and parameter for that cell. If multiple cells containing different statistics are selected, the display in the menus will reflect the first cell in the selection. For more information regarding importing and displaying FCS-derived data, see page 7. Defining Replicates If values from all technical replicates have been imported, the number of replicates can be defined with the average of the technical replicates being displayed in merged cells. 20


21 Gate/Value Display The Gate/Value Display function allows the for the gate name linked to the gate/parameter statistics to be displayed within the cells instead of the statistic itself. This can be useful if you wish to check the origin of a selection of cells without having to click on the cells one-by-one to view the gate in the Population Statistic Gate menu. To change the information displayed in the cells, select them in the Workspace and choose the desired option in the Display drop down menu. Adding Data to a Table Folder for Statistical Analysis and Graphing When data exists in the Workspace within the data template as shown below, it is very easy to add it to a Table folder in order to perform statistical analyses and graph. Simply select the data (not the Group or column names) and drag it into a Table folder. The Table folder will be automatically renamed the dataset title (the yellow cell in the example above) and the groups in the graph and statistical analyses will be named automatically renamed from the group names in the Workspace. 21
, select a statistical analysis sheet.")


")
22 Performing Statistical Analyses After data has been added to the data table (see page 7), select a statistical analysis sheet. This opens the Analysis window. The workspace from where the data originates can be viewed by selecting the Workspace in the Graph Data window or by clicking on the Table folder associated with the particular analysis sheet. To perform a statistical test, select the experimental groups to analyse and the specific statistical analysis test (and post-test if applicable) from the drop-down menus. The result will be displayed in the Description and Analysis columns adjacent. 22
23 Analysis Groups Analysis Type 23
. Double click Graph in the Data Folder window to create a bar graph of the imported data.")
24 Post Analysis Type Creating a Graph To graph your data, select the Statistics window at the top of the program and select Workspace 1 in the Graph Data window. Then, highlight the data within a workspace template and drag it into a Table folder (see page 21). Double click Graph in the Data Folder window to create a bar graph of the imported data. The graph appears in the Graph Window. Open the graph side drawer and use the functions in the Graph Settings, Color Settings, Legend Settings and Border & Background Settings to customize your graph. 24

25 Graphs are exported or displayed in reports as they appear here. Take a few moments to adjust the settings and appearance of the graphs. Of course, graphs in a Report will be automatically updated if settings are changed at a later time. Graph Types From the drop-down menu, you can choose from a range of graph types, including Group Bar Graph, Pie Graph, Bar Graph, Stacked Bar Graph and Dot/Line Graph. Editing Graphs Bars and error bars can be edited using the other options in the side drawer. These include the Bar Height (Min, Median, Mean or Max), Error Bars (Off, Min, Median, Mean, Max, Top+SD, Top-SD, Top+SE, Top-SE) and the Bar Style (Thin, Dash, Medium, Medium Dash, Thick, Thick Dash and None). 25


26 Graph color settings Click on the colors and choose a new one from the color palette. Alternatively, right click on the graph and choose Graph Colors. Graph legend settings edit the appearance of the legend, including its background color, border color, text color, font and size. Double click on legend to rename its title. 26


27 Graph border and background edit the color of the graph background and border or remove the border completely. Editing the graph space the graph can be edited directly or through the right click menu. Click and drag the axes to adjust the size of the graph within the space. Double click on the axis titles to edit the name. Click and drag the legend to a new location. Right click in the legend to bring up more editing options. Creating additional graphs graphs are located within Workspaces as displayed in the Graph Data window of the pull up drawer. 27
Flowlogic. User Manual. Developed by scientists, for scientists. Version Flow Cytometry Analysis Software
 Flowlogic Flow Cytometry Analysis Software Developed by scientists, for scientists User Manual Version 7.2.1 www.inivai.com TABLE OF CONTENTS FlowLogic 7.2.1 - Introduction... 5 Layout Overview GateLogic,
Flow Cytometry Analysis Software. Developed by scientists, for scientists. User Manual. Version Introduction:
 Flowlogic Flow Cytometry Analysis Software Developed by scientists, for scientists User Manual Version 7.2.1 Introduction: Overview, Preferences, Saving and Opening Analysis Files www.inivai.com TABLE
WEEK NO. 12 MICROSOFT EXCEL 2007
 WEEK NO. 12 MICROSOFT EXCEL 2007 LESSONS OVERVIEW: GOODBYE CALCULATORS, HELLO SPREADSHEET! 1. The Excel Environment 2. Starting A Workbook 3. Modifying Columns, Rows, & Cells 4. Working with Worksheets
Microsoft Excel 2007
 Microsoft Excel 2007 1 Excel is Microsoft s Spreadsheet program. Spreadsheets are often used as a method of displaying and manipulating groups of data in an effective manner. It was originally created
A cell is highlighted when a thick black border appears around it. Use TAB to move to the next cell to the LEFT. Use SHIFT-TAB to move to the RIGHT.
 Instructional Center for Educational Technologies EXCEL 2010 BASICS Things to Know Before You Start The cursor in Excel looks like a plus sign. When you click in a cell, the column and row headings will
EXCEL 2007 TIP SHEET. Dialog Box Launcher these allow you to access additional features associated with a specific Group of buttons within a Ribbon.
 EXCEL 2007 TIP SHEET GLOSSARY AutoSum a function in Excel that adds the contents of a specified range of Cells; the AutoSum button appears on the Home ribbon as a. Dialog Box Launcher these allow you to
Starting Excel application
 MICROSOFT EXCEL 1 2 Microsoft Excel: is a special office program used to apply mathematical operations according to reading a cell automatically, just click on it. It is called electronic tables Starting
Excel Select a template category in the Office.com Templates section. 5. Click the Download button.
 Microsoft QUICK Excel 2010 Source Getting Started The Excel Window u v w z Creating a New Blank Workbook 2. Select New in the left pane. 3. Select the Blank workbook template in the Available Templates
1. Math symbols Operation Symbol Example Order
 Excel 2 Microsoft Excel 2013 Mercer County Library System Brian M. Hughes, County Executive Excel s Order of Calculation 1. Math symbols Operation Symbol Example Order Parentheses ( ) =(4+2)*8 1st Exponents
GAZIANTEP UNIVERSITY INFORMATICS SECTION SEMETER
 GAZIANTEP UNIVERSITY INFORMATICS SECTION 2010-2011-2 SEMETER Microsoft Excel is located in the Microsoft Office paket. in brief Excel is spreadsheet, accounting and graphics program. WHAT CAN WE DO WITH
Day : Date : Objects : Open MS Excel program * Open Excel application. Select : start. Choose: programs. Choose : Microsoft Office.
 Day : Date : Objects : Open MS Excel program * Open Excel application. Select : start Choose: programs Choose : Microsoft Office Select: Excel *The interface of Excel program - Menu bar. - Standard bar.
Chapter 4. Microsoft Excel
 Chapter 4 Microsoft Excel Topic Introduction Spreadsheet Basic Screen Layout Modifying a Worksheet Formatting Cells Formulas and Functions Sorting and Filling Borders and Shading Charts Introduction A
SUM - This says to add together cells F28 through F35. Notice that it will show your result is
 COUNTA - The COUNTA function will examine a set of cells and tell you how many cells are not empty. In this example, Excel analyzed 19 cells and found that only 18 were not empty. COUNTBLANK - The COUNTBLANK
Microsoft How to Series
 Microsoft How to Series Getting Started with EXCEL 2007 A B C D E F Tabs Introduction to the Excel 2007 Interface The Excel 2007 Interface is comprised of several elements, with four main parts: Office
EXCEL 2003 DISCLAIMER:
 EXCEL 2003 DISCLAIMER: This reference guide is meant for experienced Microsoft Excel users. It provides a list of quick tips and shortcuts for familiar features. This guide does NOT replace training or
Microsoft Excel 2016 / 2013 Basic & Intermediate
 Microsoft Excel 2016 / 2013 Basic & Intermediate Duration: 2 Days Introduction Basic Level This course covers the very basics of the Excel spreadsheet. It is suitable for complete beginners without prior
Excel 2013 Intermediate
 Excel 2013 Intermediate Quick Access Toolbar... 1 Customizing Excel... 2 Keyboard Shortcuts... 2 Navigating the Spreadsheet... 2 Status Bar... 3 Worksheets... 3 Group Column/Row Adjusments... 4 Hiding
Microsoft Excel 2010
 Microsoft Excel 2010 omar 2013-2014 First Semester 1. Exploring and Setting Up Your Excel Environment Microsoft Excel 2010 2013-2014 The Ribbon contains multiple tabs, each with several groups of commands.
Creating an Excel resource
 Excel Mobile Excel Mobile is a Microsoft application similar to Excel, but designed to run on handhelds. This mobile version of Excel is a spreadsheet application that allows you to manipulate numbers,
3/31/2016. Spreadsheets. Spreadsheets. Spreadsheets and Data Management. Unit 3. Can be used to automatically
 MICROSOFT EXCEL and Data Management Unit 3 Thursday March 31, 2016 Allow users to perform simple and complex sorting Allow users to perform calculations quickly Organizes and presents figures that can
Cell to Cell mouse arrow Type Tab Enter Scroll Bars Page Up Page Down Crtl + Home Crtl + End Value Label Formula Note:
 1 of 1 NOTE: IT IS RECOMMENDED THAT YOU READ THE ACCOMPANYING DOCUMENT CALLED INTRO TO EXCEL LAYOUT 2007 TO FULLY GRASP THE BASICS OF EXCEL Introduction A spreadsheet application allows you to enter data
Gloucester County Library System EXCEL 2007
 Gloucester County Library System EXCEL 2007 Introduction What is Excel? Microsoft E x c e l is an electronic s preadsheet program. I t is capable o f performing many diff e r e n t t y p e s o f c a l
Table of Contents. Chapter 1
 Table of Contents iii Table of Contents Chapter 1 Starting Excel Using an electronic spreadsheet 2 Starting Excel 2 Exploring the Start screen 4 Creating a blank workbook 4 Exploring the Excel window 5
4) Study the section of a worksheet in the image below. What is the cell address of the cell containing the word "Qtr3"?
 Study the section of a worksheet in the image below. What is the cell address of the cell containing the word Qtr3?") Choose The Correct Answer: 1) Study the highlighted cells in the image below and identify which of the following represents the correct cell address for these cells: a) The cell reference for the selected
Choose The Correct Answer: 1) Study the highlighted cells in the image below and identify which of the following represents the correct cell address for these cells: a) The cell reference for the selected
Day : Date : Objects : Open MS Excel program. Subject : * Open Excel application. Select : start. Choose: programs. Choose : Microsoft Office
 1 2 Day : Date : Objects : Open MS Excel program. Subject : * Open Excel application. Select : start Choose: programs Choose : Microsoft Office Select: Excel * Close the Excel program Click on the Close
European Computer Driving Licence. Advanced Spreadsheet Software BCS ITQ Level 3. Syllabus Version 2.0
 ECDL Advanced European Computer Driving Licence Advanced Spreadsheet Software BCS ITQ Level 3 Using Microsoft Excel 2010 Syllabus Version 2.0 This training, which has been approved by BCS, The Chartered
Excel 2016 Basics for Mac
 Excel 2016 Basics for Mac Excel 2016 Basics for Mac Training Objective To learn the tools and features to get started using Excel 2016 more efficiently and effectively. What you can expect to learn from
Excel 2016 Basics for Windows
 Excel 2016 Basics for Windows Excel 2016 Basics for Windows Training Objective To learn the tools and features to get started using Excel 2016 more efficiently and effectively. What you can expect to learn
EXCEL 2002 (XP) FOCUS ON: DESIGNING SPREADSHEETS AND WORKBOOKS
 FOCUS ON: DESIGNING SPREADSHEETS AND WORKBOOKS") EXCEL 2002 (XP) FOCUS ON: DESIGNING SPREADSHEETS AND WORKBOOKS ABOUT GLOBAL KNOWLEDGE, INC. Global Knowledge, Inc., the world s largest independent provider of integrated IT education solutions, is dedicated
EXCEL 2002 (XP) FOCUS ON: DESIGNING SPREADSHEETS AND WORKBOOKS ABOUT GLOBAL KNOWLEDGE, INC. Global Knowledge, Inc., the world s largest independent provider of integrated IT education solutions, is dedicated
Presenter: Susan Campbell Wild Rose School Division
 Presenter: Susan Campbell Wild Rose School Division What is Excel? An electronic spreadsheet program and a powerful tool for analyzing and presenting information: Spreadsheet Used for entering and analyzing
Microsoft Excel 2010 Basic
 Microsoft Excel 2010 Basic Introduction to MS Excel 2010 Microsoft Excel 2010 is a spreadsheet software in the new Microsoft 2010 Office Suite. Excel allows you to store, manipulate and analyze data in
Numbers Basics Website:
 Website: http://etc.usf.edu/te/ Numbers is Apple's new spreadsheet application. It is installed as part of the iwork suite, which also includes the word processing program Pages and the presentation program
CHAPTER 4: MICROSOFT OFFICE: EXCEL 2010
 CHAPTER 4: MICROSOFT OFFICE: EXCEL 2010 Quick Summary A workbook an Excel document that stores data contains one or more pages called a worksheet. A worksheet or spreadsheet is stored in a workbook, and
Contents. Introduction 15. How to use this course 18. Session One: Basic Skills 21. Session Two: Doing Useful Work with Excel 65
 Contents Introduction 15 Downloading the sample files... 15 Problem resolution... 15 The Excel version and locale that were used to write this book... 15 Typographical Conventions Used in This Book...
Quick Reference Summary
 Microsoft Excel 2010 Quick Reference Summary Microsoft Excel 2010 Quick Reference Summary 3-D Chart, Rotate EX 462 3-D Rotation button (Chart Tools Layout tab Background, change rotation (Format Chart
Excel 2010: Getting Started with Excel
 Excel 2010: Getting Started with Excel Excel 2010 Getting Started with Excel Introduction Page 1 Excel is a spreadsheet program that allows you to store, organize, and analyze information. In this lesson,
Microsoft Office Excel
 Microsoft Office 2007 - Excel Help Click on the Microsoft Office Excel Help button in the top right corner. Type the desired word in the search box and then press the Enter key. Choose the desired topic
INTRODUCTION... 1 UNDERSTANDING CELLS... 2 CELL CONTENT... 4
 Introduction to Microsoft Excel 2016 INTRODUCTION... 1 The Excel 2016 Environment... 1 Worksheet Views... 2 UNDERSTANDING CELLS... 2 Select a Cell Range... 3 CELL CONTENT... 4 Enter and Edit Data... 4
Note: For more information on creating labels in CDS, watch Volume 22 of the Fast Class Update: Label Creation.
 Information used to create labels the Client Data System (CDS) can be exported out of CDS and used to create labels in Microsoft Word. In Word, you can make changes to the style, size, and color of fonts
1 THE PNP BASIC COMPUTER ESSENTIALS e-learning (MS Excel 2007)
") 1 THE PNP BASIC COMPUTER ESSENTIALS e-learning (MS Excel 2007) 2 THE PNP BASIC COMPUTER ESSENTIALS e-learning (MS Excel 2007) TABLE OF CONTENTS CHAPTER 1: GETTING STARTED... 5 THE EXCEL ENVIRONMENT...
1 THE PNP BASIC COMPUTER ESSENTIALS e-learning (MS Excel 2007) 2 THE PNP BASIC COMPUTER ESSENTIALS e-learning (MS Excel 2007) TABLE OF CONTENTS CHAPTER 1: GETTING STARTED... 5 THE EXCEL ENVIRONMENT...
Agenda. Spreadsheet Applications. Spreadsheet Terminology A workbook consists of multiple worksheets. By default, a workbook has 3 worksheets.
 Agenda Unit 1 Assessment Review Progress Reports Intro to Excel Learn parts of an Excel spreadsheet How to Plan a spreadsheet Create a spreadsheet Analyze data Create an embedded chart in spreadsheet In
Microsoft Excel Chapter 1. Creating a Worksheet and a Chart
 Microsoft Excel 2013 Chapter 1 Creating a Worksheet and a Chart Objectives Describe the Excel worksheet Enter text and numbers Use the Sum button to sum a range of cells Enter a simple function Copy the
FlowJo Software Lecture Outline:
 FlowJo Software Lecture Outline: Workspace Basics: 3 major components 1) The Ribbons (toolbar) The availability of buttons here can be customized. *One of the best assets of FlowJo is the help feature*
DOING MORE WITH EXCEL: MICROSOFT OFFICE 2013
 DOING MORE WITH EXCEL: MICROSOFT OFFICE 2013 GETTING STARTED PAGE 02 Prerequisites What You Will Learn MORE TASKS IN MICROSOFT EXCEL PAGE 03 Cutting, Copying, and Pasting Data Basic Formulas Filling Data
ENTERING DATA & FORMULAS...
 Overview NOTESOVERVIEW... 2 VIEW THE PROJECT... 5 NAVIGATING... 6 TERMS... 6 USING KEYBOARD VS MOUSE... 7 The File Tab... 7 The Quick-Access Toolbar... 8 Ribbon and Commands... 9 Contextual Tabs... 10
Microsoft Excel Microsoft Excel
 Excel 101 Microsoft Excel is a spreadsheet program that can be used to organize data, perform calculations, and create charts and graphs. Spreadsheets or graphs created with Microsoft Excel can be imported
Working with Charts Stratum.Viewer 6
 Working with Charts Stratum.Viewer 6 Getting Started Tasks Additional Information Access to Charts Introduction to Charts Overview of Chart Types Quick Start - Adding a Chart to a View Create a Chart with
Excel. Spreadsheet functions
 Excel Spreadsheet functions Objectives Week 1 By the end of this session you will be able to :- Move around workbooks and worksheets Insert and delete rows and columns Calculate with the Auto Sum function
Advanced Excel. Click Computer if required, then click Browse.
 Advanced Excel 1. Using the Application 1.1. Working with spreadsheets 1.1.1 Open a spreadsheet application. Click the Start button. Select All Programs. Click Microsoft Excel 2013. 1.1.1 Close a spreadsheet
Creating a Spreadsheet by Using Excel
 The Excel window...40 Viewing worksheets...41 Entering data...41 Change the cell data format...42 Select cells...42 Move or copy cells...43 Delete or clear cells...43 Enter a series...44 Find or replace
Microsoft Excel 2010 Tutorial
 1 Microsoft Excel 2010 Tutorial Excel is a spreadsheet program in the Microsoft Office system. You can use Excel to create and format workbooks (a collection of spreadsheets) in order to analyze data and
SUMMARIES OF INTERACTIVE MULTIMEDIA
 SUMMARIES OF INTERACTIVE MULTIMEDIA GRADE 10 SOLUTIONS DEVELOPMENT 1. Producing a Good Document This lesson is about the basics of word processing. In it you will learn how to use the ribbon in a word
Gloucester County Library System. Excel 2010
 Gloucester County Library System Excel 2010 Introduction What is Excel? Microsoft Excel is an electronic spreadsheet program. It is capable of performing many different types of calculations and can organize
Microsoft Office Excel 2013 Courses 24 Hours
 Microsoft Office Excel 2013 Courses 24 Hours COURSE OUTLINES FOUNDATION LEVEL COURSE OUTLINE Getting Started With Excel 2013 Starting Excel 2013 Selecting the Blank Worksheet Template The Excel 2013 Cell
Contents. Introduction 13. Putting The Smart Method to Work 16. Session One: Basic Skills 23
 Contents Introduction 13 Feedback... 13 Downloading the sample files... 13 Problem resolution... 13 Typographical Conventions Used In This Book... 14 Putting The Smart Method to Work 16 Excel version and
Introduction to Excel 2013
 Introduction to Excel 2013 Information Technology Services West Virginia University ITS Service Desk (304) 293-4444, itshelp@mail.wvu.edu More information: http://it.wvu.edu/support/howto/archives/microsoft/excel
Introduction to Excel 2007
 Introduction to Excel 2007 These documents are based on and developed from information published in the LTS Online Help Collection (www.uwec.edu/help) developed by the University of Wisconsin Eau Claire
Excel 2016: Part 1. Updated January 2017 Copy cost: $1.50
 Excel 2016: Part 1 Updated January 2017 Copy cost: $1.50 Getting Started Please note that you are required to have some basic computer skills for this class. Also, any experience with Microsoft Word is
Basic Microsoft Excel 2011
 Basic Microsoft Excel 2011 Table of Contents Starting Excel... 2 Creating a New Workbook... 3 Saving a Workbook... 3 Creating New Worksheets... 3 Renaming a Worksheet... 3 Deleting a Worksheet... 3 Selecting
Spreadsheet Software
 Spreadsheet Software Objectives: Working with Spreadsheets Enhancing Productivity Using the Application Open, close a spreadsheet application. Open, close documents. Create a new spreadsheet based on default
Introduction to Excel 2013 Part 2
 Introduction to Excel 2013 Part 2 Open a file Select File from the Menu bar, select Open from the drop down menu, navigate to the place where the file was stored, double-left click on the file name. Modify
Spreadsheets Microsoft Office Button Ribbon
 Getting started with Excel 2007 you will notice that there are many similar features to previous versions. You will also notice that there are many new features that you ll be able to utilize. There are
Excel Basics. TJ McKeon
 Excel Basics TJ McKeon What is Excel? Electronic Spreadsheet in a rows and columns layout Can contain alphabetical and numerical data (text, dates, times, numbers) Allows for easy calculations and mathematical
Topic 4D: Import and Export Contacts
 Topic 4D: Import and Export Contacts If a corporation merges with another corporation it may become necessary to add the contacts to the new merged companies contact folder. This can be done by Importing
PARTS OF A WORKSHEET. Rows Run horizontally across a worksheet and are labeled with numbers.
 1 BEGINNING EXCEL While its primary function is to be a number cruncher, Excel is a versatile program that is used in a variety of ways. Because it easily organizes, manages, and displays information,
Status Bar: Right click on the Status Bar to add or remove features.
 Excel 2013 Quick Start Guide The Excel Window File Tab: Click to access actions like Print, Save As, etc. Also to set Excel options. Ribbon: Logically organizes actions onto Tabs, Groups, and Buttons to
STUDENT NAME ECDL: EXCEL MR BENNELL. This is an example of how to use this checklist / evidence document
 This part contains an instruction, task or a skill which you need to sow evidence of being able to do Once you have completed a task and shown evidence of it write the date underneath the task instruction
Microsoft Certified Application Specialist Exam Objectives Map
 Microsoft Certified Application Specialist Exam s Map This document lists all Microsoft Certified Application Specialist exam objectives for (Exam 77-602) and provides references to corresponding coverage
Microsoft Excel Important Notice
 Microsoft Excel 2013 Important Notice All candidates who follow an ICDL/ECDL course must have an official ICDL/ECDL Registration Number (which is proof of your Profile Number with ICDL/ECDL and will track
CATEGORY SKILL SET REF. TASK ITEM. 1.1 Working with Spreadsheets Open, close a spreadsheet application. Open, close spreadsheets.
 ECDL / ICDL Spreadsheets This module sets out essential concepts and skills relating to understanding the concept of spreadsheets and demonstrating an ability to use a spreadsheet to produce accurate work
Beginner s Guide to Microsoft Excel 2002
 Beginner s Guide to Microsoft Excel 2002 Microsoft Excel lets you create spreadsheets, which allow you to make budgets, track inventories, calculate profits, and design charts and graphs. 1. Open Start
Application of Skills: Microsoft Excel 2013 Tutorial
 Application of Skills: Microsoft Excel 2013 Tutorial Throughout this module, you will progress through a series of steps to create a spreadsheet for sales of a club or organization. You will continue to
Spreadsheet definition: Starting a New Excel Worksheet: Navigating Through an Excel Worksheet
 Copyright 1 99 Spreadsheet definition: A spreadsheet stores and manipulates data that lends itself to being stored in a table type format (e.g. Accounts, Science Experiments, Mathematical Trends, Statistics,
WORD Creating Objects: Tables, Charts and More
 WORD 2007 Creating Objects: Tables, Charts and More Microsoft Office 2007 TABLE OF CONTENTS TABLES... 1 TABLE LAYOUT... 1 TABLE DESIGN... 2 CHARTS... 4 PICTURES AND DRAWINGS... 8 USING DRAWINGS... 8 Drawing
Introduction to Excel
 Office Button, Tabs and Ribbons Office Button The File menu selection located in the upper left corner in previous versions of Excel has been replaced with the Office Button in Excel 2007. Clicking on
Excel 2003 Tutorial II
 This tutorial was adapted from a tutorial by see its complete version at http://www.fgcu.edu/support/office2000/excel/index.html Excel 2003 Tutorial II Charts Chart Wizard Chart toolbar Resizing a chart
BusinessObjects Frequently Asked Questions
 BusinessObjects Frequently Asked Questions Contents Is there a quick way of printing together several reports from the same document?... 2 Is there a way of controlling the text wrap of a cell?... 2 How
Microsoft Office. Microsoft Office
 is an office suite of interrelated desktop applications, servers and services for the Microsoft Windows. It is a horizontal market software that is used in a wide range of industries. was introduced by
ADD AND NAME WORKSHEETS
 1 INTERMEDIATE EXCEL While its primary function is to be a number cruncher, Excel is a versatile program that is used in a variety of ways. Because it easily organizes, manages, and displays information,
MOVING AND COPYING DATA...
 Overview NOTES... 2 OVERVIEW... 3 VIEW THE PROJECT... 5 USING FORMULAS... 6 BASIC EXCEL REVIEW... 6 ENTERING FORMULAS... 7 Typing formulas... 7 Clicking to insert cell references... 7 Using a simple cell
EXCEL BASICS: MICROSOFT OFFICE 2010
 EXCEL BASICS: MICROSOFT OFFICE 2010 GETTING STARTED PAGE 02 Prerequisites What You Will Learn USING MICROSOFT EXCEL PAGE 03 Opening Microsoft Excel Microsoft Excel Features Keyboard Review Pointer Shapes
MICROSOFT EXCEL BIS 202. Lesson 1. Prepared By: Amna Alshurooqi Hajar Alshurooqi
 MICROSOFT EXCEL Prepared By: Amna Alshurooqi Hajar Alshurooqi Lesson 1 BIS 202 1. INTRODUCTION Microsoft Excel is a spreadsheet application used to perform financial calculations, statistical analysis,
Prepared By: Graeme Hilson. U3A Nunawading
 0 Prepared By: Graeme Hilson U3A Nunawading - 2015 1 CONTENTS This Course Page 3 Reference Material Page 3 Introduction page 3 Microsoft Excel Page 3 What is a Spreadsheet Page 4 Excel Screen Page 4 Using
I OFFICE TAB... 1 RIBBONS & GROUPS... 2 OTHER SCREEN PARTS... 4 APPLICATION SPECIFICATIONS... 5 THE BASICS...
 EXCEL 2010 BASICS Microsoft Excel I OFFICE TAB... 1 RIBBONS & GROUPS... 2 OTHER SCREEN PARTS... 4 APPLICATION SPECIFICATIONS... 5 THE BASICS... 6 The Mouse... 6 What Are Worksheets?... 6 What is a Workbook?...
Links to Activities ACTIVITY 1.1. Links to Activities Links to Activities
 EXCEL Analyzing Data Using Excel Section 1 Skills Start Excel and identify features in the Excel window Enter labels and values Use the fill handle to enter a series Enter formulas Create a formula using
EXCEL 2007 GETTING STARTED
 EXCEL 2007 GETTING STARTED TODAY S DESTINATION Quick Access Toolbar Customize it! Office Button Click Excel Options BREAK DOWN OF TABS & RIBBON Tab Name Contains Information relating to Contains the following
In this section you will learn some simple data entry, editing, formatting techniques and some simple formulae. Contents
 In this section you will learn some simple data entry, editing, formatting techniques and some simple formulae. Contents Section Topic Sub-topic Pages Section 2 Spreadsheets Layout and Design S2: 2 3 Formulae
Formatting Spreadsheets in Microsoft Excel
 Formatting Spreadsheets in Microsoft Excel This document provides information regarding the formatting options available in Microsoft Excel 2010. Overview of Excel Microsoft Excel 2010 is a powerful tool
Information Technology and Media Services. Office Excel. Charts
 Information Technology and Media Services Office 2010 Excel Charts August 2014 Information Technology and Media Services CONTENTS INTRODUCTION... 1 CHART TYPES... 3 CHOOSING A CHART... 4 CREATING A COLUMN
Lecture- 5. Introduction to Microsoft Excel
 Lecture- 5 Introduction to Microsoft Excel The Microsoft Excel Window Microsoft Excel is an electronic spreadsheet. You can use it to organize your data into rows and columns. You can also use it to perform
EXCEL TUTORIAL.
 EXCEL TUTORIAL Excel is software that lets you create tables, and calculate and analyze data. This type of software is called spreadsheet software. Excel lets you create tables that automatically calculate
Rev. B 12/16/2015 Downers Grove Public Library Page 1 of 40
 Objectives... 3 Introduction... 3 Excel Ribbon Components... 3 File Tab... 4 Quick Access Toolbar... 5 Excel Worksheet Components... 8 Navigating Through a Worksheet... 9 Downloading Templates... 9 Using
EXCEL 2010 PROCEDURES
 EXCEL 2010 PROCEDURES Starting Excel 1 Click the Start 2 Click All Programs 3 Click the Microsoft Office folder icon 4 Click Microsoft Excel 2010 Naming and Saving (Ctrl+S) a Workbook 1 Click File 2 Click
Workbooks & Worksheets. Getting Started. Formatting. Formulas & Functions
 1 Getting Started Cells Workbooks & Worksheets Formatting Formulas & Functions Chart Printing 2 Getting Started Start a spreadsheet program Recognize the spreadsheet screen layout Use the ribbon,quick
EXCEL BASICS: MICROSOFT OFFICE 2007
 EXCEL BASICS: MICROSOFT OFFICE 2007 GETTING STARTED PAGE 02 Prerequisites What You Will Learn USING MICROSOFT EXCEL PAGE 03 Opening Microsoft Excel Microsoft Excel Features Keyboard Review Pointer Shapes
The following is the Syllabus for Module 4, Spreadsheets, which provides the basis for the practice-based test in this module.
 Module 4 Spreadsheets The following is the Syllabus for Module 4, Spreadsheets, which provides the basis for the practice-based test in this module. Module Goals Module 4 Spreadsheets requires the candidate
Spreadsheet Warm Up for SSAC Geology of National Parks Modules, 2: Elementary Spreadsheet Manipulations and Graphing Tasks
 University of South Florida Scholar Commons Tampa Library Faculty and Staff Publications Tampa Library 2009 Spreadsheet Warm Up for SSAC Geology of National Parks Modules, 2: Elementary Spreadsheet Manipulations
Entering Data in the Spreadsheet
 Excel How To Parts of the Spreadsheet Tiffany Davis, Briggs Elementary School A, B, C, etc. are the heads of the columns. 1, 2, 3, etc. are the heads of the rows. A cell is created by the intersection
Excel Basics Tips & Techniques
 Excel Basics Tips & Techniques Excel Terminology What s a spreadsheet? What s a workbook? Each Excel spreadsheet is a grid of data divided into rows and columns. Each block in this grid is called a cell,
Data Should Not be a Four Letter Word Microsoft Excel QUICK TOUR
 Toolbar Tour AutoSum + more functions Chart Wizard Currency, Percent, Comma Style Increase-Decrease Decimal Name Box Chart Wizard QUICK TOUR Name Box AutoSum Numeric Style Chart Wizard Formula Bar Active