infogr.am -- getting started
|
|
|
- Ethel Craig
- 5 years ago
- Views:
Transcription
. It s easy, free, quick, and allows you to post your visualizations anywhere online. Visit the link: infogr.am to check out the website. We re going to go over the basics of the application.")
1 Infogr.am Basics What is infogr.am? It s a great resource for when you need to visualize data - make simple infographics or make individual charts (bar graphs, pie charts, tables, pictoral charts, etc.). It s easy, free, quick, and allows you to post your visualizations anywhere online. Visit the link: infogr.am to check out the website. We re going to go over the basics of the application. Signing Up: 1. Visit infogr.am 2. Find the sign up button - similar to the one picture to the left and click on it. 3. You will be prompted to fill out a register form - input a username of your choice, your , and a password. Then click register. 4. You will then be taken to your account and home page. Page 1 of 9 11/8/12


2 Navigating the Home Page: Click on this bubble to start working on an infographic. What is an infographic? It is a graphic visualization of information or data that typically tells a story. Click on this bubble to start creating a chart. You will have options from bar graphs to pictoral charts. The Library will be where all your charts and infographics are saved and stored. The blue circle by Library will tell you the number of charts/infographics that are in your library. Your library will look something like this once you ve started making beautiful charts and infographics Note that you can make them public or not public - depending on whether you publish them or not. Through the library, you can also obtain the share/embed code, delete your creations, create duplicates, edit, and preview. The Library: Page 2 of 9 11/8/12

.")

3 You can directly access your charts and infographics. See the options that you have: Preview your infographic. Edit Settings: Edit your graphic. Duplicate your graphic. Delete your graphic. On the left hand side of your window, you will always see this Account Settings icon (which you can add your own avatar to change the image in the circle). If you click on this, it will open a sidebar (pictured to the far left) that has options to change settings. Note you can change avatar and notifications in this menu. The button at the bottom that looks like a power button will sign you out of your account. This button will appear under your Account settings icon when you are not on your home page. When you click on it, it will take you back to the home page. Page 3 of 9 11/8/12

 The other charts will be a similar process, but might have other options to customize it. 5. First, find data that you want to graph.")
4 Creating a Chart: 1. From your home page, click on the New Chart bubble. 2. You will be take to a new screen (pictured above) that allows you to select the chart that you want to make. Note, that within each section, there are also more possibilities. For example, within Bar, click through with the right and left arrows to see the other options such as Stacked Bars and Grouped Bars. 3. Once you ve selected the chart that you want, click on Create chart. 4. For this example, we re going to use bar graphs as the example. (i.e. Note the other chart options: pie charts, pictoral charts, word clouds, etc.) The other charts will be a similar process, but might have other options to customize it. 5. First, find data that you want to graph. USC Libraries has some great databases to use such as emarketer and Statistical Abstract. Page 4 of 9 11/8/12

5 You will be taken to a screen like the one below. It will already have preset data in the graph to give you an example of what it will look like Allows you to edit width of your chart. Preview how your chart will look. When you ve finished, click Publish to start sharing your chart Do not click Publish if you don t want it to be public. It will still save in your library automatically. Go back to your home page. See other charts/ infographics in your library To edit your chart, double click on to add a title and double click in the graph area to start inserting your data Add a description here. Simply double click where it says description and you can start typing. This is a good place to cite the source for your data. Note: Click on the X to delete sections, for instance, if you don t want a description box, click the X next to it. You can also drag sections to rearrange their order. Click on the section that you want to move and drag it. Page 5 of 9 11/8/12

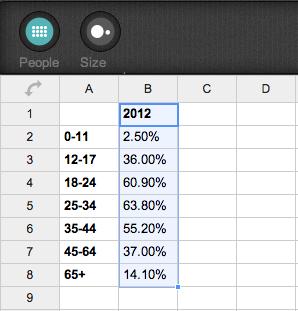
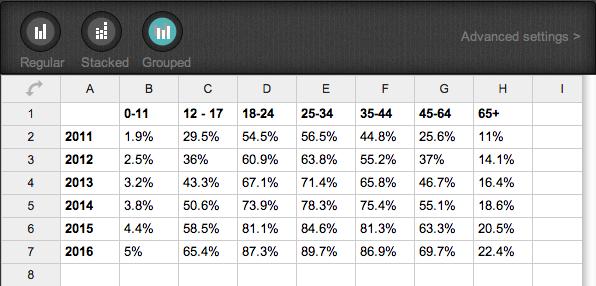
6 Now, it s time to start formatting your graph Double click on the graph area and a sidebar will appear (as pictured below.) Clears all numbers in the data sheet. Note that you can change between the different types of bar graphs - regular, stacked, and grouped. The same options will appear if you are using other types of graphs. When you re done, click this to see how your chart looks Load data from your computer - such as from an Excel sheet. Advanced settings will allow you to edit the height of your chart and the colors - in this case, edit the colors of the bars. In some cases, you ll be able to add another data sheet. Play around with your data to see the best way to visualize it Page 6 of 9 11/8/12

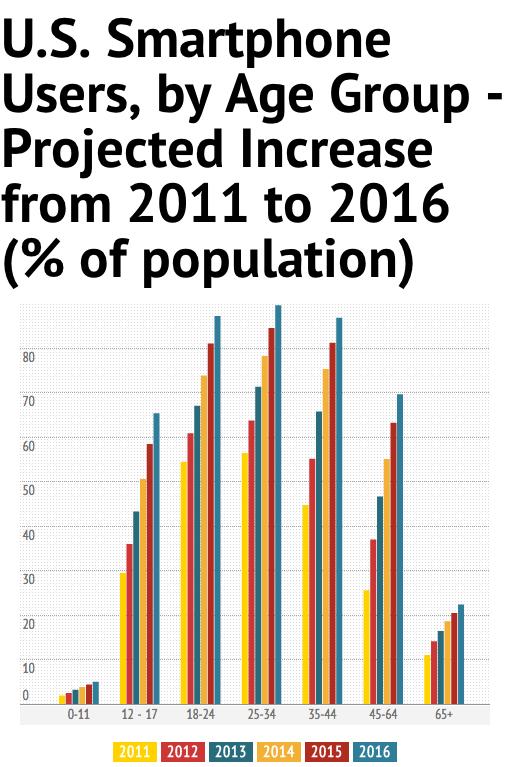
7 Examples: Page 7 of 9 11/8/12


8 infogr.am -- getting started Creating an Infographic: 1. From your home page, click on the New Infographic bubble. 2. You will be take to a new screen (pictured above) that allows you to select the infographic template that you like. Click left and right to see all of the options. You can also use the arrow keys on your keyboard to sort through them. 3. Once you ve selected the infographic template you like, click Use it. We ve selected the one pictured to the right. Note: An infographic will allow you to tell a story with charts, maps, text, pictures, videos, etc. Page 8 of 9 11/8/12

9 Edit style and width. Preview how your infographic will look. When you ve finished, click Publish to start sharing your infographic Remember again, if you don t want it to be public, do not click on this. It will still automatically save to your library. Use these buttons to start adding to your infographic It will continually add sections below the previous section - making it a long vertical infographic. (i.e. If I want to add a map, click on the Add Map button and it will not appear below the chart pictured in the image.) Note: sections can be rearranged by clicking and dragging them. Add a Chart Add a Map Add Text Add Pictures Add Video To start editing, double click on sections to customize them. Click on the X to delete them if you want to put something different there. Remember, you can also drag sections to rearrange their order. Page 9 of 9 11/8/12
MERCATOR TASK MASTER TASK MANAGEMENT SCREENS:- LOGIN SCREEN:- APP LAYOUTS:-
 MERCATOR TASK MASTER TASK MANAGEMENT SCREENS:- LOGIN SCREEN:- APP LAYOUTS:- This is Navigation bar where you have 5 Menus and App Name. This Section I will discuss in brief in the Navigation Bar Section.
Piktochart 101 Create your first infographic in 15 minutes
 Piktochart 101 Create your first infographic in 15 minutes TABLE OF CONTENTS 01 Getting Started 5 Steps to Creating Your First Infographic in 15 Minutes 1.1 Pick a Template 1.2 Click Create and Start Adding
Introduction. Creating an Account. Prezi.com Getting Started
 Introduction offers a way to create presentations that engage the audience in an interesting and non-traditional way. It is a virtual whiteboard that transforms presentations from monologues into conversation:
HOW TO CREATE INFOGRAPHICS WITH INFOGRAM
 HOW TO CREATE INFOGRAPHICS WITH INFOGRAM Compliments of Women in Ecommerce - www.wecai.org According to Wikipedia: Infographics (a clipped compound of "information" and "graphics") are graphic visual representations
CUPA-HR Chapters: WordPress Reference Guide
 CUPA-HR Chapters: WordPress Reference Guide Table of Contents How to Log In to WordPress... 1 How to Create a Page in WordPress... 2 Editing a Page in WordPress... 5 Adding Links in WordPress... 6 Adding
Excel 2013 Intermediate
 Excel 2013 Intermediate Quick Access Toolbar... 1 Customizing Excel... 2 Keyboard Shortcuts... 2 Navigating the Spreadsheet... 2 Status Bar... 3 Worksheets... 3 Group Column/Row Adjusments... 4 Hiding
Making Charts with Infogram
 Making Charts with Infogram In this lesson, you will learn how to make several basic interactive charts with an online tool called Infogram. First, download and open the Excel file infographics_data.xlsx.
Create and edit word processing. Pages.
 Create and edit word processing documents with Pages. In this chapter, we begin to get work done on the ipad by using Pages to create and format documents. Creating a New Document Styling and Formatting
WHCC Sports and Events
 WHCC Sports and Events We re using ROES Events as our ordering software for Sports and Events. This is a special version of ROES, written specifically for high volume events. There are two primary differences
Getting Around. Welcome Quest. My Fundraising Tools
 As a registered participant of this event, you have a variety of tools at your fingertips to help you reach your goals! Your fundraising center will be the hub for managing your involvement and fundraising
Word 2013 Quick Start Guide
 Getting Started File Tab: Click to access actions like Print, Save As, and Word Options. Ribbon: Logically organize actions onto Tabs, Groups, and Buttons to facilitate finding commands. Active Document
-Using Excel- *The columns are marked by letters, the rows by numbers. For example, A1 designates row A, column 1.
 -Using Excel- Note: The version of Excel that you are using might vary slightly from this handout. This is for Office 2004 (Mac). If you are using a different version, while things may look slightly different,
Using New Google Sites
 Using New Google Sites With the New Google Sites, building websites is easy. Just drag content where you need it. Create a onestop destination for all important information, including videos, images, calendars,
Classroom Blogging. Training wiki:
 Classroom Blogging Training wiki: http://technologyintegrationshthornt.pbworks.com/create-a-blog 1. Create a Google Account Navigate to http://www.google.com and sign up for a Google account. o Use your
DOING MORE WITH EXCEL: MICROSOFT OFFICE 2010
 DOING MORE WITH EXCEL: MICROSOFT OFFICE 2010 GETTING STARTED PAGE 02 Prerequisites What You Will Learn MORE TASKS IN MICROSOFT EXCEL PAGE 03 Cutting, Copying, and Pasting Data Filling Data Across Columns
The BLR Employee Handbook Builder allows you to create your own customized employee handbook. Benefits include:
 Introduction to BLR s Employee Handbook Builder The BLR Employee Handbook Builder allows you to create your own customized employee handbook. Benefits include: Ability to work on a handbook from any computer
How to Edit Your Website
 How to Edit Your Website A guide to using SimpleCMS Overview 2 Accessing the CMS 2 Resetting Your Password 2 Pages 3 Managing Files 3 Shortcuts 4 Uploading 4 Page Options 4 Relabel 4 Duplicate 4 Google
DOING MORE WITH EXCEL: MICROSOFT OFFICE 2013
 DOING MORE WITH EXCEL: MICROSOFT OFFICE 2013 GETTING STARTED PAGE 02 Prerequisites What You Will Learn MORE TASKS IN MICROSOFT EXCEL PAGE 03 Cutting, Copying, and Pasting Data Basic Formulas Filling Data
1. MS EXCEL. a. Charts/Graphs
 1. MS EXCEL 3 tips to make your week easier! (MS Excel) In this guide we will be focusing on some of the unknown and well known features of Microsoft Excel. There are very few people, if any at all, on
Getting Started with Second Life
 Getting Started with Second Life Go to www.secondlife.com and click on the orange Join Now button. Choose your avatar s (or your virtual self s) name. This does not need to be your real name. Upper and
PowerPoint 2007 Cheat Sheet
 ellen@ellenfinkelstein.com 515-989-1832 PowerPoint 2007 Cheat Sheet Contents Templates and Themes... 2 Apply a corporate template or theme... 2 Format the slide master... 2 Work with layouts... 3 Edit
Getting Started With the Cisco PAM Desktop Software
 CHAPTER 3 Getting Started With the Cisco PAM Desktop Software This chapter describes how to install the Cisco PAM desktop client software, log on to Cisco PAM, and begin configuring access control features
A new clients guide to: Activating a new Studio 3.0 Account Creating a Photo Album Starting a Project Submitting a Project Publishing Tips
 Getting Started With Heritage Makers A Guide to the Heritage Studio 3.0 Drag and Drop Publishing System presented by Heritage Makers A new clients guide to: Activating a new Studio 3.0 Account Creating
Learning to use the drawing tools
 Create a blank slide This module was developed for Office 2000 and 2001, but although there are cosmetic changes in the appearance of some of the tools, the basic functionality is the same in Powerpoint
Rev. C 11/09/2010 Downers Grove Public Library Page 1 of 41
 Table of Contents Objectives... 3 Introduction... 3 Excel Ribbon Components... 3 Office Button... 4 Quick Access Toolbar... 5 Excel Worksheet Components... 8 Navigating Through a Worksheet... 8 Making
Make it a Great Day at the Office: Essential Tips and Tricks for Office 2013 and Outlook 2013
 Computing Services and Systems Development Make it a Great Day at the Office: Essential Tips and Tricks for Office 2013 and Outlook 2013 Staff Association Council Computing Services and Systems Development
Reading Wonders: Importing Students & Adding Students to your Class
 Reading Wonders: Importing Students & Adding Students to your Class If you have not registered for Reading Wonders, first follow the tutorial Teacher Registration for Reading Wonders KEY POINT: You must
You can also search online templates which can be picked based on background themes or based on content needs. Page eleven will explain more.
 Microsoft PowerPoint 2016 Part 1: The Basics Opening PowerPoint Double click on the PowerPoint icon on the desktop. When you first open PowerPoint you will see a list of new presentation themes. You can
Dashboards and Portlets Instructions for the creation of End User Custom Dashboards and Portlets in the PPM system.
 Objective: To provide guidance to the PPM End User Community in the continued enhancement and engagement of new stakeholders to improve the End User Experience and the gathering and reporting of Actionable
Using Microsoft Excel
 About Excel Using Microsoft Excel What is a Spreadsheet? Microsoft Excel is a program that s used for creating spreadsheets. So what is a spreadsheet? Before personal computers were common, spreadsheet
Explore commands on the ribbon Each ribbon tab has groups, and each group has a set of related commands.
 Quick Start Guide Microsoft Excel 2013 looks different from previous versions, so we created this guide to help you minimize the learning curve. Add commands to the Quick Access Toolbar Keep favorite commands
What is OneNote? The first time you start OneNote, it asks you to sign in. Sign in with your personal Microsoft account.
 OneNote What is OneNote? OneNote is a digital notebook. In OneNote, you can: Type notes or record audio at your laptop. Sketch or write ideas on your tablet. Add picture from your phone. Find notes instantly.
Excel 2013 for Beginners
 Excel 2013 for Beginners Class Objective: This class will familiarize you with the basics of using Microsoft Excel. Class Outline: Introduction to Microsoft Excel 2013... 1 Microsoft Excel...2-3 Getting
Contents. WorkBook release note. WorkBook version: Release date: 06/02/2013. Author: René Præstholm Date: 06/02/2013
 WorkBook version: 8.2.80 Release date: 06/02/2013 Author: René Præstholm rp@workbook.net Date: 06/02/2013 General notice: As new views, tab s and reports are not automatically added to each user due to
Excel 2007 New Features Table of Contents
 Table of Contents Excel 2007 New Interface... 1 Quick Access Toolbar... 1 Minimizing the Ribbon... 1 The Office Button... 2 Format as Table Filters and Sorting... 2 Table Tools... 4 Filtering Data... 4
Placing an Order. Error! No text of specified style in document. page 1
 Placing an Order Error! No text of specified style in document. page 1 Overview of the Order Sheet This section will help you navigate around the order sheet and change settings to customise your view
= 3 + (5*4) + (1/2)*(4/2)^2.
 + (1/2)*(4/2)^2.") Physics 100 Lab 1: Use of a Spreadsheet to Analyze Data by Kenneth Hahn and Michael Goggin In this lab you will learn how to enter data into a spreadsheet and to manipulate the data in meaningful ways.
Physics 100 Lab 1: Use of a Spreadsheet to Analyze Data by Kenneth Hahn and Michael Goggin In this lab you will learn how to enter data into a spreadsheet and to manipulate the data in meaningful ways.
Computer Applications Final Exam Study Guide
 Name: Computer Applications Final Exam Study Guide Microsoft Word 1. To use -and-, position the pointer on top of the selected text, and then drag the selected text to the new location. 2. The Clipboard
Netvibes A field guide for missions, posts and IRCs
 Netvibes A field guide for missions, posts and IRCs 7/2/2012 U.S. Department of State International Information Programs Office of Innovative Engagement Table of Contents Introduction... 3 Setting up your
How to design and print cards using a database connection with. emedia CS Software
 How to design and print cards using a database connection with emedia CS Software For this exercise, we will use a Database that has been created in EXCEL. The example below shows the database fields populated
Accessing the Dashboard link inside the Compeat Portal
 Setting up your Dashboards To access and setup your dashboards inside the Compeat Portal (https://portal.compeat.com), follow the steps outlined below. Accessing the Dashboard link inside the Compeat Portal
Discover the Start screen.
 Discover the Start screen. Your Start screen has all of the information that matters most to you. Live tiles keep you up to date. Your favorite apps, such as Office apps, People, News, and more are front
REMEMBER TO BRING YOUR MEMORY STICK TO EVERY LAB!
 CS 1033 Multimedia and Communications Lab 07: Introduction to Animation using Photoshop REMEMBER TO BRING YOUR MEMORY STICK TO EVERY LAB! LAB #7 - Exercise 1 Objectives: Upon completion of Exercise 1 you
OneDrive. Office 365
 OneDrive Office 365 What s covered? What is OneDrive? (slide 2-3) Is OneDrive like Microsoft Office? (slide 4) How do I get started? (slide 5-6) File types in the documents list (slide 7) How do I get
DOING MORE WITH POWERPOINT: MICROSOFT OFFICE 2013
 DOING MORE WITH POWERPOINT: MICROSOFT OFFICE 2013 GETTING STARTED PAGE 02 Prerequisites What You Will Learn USING MICROSOFT POWERPOINT PAGE 03 Slide Views MORE TASKS IN MICROSOFT POWERPOINT PAGE 05 Formatting
Excel 2016 Charts and Graphs
 Excel 2016 Charts and Graphs training@health.ufl.edu Excel 2016: Charts and Graphs 2.0 hours This workshop assumes prior experience with Excel, Basics I recommended. Topics include data groupings; creating
LimeSurvey User Guide to Creating Surveys
 LimeSurvey User Guide to Creating Surveys Created: October 7, 2016 Last updated: March 20, 2017 Contents Gaining access to LimeSurvey... 3 Change your LimeSurvey password... 3 Importing an existing survey
DecisionPoint For Excel
 DecisionPoint For Excel Getting Started Guide 2015 Antivia Group Ltd Notation used in this workbook Indicates where you need to click with your mouse Indicates a drag and drop path State >= N Indicates
Cognos Analytics Reporting User Interface
 September 12, 2017 (v12.2.2 - BI v11) Cognos Analytics Reporting User Interface Business Intelligence Cognos Analytics Reporting Cognos Analytics Reporting is a Web-based tool used to create ad-hoc reports
Cognos. Active Reports Development. Presented by: Craig Randell
 Cognos Active Reports Development Presented by: Craig Randell Objectives: Understand the purpose and benefits of Active Reports Through theory and demonstration introduce the different Active Report Components
Office 365 for ipad. OneDrive for Business Word Excel PowerPoint OneNote Lync OWA for ipad
 Office 365 for ipad Get your Office 365 apps for your ipad for free! Below is a list of links to the Office apps that are available for the ipad in the App Store. Before you begin, make sure you know your
GETTING STARTED. A Step-by-Step Guide to Using MarketSight
 GETTING STARTED A Step-by-Step Guide to Using MarketSight Analyze any dataset Run crosstabs Test statistical significance Create charts and dashboards Share results online Introduction MarketSight is a
Supplier Engagement (HE): Dashboard Guidance
: Dashboard Guidance") Supplier Engagement (HE): Dashboard Guidance Logging in To access your data, you will need to click on the About You tab and enter your username and password. These will have been supplied to you on sign-up
Supplier Engagement (HE): Dashboard Guidance Logging in To access your data, you will need to click on the About You tab and enter your username and password. These will have been supplied to you on sign-up
Chronodat Issue Tracker Add-in. User Manual CHRONODAT, LLC. February 15, 2017 Version P age
 Chronodat Issue Tracker Add-in User Manual CHRONODAT, LLC February 15, 2017 Version 2.0 1 P age Introduction The introduction section of the document describes the scope and objective of Office 365 Chronodat
Presents: PowerPoint 101. Adapted from the Texas State Library s TEAL for All Texans Student Resources Manual
 Presents: PowerPoint 101 Adapted from the Texas State Library s TEAL for All Texans Student Resources Manual PowerPoint Topics Intro to PowerPoint Designing a Presentation The Next Level Goals and Objectives
Designed by Jason Wagner, Course Web Programmer, Office of e-learning NOTE ABOUT CELL REFERENCES IN THIS DOCUMENT... 1
 Excel Essentials Designed by Jason Wagner, Course Web Programmer, Office of e-learning NOTE ABOUT CELL REFERENCES IN THIS DOCUMENT... 1 FREQUENTLY USED KEYBOARD SHORTCUTS... 1 FORMATTING CELLS WITH PRESET
RefChatter WebClient (Updated February 2017)
") RefChatter WebClient (Updated February 2017) URL: https://refchatter.net/webclient Login Screen: Sign in with your username and password. 1 Queue Selection: Select / unselect queues and click Begin Staffing
RefChatter WebClient (Updated February 2017) URL: https://refchatter.net/webclient Login Screen: Sign in with your username and password. 1 Queue Selection: Select / unselect queues and click Begin Staffing
Beginner s Guide to Microsoft Excel 2002
 Beginner s Guide to Microsoft Excel 2002 Microsoft Excel lets you create spreadsheets, which allow you to make budgets, track inventories, calculate profits, and design charts and graphs. 1. Open Start
Section 1 Microsoft Excel Overview
 Course Topics: I. MS Excel Overview II. Review of Pasting and Editing Formulas III. Formatting Worksheets and Cells IV. Creating Templates V. Moving and Navigating Worksheets VI. Protecting Sheets VII.
Introduction to Microsoft Excel 2010
 Introduction to Microsoft Excel 2010 This class is designed to cover the following basics: What you can do with Excel Excel Ribbon Moving and selecting cells Formatting cells Adding Worksheets, Rows and
Code Finix Label Designer V 1.0 User Guide
 Code Finix Label Designer V 1.0 User Guide Introduction Welcome, Code Finix Label Designer is a family of professional labeling software products that brings a complete barcode printing solution for desktop
My Awesome Presentation Exercise
 My Awesome Presentation Exercise Part One: Creating a Photo Album 1. Click on the Insert tab. In the Images group click on the Photo Album command. 2. In the Photo Album window that pops up, look in the
Basic tasks in Excel 2013
 Basic tasks in Excel 2013 Excel is an incredibly powerful tool for getting meaning out of vast amounts of data. But it also works really well for simple calculations and tracking almost any kind of information.
POWERPOINT BASICS: MICROSOFT OFFICE 2010
 POWERPOINT BASICS: MICROSOFT OFFICE 2010 GETTING STARTED PAGE 02 Prerequisites What You Will Learn USING MICROSOFT POWERPOINT PAGE 03 Microsoft PowerPoint Components SIMPLE TASKS IN MICROSOFT POWERPOINT
User Guide. Web Intelligence Rich Client. Business Objects 4.1
 User Guide Web Intelligence Rich Client Business Objects 4.1 2 P a g e Web Intelligence 4.1 User Guide Web Intelligence 4.1 User Guide Contents Getting Started in Web Intelligence 4.1... 5 Log into EDDIE...
WINDOWS 8.X SIG SEPTEMBER 22, 2014
 New Start Screen: Top RIGHT corner next to your Sign in Name is the OFF button. To the Right of Off button is a Search icon You can click on Search icon OR just start typing anywhere in open area of Start
Getting Started Guide
 Getting Started Guide for education accounts Setup Manual Edition 7 Last updated: September 15th, 2016 Note: Click on File and select Make a copy to save this to your Google Drive, or select Print, to
Interactive Tourist Map
 Adobe Edge Animate Tutorial Mouse Events Interactive Tourist Map Lesson 1 Set up your project This lesson aims to teach you how to: Import images Set up the stage Place and size images Draw shapes Make
Syllabus KCXXXXXX: Excel Level I, Version 2010
 Syllabus KCXXXXXX: Excel Level I, Version 2010 ITSW 1022 Introduction to Electronic Spreadsheets 8 classroom hours Course Description: This course is designed to introduce the student to basic spreadsheet
Data. Selecting Data. Sorting Data
 1 of 1 Data Selecting Data To select a large range of cells: Click on the first cell in the area you want to select Scroll down to the last cell and hold down the Shift key while you click on it. This
Online Fundraising Guide
 Online Fundraising Guide Step by Step Guide to Your Participant Center Learn How To: Access Your Participant Center Navigate Your Participant Center Home Page Update Your Fundraising Goal Send Emails From
User s Guide
 User s Guide 03.28.2017 Accessing Pathfinder Edge Pathfinder Edge can be accessed from anywhere you have an internet connection and a web browser. To ensure the best performance, we recommend using Pathfinder
Creating Charts in Office 2007 Table of Contents
 Table of Contents Microsoft Charts... 1 Inserting a Chart in Excel... 1 Tip Shortcut Key to Create a Default Chart in Excel... 2 Activating Your Chart... 2 Resizing an Embedded Chart... 2 Moving a Chart...
GOLF MS ONLINE FUNDRAISING GUIDE
 GOLF MS ONLINE FUNDRAISING GUIDE Accessing Your Participant Center Step 1: Visit the Golf MS website at http://eventmig.nationalmssociety.org/site/tr?fr_id=25680&pg=entry (We suggest you bookmark this
3. Prepare all your graphs, illustrations and text by cutting them to size. For straight lines use a guillotine.
 Infographic Production Introduction There are multiple ways of making an infographic. Professional designers commonly use graphical illustration packages to compile the various components but a Data Scientist
USER GUIDE: EDITOR. Drag & drop system: Content Manager Style Editor Add Elements Undo/Redo Save...
 USER GUIDE: EDITOR Drag & drop system:... 2 1. Content Manager... 3 2. Style Editor... 5 3. Add Elements... 6 4. Undo/Redo... 13 5. Save... 13 When we access Zeendo s website editor, we can see a series
EVALUATION ONLY. Table of Contents. iv Labyrinth Learning
 Quick Reference Tables Preface EXCEL 2013 LESSON 1: EXPLORING EXCEL 2013 Presenting Excel 2013 Starting Excel Windows 7 Windows 8 Exploring the Excel Program Window Using Worksheets and Workbooks Mousing
Navigating Your CrowdRise Dashboard Team Member Guide
 Navigating Your CrowdRise Dashboard Team Member Guide Once you have set up a fundraising page and added some pictures, it s time to explore more options available on your Dashboard. Step 1 - Log in to
Microsoft Office Excel
 Microsoft Office 2007 - Excel Help Click on the Microsoft Office Excel Help button in the top right corner. Type the desired word in the search box and then press the Enter key. Choose the desired topic
A Student s Guide to Taking Notes Using Microsoft Word 2013
 A Student s Guide to Taking Notes Using Microsoft Word 2013 Erin Moreira UMass Amherst 2015 A Student s Guide to Taking Notes Using Microsoft Word 2013 Acknowledgements I would like to thank Professor
Creating a Histogram Creating a Histogram
 Creating a Histogram Another great feature of Excel is its ability to visually display data. This Tip Sheet demonstrates how to create a histogram and provides a general overview of how to create graphs,
Sample A2J Guided Interview & HotDocs Template Exercise
 Sample A2J Guided Interview & HotDocs Template Exercise HotDocs Template We are going to create this template in HotDocs. You can find the Word document to start with here. Figure 1: Form to automate Converting
Advanced Training Manual: Surveys Last Updated: October 2013
 Advanced Training Manual: Surveys Last Updated: October 2013 Advanced Training Manual: Surveys Page 1 of 28 Table of Contents Introduction Training Objective Surveys Overview Survey Table Survey Options
How to Use Google. Sign in to your Chromebook. Let s get started: The sign-in screen. https://www.youtube.com/watch?v=ncnswv70qgg
 How to Use Google Sign in to your Chromebook https://www.youtube.com/watch?v=ncnswv70qgg Use a Google Account to sign in to your Chromebook. A Google Account lets you access all of Google s web services
Making Tables and Graphs with Excel. The Basics
 Making Tables and Graphs with Excel The Basics Where do my IV and DV go? Just like you would create a data table on paper, your IV goes in the leftmost column and your DV goes to the right of the IV Enter
Building a Waterfall Chart in Excel
 July 29, 2015 Building a Waterfall Chart in Excel Also known as a bridge chart Introduction A Waterfall chart is a special type of Excel column chart which is utilized to highlight how a value starting
BUILDING A WATERFALL CHART IN EXCEL
 July 27, 2015 BUILDING A WATERFALL CHART IN EXCEL Also known as a bridge chart INTRODUCTION A Waterfall chart is a special type of Excel column chart which is utilized to highlight how a value starting
How to Edit Your Website
 How to Edit Your Website A guide to using your Content Management System Overview 2 Accessing the CMS 2 Choosing Your Language 2 Resetting Your Password 3 Sites 4 Favorites 4 Pages 5 Creating Pages 5 Managing
Creating a new project To start a new project, select New from the File menu. The Select Insert dialog box will appear.
 Users Guide Creating a new project To start a new project, select New from the File menu. The Select Insert dialog box will appear. Select an insert size When creating a new project, the first thing you
Word Creating & Using Tables. IT Training & Development (818) Information Technology
 Information Technology") Information Technology Word 2007 User Guide Word 2007 Creating & Using Tables IT Training & Development (818) 677-1700 training@csun.edu www.csun.edu/it/training Table of Contents Introduction... 1 Anatomy
Information Technology Word 2007 User Guide Word 2007 Creating & Using Tables IT Training & Development (818) 677-1700 training@csun.edu www.csun.edu/it/training Table of Contents Introduction... 1 Anatomy
Working with Charts Stratum.Viewer 6
 Working with Charts Stratum.Viewer 6 Getting Started Tasks Additional Information Access to Charts Introduction to Charts Overview of Chart Types Quick Start - Adding a Chart to a View Create a Chart with
Creating and Modifying Charts
 Creating and Modifying Charts Introduction When you re ready to share data with others, a worksheet might not be the most effective way to present the information. A page full of numbers, even if formatted
Open. Select the database and click. Print. Set printing options using the dropdown menus, then click the
 The Original Quick Reference Guides Microsoft Access 2010 Access is a tool for creating and managing databases collections of related records structured in an easily accessible format such as a table,
NiCHE Website Posting Guidelines & Best Practices (updated 22 December, 2013)
") NiCHE Website Posting Guidelines & Best Practices (updated 22 December, 2013) Getting oriented Registering for an account The WordPress Dashboard Editing your profile What to do if you ve lost your password
NiCHE Website Posting Guidelines & Best Practices (updated 22 December, 2013) Getting oriented Registering for an account The WordPress Dashboard Editing your profile What to do if you ve lost your password
Microsoft Excel 2007
 Learning computers is Show ezy Microsoft Excel 2007 301 Excel screen, toolbars, views, sheets, and uses for Excel 2005-8 Steve Slisar 2005-8 COPYRIGHT: The copyright for this publication is owned by Steve
Navigation and Login. Username and Password fields. Clicking on Forgot Password? will Redirect to password.cscc.edu
 Navigation and Login Navigate to one of the following web addresses: On campus: https://service.cscc.edu or off campus: https://cscc.serviceprocloud.com/cloud9 Type in your CSCC username and password Click
Advanced Excel Charts : Tables : Pivots
 Advanced Excel Charts : Tables : Pivots Protecting Your Tables/Cells Protecting your cells/tables is a good idea if multiple people have access to your computer or if you want others to be able to look
At least one Charley File workbook for New Excel. This has an xlsx extension and is for PC Excel 2007, Mac Excel 2008, and after.
 Getting Started By Charley Kyd Kyd@ExcelUser.com Welcome to Charley s Swipe Files! My personal collection of charts and tables clipped from magazines and newspapers is a valuable resource for me. I hope
2 Work with Slides. Adding and Deleting Slides
 2 Work with Slides In this chapter, you will learn how to Add and delete slides. Add slides with ready-made content. Divide presentations into sections. Rearrange slides and sections. For each slide to
POWERPOINT PRESENTATION SOFTWARE
 POWERPOINT PRESENTATION SOFTWARE Objectives Guide to completing Power Point Presentations Provide overview of functions, settings and tools Advanced features Beyond Basic The use of Hyperlinks Explain