Historic Building Information Modelling Phd
|
|
|
- Kristina Summers
- 5 years ago
- Views:
Transcription


1 Dublin Institute of Technology From the SelectedWorks of Maurice Murphy Spring April 3, 2012 Historic Building Information Modelling Phd Maurice Murphy, Dublin Institute of Technology Available at:
2 Historic Building Information Modelling (HBIM) For Recording and Documenting Classical Architecture in Dublin 1700 to 1830 Maurice Murphy Mphil, MBEng, Department of Civil, Structural & Environmental Engineering School of Engineering Trinity College Dublin A thesis submitted for the degree of Doctor of Philosophy April 2012
3 Declaration. 1. This thesis has not been submitted as an exercise for a degree at this or any other University. 2. This thesis is entirely my own work. 3. A full list of papers published through the course of this thesis is contained in appendix A (page160). 4. I agree that the Library may lend or copy the thesis upon request. Maurice Murphy 30 th April
4 Abstract Historic Building Information Modelling (HBIM) is a novel prototype library of parametric objects, based on historic architectural data, in addition to a mapping system for plotting the library objects onto laser scan survey data. The HBIM process begins with remote collection of survey data using a terrestrial laser scanner. This is then followed by the processing of the laser scan survey data to generate ortho-image and segmented point cloud data for mapping of library objects. The next stage involves the design of new shape and parametric rules for the construction of a library of objects that are based on 18th century architectural pattern books. In building parametric objects, the problem of file format and exchange of data have been overcome by using Geometric Descriptive Language (GDL). The final stage in the HBIM process is the development of a mapping system for plotting of the parametric objects as building components onto ortho-image and segmented point cloud data to create or form the entire building. The final HBIM product consists of building full 3D models including detail behind the object s surface, relating to its methods of construction and material makeup. HBIM can automatically generate conservation documentation in the form of survey data, orthographic drawings, schedules and 3D CAD models for both the analysis and conservation of historic objects, structures and environments. HBIM was evaluated through an end users scenario test and through consultation with an expert group working in the architectural heritage sector. The expert group carried out a review of conservation documentation produced from HBIM. In addition, the accuracy of HBIM was measured by comparing a sample of data from HBIM with related ground truth data. The outcome of the software testing indicated that HBIM was effective in producing conservation documentation. Additional design inputs were identified to improve the accuracy of the system expanding the parameters of the library objects and upgrading the mapping system. 3
5 CHAPTER 1 INTRODUCTION Overview Recording of historic structures Historic Building Information Modelling (HBIM) Aims and objectives Methodology Summary and overview of chapters CHAPTER 2 SURVEY DATA CAPTURE AND PROCESSING Overview Terrestrial laser scanners Combining laser scanning and digital imaging Errors in data collection Error reduction Processing laser and image survey data Pre-processing of laser survey data Data processing Ortho-image Accuracy of laser scanning for surveying historic structures Conclusion - a recording framework for HBIM HBIM recording framework Framework summary - data capture and processing CHAPTER 3 PARAMETRIC MODELLING Overview Creating engineering drawings from point cloud data Plotting onto laser scan surveys Manual mapping of vectors onto the point cloud
6 3.3 Parametric modelling based on architectural rules Parametric modelling Architectural rule based modelling Procedural modelling - shape grammars Evolution of Building Information Modelling (BIM) Evolutionary stages Building Information Modelling (BIM) A new concept - Historic Building Information Modelling (HBIM) Using architectural rules to develop 3D models Combining laser scanning and BIM based on architectural rules Historic Building Information Modelling (HBIM) - a new concept CHAPTER 4 - BUILDING A LIBRARY OF PARAMETRIC OBJECTS Overview A framework for assessing architectural rules An evolutionary time-frame for classical architecture Evolution of architectural manuscripts Architectural pattern books Interpreting the classical orders Geometric Descriptive Language (GDL) Description of GDL Modelling a Doric column using a GDL script Shape rules and parametric design Shape Rules Establishing new shape rules Shape rules for mouldings Parametric design based on shape rules Organic and non-uniform shapes GDL objects in building structures Walls brickwork, limitation of GDL Parametric design for building façade proportions and opening sizes Stonework
7 4.5.4 Sash windows Doors and door cases Roof construction Conclusion CHAPTER 5: - PLOTTING PARAMETRIC OBJECTS Overview Case Studies - A mapping process for HBIM Case Studies Case study 1- façade plot of no 3 Henrietta Street Case study 2 - door case to number 3 Henrietta Street Case study 3 - plotting the whole of Henrietta Street Summary of plotting process Improving the mapping process Summary of design rationale A scaling and measurement application Implementation and design Combing web-based application with GDL script Creating conservation documentation from laser scan surveys Conclusion CHAPTER 6: - HBIM EVALUATION AND TESTING Overview Conservation scenarios - definition Conservation documentation definition Scenario 1: end-user test Participants Conservation scenario Results Review of results end-user scenario Scenario 2: Evaluation of conservation documentation
8 6.3.1 Participants profile Scenario design Results - conservation documentation Accuracy of façade plot measured against ground truth data Conclusion CHAPTER 7: - CONCLUSIONS AND FUTURE WORK Overview of the HBIM process HBIM stages and procedures Data capture and processing Using architectural rules to develop 3D models New shape rules and parametric design A processing pipeline for mapping in HBIM HBIM evaluation and testing A framework for HBIM Future work REFERENCES Appendix A: Library of GDL codes Appendix B: List of publications: Maurice Murphy Appendix C: End user questionnaire
9 List of Figures Figure 1: HBIM Framework Figure 2: Riegl, terrestrial laser scanner Figure 3: Point cloud and textured point cloud Figure 4: Triangulation - creates a surface on a point cloud Figure 5: Texture from associated image information Figure 6: Creation of Ortho-image Figure 7: Location of Henrietta Street Figure 8: Trimble GS 200 terrestrial laser Figure 9: Optimal scan positions Figure 10: Point cloud registration and targets Figure 11: Segmented point cloud Figure 12: Mesh as 3D data Figure 13: Orthographic Image Figure 14: Views of Henrietta Street from laser scan survey Figure 15: Cathedral of Saint Pierre de Beauvais Figure 16: Vector mapping onto a point cloud surface Figure 17: Evolution Of Architectural Rules, Figure 18: William Chambers: The Casino in Marino Figure 19: Tuscan and Doric orders Figure 20: Ionic, Corinthian and composite orders Figure 21: Pattern Book Details Figure 22: Simple Doric Column Figure 23: Shape change Figure 24: Shape grammar - architectural mouldings Figure 25: Basic shape rules for mouldings Figure 26: Compound shape rules for mouldings Figure 27: Shape array - 3D Objects mouldings Figure 28: Moulding Script Figure 29: Parametric Script Figure 30: GDL code for Torus and Cavetto Figure 31: Shape array circular mouldings Figure 32: Doric column Figure 33: Doric column and entablature Figure 34: Construction of the Ionic volute
10 Figure 35: Ionic capital Figure 36: Building of Corinthian leaf and capitol Figure 37: Point cloud and textured point cloud Figure 38: Proportions for façades and openings Figure 39: Wall Façade as a GDL object Figure 40: Stonework details in walls and openings Figure 41: Sash windows Figure 42: Doric and Ionic door case Figure 43: Shape rules for roof construction Figure 44: Roof types and construction Figure 45: Example of architectural rules in façade plot Figure 46: Plotting external wall Figure 47: Plotting openings Figure 48: Positioning windows in plan Figure 49: 3D view of widow and dialogue box Figure 50: Plot of wall and windows Figure 51: Mapping pediment and column objects Figure 52: Survey data for door case Figure 53: Plotting columns, door case and pediment Figure 54: Plotting the whole building Figure 55: Plotting the whole street Figure 56: Code sample for web application Figure 57: Photo scaling application Figure 58: GDL script for automating wall panels Figure 59: Drawings produced from HBIM Figure 60: drawings produced from HBIM Henrietta Street Figure 61: Survey data for construction the 3D model of the historic façade Figure 62: Comparison of complexity between 3D CAD and HBIM Figure 63: Time taken to learn to use HBIM in comparison to 3D CAD Figure 64: Preferred sources of data for plotting 3D model Figure 65: Identification of error sources in plotting 3D model Figure 66: Calculating parameters and sizing objects Figure 67: Mapping the parametric objects Figure 68: Comparison in the production of conservation documentation Figure 69: Accuracy of documentation in HBIM Figure 70: Texturing objects Figure 80: Historic data and definition of objects
11 Table 1: Registration results Table 2: Elements According To Vignola (Ware, 1903) Table 3: Resolution of errors in HBIM Table 5: Comparison between Total Station data and Plot A x axis Table 6: Comparison between Total Station data and Plot A y axis Table 7: Comparison between Total Station data and Plot B x axis Table 8: Comparison between Total Station data and Plot B y axis Table 9: Density of point cloud and measurement precision (Bryan et al., 2004) Equation Equation
12 Chapter 1 Introduction
13 1.1 Overview Recording of historic structures Traditional methods used for surveying and recording historic structures are based on (a) manual measurement systems using tapes and levels, (b) manual measurement systems using optical equipment (theodolite and level), and (c) imaged-based systems using rectified photography or photogrammetry. More recently, digital technologies have automated the processes of both the collection and the processing of measurement data. These technologies are based on the use of lasers to determine range, digital photo modelling for supplying geometry and texture, and software platforms to compute and model virtual buildings and environments. In addition to developments in digital recording technologies, new techniques have emerged for modelling architectural heritage based on parametric 3D CAD and procedural modelling. Historic Building Information Modelling is now proposed as a novel innovation that combines and leverages the potential of these new developments, Historic Building Information Modelling (HBIM) Historic Building Information Modelling (HBIM) is a novel prototype library of parametric objects, based on historic architectural data, in addition to a mapping system for plotting the library objects onto laser scan survey data (see figure 1). These elements (including detail behind the object s surface) are accurately mapped onto a survey produced from laser scanning that represents the geometry and fabric of the building. The architectural elements are scripted using a Geometric Descriptive Language (GDL). The design and detail for the parametric objects are based on architectural manuscripts ranging from Palladio to the architectural pattern books of the 18th century. The architecture of the Renaissance and the detail in architectural pattern books introduced and documented advanced scientific rules for the production of architectural elements, and these rules assist the design of parametric models. The use of historic data introduces the opportunity to develop the details behind the object s surface concerning its methods of construction and material makeup. This is not the case with surveys based on laser scanning as they represent the recorded surface only. The parametric objects, which 12

14 represent architectural elements and detail from pattern books, are contained within prototype libraries. The parametric objects are mapped onto ortho-image and segmented point cloud data using a new system for mapping within existing software platforms and a newly designed web-based ortho-image scaling application. The web-based application is used for extracting measurements from ortho-image and segmented point cloud data. Conservation documentation in the form of survey data, orthographic drawings and schedules and 3D CAD models can then be automatically produced from the Historic Building Information Model. Conservation documentation is a process of recording historic structures and environments over different timeframes to enable the supply of accurate information for the correct conservation and maintenance of a historic structure or artefact. Figure 1: HBIM Framework 13
15 The initial motivation for this work has evolved from attempts to produce conservation documentation from surveys based on laser scanning of historic structures in Ireland. A second and fundamental impetus for this work is to develop a new system to apply advanced CAD systems, combined with laser scanning survey data, for the documentation of architectural heritage. Building Information Modelling (BIM) is applied to designing new buildings and new innovations are concentrated around plug-ins for energy, structural and economic analysis, and scheduling of components as an addition to new architectural design (Eastman, 2007). Fai et al (2011) have applied BIM for the documentation of historic buildings and also generating BIM models from laser scan survey data. Fai et al (2011) concentrated on the problems associated with combining laser scanning and BIM and plotting generic library objects onto the scan in a BIM environment. HBIM can provide automated conservation documentation and differs from the sophisticated 3D models produced from procedural and other parametric modelling approaches whereby the main product is a visualisation tool. Within the research areas of both procedural and parametric modelling the use of architectural knowledge to inform the creation of models has now developed into a common part of the design approach. Using historic data to re-create the past or to restore or conserve historic artefacts and buildings is common in the wider area of conservation (ICOMOS, 1964b) and is a wide area of research. Existing research in the area of parametric modelling of architectural heritage has initiated a new direction by examining how architectural historic rules can be exploited to build computer models of historic structures and their elements. While these works inform the HBIM approach, HBIM differs in its approach to the analysis of historic data and parametric design. Firstly, HBIM refines and develops the information for building its parametric objects from the detail of architectural pattern books relating to very specific timeframes. This is in contrast to the work of De Luca (2012) who refers only the main classical architectural cannons (e.g. Vitruvius, Palladio, Vignola etc.) as a data source. De Luca (2012) work is more general in architectural detail and historic timeframes. Secondly, HBIM generates conservation documentation in addition to visualisation models as opposed to producing visualisation models only as in the case of parametric modelling (De Luca et al., 2011, De 14
16 Luca et al., 2007, Chevrier et al., 2010) and procedural modelling (Guidi et al., 2008). Finally, the use of a Geometric Descriptive Language (GDL) introduces the opportunity to develop a new parametric design framework for modelling architectural heritage. 1.2 Aims and objectives The overall aim of this research is to develop the HBIM process to generate conservation documentation from survey data, which is based on terrestrial laser scanning of postmedieval historic structures ( ). The objectives are as follows: 1. Identify a system for recording historic structures and environments based on terrestrial laser scanning; 2. Develop a workflow system for processing the terrestrial laser scanning survey data as an initial mapping framework for the HBIM process; 3. Introduce new shape rules and parametric design based on 18 th and 19 th century architectural pattern books to reproduce classical elements as 3D parametric CAD objects; 4. Construct 3D objects based on the new shape rules and parametric design using a Geometric Descriptive Language (GDL); 5. Develop a mapping system for plotting the parametric objects onto the laser scan and image survey data; 6. Create Historic Building Information Models (HBIM) of building structures and elements; 7. Automatically generate conservation documentation which consists of survey data, orthographic drawings, schedules and 3D CAD models for both the analysis and conservation of historic objects, structures and environments; 8. Test and evaluate HBIM. 1.3 Methodology The methodology applied to develop HBIM is integrated and described across the different chapters of this thesis, and is summarised in this section. The analysis for 15
17 modelling of architecture is confined to the classical period in the 18th and early 19th centuries in Ireland, which is described as the Georgian period (Craig, 1980). The initial methodology used for recording of historic structures is based on terrestrial laser scanning. A design for a survey-framework is presented, which is appropriate for recording the type of architecture that is the subject of study in this research. The framework describes the optimal laser scanning instrument positions, resolution for survey data, registration methods and details for overlapping of scans. A processing pipeline is developed using appropriate software platforms to generate the required survey products for mapping in HBIM. These consist of the following types of data: segmented point cloud, mesh data and orthographic images. A historic framework for building a parametric library of architectural elements is developed through assessing the evolution of architectural manuscripts. The analysis and interpretation of architectural rules are based on architectural pattern books from the 17th and 18th centuries and are used to develop new shape rules and parametric design for building a library of parametric objects. Geometric Descriptive Language (GDL) is applied for the development of parametric and shape rules to reproduce the classical elements detailed in the pattern books. Non-uniform and organic shapes are developed in GDL through a series of procedures that attempt to maximise parametric content of the objects. The library objects are stored as individual parametric objects or combined to make larger objects in a library. When the parametric objects are used in the HBIM platform they can be varied and deformed to match requirements. The new library of parametric objects is developed as a plug-in for the software platform Graphisoft ArchiCAD (Graphisoft, 2011). A process is developed for mapping parametric objects onto laser scan survey data. Library objects are regenerated and deformed by changing parameters and this is based on numeric data. To facilitate this, a photo scaling application, which is web-based, has been developed and is used for plotting and measuring distances and angular values using two-dimensional data. This automates the production of numeric parametric data for revising and plotting the library objects onto the laser survey data. A design for end-user scenario testing is presented and implemented to assess the suitability of HBIM as a tool for the generating documentation for the conservation 16
18 process of historic structures and environments. A sample set of conservation documents is produced and evaluated by an expert group in the field of conservation. Finally the accuracy of HBIM is measured by comparing a sample of data from HBIM with related ground truth data recorded using a total station. 1.4 Summary and overview of chapters Chapter 2 - Survey data capture and processing The aim of this chapter is to present in detail the procedures for remote data capture using terrestrial laser scanning and the subsequent processing of the survey data for further processing in HBIM. Initially a description of terrestrial laser scanning used for recording historic structures is presented. An explanation of the processing stages of the survey data based on terrestrial laser scanning is then presented. The product of the laser scan survey is described as a point cloud, which represents the x, y and z coordinates of a scanned object. The point cloud can then be textured from image data to create a virtual 3D model of a structure or object. In conclusion, a framework for recording and processing terrestrial laser scanning survey data is presented as the initial stage in the HBIM process. Chapter 3 Parametric modelling The incorporation of parametric modelling and laser scan survey data for recording of historic structures is examined in this chapter. Initially, the problems associated with mapping vectors onto laser scan survey data to create engineering drawings are detailed. This is followed by an analysis of parametric modelling whereby architectural rules are employed to assist the mapping of 3D objects onto laser scan surveys to create full virtual models of historic structures. In addition, the area of procedural modelling is briefly outlined which also employs architectural rules but is an automatic modelling system. The existing systems of parametric and procedural modelling create detailed visualisation models but do not automate the production of engineering drawings and conservation documentation. 17
19 Chapter 4 Building a library of parametric objects A new system for building a library of parametric architectural elements is proposed in this chapter as the next stage in the Historic Building Information Modelling (HBIM) process. An outline of the evolution of classical architectural rules is presented in this chapter in the form of a narrative structure that establishes a time-frame to identify precise architectural historic sources. The interpretation and understanding of architectural rules is outlined based on the analysis of architectural pattern books. The architectural pattern books of the 18 th and 19 th centuries contain precise detail concerning classical architecture and rules. The development of new shape rules and parametric design for HBIM is proposed. The new shape rules and parametric design are applied to reproduce classical elements as 3D computer models, which are coded using a Geometric Descriptive Language (GDL). The analysis for modelling of architecture is confined to the classical period in the 17th and early 18th centuries in Ireland which is described as the Georgian period (Craig, 1980). Chapter 5: Plotting parametric objects A new methodology for accurately mapping the parametric objects onto survey data based on terrestrial laser scanning is proposed in this chapter. The library of parametric objects is designed as a plug-in for existing software platforms with the addition of a set of procedures and a framework for mapping these objects onto survey data, which is based on terrestrial laser scanning. The point cloud data can be considered as a skeletal framework, which is then mapped using parametric architectural elements to form the HBIM. Ortho-images and segmented point cloud sections and elevations are the initial data imported as image and geometric data for further processing within the HBIM platform. The point cloud is segmented to provide floor plans, elevations and sectional cuts as a map for location of library objects. Further interrogation of the point cloud provides numeric values for parametric values for the library objects themselves and these are recorded in data sheets. A specialised web-based ortho-photo scaling application has been developed as an integral part of HBIM to automatically supply the numeric and measurement data for adjusting the parameters and plotting library objects. 18
20 Chapter 6: Evaluation and testing of Historic Building Information Modelling A design framework for testing of Historic Building Information Modelling (HBIM) is presented in this chapter based on conservation scenarios developed by experts and end users to evaluate its effectiveness. The evaluation and testing scenarios are broken into three distinctive areas. The first area is an end-user test of the software by practitioners under designed conditions and protocols. The second involves the testing of accuracy of HBIM conservation documentation against ground truth data. The third involves consultation with conservation experts to determine the effectiveness of HBIM as a tool for producing conservation documentation. National and international standards for producing conservation documentation are outlined to establish standards for HBIM. The methodology for designing the conservation end user test scenarios is presented. The results of the end-users testing are reported on and the required improvements and advantages of HBIM are defined. Chapter 7: Conclusion and future work A final summary of HBIM is presented in this chapter with a description of each the interconnecting stages, which make up the process. Final observations are made concerning each of these stages and a framework is presented to describe the full HBIM process. In conclusion a proposal for the further development is presented identifying future areas of work for HBIM. 19
21 2 Chapter 2 Survey Data Capture and Processing
22 2.1 Overview The aim of this chapter is to present in detail the procedures for remote data capture using terrestrial laser scanning and the subsequent processing of the survey data. Initially, a description of terrestrial laser scanning used for recording historic structures is presented. An explanation of the processing stages of the survey data based on terrestrial laser scanning is then presented. 2.2 Terrestrial laser scanners The terrestrial laser scanner is a device that automatically measures the three-dimensional co-ordinates of a given region of an object s surface, in a systematic pattern at a high capture rate in near real time. The laser ranger is directed towards an object by reflective surfaces that are encoded so that their angular orientation can be determined for each range measurement. The entire instrument and/or the recorded object are rotated to achieve, where possible, complete 3D point coverage (Mills and Barber, 2004). There are three types of scanners suitable for metric surveys for cultural heritage: triangulation, phase comparison and time of flight scanners. Triangulation scanners calculate 3D co-ordinate measurements by triangulation of the spot or stripe of a laser beam on an object s surface that is recorded by one or more CCD (charge-coupled device) cameras. Phase comparison systems calculate range based on the difference in phase between emitted and returning wavelengths. Time of flight scanners (Figure 2) calculate range, or distance, from the time taken for a laser pulse to travel from its source to an object and be reflected back to a receiving detector (Boehler et al., 2001). Details of the Riegl laser scanner and combined camera system are illustrated in Figure 2. The Range finder electronics are indicated at (1) in the main body of the scanner. The vertical deflection of the laser beam shown at (2) is directed towards an object by a polygon (3), which is made up of a number of reflective surfaces. The horizontal scan is achieved by rotating the complete optical head (4) up to 360. The scan-data, which consists of range, angle, and signal amplitude, is transmitted to a processor through data cables (6). A camera (5) is located on the same vertical axis as the scanner. A separate cable (7) feeds the digital data into a processor. The right hand side of the image shows the scanner in operation in Henrietta Street, Dublin. 21

23 Figure 2: Riegl, terrestrial laser scanner Riegl LMS-Z420i (Riegl Laser Scanning, 2006) Combining laser scanning and digital imaging Most modern scanning systems are fitted with a CCD (charge-coupled device) digital camera and the image data that is captured can be used to colour the product of the laser scan survey data (the point cloud). The point cloud represents the x, y, z coordinates of a scanned object an example of which is illustrated in detail 1 in Figure 3. The object in this case is the façade of number 3 Henrietta Street, which is an 18th century Georgian Street in Dublin. 22
.")

24 Figure 3: Point cloud and textured point cloud The red, green and blue (RGB) wavelength data from a digital camera can be mapped onto point cloud data, taking into account instrument rotation and perspective projection; this is illustrated in detail 3 in Figure 3. Both the laser scanner and camera must be correctly geometrically calibrated (Abmayr et al., 2005). Camera calibration is introduced to correct the distortion of camera lenses, and any perspective distortion contained in the images is removed by mapping onto the point cloud. The mounting position and orientation of the accompanying camera is defined with respect to the scanner s coordinate system, with every image representing a calibrated and registered image. High-resolution colour images can be precisely mapped onto a geometric model represented by a point-cloud, provided that the camera position and orientation are known in the coordinate system of the geometric model (Beraldin, 2004). Although most modern laser scanners tend to have the camera optics located co-axially with the scanners optics. 2.3 Errors in data collection Errors in data collection can occur due to the following: inaccuracy in angular and range calibration; edge detection; environmental conditions and surface reflectivity. The angular accuracy of laser scanning instruments is dependent on the accuracy and calibration of the encoded mirrors (Barber et al., 2006). Angular accuracy is also determined by errors in the vertical axis, which occur if the vertical axis has deviations to the nominal vertical axis (Schulz and Ingensand, 2004, ). Higher-end instruments now 23
25 have dual-axis compensation so this is no longer an issue with newer instruments. Errors occur in edge detection when the laser beam moves over an edge and the whole laser spot cannot be identified as a part of it falls on both sides, resulting in the incorrect recording of edge points (Böhler et al., 2003). The laser scanner must be used within a certain temperature range to function properly; internal heating or heat from external sources may affect the temperature inside the scanner. Finally, the laser spot is more easily reflected from surfaces which are diffuse with high reflectivity, resulting in better reflection of the signal back to the scanner (Křemen et al., 2006) Error reduction Remondino and El-Hakim (2006) recommend the integration of independent data from other precise surveying instruments with 3D laser scanner data. The problems of random errors and object occlusion in the laser scan survey can be greatly reduced by integrating other survey data. In addition, the level of detail can be enhanced for smaller features by introducing independent data collection based on digital photo modelling. Ground truth using other precise surveying instruments (e.g. total station) should be established and collected during the survey process to evaluate the accuracy of the laser and image survey data (El-Hakim et al., 2007). 2.4 Processing laser and image survey data Pre-processing of laser survey data The outcome from the laser scan survey described as a point cloud, this represents the x, y, z coordinates of a scanned object, and typically requires cleaning, sorting and combining of different sets of point cloud data before processing takes place. Data cleaning and re-sampling The initial pre-processing stage involves cleaning and removing erroneous data or artefacts such as reflections of the scan through objects. These incorrect points can be eliminated before point clouds are registered. Once identified, reflections from objects in the background and in the space between the scanner and object e.g. trees and other objects in the foreground, moving persons or traffic and atmospheric effects such as dust 24
26 or rain, can be largely removed by the introduction of range limits, or with the aid of graphical tools in a CAD software programme. Inaccurate points originating from multiple reflections can also be largely eliminated with this latter method (Böhler et al., 2002 ). The point density on the object s surface can vary significantly due to the altering range to the object surfaces during acquisition. Re-sampling, by reducing the density of the data for overly dense point clouds, can reduce the amount of unnecessary data and file size. Software platforms, based on the organisation of all available data in an octree structure (which is a data structure useful for visibility of 3D data) enables the sorting of the data into an even point density on the scanned surface of the object (Remondino and El-Hakim, 2006). Signal noise can be eliminated, if the object is known to be smooth, by the application of a low pass or median filter. Filtering of point cloud data should be avoided where an object consists of smooth parts and edges as it will influence all object parts in a similar way (Böhler et al., 2002 ). Point cloud registration Registration is the combination of two or more point clouds taken from different observation points or the referencing of the scanned object in a global or project coordinate system. This is achieved using tie and control points that are either features of the object (e.g. corners) or special targets (spheres, flat targets with high reflectivity), which are identifiable in the point, cloud at the processing stage. Software for registering point clouds usually facilitates registration by special targets or by overlapping point clouds or a combination of both (Mills and Barber, 2004). In the case of large structures where the placing of targets is not always possible, known features on the object are used to fully transform and align the scans (Allen et al., 2003). GPS systems can determine the co-ordinates of the laser scanner position which can then allow for the scans from each position to be brought into a common frame of reference in a global or project co-ordinate system (Cheok et al., 2000). Alternatively registration by cloud matching is carried out by selecting a pair of partially overlapping scans and transforming one scan into alignment with the other using appropriate algorithms (Alba and Scaioni, 2005). 25
27 2.4.2 Data processing The range data in the form of the point cloud from the laser scanner can be considered as a skeletal framework for recording the geometry of the historic structure. This geometric framework is then mapped with the associated image data allowing for more precise identification of the structure s texture and features. Surface meshing Polygonal surface meshing (Figure 4) creates a surface on a point cloud; the created surface is made up of triangles connecting the data points into a consistent polygonal model. A mesh is defined as a collection of triangular (or quadrilateral) contiguous, nonoverlapping faces joined together along their edges which contain vertices, edges and faces forming the representation of the face of an object (Remondino and El-Hakim, 2006). The point cloud, illustrated in detail 1 in Figure 4 is a series of random points, which are then linked by triangular networks using algorithms such as Delaunay triangulation (see detail 2 in Figure 4). The Delaunay triangulation algorithm simultaneously identifies on the point cloud, the vertex of each triangle that lies within the interior of any of the circum-circles of each triangle. The triangles can then be surfaced as shown in detail 3, in Figure 4, defining the scanned object s planes, edges etc (Remondino, 2006). The function of smoothing modifies the surface structure of the point cloud by optimising the point data, filling holes and correcting edges. This is followed by decimation which is a process to optimise the number of polygons and points in the mesh (Böhler et al., 2002 ). 26

28 Figure 4: Triangulation - creates a surface on a point cloud. In the figure above the point cloud is illustrated in detail 1; triangulation is shown in detail 2 and the triangles surfaced shown in detail 3 Texturing the point cloud Following the creation of a triangular mesh the results are then textured from associated image information as detailed in Figure 5 (on the next page), detail 1 illustrates the point cloud and detail 2 illustrates the textured triangulated mesh. In texture mapping, colour images are mapped on to the triangulated mesh; the corresponding image co-ordinates are calculated for each vertex of a triangle on the 3D surface. Following this, colour RGB values are attached within the surface triangle. (Remondino and El-Hakim, 2006). 27

29 Figure 5: Texture from associated image information. In the figure above detail 1; illustrates the point cloud, detail 2, illustrates texture mapping Ortho-image The creation of an ortho-image from point cloud data allows for all of the image and geometric data to be exported for visualisation or further processing in CAD, VRML or other modelling platforms. Ortho-images are photo realistic models containing width, breath and height of an object. The ortho-image represents the data for a particular plane on the x, y, and z-axis; this can therefore represent elevation, plan, or section of an object. The texture for the ortho-image is taken from the associated image data as illustrated in 1 in Figure 6, the 3D geometry is supplied from the meshed point cloud (detail 2 in Figure 6). Both sets of data are for a particular segment and plane within the point cloud. Initially planes are created on the x-y, x-z and y-z axis. The shaded areas detailed in 3 and 4 in Figure 6, illustrate how the plane on the front elevation of the structure is identified. Initially the distance from the front plane is identified as detailed in 3 in Figure 6, followed by segmentation of the area of the point cloud (detail 4 in Figure 6). The associated image data textures the point cloud to create a digital terrain model or ortho- 28

30 image (detail 5 in Figure 6), which then can be exported as 3D data to other software platforms (Gruen et al., 2004 ). Figure 6: Creation of Ortho-image Detail1, image data; detail 2, mesh data; detail 3 and 4 ortho-image generation and detail5, illustrates the ortho-image Accuracy of laser scanning for surveying historic structures Early research concerning accuracy of laser scanning concentrated on smaller cultural objects, which require very high scan resolution. This is best illustrated by Stanford University and the University of Washington (Levoy et al., 2000) in the digitising of the sculpting of the Renaissance artist Michelangelo. The triangulation scanner at a resolution of 1/4 mm captured detail of the geometry of the artist s chisel marks. In the case of larger immovable objects, early and more recent research has concluded that contemporary commercial recording systems (laser scanning and digital photo-modelling) 29
31 meet with accuracy and efficiency requirements for recording and surveying of historic structures and artefacts. This body of research also includes validation and identification of the most efficient and accurate processing pipeline, which is presented in the next section as a recording framework for HBIM. (Beraldin et al., 1997), (Jacobs, 2000), (Bernardini and Rushmeier, 2002), (Barber, 2003), (Bryan et al., 2004), (Mills and Barber, 2004), (Barber et al., 2006). 2.5 Conclusion - a recording framework for HBIM In conclusion a framework is presented for remote data capture using laser scanning in addition to the processing of these data. This framework provides the initial elements for the HBIM process. The procedures in section 2.2 which describes data capture and section 2.4 which describes pre and post processing of laser scan survey data, contribute to designing this framework. The period chosen for analysis and representation of architecture for HBIM is confined to the classical period of the 17th and 18th centuries in Ireland and is described as Georgian. Henrietta Street one of Dublin s earliest Georgian Streets (O Neill, 2003a, O Neill, 2003b) is chosen as the subject and case study for developing and testing HBIM (see Figure 7). The street is also one of the few architecturally intact Georgian streets in the capital (Craig, 1980). For this study the street was surveyed and recorded on four occasions using laser-scanning equipment. Initially a Riegl LMS-Z420i terrestrial laser (see Figure 2) was used for surveying the street to develop a preliminary methodology for data capture and processing. The Trimble GS 200 terrestrial laser scanner (see Figure 8) was then used for a full scan of the façades of Henrietta Street. A summary of key recommendations based on the results of the final laser scanning campaign using the Trimble GS 200 is described in the following section and provides the basis for the HBIM recording framework. 30


32 Figure 7: Location of Henrietta Street 31

33 2.5.1 HBIM recording framework The scanning and recording framework is based on the following stages: Stage 1: Survey data was collected using a Trimble GS 200 terrestrial laser scanner (Figure 8). Figure 8: Trimble GS 200 terrestrial laser Stage 2: Henrietta Street was surveyed on a number of occasions as stated previously with a purpose of developing the most advantageous system for recording Georgian architecture. Positioning of the scanner and the resolution of the scan were the main factors, which were identified from the early scans. The initial laser scan surveys were carried out in 2007 and 2009 and were used to identify a recording framework which was used for planning the final laser scanning campaign which was carried out in September 32

34 2011. In this final laser scanning survey, ten scans were carried out at a 10mm resolution and one scan at a 5mm resolution using a Trimble GS200 terrestrial laser scanner. The optimal scan positions and scan overlaps recommended for the Georgian streetscape are illustrated in Figure 9. Figure 9: Optimal scan positions The street is shown in plan, indicating the scan position 1 to 11,illustrated in the two diagrams on the right, the table on the left shows the percentage overlapping used for each scan position. 33
35 Stage 3: The point cloud is pre-processed to register the separate data sets. Registration is the combination of several point clouds taken from different observation points. For registration two different methods were used, a cloud based registration and also registration using common points as detailed in Table 1. Common target were surveyed at a higher resolution (2mm) in common areas between scans for registration of scans. Five to eight common targets were surveyed to ensure accurate registration results during processing. All processing of scan data was carried out using Trimble Realworks software. The process of registration of the three scans in the software is shown in Figure 10. Table 1: Registration results Scan n Resolutio Registration Method Registration Accuracy Buildings Scanned 1 10mm & mm Cloud Matching 7.69mm 4, 5, 6 & mm Cloud Matching 8.94mm 6, 7, 8 & mm Common Points 4.97mm 9, 10 & Gate at end of street 5 10mm Common Points 5.50mm Gate at end of street & Law Building 6 10mm Common Points 4.69mm Law Building, 11 & mm Common Points 7.78mm 12, 13 & mm Common Points 2.14mm 14 & 15 (including Gable) 9 10mm Cloud Matching 12.98mm Gaps in 15 & Road 10 10mm Common Points 12.72mm Gable of Number mm Cloud Matching 2.53mm Door case of No. 3 As stated previously in addition to the ten scans detailed in Figure 9, the door case of number 3 Henrietta Street was scanned at a resolution of 5mm as a 10mm resolution was not sufficient to capture the architectural detail of the object. It is therefore recommended to use a 5mm scan resolution for detailed objects and a 10mm scan for facades. 34

; (b) Structured mesh as 3D data in CAD file formats (DXF, DWG) representing whole or parts of building elements (Figure 12); (c)")
36 Figure 10: Point cloud registration and targets Stage 4: It is recommended that the pre-processing stage should also involve the cleaning and removing erroneous data or artefacts. This is followed by if necessary the resampling and reducing of the density of data for overly dense point clouds. Stage 5: The outputs required for the next stage of the HBIM process are: (a) The segmented point cloud as 3D data in CAD file formats (DXF, DWG) representing orthographic planes in the surveyed structures (Figure 11); (b) Structured mesh as 3D data in CAD file formats (DXF, DWG) representing whole or parts of building elements (Figure 12); (c) Orthographic image data (Figure 13). Figure 11: Segmented point cloud 35


37 Figure 12: Mesh as 3D data Figure 13: Orthographic Image Framework summary - data capture and processing Subsequent to data capture the laser scan model evolves through a series of preprocessing stages of cleaning, sorting and combining of different sets of point cloud data, 36

38 followed by post-processing of surfacing and texturing of the point cloud data. Polygonal surface meshing creates a surface on a point cloud; the created surface is made up of triangles connecting the data points into a consistent polygonal model. Following the creation of a triangular mesh the results are then textured from associated image information creating textured and surfaced 3D model of the scanned object. Finally, ortho-images and segmented point clouds and mesh models are created to provide a basis for the next stage of the HBIM process. Figure 14: Views of Henrietta Street from laser scan survey 37
39 3 Chapter 3 Parametric Modelling
40 3.1 Overview The incorporation of parametric modelling and laser scan survey data for recording of historic structures is examined in this chapter. Initially, the problems associated with mapping vectors onto laser scan survey data to create engineering drawings are detailed. This is followed by an analysis of parametric modelling; whereby architectural rules are employed to assist the mapping of 3D objects onto laser scan surveys to create full virtual models of historic structures. In addition, the area of procedural modelling is briefly outlined which also employs architectural rules but is an automatic modelling system. The existing systems of parametric and procedural modelling create detailed visualisation models but do not automate the production of engineering drawings and conservation documentation. Finally, in this chapter a new system of Historic Building Information Modelling (HBIM) is proposed as an advancement in 3D modelling for historic structures combining laser scanning and Building Information Modelling (BIM). Historic Building Information Modelling (HBIM) is proposed as a novel system for automatically producing both visualisation models and the required conservation documentation for the recording of historic structures and their environments. 3.2 Creating engineering drawings from point cloud data Plotting onto laser scan surveys A full record of a historic structure (usually in the form of engineering survey drawings) is required where conservation or alterations are planned for the structure. The production of engineering drawings from laser and image survey data can be described as a reverse engineering process whereby an object s physical dimensions, geometry, and material properties are captured to produce orthographic plans, elevations, sections and 3D models. The objects in this case are historic structures brought through the design process in the opposite direction, revealing information about the original design and construction (Cheng and Jin, 2006). The majority of current software platforms for creating engineering drawings from laser scan surveys function by mapping vectors on to the point cloud or textured point cloud (AutoCAD, 2012, Pointools, 2012). This is a complex process as the data size of 39

41 the point cloud is large and mapping in 3D space onto a point cloud is difficult because of point and edge detection and location. Segmentation of the point cloud is necessary in order to identify the correct surfaces for plotting of vectors. Vectors can then be plotted onto both the point cloud and the ortho-image. While this process is largely manual, additions have been made to the software platforms to partly automate the mapping process, which include extruding, profiling and the creation of paths onto point cloud. Amato et al. 2003, created a CAD model of the leaning tower of Pisa, which was created from the 3D point-cloud; the project team described this as an involved and timeconsuming process. The vector diagram provided a map of the tower s eccentricity, which could not be observed in the same precise manner from the point cloud alone. This is due to lack of edge definition in the point cloud, thus proving the relevance of the production of engineering drawings (Amato et al., 2003). The laser scan survey of the Cathedral of Saint Pierre de Beauvais carried out by the University of Columbia Robotics Lab (Allen et al., 2003) is an example of an accurate 3D record of a historic structure. Some of the scan results showing elevation, plan and section that are based on the point cloud colour intensity are detailed in Figure 15. If the scan results are proposed for use in representing conservation or re-construction detail, there is then one significant limitation with this data. Upon close inspection of the point cloud, the edges and planes, which define the construction elements that make up the structure, these edges and planes are not accurately identified as they consist of a series of points. Figure 15: Cathedral of Saint Pierre de Beauvais (CyArc, 2007) 40

42 3.2.2 Manual mapping of vectors onto the point cloud Mapping vectors on to the point cloud or textured point cloud can create conventional orthographic or 3D survey engineering drawings. This is a complex process, as the data size of the point cloud is usually very large and mapping in 3D space onto a point cloud is difficult because of point and edge detection and location. This process is partially illustrated in Figure 16 the point cloud shown in plan in detail 1 is exported into a CAD software platform but then requires a series of adjustments. The point cloud plan is translated onto the orthographic planes on the x, y and x, z-axis as illustrated in detail 2 in Figure 16. The Segmented point cloud as shown in detail 3 of Figure 16 is used to identify the correct surfaces for plotting of vectors. The vectors can then be plotted (detail 5) onto both the point cloud and the ortho-image (detail 4), this process is largely manual. Figure 16: Vector mapping onto a point cloud surface 41
43 3.3 Parametric modelling based on architectural rules Parametric modelling Mapping parametric objects, as opposed to vectors, on to the point cloud can overcome the slow task of plotting and locating every vector onto the cloud surface. The use of parametric objects can also introduce the opportunity to develop detail behind the object s surface concerning its methods of construction and material make-up. The process of mapping parametric objects onto a 3D point cloud can be achieved by placing 2D or 3D shapes onto the point cloud by locating/defining shapes on the point cloud as primitives. For example a primitive shape of a cylinder can be mapped onto the point cloud to represent a column, which is then textured from the associated image data (Abmayr et al., 2005) Architectural rule based modelling An improvement in mapping can be achieved by recognising that buildings are a set of elements, organized by spatial relationships determined by an architectural style or language. The architectural elements can be represented in libraries as parametric objects and mapped onto point cloud or image-based surveys (Dekeyser et al., 2003). In similar work (Deveau et al., 2005), primitive objects are mapped onto the scan and image data; these are detected through semi-automatic extraction of the objects where the object localisation is initialised by user interaction. This is then followed by fully automatic segmentation of both the image and 3D data where each object needs to be reconstructed from planar surfaces, general geometric primitives and generalised cylinders. When these models do not fit with the surface, triangulation is performed similar to point cloud editing software (Deveau et al., 2005). For example a classical column is made up of a cylindrical shaft to one third of its height and a tapering shaft for the remainder of the shaft; this subtlety may not usually be detected by automatic or semi-automatic recognition of primitives. Parametric libraries of architectural elements or objects can be built with precision for mapping onto different survey data sets if they are based on architectural language and vocabularies. In their work (Chevrier et al., 2009), state, only simple geometrical shapes are automatically adjusted to cloud points and only visible 42
44 parts of the objects can be modelled and rebuilt. Hidden parts are often predictable and can be created as parametric objects based on historic architectural data. In more recent work (Chevrier et al., 2010), develop parametric components for 3D modelling of architectural elements, in a Maya Environment (3D modeling software used for commercial animation) combined with a Graphical User Interface (GUI). They automatically construct 3D models of the objects based on point cloud and image survey data. In this study they concentrate on window openings, which they generate as parametric models of walls and their openings, further parameters are then added based on historic and other survey data sources. Historic architectural and geometrical knowledge is essential in order to create architectural parametric objects or elements. A new system for modeling, and representing architectural heritage through a software platform called NUBES, proposes a methodology for the semantic description of architectural elements based on historic architectural knowledge (De Luca et al., 2006, Dekeyser et al., 2003, De Luca et al., 2007, De Luca et al., 2011). This methodology is used to construct a shape library and is organized spatially as completed structures within the NUBES framework. They establish their analysis of the classical language of architecture on historic architectural manuscripts. De Luca et al. (2006, 2007, 2011) identify a number of concepts for analysing the geometrical character and make-up of classical buildings and for the reinstatement of the buildings shape within a virtual environment. As a first step in their modelling pipeline they identify the dominant surface as the internal and external fabric or envelope of a structure, which is separated in the modelling pipeline from other parts of the artifact or structure. Architectural mouldings are described as the key building atoms of classical architecture, which make up and add complexity to the geometry of larger elements such as walls, columns and beams, windows doors etc. Their library of shapes is based on sets of geometric primitives, which form the architectural mouldings, and which are described as basic elements in historic architectural manuscripts. The fact that objects in classical architecture can be linked by intermediate shapes, which allow for transition between the basic elements is essential in describing the behavior of architectural elements within their spatial framework. In addition they identify the use of repetition of architectural elements (colonnades, façade symmetry and proportion) to assist in generating the model. They 43
45 state that orthographic plans, elevations and surveys can also inform the creation of objects (De Luca, 2012), and compliment the knowledge taken from architectural manuscripts. In their most recent publications they outline a WEB based system for describing, analysing, documenting and sharing digital representations of heritage buildings using their improved methodologies (De Luca et al., 2011). While the NUBES system of parametric modelling creates detailed visualisation models it does not automate the production of engineering drawings and conservation documentation. In the NUBES system reference is made to Renaissance manuscripts but they are not placed in specific timeframes in relation to the modeling of historic structures. As classical architecture spans over a long period from the Renaissance to the 20 th century, more time-specific architectural sources must be identified and linked to geographic locations Procedural modelling - shape grammars In documenting the classical orders, Renaissance architects formulated a language whereby the rules, which govern the distribution and combination of parts, are described in a grammar of ornament and composition. The elements (mouldings, profiles, symbols etc.) become the architectural vocabulary; the whole composition relates to a linguistic structure, this linguistic analogy presents a basis for analysis and understanding to architecture (Clarke and Crossley, 2000). More recently, linguistics is used for representation and semantics in the field of computing for procedural modelling of buildings and virtual environments. Shape grammars (Stiny and Gips, 1972), were introduced in the 1970s and used for conceptualising and analysing architectural design. Buildings are based on different architectural styles and can be divided and represented by sets of basic shapes, these shapes are governed by replacement rules whereby a shape can be changed or replaced by transformations generating additional and new shapes. Shape grammar, therefore, can be attributed to architectural styles and urban planning configurations developing a process to automatically reconstruct and generate building and urban styles and configurations in a virtual environment. In the case of the generation of 3D city models, maps and land-water boundaries, in addition to laser scan and image survey data, are used to virtually generate roadways and streets and the geometry of 44
46 buildings and their position (Parish and Muller, 2011). New shape grammars, which represent architectural rules, can improve the automation of the virtual models, for example split rules, divide up architectural structures and elements into components. Using split rules facades can be divided vertically into floors and horizontally into windows and their accompanying panels (Wonka et al., 2003), (Muller et al., 2006), (Aliaga et al., 2007). In the case of architectural heritage and archaeology the Plastico di Roma Antica, a large plaster-of-paris model of imperial Rome (16x17 metres) created in the last century was scanned and modelled as a mesh model. The model was then incorporated with other historic and specialist information and, with rule-based generation the reconstruction of ancient Rome was modeled, entitled Rome Reborn 1.0 (Guidi et al., 2007, Guidi et al., 2008). This was extended to the whole city in the following project Rome Reborn 2.0 (Frischer et al., 2008). Shape grammar-based procedural modelling contrasts with parametric modelling, both are based on architectural rules but procedural modelling is automatic and parametric modelling depends on human interaction combined with automation. Again, in the case of procedural modelling visualisation models are created automatically, but orthographic drawings and conservation documentation are not automated within the process. Detail of the many and varied non-geometric shapes found in ornament to classical buildings may be not replicated accurately within procedural modelling. In procedural modelling, reference to specific historic literature sources related to the timeframes and geographic locations of the historic models, is not apparent within the research literature. 45
47 3.4 Evolution of Building Information Modelling (BIM) Evolutionary stages Parametric CAD differs from generic 3D CAD, as parameters are assigned to an object prior to its use. For example, standard 3D CAD is usually an object-oriented programme, the objects that are used to create the lines, arcs, and dimensions that in turn create architectural elements are not parametric. These objects exist as graphic entities but they do not have intelligence (Ibrahim et al., 2003, Ibrahim and Krawczyk, 2004). Parametric modelling introduces the concept of variables for the representation of geometry, shape, surface texture or feature which improve the object s real world depiction (Shah and Mäntylä, 1995). Architectural elements are represented as real world entities by capturing their characteristics, function and performance under different conditions. Parametric objects can be adaptive to wider architectural scenarios reducing their level of detail or alternatively capturing specific knowledge reducing their wider use (Garba and Hassanain, 2004). Other strategic evolutionary stages of parametric CAD are Boundary Representation (B-rep) and Constructive Solid Geometry (CSG). These were developed in the 1970s and 1980s. Boundary Representation (B-rep) provides details of an object s shape by describing the object s faces, edges and vertices and their relationships. Constructive Solid Geometry (CSG) represents objects using primitive shapes and subsequently combines these in 3D spaces using Boolean operations to create additional objects. The next evolutionary stage in the development of parametric CAD, introduced the concept of describing the features and characteristics of an object. Feature based CAD can refer to geometry, specification of materials etc., in addition to function which describes the objects role (e.g. wall, door, window etc.) and performance, which indicates how elements relate to each other; e.g. the window can cut an opening in a wall (Van Leeuwen, 1999, Gross, 2001). Feature-based CAD enables the modification and variation of parameters by the user, the incorporation of object features (such as openings in elements) and interactions between elements within a spatial environment (Van Leeuwen, 1999, Van Leeuwen et al., 1996). The evolutionary stages of CAD have moved from 2D graphic computer representation to parametric modelling to nd modelling (Tse et al., 2005 ) and on to feature extraction 46
48 and finally, more recently, to Building Information Modelling (BIM). BIM differentiates itself as an object intelligent architectural CAD tool rather than a drafting tool and represents building elements and components as information rich parametric objects to create or to form an entire building. BIM uses building semantics to include physical elements such as walls and floors, and conceptual elements, such as spaces and openings (Boeykens et al., 2008). In addition to 3D visualisation, BIM can automate the production of digital documentation (3D, orthographic projections cut sections, details and schedules) Building Information Modelling (BIM) BIM is defined as the assembling of parametric objects which represent building components within a virtual environment and which are used to create or represent an entire building. Objects are described according to parameters some of which are userdefined and others, which relate to position in a 3D environment relative to other shape objects. The parametric building objects are not defined singularly but as systems using interaction with other objects and their own values (shape, texture etc) within a BIM. Computer generated parametric objects (such as windows, doors, walls, roofs etc) store data relating to the object and its relationship to the whole building. If changes are made to an object, the updated object will make appropriate changes to other objectives and can be observed in real time by all project participants. Within BIM, building elements can contain information such as geometry, geographical or positioning co-ordinates associated with a project, quantities, cost estimates, details of materials, project schedules, energy and structural. Information can be readily extracted. Interrelation between construction documents, resources and specifications of various items, performance of a building can be observed before it is built. (Aouad and Lee, 2007, Eastman, 2006, Staub-French and Khanzode, 2007, Smith and Tardif, 2009). The leading BIM software platforms are Autodesk Revitt (Autodesk, 2011), GraphiSoft ArchiCAD (Graphisoft, 2011) and Bentley Architecture (Bentley, 2011). ArchiCAD is an architectural design application, built around the BIM concept as a standalone application. In ArchiCAD the modelling of objects can be achieved through using standard parametric construction elements. These elements are embedded in the software 47
49 (such as walls, columns, beams, slabs, roofs etc.) or created as new objects using the embedded scripting language Geometric Descriptive Language (GDL). The use of GDL allows for the creation of any number of rich parametric BIM objects and for their storage in internal libraries or data bases for further reuse or modification (Tse et al., 2005 ). Revit is also a BIM modelling platform, where the user constructs a mass model with a combination of solid forms and void forms. The faces of the mass volume can be turned into building elements and floors and other architectural elements can be generated inside the mass model (Boeykens et al., 2008). Bentley differs from Archi-CAD and Revit in that it exists as a plug-in for other Bentley platforms. 3.5 A new concept - Historic Building Information Modelling (HBIM) Using architectural rules to develop 3D models The research areas of procedural and parametric modelling have employed architectural knowledge to inform the creation of virtual models. Using historic data to re-create the past, or to restore or conserve historic artefacts and buildings is common in the wider area of conservation, (ICOMOS, 1964a) and is also an extensive area of research. A new direction has been initiated by examining how architectural historic rules can be exploited to build computer models of historic structures (De Luca et al., 2011, Chevrier et al., 2010, Guidi et al., 2008). While these works can inform a new modelling approach, significant problems remain, these are as follows: 1. Neither procedural nor parametric modelling offer a specific timeframe or model for describing their sources of historic data that inform architectural rules. 2. The aim of producing conservation documentation and engineering drawings as opposed to sophisticated visualisation models, requires different levels of accuracy especially in the speculation of data behind the scan surface. Both procedural and parametric modelling techniques concentrate on producing visualisation models. 3. In the case of procedural modelling accuracy in the representation of finer detail suffers greatly in order to facilitate extrusions of 3D models from building 48
50 footprints or full architectural panels introduced to automate the modelling of large sections of historic structures Combining laser scanning and BIM based on architectural rules Most applications of Building Information Modelling are applied to designing new buildings and new innovations that are concentrated around plug-ins for energy, structural and economic analysis, and scheduling of components as an addition to new architectural design (Eastman, 2007). With the exception of Fai, (2011), very little work has been done in relation to modelling historic buildings and also generating BIM models from laser scan survey data. Their work concentrated on the problems associated with combining laser scanning and BIM through plotting generic library objects onto the scan in a BIM environment, their work did not approach the creation of parametric libraries based on architectural rules or improved automation of objects onto the scan surveys Historic Building Information Modelling (HBIM) - a new concept By combining laser scanning with Building Information Modelling created from libraries of parametric objects based on historic architectural rules a new concept is proposed for the modelling of historic structures. This is expressed as Historic Building Information Modelling (HBIM) and differs from other approaches, as the product is the creation of full 3D models including detail behind the object s surface concerning its methods of construction and material makeup. The advantage of HBIM over other modelling approaches is that the end result generates automated conservation documentation. This is in contrast to highly sophisticated visualisation products developed from procedural and other parametric modelling approaches whereby the main product is a visualisation tool. 49
51 4 Chapter 4 - Building a Library of Parametric Objects 50
52 4.1 Overview A new system for building a library of parametric architectural elements is proposed in this chapter as the next stage in the Historic Building Information Modelling (HBIM) process. An outline of the evolution of classical architectural rules is presented in section 4.2 of this chapter in the form of a narrative structure, which establishes a time-frame to identify precise architectural historic sources (see Figure 17). The interpretation and understanding of architectural rules is outlined in section 4.3, based on the analysis of architectural pattern books. The architectural pattern books of the 18 th and 19 th centuries contain precise detail concerning classical architecture and rules. Section 4.4 presents the development of new shape rules and parametric design for HBIM. The new shape rules and parametric design are applied to reproduce classical elements as 3D computer models, which are coded using a Geometric Descriptive Language (GDL). The analysis for modelling of architecture is confined to the classical period in the 17th and early 18th centuries in Ireland, which is described as the Georgian period (Craig, 1980). The classical architecture of this period is based on ordered components, geometric proportion and a limited range of material and texture and is an ideal subject for the building of parametric components for virtual models. 4.2 A framework for assessing architectural rules An evolutionary time-frame for classical architecture Information concerning historic construction techniques and architectural details can be found in architectural manuscripts, which have evolved from Vitruvius (70 35 BC) to the 17th and 18th century architectural pattern books. The evolution of these manuscripts is summarised chronologically in Figure 17. An understanding of classical architecture within its correct time-frame is essential in order to map and identify significant rules, which can be applied to computer modelling. The interpretation and understanding of these rules can be more easily adapted from architectural pattern books, which emerged in the 17th and 18th centuries. 51
 The evolution of architectural manuscripts, which documented the classical architecture of Greece and Rome and in turn developed the rules of")
53 Figure 17: Evolution Of Architectural Rules, (Vignola, 1596, Piazza and Riggio, 2007, Pollio and Morgan, 1960, Alberti et al., 1991, Palladio, 200 reprint, Gibbs, 1925, Serlio, 1982) The evolution of architectural manuscripts, which documented the classical architecture of Greece and Rome and in turn developed the rules of classical architecture, is illustrated in Figure 17 above. The first recorded is the treatise De Architectura by Vitruvius. Later during the classical revival of the Renaissance, Alberti published De re Aedificatoria. Sebastiano Serlio published Regole Generali D'architettura and Vignola published his Regola Delli Cinque Ordini D architettura. Andrea Palladio s work Quattro Libri dell'architettura influenced the architectural treatise produced in Britain by James Gibbs which may be regarded as the precursors to the 18 th century architectural pattern books. 52
54 4.2.2 Evolution of architectural manuscripts The most important classical source for architecture is the treatise De Architectura by Vitruvius; which was possibly written before 27 BC, and during the first century AD. The text survived in various manuscripts during the middle ages. Marcus Vitruvius Pollio was a Roman architect working in the reign of the Emperor Augustus; Vitruvius observed design and geometry in ancient architecture of Rome and Greece and documented the classical orders, proportions, methods of construction and materials (Evers B. and Thoenes C., 2003, Jokilehto, 1986, Pollio and Morgan, 1960, Evers and Thoenes, 2003 ). Classical architecture was revived during the renaissance, introducing new and more scientific rules for the interpretation of Roman and Greek buildings and also for the production of drawings and surveys. Alberti, published De re Aedificatoria (On the Art of Building) in 1452, in this work he attempted to interpret the work of Vitruvius and improve its philosophical and intellectual content. There were no illustrations included in the original and it was written in Latin. At the same time, Marini published his interpretations of Vitruvius but unlike Alberti it contained illustrations, presenting the laws of classical proportion (Evers B. and Thoenes C., 2003, Jokilehto, 1986, Pollio and Morgan, 1960, Alberti et al., 1991, Evers and Thoenes, 2003 ). In 1537, Sebastiano Serlio published Regole Generali D'architettura (General Rules of Architecture) (Serlio, 1982). In 1562 Vignola published his Regola Delli Cinque Ordini D architettura (The Five Orders of Architecture) which was mainly illustration and lacked text, resulting in a more practical aid for building (Evers B. and Thoenes C., 2003, Jokilehto, 1986, Pollio and Morgan, 1960, Vignola, 1596, Ware, 1903, Ware, 1905). While Andrea Palladio's 1570 work Quattro Libri dell'architettura (The Four Books of Architecture) also documented a succinct account of the rules of classical architecture, his treatise set out full design for buildings (in plan, elevation and section), and greatly influenced architecture in Europe and, later, its colonies (Palladio, 2000) 53
55 4.2.3 Architectural pattern books Palladio's books on architecture were translated into many languages and influenced architecture in Europe and later its colonies. These subsequently have greatly influenced the architectural designs of the late 1600s and 1700s in Ireland and Great Britain. In Britain, Henry Wotton published the Elements of Architecture in 1624 as an investigation of Vitruvius s work (Wotton, 1970). Wotton s work is important because it introduced an architectural dialogue amongst non-architects (intellectuals, patrons and builders). In France, Perault ( ) proposed in a Treatise Of The 5 Orders Of Columns In Architecture (1683) a more precise documentation of the classical orders (Evers B. and Thoenes C., 2003, Jokilehto, 1986, Pollio and Morgan, 1960, Alberti et al., 1991, Wotton, 1970, Evers and Thoenes, 2003 ). The stage was set for the interpretation of classical architecture by a wider group of architects, intellectual owners, master builders and craftsmen, in Britain and its colonies. The early architectural manuscripts were based on Palladio s principles and documentation of classical architecture and developed by 18th century British architects. The following manuscripts Vitruvius Britannicus by Colen Campbell (1715) and A Book of Architecture by James Gibbs (1728) can be regarded as the precursors to the pattern books (Campbell, 2006, Gibbs, 2008). Isaac Ware (1756) produced an encyclopaedia of architecture and proportioning which was aimed at both property owners and architects (Ware, 1756). William Chambers when he worked in Ireland designed the Casino in Marino, which represents a miniature of the classical rules (see Figure 18). This building was illustrated in his Treatise On Civil Architecture (1759); his analysis greatly influenced the designs that appeared in the pattern books introducing a more precise analysis of Greek and Roman architecture (Chambers et al., 1825). 54
.")
56 Figure 18: William Chambers: The Casino in Marino Architectural pattern books are a record of local design in Ireland and Britain, these books were based on the publications of the British architects, Campbell, Gibbs and Ware rather than directly based on Palladio s work, creating a British and colonial Palladian style referred to as Georgian (Colvin, 2008). Rules for drawing the several parts of Architecture by Gibbs may be considered as architectural pattern books. In this publication Gibbs concentrates on column proportioning, where he developed a simplified system of calculation (Gibbs, 1925). In addition to the rules for setting up the classical orders, pattern books contain the historic construction techniques used in the 18th century. The pattern books also included the geometry and principles of the external and internal structure and fabric construction e.g. the positioning of openings and the proportional relationship of the building's elements. The sets of pattern books, which were published by the following authors: Batty Lanley, ( ), William Halpenny ( ) and William Paine (1730 to c1790) are considered to be the most commonly used within the British colonies. Batty 55
57 Lanley started his design practice as a landscape gardener, he later moved to London and established a school offering lessons in architecture and drawing. He also published a large number of pattern books with his brother, Thomas who was an engraver. He did not enjoy any established success as a practising architect. Most of his pattern books were aimed at artisans and builders, his 494 plates on ancient masonry are considered as an important treatise on British architecture. Langley s work in Gothic Architecture preceded the 19th century revivalists and introduced an alternative to the classicism and Palladian style that existed in the 18th century (Langley, 1750a, Langley, 1756c, Langley, 1750b, Langley, 1729, Langley, 1735, Langley and Langley, 1763, Langley, 1736, Langley, 1805, Colvin, 2008). William Halfpenny, , published a number of pattern books which provided building details on how to construct the classical orders. He also published designs for farmhouses and detail on ornament including Gothic and Chinese. He disseminated a Palladian style but also included Gothic and Baroque styles in his designs and publications. He worked in Ireland where his work can be found in Cork, Belfast and Carlow (Colvin, 2008, Halfpenny, 1760, Halfpenny, 1774, Halfpenny, 1749, Halfpenny, 1725, Halfpenny and Jones, 1736, Halfpenny and Halfpenny, 1756). William Paine (1730 to c1790) was the author of numerous pattern books in the 18th century; his publications disseminated classical styles only. In his most prominent publication, the British Paladio he was assisted by his son John who had extensive architectural practices in Ireland (Pain, 1792, Pain, 1788, Pain, 1793, Pain and Brooks, Pain, 1765, Colvin, 2008). In the following figures, illustrations from Batty Langley s pattern book detail the five orders. In Figure 19, from left to right are the Tuscan and Doric orders and in Figure 20 are from left to right the Ionic, Corinthian and composite orders (Langley, 1756b, Langley and L, 1750). 56
.")

58 Figure 19: Tuscan and Doric orders (Langley and L, 1750). Figure 20: Ionic, Corinthian and composite orders (Langley and L, 1750). 57
59 4.2.4 Interpreting the classical orders Classical proportioning consists of a series of modular relationships, which are based on the diameter of the base of the column. The base of the column represents a single module. Vignola s manuscripts are the least complicated of the renaissance cannons to interpret, his illustrations introduced additional and more precise methods for setting up classical proportions. He did this by dividing the order into a ratio of the pedestal, column and entablature, see column one in Table 2. In Table 2, the measurements and rules for laying out the five orders are compiled from a more recent manuscript (Ware, 1905). Table 2: Elements According To Vignola (Ware, 1903) Type of Order Tuscan Doric Ionic Corinthian Composite Height of Cornice 3/4D 3/4D 7/8D 3/4D 3/4D Entablat Height of Frieze. 1/2D 3/4D 6/8D 1/2D 1/2D ure Height of Architrave. 1/2D 1/2D 5/8D 1/2D 1/2D Capital Height of Abacus 1/6D 1/6D Height of Echinus, 1/6D 1/6D Height of Necking. 1/6D 1/6D 1/3D 7/6D 7/6D Shaft Astragal Height of Shaft 6D 7D 8D 8 1/3 8 1/3 Upper Diameter of Shaft. 5/6D 5/6D 5/6D 5/6D 5/6D Lower Diameter of Shaft. 5/6D 5/6D 5/6D 5/6D 5/6D Base Height of Torrus Height of Plinth. 1/2D 1/2D 1/2D 1/2D 1/2D The proportions for the component parts are expressed as fractions of the diameter of the base of the column (as opposed to minutes) (Evers B. and Thoenes C., 2003, Ware, 1905, Chitham, 2005, Vignola, 1596). Using these ratios for the larger elements reduced the complexity of calculations that arose if the whole building was related to the diameter of the base of a column. The sub-relationships between the column and details such as 58
60 mouldings were usually devised using 60 divisions of minutes, which represented the diameter of the base of the column as a single module. In, Figure 21, detail 1, (on the following page), an illustration from Pain s 18th century pattern book gives a description of the geometry of the Doric column capitol and the modular arrangement of the base of the column. The base of the column is divided it into 60 units (Pain, 1788). In detail 2, fractions are introduced as opposed to minutes (60 divisions); this approach is much simpler for calculations (Ware, 1905). In the 21st century publication, (Chitham, 2005) introduced metric divisions for the main elements, using four scales A, B, C. In Figure 21, scale A on the outside left on detail 3 which represents the main elements (pedestal, column and entablature etc.) ascending and descending from the underside of the column plinth, but further subdivided into tenths of the column diameter. In the same figure scale B, on the second left, shows the proportions of the principal divisions and subdivisions of the order. Scale C on the third left, shows the proportions of the minor subdivisions, and fourth left, scale D repeats these in running or cumulative figures. 4.3 Geometric Descriptive Language (GDL) Description of GDL GDL is an open script embedded in Graphisoft ArchiCAD, and was chosen as the language to build architectural elements using pattern book designs. ArchiCAD software divides parametric objects into built construction elements (walls, columns, beams etc) and GDL objects. GDL provides access to modelling of objects, which are specifically constructed for one or many uses and carry the required parametric information for the object s function. All GDL objects are created within a three dimensional space, this space is measured by the x, y, and z-axes, the origin of which is called the global origin (0, 0, 0). The global origin and local coordinate system defines the position, orientation and scale of objects, marking positions of objects or shapes, which can be moved on the x, y, and z-axis. The local coordinate system can be moved and provides a reference to the current point of an object with reference to the global origin. Shapes are scripted, based on primitives that represent the simplest solid objects; these are the building blocks 59

61 of GDL and culminate to create the more complex parts, which are stored in libraries. The primitives are stored in the computer memory, and the 3D engine generates them within 3D space. The primitives are made up of all the vertices of the object s components, all the edges linking the vertices and all the surface polygons within the edges. The primitives are formed together in groups known as bodies; these bodies make up the 3D model. More complicated shapes and transformations require additional values for their definition and are defined by commands related to profiling and lathing of objects. GDL also includes Boolean operations, Meshing, Non Uniform Rational B Splines (NURBS) and shape commands for creating organic and non-uniform 3D shapes (Watson, 2009). A B C D Figure 21: Pattern Book Details (Pain, 1788, Ware, 1905, Chitham, 2005) 60

 mouldings are represented through the combination of")
62 4.3.2 Modelling a Doric column using a GDL script A Doric column is represented in Figure 22, using simple primitives, which are described by their geometric shape and accompanied by a value representing the objects dimensions. In Figure 22, the column is made up of simple primitives; Block, Ellipse, Sphere, Cylinder and Cone followed by a parametric value that dictates their dimensions. Using coordinate transformations, the primitives are stacked on the Z-axis or alternatively moved on the x and y-axis. The block represents the base of the column. A cylinder and cone are added on the z-axis to represent the column shaft (the cone represents the tapering of the column one third up the shaft) mouldings are represented through the combination of cylinders and ellipses. The height and width of each element is represented by a variable expressed in terms of the objects height, width or diameter. For example in Figure 22 cone_ht = the height of the cone and cone_rad = the radius of the cone, which represents the upper shaft of the column. When the object is placed, the variables that are its geometric parameters can be changed to match the object it represents in real world terms. Figure 22: Simple Doric Column 61
63 4.4 Shape rules and parametric design In parametric modelling, architectural elements can be represented by shape alongside other constraints such as texture. A new set of shape rules is proposed in this section to correspond to classical architectural elements. To accompany the new shape rules, a new parametric design for classical architecture is also presented. The parametric design includes GDL codes for original and efficient GDL codes, which develop 3D models based on the shape rules for elements of classical architecture. The parameters allow for representation of volume and angular orientation within a 3D space in addition to the specification for materials and texture Shape Rules The classical orders according to the Renaissance architects, and the architectural pattern books, formulated the rules which govern the distribution and combination of parts and as stated previously resulted in what is described as a grammar of ornament and composition (Clarke and Crossley, 2000). The elements (mouldings, profiles, symbols etc.) become the architectural vocabulary. The rules of classical architecture can be described as a grammar. Shape grammars (Stiny and Gips, 1972), introduced the concept that buildings are based on different architectural styles and can be divided and represented by sets of basic shapes which are a limited arrangement of straight lines in three-dimensional Euclidian space. These shapes are governed by replacement rules whereby a shape can be changed or replaced by transformations and deformations. The shape commands combined with a new library of primitives, allow for all configurations of the classical orders in relation to uniform geometry. Non-uniform and organic shapes are developed in GDL through a series of procedures attempting to maximise parametric content of the objects. These shapes are stored as individual parametric objects or combined to make larger objects in a library. When the parametric objects are used in the HBIM platform they can be transformed and deformed to match real-world requirements. In Figure 23, the additions and transformations of rectangular shapes in two dimensions illustrate the construction elements of the Doric column. On the left hand side of the figure the rectangular elements start with column and base and increase to include pediment etc. The right hand side of the figure illustrates the shapes in 3D as a Doric column and 62

64 entablature. The joining elements are the small rectangles which represent the mouldings described as the atoms of the structure (De Luca, 2012). Figure 23: Shape change (Capo, 2006) Establishing new shape rules Classical architectural buildings are made up of decoration, in the form of mouldings, which is combined with cylindrical and planer objects and these are brought together, based on a series of rules in relation to space, geometry and aesthetics to create a whole structure. By starting with the design of parametric mouldings as the smallest building block, followed by the parametric design of elements such as columns, pediments, walls, windows and roofs new parametric design and shape rules are presented. The shape and parametric design rules are the foundation in the creation of a library of elements for modelling of classical architecture. In Figure 24, a new set of shape rules is presented as a first stage in the parametric design for modelling elements from the architectural pattern 63
65 books. The shape rules commence with simple rectangular and circular shapes, which evolve as a result of replacement rules whereby a shape can be changed or replaced by transformations and deformations. These new shape rules are illustrated on the left hand side of Figure 24 and represented by an array of shapes (a) to (w). On the right hand side of the figure a profile of an Ionic entablature (Chitham, 2005) is illustrated whereby the mouldings are associated with the shape rules on the left side of the figure. Figure 24: Shape grammar - architectural mouldings Drawing of profile of Ionic entablature on right of figure (Chitham, 2005) Shape rules for mouldings Mouldings are decorative details, which are used for decoration within classical styles of architecture and are composed of basic plane or cylindrical surfaces, which can be convex, concave, or of double curvature. The cross-section of a moulding is represented in two dimensions by its profile. Mouldings alongside carvings and sculpting are used as additions to walls, openings, columns and beams and conform to the classical architectural rules. In the case of this study, the moulding details are abstracted from a 64
66 series of architectural pattern books (Langley, 1756a, Langley, 1730, Halfpenny et al., 1757, Pain, 1788, Chitham, 2005, Ware, 1905). These classical descriptions and geometries for mouldings can be represented by the shape rules, which are detailed in Figure 24, to facilitate their modelling within a virtual environment. In Figure 25 and Figure 26 these new shape rules, and their evolution are applied to classical mouldings. The simplest moulding is called a band or fascia (see in Figure 25a), which is a plane-projecting surface and if it is small in cross section it is described as a fillet, which can be raised or sunk, horizontal, vertical, or inclined. A convex moulding is called an ovolo, or a torus, which is illustrated in Figure 25b. If it is a small torus is called a bead, astragal, or reed. Concave mouldings are referred to as cavetto and are illustrated in Figure 25c. A moulding with double curvature is called a cyma; a cyma recta is illustrated in Figure 26a, and the cyma reversa is illustrated in Figure 26b. These double curvature mouldings are evolved from rectangular and segmental shapes detailed within Figure 26. A small cyma is called a cymatium, which is placed above a band or any larger moulding. To increase the cylindrical profile quadrants, projections are introduced by the addition of straight lines as illustrated in Figure 26c. A double concave moulding is called a scotia or three-quarter moulding and is illustrated in Figure 26d. When a convex and a concave moulding meet, instead of being tangent they come together at an angle, they constitute a beak moulding (as illustrated in Figure 26e). Rectangular or square profiles are used to mark the boundary between each different cylindrical moulding profile to emphasise the change and shape. The contour or outline of cylindrical mouldings is formed from quadrants, or segments, of circles through rotation or addition but further deformations can be introduced with elliptical, parabolic or hyperbolic shapes. An example of a deformation of a cylindrical moulding is illustrated as an elliptical quadrant moulding and is illustrated in Figure 26f. 65
67 Figure 25: Basic shape rules for mouldings Figure 26: Compound shape rules for mouldings 66

68 A range of 3D objects can be formed from the 2D profiles illustrated in Figure 25 and Figure 26, through representation of a shape in 2D profile; the profile can then be revolved or extruded on the third axis to a required value to form a 3D object. In Figure 28, the shape rules illustrated in Figure 25 and Figure 26 are extruded to form 3D objects, which can then be combined in varied sequence to form architectural elements, as illustrated by the moulded architrave on the right hand side of Figure 27. Figure 27: Shape array - 3D Objects mouldings Parametric design based on shape rules Examples of shape and parametric rules, which represent classical mouldings, are illustrated in the following examples in Figure 25 to Figure 26. The shape and parametric rules are designed to exploit and maximise the full range of geometric parameters, deformation of shapes and abstract transformations using efficient and dynamic GDL scripts. When variables are used to control an object s parameters, they are generally represented by one or more words or symbols and relate to specific parts of objects. In the case of cylindrical mouldings (see Figure 28, Figure 29 and Figure 30) the height and 67
69 width of a cylindrical objects is represented by its radius (r) its rotation in degrees (deg.) and its height (ht) and in the case of planer objects, extrusion is represented by length (l) or depth (dp.). The use of such protocols is necessary as the consistent use in naming variables allows them to be combined into compound objects allowing each component part to transform uniformly. Variables can also provide information concerning transformations, scale, the current pen and the material settings. Parameters can be locked within a script where they are fixed or user modifiable allowing the user to change settings. When an object is built it contains a list of user modifiable parameters visible within a user interface or a dialog box, which controls the object. Parameters can be dimensions and angles, numbers and integers, materials and pens, text or fill patterns (Watson, 2009). In the example in Figure 28, a semi-circular object (Torus in Figure 25b) is illustrated. In the GDL script on the right hand side of Figure 28, a prism command is used to represent the objects profile and depth is used to represent its extrusion. The prism profile is scripted by a series of x and y co-ordinated and additional numeric values described as masking (Watson, 2009), representing coding for the object s surface. The difficulty with this particular script is that it is very long and does not contain many variables to facilitate deformation or transformation. The parametric design introduced in Figure 29, overcomes these problems by replacing the numeric values with poly-line codes (Watson, 2009), which represents curve values. The curve values can then be represented by variables and additional variables for the rotational value of the curve (deg) and the cylinder radius r. When different values are attributed for each of the variables the object is transformed and can represent an array of convex, concave and double curvature objects as detailed in Figure


70 Figure 28: Moulding Script Figure 29: Parametric Script 69
. In the GDL script in Figure 30, a command is used to revolve the object to form the cylinder or column shaft.")
71 In the next example in Figure 30 a semi-circular object is rotated to form a convex shape (Torus as illustrated in Figure 25) and reversed to form a concave shape (cavetto as illustrated in Figure 25). In the GDL script in Figure 30, a command is used to revolve the object to form the cylinder or column shaft. The diameter of the base of the column is represented by the cylinder radius r1 allowing the moulding to deform in proportion to the column and other elements. The radius of the moulding profile r2 can vary depending on the profile geometry and negative values can be inserted to change from convex to concave profiles. As before poly-lines are used in the code to establish the construction of the curve in the profile, these can be radius, tangent or point and angle based syntax. In addition numeric codes represent masking values for the surfaces (Watson, 2009). Figure 30: GDL code for Torus and Cavetto 70
72 The variables, when attributed with different values transform the objects to form all of the shapes in Figure 31 an array of shapes are presented, which can be combined into compound objects to represent various classical columns. Figure 31: Shape array circular mouldings A Doric column is represented in Figure 32, using coordinate transformations the primitives are stacked on the Z-axis or alternatively moved on the x and y-axis to form the column (see a, b and c). In the exploded Figure 32b, a cylinder represents the base of the column followed by the appropriate series of mouldings. The mouldings are detailed from the pattern books and transformed from shapes in Figure 32a, on the left hand side of the figure. A cylinder and a cone are added on the z-axis to represent the column shaft (the cone represents the tapering of the column one third up the shaft). The height and width of each element is represented by a variable expressed in terms of the object s 71

73 height, width or radius. These primitives are combined with the primitives in Figure 32a on the left side of the figure to form the column with its mouldings. The variables used to represent each value for the primitives are expressed in terms of the base diameter of the column, for example the r1 is equal to the half the diameter of the column base. A series of conical shapes can be used to represent further deformations in the column shaft to represent column enthasis, which is a gradual deformation of the conical section of the column shaft. Figure 32: Doric column The Doric Entablature above the column shaft, which is illustrated in Figure 33, has decorated cornices, friezes and architraves, which are developed using the shape rules in Figure 25 and Figure 26. The details for Doric column and entablature are based on the details in this case from Langley s and Ware s patterns (Langley, 1756a, Langley, 1730, Ware, 1905). Mouldings whether used in columns or architraves are based on shape profiles and expressed as variables in terms of the diameter of the base of the column (2*radius). All of the primitives and mouldings are combined into a compound object, in this case a Doric column and entablature. Additional transformations can re-scale the subsequent whole or parts of shapes or rotate the object around any of its axes. Non- 72

74 geometric parameters such as texture, pen and fill are introduced to replace fixed values, making the object more flexible. When the object is placed, the variables and parameters can be changed to match the object it represents in real world terms; other common parameters are formation level and rotational transformations. The components or objects are placed in libraries or databases; the use of flow control, macros, subroutines and loops can re-introduce these objects in repetition or revised state partially illustrated in Figure 33b. (The GDL code for variations and arrangement of other components of the Doric order is contained in Appendix A on pages A5 to A20). Figure 33: Doric column and entablature Organic and non-uniform shapes Ionic Scroll Organic shapes such as the Corinthian and Ionic capitol require more complex design based on NURBS Non-Uniform Rational B-Splines (Watson, 2009), meshing and Boolean operations (see Appendix A29 to A34). The 2D scroll in Figure 34 was formed using (NURBS) and depth was added using slab commands, the scroll is based on pattern 73

75 book details (Langley, 1756a, Langley, 1730, Chitham, 2005, Ware, 1905) these descriptions lay out a complicated geometry for establishing the scroll radii. Figure 34, below illustrates a method for the construction of the Ionic volute of the capital of the Ionic columns. The volute is constituted of twelve quarter-circles, the centres of which are situated inside the eye. These centres are inscribed along the diagonal of a square that is placed within a larger square and rotated 45 degrees. The eye of the volute is placed in the inner square. The diagonals of the inner square are divided into six equal parts, resulting in the identification of a total of twelve points. The centres of the respective quarter-circles are numbered progressively from 1 to 12 clockwise from the exterior to the interior. The point of the compass moves each time to the next successive centre. The left drawing in is attributed to Batty Langley and the right is the drawing from Andrey and Galli (Langley and Langley, 1746, Andrey and Galli, 2004). Figure 34: Construction of the Ionic volute (Langley and Langley, 1746, Andrey and Galli, 2004) 74
 (Watson, 2009) to build a 2D profile. Meshing was then used to add the irregular depth of the leaf.")
76 Figure 35: Ionic capital Corinthian Capitol The Acanthus leaf (Langley, 1756a, Langley, 1730, Pain, 1788, Chitham, 2005, Ware, 1905) in Figure 36, was formed using Non-Uniform Rational B-Splines (NURBS) (Watson, 2009) to build a 2D profile. Meshing was then used to add the irregular depth of the leaf. Group and solid (Boolean) operations were used to create the bend in the leaf around the column and the bend at the top of the leaf, which is illustrated in Figure 36b. The object is bent in two directions by intersecting the two objects and the intersection results in the creation of leaf illustrated in Figure 36c. The range of parameters attributed to the Acanthus leaf is limited to its bounding box i.e. height, width and depth and the radius of the bend around the column. Finally the leaf is repeated to match the columns diameter through a looping procedure as shown in detail d and stacked with additional ornament to form the Corinthian capital (see Appendix A21 to A28). 75

77 Figure 36: Building of Corinthian leaf and capitol 4.5 GDL objects in building structures The building components and materials in the facades Georgian buildings are brickwork and stone in the external walls, sliding sash windows, door-cases, doors and in some cases, fanlights. A large amount of the original elements of Georgian buildings are still in place and date back to the early eighteenth century or have evolved with additions over the centuries (Innocent, 1916) Walls brickwork, limitation of GDL The textured point cloud can be used to represent the external surfaces of the buildings and will be used to represent the bonding and texture of brickwork in particular. The surface of brickwork in the external walls of Georgian buildings is relatively flat and therefore can be modelled and represented by laser scan products such as textured point- 76

78 cloud or ortho-image. Because of the variation in size, texture, bonding, pointing and condition GDL models cannot compete with the laser survey detail. The external walls in Georgian buildings in Dublin are mainly constructed in brick and laid in a Flemish Bond using a mortar mix of lime and sand. Flemish and English bonds were the principle bonds used in 17th and 18th centuries. The bricks vary in size because they were handmade. A sample of brick dimensions measured from the scan survey indicate an average size of nine inches in length and two and one half inches high, although. The colours of bricks varied from red, purple, or grey in the late 17th century and up until the early 1730s, imported brick from Holland was grey in colour (Lynch, 1993, Nicholson, 1823, Roundtrees, 2002,). These observations are presented to assist in developing a protocol for representation of external building fabric. Samples of laser scan products such as textured point-cloud or ortho-image are illustrated in Figure 37 below. Orthographic textured point clouds can therefore represent the external brick fabric. The first image in Figure 37a, is a dense point cloud from which it is not feasible to abstract brickwork dimensions. The second scan in Figure 37b illustrates a textured point cloud whereby bonding, texture and pointing details can be observed and measured. Figure 37: Point cloud and textured point cloud 77
79 4.5.2 Parametric design for building façade proportions and opening sizes The detail behind the scan for building facades is developed using GDL objects and is designed from a second set of shape rules and historic techniques presented in the pattern books (Langley, 1756a, Langley, 1730, Halfpenny et al., 1757, Pain, 1788, Chitham, 2005, Ware, 1905). The external wall or façade of the building can be treated as a whole object, facilitating the plotting of the wall with its openings as a single unit. The parametric design for size and position of openings can be developed from rules of proportion outlined in the pattern books. The proportioning of the façade is determined by the geometry of the window openings, which is expressed in Figure 38d by the relationship between circles of the same radius. The top windows are made up of a single circle, in the next set of windows intersecting circles and finally in the lower set of windows the circles are placed one on top of each other. The height of the opening dictates the angle of the brickwork head (Langley, 1756a). The construction of the golden section (Fletcher, 2006, Frings, 2002), a geometric proportion used in classical architecture can determine bay widths. The golden mean or golden section is illustrated in figure 39c. The section is formed initially by constructing a square, inscribing a circle from the centre of one of the sides of the square, side A is extended by the distance B to meet the tangent, and the rectangle is completed. The rectangle represents the golden section and is represented as red lines in Figure 38e. The vertical distance between window openings are usually asymmetrical with the diameter of the circle d1, as shown in 19d. The application of proportional rules assist in representing the facade as a GDL object allowing for a parametric design to include for variables in opening sizes and their relative positions. Although much of the original facades of Georgian buildings in Dublin have survived, alterations have removed or obscured some of the original façade proportions. The alterations to the facades can include removal or enlarging of brick walls, window and door openings and parapets. The application of the rules of proportion can also assist in the modelling and representation of the original structure or façade for restoration purposes. 78

80 Figure 38: Proportions for façades and openings The sample script in Figure 39a, is for a typical Georgian full panel with two large windows one medium and one small. Two variables are introduced, the width of the window based on the diameter of a circle and the distance between the windows which is also dependent on the diameter of the circle. A series of openings are established using a GDL script for cutting the openings in the wall panel. The openings are laid out according to the proportions illustrated in Figure 38d and Figure 38e. The golden section is not taken into account in the shape rules in this instance. The width of the window A (the circle s diameter) is used to establish the position of the openings in the wall as detailed in the section of GDL script on the right of Figure 39a. Conflicts can arise between the façade as surveyed and the geometry which is based on pattern book detail. In this case, single opening panels are then used to resolve the departure from pattern book geometry 79


81 and proportion. The single panels can be adjusted for any opening size or distance between openings. A sample code is illustrated in Figure 39b of a single opening panel which can be placed in any position and will cut an opening in a solid wall panel (see Appendix A36 to 45 for GDL code). Figure 39: Wall Façade as a GDL object 80

.")
82 4.5.3 Stonework The principal types of stone used in the construction of Georgian buildings in Dublin are limestone, granite and sandstone. Calp, a local limestone, is used in the walls to some of the basements and is mainly covered with a render. Local granite is used in plinths, cornices, steps, cills and copings. Imported Portland stone is used in the construction of more complicated mouldings and carvings associated with door cases, porticos and architraves around openings etc. Local sandstone is also used to a lesser extent for intricacies in carved work for the later elements (Lewis, 1837). Stone shapes are much larger and better defined than brickwork and can more easily be represented as 3D models using GDL. An arrangement of stone shapes is illustrated in Figure 40 to create a composite wall with an arched opening. A semi-circular object is subtracted (using solid element operations) from a larger block which represents a wall shape. Ashlar stone is represented using an array of block shapes; plinth and corbels are then combined with the other objects to create the final composite object (see Appendix pages A53 to 54 for GDL code). Figure 40: Stonework details in walls and openings 81
83 4.5.4 Sash windows The sliding sash window is illustrated in Figure 41 and is the traditional window of most Georgian houses in Ireland, originating in the mid-17th century in Northern France and then moving into Ireland in the 18 th century from England. The sliding sash window was preceded by hinged casement windows. Original early-18th construction methods used for sash windows exposed the timber boxes in which sashes were held. A sectional detail of the timber boxes is detailed Figure 41b. In addition no reveal was included as the windows were often flush with the brick- work (Innocent, 1916). Building regulation in Ireland in 1729 changed this practice, stating that the window had to be set back from the facade by at least four inches. The early sash windows tended to be smaller, in line with Palladian principles, whereby the window cill was level with the dado rail. The different glazing arrangements of the sash window is illustrated in Figure 41c, (Roche, 1999) (Rivington, 1875). A typical 18th profile of a glazing bar profile sash frame is detailed in Figure 41a. A model of part of a semi-circular Venetian window (Langley, 1756a) is illustrated in Figure 41d. The centrepiece is usually accompanied by two sidelights (not shown in this detail) and is framed by ionic pilasters. This Venetian window is constructed using sash frames and appears in many Georgian buildings usually in isolation to the rectangular sash windows that form the main bays of the building facades. Finally in Figure 41e to f, arrangements are detailed of a typical stone architrave surround to a sash window. The GDL script for sash windows and their configurations is detailed on pages A35 to A70 in Appendix A Doors and door cases In Figure 42 a and b, Doric, and Ionic stone door cases are illustrated constructed with pediments supported by columns including stone surrounds. The Doric and Ionic orders in the door cases represent complex GDL objects, which are an ensemble of the mouldings, and primitives that illustrate the shape rules and parametric design presented in this chapter (Langley, 1756a, Langley, 1730, Halfpenny et al., 1757, Pain, 1788,). Many of the original stone entablatures and pediments disappeared when neoclassical styles were introduced in the late 18 th Century. The pediments were replaced with arched 82

.")
84 openings with large fanlights (see Figure 42c, d and e) over stone door cases with fine carvings. Sidelights and plaster enrichments were included around the fanlight (O Neill, 2003a, O Neill, 2003b). Figure 41: Sash windows 83

. The roof coverings consisted of slate fixed onto battens in gable or hipped roof construction.")
85 Figure 42: Doric and Ionic door case Roof construction Roof construction during the Georgian period in Dublin was not formed in the same complex manner as previous medieval styles, as oak was no longer available. The oak was replaced by imported Baltic pine and was used in a more economical fashion with lower pitches constructed usually as triple roofs with rafters, collars, ties, struts and purlins as detailed in detail c (Innocent, 1916, Rivington, 1875, Nicholson, 1823). The roof coverings consisted of slate fixed onto battens in gable or hipped roof construction. A series of shape arrangements for roof forms are laid out in Figure 43. Meshing and mass commands in GDL allow for the introduction of height in addition to width and depth (Watson, 2009). The shape arrangements begin with a flat rectangle in Figure 43b 84
86 where the height (Z) is set at zero. The object is raised at Z2, Z3 and Z4 to represent a half gable roof. Bending is introduced by bringing Z4 back down to zero and a hip roof shape is formed. Figure 43: Shape rules for roof construction In Figure 43a, b, c, d and e, the arrangement of components for a typical 18th century timber roof carcass is detailed. The geometry for each component ceiling, joist, strut, ridge board etc. is calculated, based on half the roof span and the pitch of the roof. The GDL code for these arrangements is detailed on pages A72 to A75 in Appendix A. The arrangement for different configurations of roof covering is detailed in Figure 44i. This includes pitched (f), hipped (g) and valley geometry (h), which again is based on half the roof span and the pitch of the roof. Different configurations of the roof carcass and covering can be constructed by changing variables of roof geometry. The GDL code for the roof covering elements is detailed on pages 76 to 78 in Appendix A. Finally in j an 85


87 arrangement for a timber roof covering and carcass is illustrated (see page A78 in Appendix A). Figure 44: Roof types and construction 86

88 4.6 Conclusion By starting with the design of parametric mouldings as the smallest building block, followed by the parametric design of elements such as columns, pediments, walls, windows and roofs new parametric design and shape rules are implemented. In Figure 45, the rules of classical architecture are illustrated in two examples of an ensemble of the classical orders. An arrangement for a Doric colonnade and pediment is detailed in Figure 45a, (see pages A8 to 20 in Appendix A for the GDL code). An arrangement for an Ionic colonnade and dome roof is detailed in 45b (see pages A80 to 84). The mapping process for plotting parametric objects onto laser scan survey data which is the next stage of HBIM, is detailed in the next chapter. Figure 45: Example of architectural rules in façade plot 87
89 5 Chapter 5: - Plotting Parametric Objects
90 5.1 Overview A methodology for accurately mapping parametric objects onto laser scan survey data is presented in this chapter. The laser scan survey data can be considered as a skeletal framework, which is then mapped using parametric architectural elements to form the HBIM. Three case studies are presented in this chapter to illustrate this mapping process. The first case study illustrates the plotting of an historic façade, which include the walls and windows. The second case study illustrates the plotting of detailed objects, for the door case of the façade. The third case study presents the mapping of the whole building s outer fabric and the street. The three case studies presented in this chapter represent the design and evolutionary stages of the HBIM mapping process. The addition of a web-based photo-scaling application for extracting numeric measurement data is presented as an outcome of the testing of HBIM. The testing of HBIM is presented in the following chapter to this one. Finally, in this chapter a series of examples illustrate the automation of conservation documentation from HBIM. 5.2 Case Studies - A mapping process for HBIM Case Studies Ortho-images and segmented point cloud sections and elevations are the initial data imported into HBIM. This data is imported in image and vector format for further processing within the HBIM platform. Ortho-images are photo realistic models containing width, breath and height of an object. The point cloud is segmented to supply plans, elevations and sectional cuts for mapping of library objects. Further interrogation of the laser scan survey data supplies numeric values for parametric values for the library objects themselves Case study 1- façade plot of no 3 Henrietta Street Henrietta Street, one of Dublin s earliest Georgian streets was chosen as a set of case studies to test HBIM. The first case study based on the laser scan survey of Henrietta Street illustrates the plotting of the façade of number 3 Henrietta Street. 89
91 Step1 Scaling ortho-image and identifying benchmarks The ortho-image was imported into ArchiCAD and scaled to size using known coordinate vales at fixed points on the image. A project co-ordinate system was established by identifying a temporary benchmark 0, 0, 0 at ground level, located at a recognised point on the laser scan survey. The formation level was set along this point horizontally on the x-axis. Formation levels can then be set for each story level at a central point between the window openings and horizontally along the x-axis (see Step1 - Figure 46). Step2 Extracting measurements from the ortho-image The dimensions of the wall (height, width and length) were calculated from the orthoimage. Co-ordinates (x,y values) are recorded using hotspots (markers placed on the image) that were then used to calculate length or angular values (see GDL script in Figure 46). A wall is normally defined by its parameters (height, width and thickness) and its position in a co-ordinate system relative to other objects. The height of the wall can also be defined by its formation level at each story level and finishing level (roof). The wall can be plotted for each story level, but in this case the wall was plotted from ground level to roof level. The thickness of the wall will depend on its composite construction. The materials and techniques that make up the wall construction can be determined from the ortho-image data. In this case the bonding of the brickwork is Flemish bond, which assists in the identification of the composite structure of the wall. Based on this information, two and a half brick measuring 550 mm was assumed as the wall thickness (Nicholson, 1823). Step3 Modelling the 3D wall The length and thickness of the wall was then positioned on plan and the dimensions of the object were inserted in a dialogue box, shown in Figure 46- Step3. The formation level, which in this case is zero, is inserted in the dialogue box to form the 3D wall. The other parameters such as texture, sectional fill details and other numeric and descriptive data can also be entered in the dialogue box for the wall. The level of information requested regarding the objects parameters depends on the specifications in the original GDL script. Finally the 3D wall is represented in Figure 46 Step3. 90


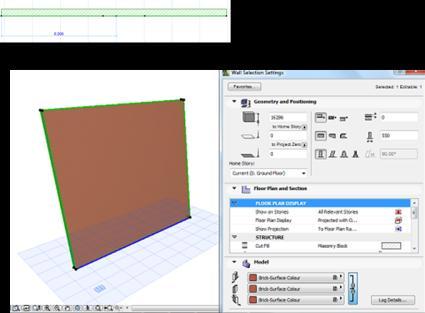
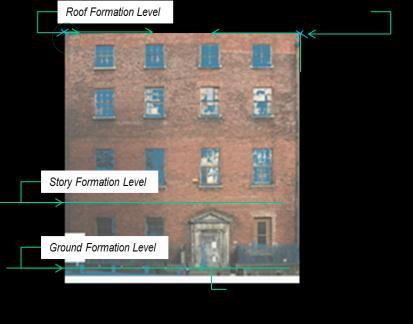
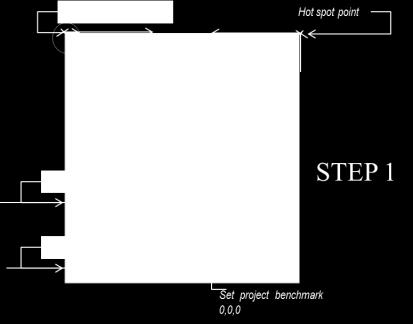
92 Figure 46: Plotting external wall 91
. The numeric data required for plotting and sizing the window and openings was extracted from the laser scan survey as an initial procedure.")
93 Step4 - Windows and openings Again the parameters for opening sizes, position of the window s opening and timber sash sizes are defined by measurements extracted from ortho-image and segmented point cloud vector data (as detailed in figure 46 Step2). The numeric data required for plotting and sizing the window and openings was extracted from the laser scan survey as an initial procedure. By placing a marker on the points A, B, and C onto the orto-image (detailed in Figure 47a), the x and y coordinates for each point were calculated. The lengths and formation levels were then obtained for the required parameters of the window and placed in a data sheets. Other parameters can then be calculated from the x and y coordinates such as angular values and distance between objects. The window openings as objects (see GDL script in Figure 39) are positioned on plan on each story or on elevation as detailed in Figure 47c below. The completed 3D model of the wall with openings is detailed in Figure 47d below. Figure 47: Plotting openings 92
 are plotted into position onto plan and elevation as detailed in Figure 48a and b.")

94 Step5 Placing window sashes The parameters for the timber sash windows are based on both laser scan survey data and historic data. The sash windows as objects (see page A65 in Appendix A for GDL script) are plotted into position onto plan and elevation as detailed in Figure 48a and b. The red vector lines in Figure 48b represent the window position in plan, based on the laser scan segmented survey data (vector format). In Figure 49 a view of the window in 3D is detailed also showing the dialogue box for the window for fixing parameters. Finally in Figure 50, the 3D model for the wall with openings and sash windows is illustrated. Figure 48: Positioning windows in plan 93


95 Figure 49: 3D view of widow and dialogue box Figure 50: Plot of wall and windows 94
96 5.2.3 Case study 2 - door case to number 3 Henrietta Street In this case study, a door case from no 3 Henrietta Street is chosen to represent modelling to a higher level of detail requiring higher accuracy levels for both the survey data and the modelling process. Historically door cases were copied from the pattern books and represent a re-production of the classical orders. Consequently it is an ideal example to illustrate the building of a parametric object from laser survey data and the additional input of pattern book detail to augment the laser survey data. Step1 - Modelling the door case pediment The design of the door case pediment is identical to the pattern book detail from Pain s interpretation (Pain, 1793, Pain and Pain, 1786) of the Doric classical orders (figure 51a). He does not however show detail of the regulae and rosette (see Figure 51f) this detail is taken from Langley (Langley, 1730). The Classical proportioning which is used is based on a series of modular relationships based on the diameter of the base of the column. In Figure 51a, detail 1 sets out the modular relationship, which are all based on one module (1M), which represents the diameter of the base of the column. Detail 2, illustrates a vector plot of Pain s interpretation of the Doric classical orders. The pediment is made up of the entablature in the centre placed on the capital of the column supporting it and two raked cornices over the entablature. The Doric entablature is 2 modules high and is made up of the cornice, which is 0.75modules in height, the frieze, which is 0.75modules in height and the architrave 0.5 modules in height. Finally the raking cornice, which is constructed over the entablature, is 0.75modules in height. In Figure 51 below, a number of the objects are illustrated mapped onto the ortho-image on the left. On the right of Figure 51, the objects are shown in the 3D model. The pattern books alongside the laser survey data (see Figure 51e and f and Figure 52) are used to build the model of the pediment and establish the parameters of the main objects. The objects which make up the Doric pediment are the trigliphs (see Figure 51b), cornice (see Figure 51c), frieze (see Figure 51d), the regulae and rosette (see Figure 51e), and the architrave (see Figure 51f). The parametric objects were built from GDL scripts as detailed on pages A10 to A18 in Appendix A. 95


97 Figure 51: Mapping pediment and column objects 96
.")

98 The laser scan survey outputs consisting of ortho-image and segmented point cloud are detailed in Figure 52 below. The measurements for plotting the door case are extracted from this laser scan survey data (as detailed previously on pages 91 to 92). This data is combined with detail from the pattern books to model the door case. Figure 52: Survey data for door case Step2 - Mapping columns from generic library objects In Figure 53a, the Doric column is mapped onto laser scan survey data as composite element. The GDL scripts for generic columns are detailed on pages A8 and A19 in Appendix A. The use of generic columns which allow for configuration of main geometric parameters dealing with height and diameter speeds up the mapping process. While this appears more efficient, conflicts will arise in arranging sub-elements and matching geometry between the survey data and that of the generic column. Step2A Alternative to Step2 - Mapping columns from moulding geometry To overcome conflicts which occur between the geometry of the survey data and the generic GDL column object, the laser survey data is mapped using a series of cylindrical primitive parametric objects as detailed in Figure 53b. The primitive mouldings are deformed for different geometric scenarios (see examples in 53c). The GDL script for the primitive moulding objects is detailed on pages A7 in Appendix A. The objects are arranged to form the column base as detailed in Figure 53d. In the case of the door case of number 3 Henrietta Street, decay at the base of the column prevented the extraction of 97
 were then used to assist the mapping process.")


99 full detail from the laser scan survey data. Interpretations from the pattern books (Figure 53b detail 3) were then used to assist the mapping process. The remaining parametric objects, which make up the Doric column, which include the capital and shaft, were built up in a similar fashion to the base. The 3D model of the door case is detailed in Figure 53e. Figure 53: Plotting columns, door case and pediment Case study 3 - plotting the whole of Henrietta Street The layout and building typologies that make up Henrietta Street are particularly characteristic of the Georgian period. It is evident that the street is practically intact, with the exception of demolition of part of 15 and 16, and the construction of the Law Library 98
100 in 1828 (Figure 60a). Additional historic data, such as the identities of builders and architects, assist in identifying the sequence of construction of the street. For example, Edward Lovett Pearce, who was one of the most prominent designers in Dublin in the early 1700s, is accredited with the design of numbers 9 and 10 Henrietta Street. Pearce studied Renaissance manuscripts and in particular the Palladian styles that were popular in the early 1700s in Ireland and Great Britain, and subsequently this influenced his designs for Henrietta Street (Craig, 1980). There are no surviving design drawings for Henrietta Street. The main elements, which make up the façade of the houses on Henrietta Street, are the brickwork and stone in the external walls, the sliding sash windows, and the door cases, doors and fanlights. The roof covering is black slates laid on hipped and gabled roofs. Some of the original elements of the buildings are still in place and date back to about 1730 at the earliest, or have evolved with additions over the centuries. The terraces of Henrietta Street were laid out with basement areas bounded by wrought iron railings. In the 19th century, cast-iron balconies were applied to facades and wrought iron grilles guarded basement windows and fanlight windows. Setts (Square block cobbles) developed from cobbles are laid on the street and granite paving is laid on the footpaths and granite up-stands under the railings. In Figure 54 the external structure, fabric and architectural elements of no 3 Henrietta Street were mapped. Detail a, represents the hipped and gable roof which is located in place on the external walls. Detail c, shows windows and door case and bounding railings mapped in position. In Figure 55a, the road is constructed directly from the point cloud by meshing and surfacing the point cloud data and introducing the mesh as an object into the street model. The partially constructed model in Figure 55b consists of the repetitive terraced buildings, which can be modelled using standard facades as objects. Additional buildings were added to the model at both top ends of the street. These buildings were modelled separately and were introduced into the model as objects (as detailed in figure 55c and d). 99


101 Figure 54: Plotting the whole building Figure 55: Plotting the whole street 100
102 5.2.5 Summary of plotting process The products of laser scanning surveys in the form of ortho-images and segmented point cloud sections are the initial data imported for further processing within the HBIM platform. From a plug-in library, parametric objects representing architectural elements are plotted onto the laser survey data. Before placing an object in HBIM the default parameters can be edited, changing the object s shape, size or other properties to correspond with the survey data. The parameters for objects are extracted as numeric data from the ortho-image and segmented point cloud data. The objects are then manually positioned onto the segmented plan and orthographic image in elevation and adjusted in side elevation and section using segmented data for angular displacement. The image and segmented datasets represent the information for a particular plane on the x, y, and z-axis. The planes on x, y, and z-axis can therefore represent elevation, plan, or section of an object. When a library part or parametric object is placed into the HBIM, it is placed as an icon in 2D in the floor plan, separated by height or formation levels and is located along the x and y-axis. In section and in elevation, the object is positioned in relation to the z- axis relative to the x and y-axis. 5.3 Improving the mapping process Summary of design rationale The primary design rationale for the HBIM mapping process is to use efficiently and accurately the survey data that is based on laser scanning for modelling of historic structures. The appropriate survey data are described in chapter 2 as segmented point cloud, structured mesh data and orthographic image data. The laser scan data provides a survey framework, which is then, mapped using parametric architectural elements to form the HBIM. The library of parametric objects is designed as a plug-in for existing software platform Graphisoft ArchiCAD. The experiences of testing the HBIM (this detailed in the next chapter) in pilot case studies have identified the requirement for numeric data to accompany the segmented point cloud and image data. Numeric data is required for 101
103 adjusting the geometric parameters of the object before it placed and can be obtained from interrogation of laser scan data. In this section an improvement is proposed for mapping objects onto the laser scan survey framework in relation to the extracting of parametric information from the laser survey data. The previous case studies illustrate the different possibilities for plotting library objects onto a range of survey frameworks. A more robust system is required for the plotting stages of HBIM, which will accelerate the mapping process. This improved system can be introduced by semi-automatically supplying numeric and measurement data for adjusting the parameters and plotting the objects to establish the model A scaling and measurement application A specialised web-based ortho-photo scaling application has been developed as integral part of HBIM to automatically supply numeric data. The application is easy to access and portable and can be used on any operating system and browser and independent of commercial software platforms. The photo-scaling application is a webbased application and its design will allow for extending the application to work on mobile devices. The application is used for measuring distances and angles between points using two-dimensional orthographical images and pixel based segmented point cloud data. The application is developed using Ruby on Rails which is an open source web framework (RubyonRails, 2012) and Javascript (JavaScript, 2012). A sample of the code for the application is detailed in Figure Implementation and design Ruby on Rails is used on the server side for creating users, database storage and using special libraries called gems for uploading the orthographic images and other pixel based data. HTML, Javascript and JQuery are used for the image manipulation. When the user uploads an image it is displayed on screen with a size of 700 by 550 pixels. This scale is used irrespective of the original scale of the image, this way a standard distance between each pixel is maintained. Once the image is uploaded and displayed the user is asked to begin selecting two points. These first two points are control points, which are predetermined distances, based on real world measurements for the object. Using 102
104 JavaScript the position of the user s marker in the window is located, and using JQuerys offset method the position related to the image location on the screen is determined. To mark the point on the image, which the user selects, a HTML div (division) is overlaid on that particular point with the size of 1 pixel. Using JavaScript in this way the correct values will be determined regardless of the users screen resolution or, for example, if the browser is set to a certain zoom level. The code sample in Figure 56 below locates the current x and y position when the point is located on the image. The offset.left value is subtracted from the x value indicating distance the located point is from the left of the image. Similarly the offset.left value is subtracted from the point located for the y value to measure the distance from the top of the image. $('img').click(function(e) { var offset = $(this).offset(); alert(e.clientx - offset.left); alert(e.clienty - offset.top); }); Figure 56: Code sample for web application Scaling and measuring The ortho-image from the laser scan survey is imported into the application. A user enters a control measurement or known distance of x metres and the distance between the two pixels on screen is p, 1 metre on the screen is equal to p divided by x. This value is stored then for the uploaded image and can be edited by the user at a later time if needed. The users can then select more points on screen; for each distance in pixels that is calculated the distance in metres is retuned. Once these points have been selected the formula below is applied to get distance between the two coordinate points. 103


105 Equation 1 Where dx is the difference between the x-coordinates of the points and dy is the difference between the y-coordinates of the points. For measuring angles the formula below is applied: Equation 2 Figure 57: Photo scaling application 104
106 5.3.4 Combing web-based application with GDL script The figure below illustrates the potential to automate library parts based on numeric data extracted using the web-based photo-scaling application. Detail a, represents the variables that define the location of an opening these are illustrated in the vector diagram in the centre. The variable consist of the size of the opening and the distance of the opening from other objects in this case other openings. The GDL script is illustrated in detail b, which generates the single panel in detail c. The panel can then be repeated to form the full panel in detail d. The GDL scripts for different arrangements of openings, stone cladding and architrave surround for wall panels are detailed in full on pages A35 to A57 in Appendix A. d. Figure 58: GDL script for automating wall panels 105
107 5.4 Creating conservation documentation from laser scan surveys BIM software platforms can automatically create cut sections, details and schedules in addition to orthographic projections and 3D models (wire frame or textured and animated). The visualisation of objects is achieved through viewing 2D and 3D features, plans, sections, elevations and 3D views (Aouad and Lee, 2007, Eastman, 2006). Conservation documentation can be automatically generated from completed HBIM models as a result of building a parametric library (based on GDL) as a plug-in library for ArchiCAD software platform. Where conservation or restoration work is to be carried out on an object or structure, conventional orthographic or 3D survey engineering drawings are required. To a large extent current research concerning automated surveying systems for cultural heritage objects has concentrated on the identification of suitable hardware and software systems for the collection and processing of data. As a result, the output is the accurate 3D model mainly suitable for visualisation of a historic structure or artefact. The production of conservation documentation from laser and image survey data can be described as a reverse engineering process; whereby an object s physical dimensions, geometry, and material properties are captured to produce orthographic plans, elevations, sections and 3 D models (Cheng and Jin, 2006). The objects in this case are historic structures brought through the design process in the opposite direction, revealing information about the original design and construction. In the final stage of the HBIM process full engineering drawings orthographic, sectional and 3D models were automatically produced from the Historic Building Information Model as a function of the software platform Graphisoft ArchiCAD. A sample of street elevation drawings are illustrated in Figure 59a, b, and d. In addition typical section and elevation details are shown in Figure 59d, e and f. Finally in Figure in figure 59g a partial 3D drawing is produced of the street. Similarly in Figure 60 a set of plan, elevation and section drawings are detailed. The 3D drawings detailed in Figure 60c and d are described as 3D documentation, in this instance showing cuts between wall, floor and windows. 3D documentation can be produced at any location in the model and is a useful conservation tool. Finally window schedules are automatically produced as part of HBIM process. 106


108 Figure 59: Drawings produced from HBIM 107


109 Figure 60: drawings produced from HBIM Henrietta Street 108
110 5.5 Conclusion Mapping parametric objects on to a point cloud requires the correct positioning and orientation of objects to represent their real world state. In addition the use of parametric objects can also introduce the opportunity to develop detail behind the object s surface concerning its methods of construction and material make-up. Mapping the objects directly onto the point cloud, is not practical as the data size of the point cloud is large which will slow down data processing. In addition accuracy is affected by mapping in 3D space, as it is difficult to locate an object s exact position within a 3D point cloud. The proposed solution is to map the objects in 2D onto segmented point clouds and orthographic images in elevation, plan and section. A more robust system has been developed for the plotting stages of HBIM. One of the main features of this system is a web-based application for semi-automatically supplying numeric and measurement data for adjusting the parameters and plotting the objects to establish the HBIM. In the final stage of the HBIM process orthographic drawings, schedules and 3D models can then be automatically produced from the Historic Building Information Model. The next chapter evaluates HBIM and presents and evaluates the production of conservation documentation from HBIM. 109
111 6 Chapter 6: - HBIM Evaluation and Testing 110
112 6.1 Overview In this chapter the methods and results from two separate evaluations of HBIM are presented based on the use of conservation scenarios. The first evaluation is an end-user test of the software and the second a qualitative assessment of documentation generated using HBIM. An explanation of scenario testing followed by a definition of conservation documentation is presented initially in this chapter. Conservation documentation is an outcome of the HBIM process and features in both evaluations. The procedures, findings and analysis and review of both evaluations, which are the end user test and the qualitative assessments of documentation, are then presented. In addition, a data sample of HBIM documentation is compared with related ground truth data to assess accuracy Conservation scenarios - definition The conservation scenarios represent simulated applications of HBIM and were developed to determine the efficiency of the software and its capability to produce conservation documentation. Conventional software design and evaluation methods can be carried out through tasks described by fictional applications to evaluate end user requirements as proposed in scenario-based design (Carroll, 2000). The fictional applications for the software are established through the use of credible stories, which then identify problems and the potential for improvements in the software. Because of the diversity and complexity of architectural conservation projects, simulated conservation scenarios were used to represent an example of this diversity in order to evaluate HBIM. The process began by constructing or developing alternative scenarios and then integrating the context of those scenarios into constructing a Historic Building Information Model related to the laser scanning survey of Henrietta Street. In addition to developing the fictional applications, discussion and dialogue with the test participants created a continual input resulting in on-going review and revision of the software design Conservation documentation definition Conservation documentation is the continuous systematic and scientific recording and compilation of both tangible and intangible elements of historic structures and 111
113 environments over different timeframes. The purpose of documentation is to enable through the supply of accurate information the correct conservation, monitoring and maintenance for the survival of an artefact ( Fai et al., 2011, Blake and Bedford, 2008, Letellier et al., 2007, Santana Quintero, 2003). Article 16 of the Charter of Venice 1964 describes the process of recording and documentation of architectural heritage in following extract: In all works of preservation, restoration or excavation there should always be precise documentation in the form of analytical and critical reports, illustrated with drawings and photographs. Every stage of the work of cleaning, consolidation, rearrangement and integration, as well as technical and formal features identified during the course of the work, should be included. This record should be placed in the archives of a public institution and made accessible to research workers. (Charter, 1964). Suitable models for appropriate standards for recording and documenting historic structures are detailed in national guidelines such as the Historic American Building Surveys and English Heritage Metric Survey Practice (Bryan et al., 2004, Bryan and Blake, 2000, Fai et al., 2011, National Park Service, 2005). At an international level recording standards have been established by the International Council on Monuments and Sites (ICOMOS), which is, an international non-governmental organisation of professionals, committed to the conservation of the world's historic monuments and sites (ICOMOS, 1964a). ICOMOS operates through national committees and scientific committees, one such committee is CIPA, The International Committee for Architectural Photogrammetry (CIPA), which was established in collaboration with ISPRS (International Society of Photogrammetry and Remote Sensing). Its main purpose is the improvement of all methods for surveying of cultural monuments and sites. The work of CIPA has been instrumental in developing new automated methods of digital recording and storage in addition to the standards required for accuracy of surveying and documentation of the built heritage. RecorDim is a CIPA initiative in collaboration with other international heritage conservation organisations to improve and develop standards for the documentation of architectural heritage (CIPA, 2007). Researchers at Carleton University have proposed the application of BIM as a documentation tool for cultural 112
114 heritage. They propose a system using a series of case studies to exploit the object intelligence within BIM to archive and present both tangible and intangible cultural assets (Fai et al., 2011). The European Committee for Standardization (CEN) provides for European standards and technical specifications in almost all areas of economic activity. The standard CEN/TC 346 has been recently drafted and may be considered as a guideline for a common procedure to describe the condition state of built heritage. The Technical Committee CEN/TC 346 is developing a European standard for guidelines for condition surveys of historic structures in relation to documentation (CEN, 2010). The work of the Technical Committee CEN/TC 346 is at an early stage and as yet does not provide technical guidelines equivalent to those guidelines described on the previous page i.e. RecorDIM, English Heritage and HABS. 6.2 Scenario 1: end-user test Aim: To determine the requirements for improving HBIM through: Comparing 3D CAD and HBIM, Measuring the efficiency of HBIM plotting stages Assessing the production of conservation documentation from HBIM Participants A group of participants were chosen for the end users test from a group of part-time third level construction and surveying students attending the Dublin Institute of Technology who were familiar with CAD and building technology through their profession and their studies. The participants were all male and ranged in age from 19 years to 35 years. A series of three training workshops were held with the group to train them in the application and use of HBIM and 3D CAD as outlined in the scenario above. In total twenty-six students attended the training workshops and fourteen volunteered to participate in the scenario test. 113
115 6.2.2 Conservation scenario A scenario was developed based on the modelling of the façade of number 3 Henrietta Street recorded as part of the laser scan survey of Henrietta Street and described in Chapter 2. The 3D CAD software platform Google Sketch-up was used alongside HBIM as a plug-in library within the software platform ArchiCAD. Similar library objects were used in each plot when using 3D CAD (Google Sketch-up) and HBIM. The library objects were mapped onto identical vector data or image based surveys for the historic façade. The scenario for the end user-test, specified that a set of conservation documents were produced, representing a full survey of the façade of the structure showing the windows and door case. The participants were required to produce a set of conservation documents, to include plans, elevation, cut sections, window details and schedules in addition to 3D documentation. The scenario tests were held after the training workshops in a computer laboratory in the Dublin Institute of Technology. The participants constructed the model over four two-hour sessions using identical software platforms and under supervision. At the end of the exercise the participants were interviewed and completed an online questionnaire. The documents for constructing the scenario are the laser-scan survey and the associated data for building the 3D model of the façade. These are illustrated in Figure 61. The ortho-image is illustrated in Figure 61a, the vector data showing positions of openings is illustrated in Figure 61b. The dimensions and formation levels for the library a sample of library objects (windows) are detailed in Figure 61c. The library objects supplied for the scenario exercise included window and door wall openings, sash widow including all components for each opening size and a Doric door case as a composite library object. Finally, the sequence for plotting the 3D model illustrated in Figure 61e. 114

116 Figure 61: Survey data for construction the 3D model of the historic façade 115

117 6.2.3 Results Users were asked to rank on a scale from 1 (very simple) to 5 (very complex) the use of 3D CAD in contrast to HBIM for modelling the historic façade. The results in figure 62, below indicate that HBIM is more complex than 3D CAD for plotting the building façade. In the case of 3D CAD, 47% scored a factor of 2 indicating a low level of complexity. In the case of HBIM (see right side of Figure 62), 27% of respondents scored it at 3, 4 and 5, indicating that the majority of respondents identified HBIM as more complex to use than 3D CAD. Figure 62: Comparison of complexity between 3D CAD and HBIM The users were asked to indicate the time taken to learn to use 3D CAD in comparison to HBIM. All of the users tested agreed that it took longer to learn the software HBIM platform than 3D CAD, the largest group at 27% specified that it took three times as long to lean HBIM in comparison to 3D CAD (Figure 63). 116


118 Figure 63: Time taken to learn to use HBIM in comparison to 3D CAD The next part of the end-user test examines efficiency of HBIM in relation to user requirements and suggested improvements for the system. In the following part of the test, the users were asked to assess the efficiency of each of the plotting stages for creating the model based on the laser scan survey data. The survey data for plotting the 3D model in HBIM consists of a range of data; these are Ortho Image, Vector plot, Data sheets containing numeric data and a combination of all of these. In order to examine the efficiency of HBIM, the following plotting stages were assessed: Importation of the laser survey data into HBIM and possible causes of error Calculating parameters and sizing of library objects Improving objects parameters Improvements in plotting objects onto laser scan survey data. Importation of the laser survey data into HBIM and possible causes of error 47% of the participants identified that the use of the ortho-image as the most efficient way to import the laser scan survey data into HBIM in order to construct the 3D model, see Figure 64 below. 117
.")
119 Figure 64: Preferred sources of data for plotting 3D model Accuracy of survey data When asked to identify where errors were most likely to occur in relation to the accuracy of survey data, most users identified that errors were likely when the orthoimage was imported into HBIM (see Figure 65 below). The reason for associating error with the ortho-image is because of possibility of incorrect scaling of the image data when it is imported into HBIM. This problem can be overcome by embedding measurements or coordinates within the ortho-image, which are verified before the image data is used. Figure 65: Identification of error sources in plotting 3D model 118
120 Extracting measurements from different sources For mapping objects, the parameters of the library objects can be extracted from the laser survey data, in both ortho-image and vector format. In addition, measurements and angular values can be extracted directly from both ortho-image and vector data and then stored independently in data sheets. In choosing between the latter choices, the participants were divided with 29% equally favouring three of the choices; the ortoimage, the data sheets only and finally vectors combined with data sheet, see Figure 66 below. Figure 66: Calculating parameters and sizing objects 47% of participants identified a need to add parameters for irregular shapes in objects in order to improve the objects available parameters. The window openings in the façade chosen for this scenario test are slightly irregular because of decay and the use of handmade brick materials. The library object for the opening was rectangular in shape. In addition 20% of participants identified a need for the introduction of realistic textures to the surface of the objects. In deciding the best format for the plotting of parametric objects, image and vector data was chosen by 43% of participants, vector- data only was chosen by 26% and finally orto-image was chosen by 21% (see Figure 67 below). 119


121 Figure 67: Mapping the parametric objects A comparison of automation of documentation between 3D CAD and HBIM The users were asked to compare the output in terms of automation of conservation documentation between 3D CAD and that of HBIM. The majority of the users (see right hand side of Figure 68) indicated that HBIM could produce the full list of automated documents. A small minority did not include the production of scheduling from HBIM, whereas they indicated that 3D CAD was capable of automating a much smaller range of conservation documentation as detailed on left-hand side of Figure 68 below. The category other in Figure 68 below refers to incorporating the ortho-image as a conservation document. Figure 68: Comparison in the production of conservation documentation 120

122 Most significant sources of errors in HBIM process 47% of participants felt that errors were most likely to occur in original survey data, a smaller number 27%, identified that errors were likely to occur in the plotting of objects and 13% identified that errors could be embedded in the library objects themselves. 7% identified errors occurring in compiling and automating of documents in HBIM (see Figure 69). Figure 69: Accuracy of documentation in HBIM Review of results end-user scenario The purpose of comparing HBIM with 3D CAD was to contrast the complexity for the user with an alternative software system. The results indicate that it takes longer to become familiar with HBIM and to complete the plot of the 3D model than in 3D CAD. The advantages of the HBIM system become evident in the last section of the user test in relation to the quality of documentation and the behaviour of the library objects in HBIM. It is obvious that objects within HBIM contain a vast number of parameters ranging from geometry and texture to conservation analysis and that not all of these designed parameters will function in a 3D CAD environment. While this is apparent, the initial test requirements were to establish how HBIM compares to 3D CAD for ease of use. The majority of the respondents described HBIM as more complex than 3D CAD. The introduction of an additional help and learning centre for HBIM can improve ease of working in HBIM, reducing the effort in time to use and learn the software. 121
.")
123 The inclusion of measurement data in the ortho-image at the processing stage will reduce the possibility of the image being incorrectly scaled. The problems associated in extracting measurements to size library objects were overcome by introducing the specialised WEB based ortho-photo scaling application (detailed in Chapter 5). The application was developed as a result of the issues that were raised in the end user tests and is specifically designed to operate outside of the BIM environment. Improving texture options for objects can be achieved by applying the colour and texture from ortho-images. Figure 70, illustrates how the façade of number 3 Henrietta Street was textured using the ortho-image from the laser scan survey illustrated in a. The image is matched with the 3D object and edited by cutting out openings leaving only wall texture. Figure 70: Texturing objects Introducing improvements in the range of object parameters and the plotting of the objects onto the survey data can be achieved using standard coding protocols for each library object. The improvements for scaling, rotation and anchor points will be included as a template in coding all objects. The precision for placing of objects can be improved 122
124 by coding more obvious anchor points on the objects The ability to stretch objects in 3D to change regular shapes to irregular shapes will be included in objects such as wall openings. In Table 3 below, solutions are summarised for resolving the potential for errors occurring in the system. Table 3: Resolution of errors in HBIM HBIM plotting Functional Information Resolution Comment stages errors errors 1. Importation of the Incorrect scaling of Imbedded measurement laser survey data into orto-images data onto ortho-image HBIM and possible causes of error 2. Calculating Errors in extracting Use specialised WEB WEB based ortho- parameters and sizing measurements from based ortho-photo photo scaling of library objects imported survey scaling application for application was data within HBIM extracting measurements developed from end user testing 3. Improving objects No parameters for Re-code object for parameters creating irregular creating openings in openings walls No realistic texturing Use ortho-image from options for surfaces laser scan survey to texture objects 4. Improvements in Incorrect positioning Re-code all objects to Code more obvious mapping objects onto of objects onto survey include a global anchor points in the laser scan survey data data in HBIM command for anchors to objects position objects Incorrect scaling and Re-code all objects to transformation of include a consistent objects global command for rotation and scaling on x, y and z axis 123
125 6.3 Scenario 2: Evaluation of conservation documentation Aim: To assess the standard of conservation documentation produced as part of the HBIM process Participants profile A series of seminars were held in the Dublin Institute of Technology examining the procedures for recording architectural heritage and the role of HBIM. The seminars were held in October 2009, October 2010 and November Each seminar consisted of a series of presentations from experts in laser scanning, BIM and the recording of historic structures. The participants who attended the seminars were practitioners and researchers from architectural conservation and surveying. In order to draw on the experience of the seminar participants for the development of HBIM, a consultative expert group were identified from the seminar participants. The consultative expert group who agreed to participate consisted of: 1. A senior conservation architect, from National Monuments in the Office of Public Works in Ireland; 2. An engineer specialising in existing structures, who was familiar with the use of BIM models for assessing existing structures; 3. A general practice conservation surveyor who was one of the authors of the conservation plan for Henrietta Street which was funded by Dublin City Council. 4. A full time researcher in the Dublin Institute of Technology in the area of laser scanning and the recording of historic structures. The group consisted of three males and one female between the ages of 22 and Scenario design The previous scenario outlined in this chapter was based on end-user tests in order to establish the effectiveness of HBIM as a software system and identify user requirements. In this evaluation a sample set of conservation documentation is produced using HBIM; the documentation is based on conservation scenarios. The conservation documents were 124
126 reviewed by a group of conservation experts who provided their views regarding the standard of HBIM conservation documentation. The conservation expert group became familiar with the HBIM process through the series of seminars described on the previous page. A number of meetings were organised with the expert group, in order to develop the context and content of the conservation scenarios. This comprised of identifying key conservation problems and translating them into the scenarios. The consultative expert group constructed a second conservation scenario, expanding the first, which was again based on the modelling of the façade of number 3 Henrietta Street. The second scenario was constructed around the conservation of the historic facade, the windows and the door case of number 3 Henrietta Street. A wider range of conservation documentation was therefore required to complete the exercise. The sample set of documents produced was based on the following scenario: Illustrate the location and site context of the historic façade of number 3 Henrietta Street. Present a sample of survey and recording data to enable further analysis of the façade. Produce a sample set of 3D models, orthographic drawing and historical information to enable an intervention for the following: Façade repair and the conservation of brickwork Window repair and energy conservation Door case repair and conservation Results - conservation documentation The results of this evaluation are presented as a set of documentation listed in Table 4 (see appendix D). The documents consist of a sample of location drawings, survey data, 3D models, orthographic drawings and schedules produced as a result of scenario
127 Review of scenario - conservation documentation The feedback from the expert group indicated the suitability of the conservation scenarios to measure the potential of HBIM for producing conservation documentation. Their opinion was, in general that, in contrast to conventional 3D CAD, HBIM produces a wider set of conservation documentation containing information related to geometry, building detail, geographical information, details of materials and other numerical data or schedules relating to the historic structure. They all agreed that the conservation documentation could be automatically extracted to assist with solutions for the different conservation scenarios. They also concurred that the analysis based on the HBIM documentation can produce the following information; visualisation models, survey data, building details, specifications and information sharing. In particular, they identified the advantage of using the 3D models as a cost effective method for simulation of conservation interventions. The overall agreement amongst the conservation experts for the second scenario indicated that the documentation produced provided correct detail for completing the outlined conservation scenario. The question of dissatisfaction related to the need for national standards in Ireland for producing conservation documentation using new technologies. Although it was agreed by the group that the standards produced by English Heritage (Bryan et al., 2004, Bryan and Blake, 2000) could identify the requirements for accuracy and presentation for the scenario documentation. 6.4 Accuracy of façade plot measured against ground truth data The accuracy of the façade plot of number 3 Henrietta Street is measured by comparing a sample of data from HBIM with related ground truth data. In the Table 4, Table 5, Table 6, and Table 7, similar x and y coordinate points on two HBIM elevation plots A and B are compared with a similar set of ground truth coordinate points on the actual façade of number 3 Henrietta Street. The ground truth measurements were obtained from the façade of number 3 using a total station. The average error between the total station measurements and plot A was metres (Standard Deviation (SD) = 0.013) on the x- axis and.024 metres (SD = 0.024) on the y-axis. The average error between the total station and plot B was metres (SD =.008) on the x-axis and.018 metres (SD =.017) on the y-axis. 126
128 Table 4: Comparison between Total Station data and Plot A x axis Total Station Plot A Error Standard Deviation σ X X SD= Mean= Table 5: Comparison between Total Station data and Plot A y axis Total Station Plot A Error Standard Deviation σ Y Y SD= Mean=
129 Table 6: Comparison between Total Station data and Plot B x axis Total Station Plot A Error Standard Deviation σ X X SD= Mean= Table 7: Comparison between Total Station data and Plot B y axis Total Station Plot A Error Standard Deviation σ Y Y SD= Mean=
130 The error range when compared with the precision specified by English Heritage as detailed in Table 8 (Bryan et al., 2004) for objects of the same scale to that of the façade compares reasonably well. In plot B the error on the x-axis was 8mm and 18mm on the y- axis, English Heritage recommend a precision of 15mm for a similar structure. The first plot A did not compare as favourable showing an average error of 24 mm on the y-axis and an average of 13mm on the x-axis. Table 8: Density of point cloud and measurement precision (Bryan et al., 2004) Scale Point Density Precision Typical Use 1:10 2mm +2mm Small objects 5x5m 1:20 4m +4mm Large objects 10mx10m 1:50 15mm +15mm Small structures 20mx30m 1:100 25mm +25mm Large structures 40mx60m Scanning objects at a higher point density can assist in reducing error, but will lengthen the survey time. Errors can also be caused by point definition, which is obstructed by decay of materials at edges. Defining the points using intersecting vectors on the ortho-image can assist the accuracy of point location. In addition by incorporating 129

131 historic data with the survey data, profiles of objects can be re-built which were lost because of decay. In Figure 71, below, the base of a Doric column is illustrated. In the ortho-image, the definition of the elements, which make up the base of the column are obscured because of both decay and occlusions. Other image data and detail from historic data are introduced to define the missing data and build up the base of the column as detailed in Figure 71a. Figure 71: Historic data and definition of objects 130
Semi-Automatic Techniques for Generating BIM Façade Models of Historic Buildings
 Semi-Automatic Techniques for Generating BIM Façade Models of Historic Buildings C. Dore, M. Murphy School of Surveying & Construction Management Dublin Institute of Technology Bolton Street Campus, Dublin
The Processing of Laser Scan Data for the Analysis of Historic Structures in Ireland
 The 7th International Symposium on Virtual Reality, Archaeology and Cultural Heritage VAST (2006) M. Ioannides, D. Arnold, F. Niccolucci, K. Mania (Editors) The Processing of Laser Scan Data for the Analysis
TERRESTRIAL LASER SCANNER DATA PROCESSING
 TERRESTRIAL LASER SCANNER DATA PROCESSING L. Bornaz (*), F. Rinaudo (*) (*) Politecnico di Torino - Dipartimento di Georisorse e Territorio C.so Duca degli Abruzzi, 24 10129 Torino Tel. +39.011.564.7687
Three-Dimensional Laser Scanner. Field Evaluation Specifications
 Stanford University June 27, 2004 Stanford Linear Accelerator Center P.O. Box 20450 Stanford, California 94309, USA Three-Dimensional Laser Scanner Field Evaluation Specifications Metrology Department
Combining a Virtual Learning Tool and Onsite Study Visits of Four Conservation Sites in Europe
 Dublin Institute of Technology ARROW@DIT Conference papers School of Surveying and Construction Management 2011 Combining a Virtual Learning Tool and Onsite Study Visits of Four Conservation Sites in Europe
CONTRIBUTION TO THE INVESTIGATION OF STOPPING SIGHT DISTANCE IN THREE-DIMENSIONAL SPACE
 National Technical University of Athens School of Civil Engineering Department of Transportation Planning and Engineering Doctoral Dissertation CONTRIBUTION TO THE INVESTIGATION OF STOPPING SIGHT DISTANCE
ENY-C2005 Geoinformation in Environmental Modeling Lecture 4b: Laser scanning
 1 ENY-C2005 Geoinformation in Environmental Modeling Lecture 4b: Laser scanning Petri Rönnholm Aalto University 2 Learning objectives To recognize applications of laser scanning To understand principles
3D Modeling of Objects Using Laser Scanning
 1 3D Modeling of Objects Using Laser Scanning D. Jaya Deepu, LPU University, Punjab, India Email: Jaideepudadi@gmail.com Abstract: In the last few decades, constructing accurate three-dimensional models
Integrating the Generations, FIG Working Week 2008,Stockholm, Sweden June 2008
 H. Murat Yilmaz, Aksaray University,Turkey Omer Mutluoglu, Selçuk University, Turkey Murat Yakar, Selçuk University,Turkey Cutting and filling volume calculation are important issues in many engineering
Cultural Heritage. Geometric Recording of Cultural Monuments. Basic Principles of Geometric Recording. Specific requirements
 LOW COST DIGITAL PHOTOGRAMMETRIC TECHNIQUES FOR THE DOCUMENTATION OF CULTURAL HERITAGE Ch. Ioannidis, S. Soile, C. Potsiou Lab. of Photogrammetry School of Rural & Surveying Eng. National Technical University
COMPUTER AIDED ARCHITECTURAL GRAPHICS FFD 201/Fall 2013 HAND OUT 1 : INTRODUCTION TO 3D
 COMPUTER AIDED ARCHITECTURAL GRAPHICS FFD 201/Fall 2013 INSTRUCTORS E-MAIL ADDRESS OFFICE HOURS Özgür Genca ozgurgenca@gmail.com part time Tuba Doğu tubadogu@gmail.com part time Şebnem Yanç Demirkan sebnem.demirkan@gmail.com
USE THE 3D LASER SCANNING FOR DOCUMENTATION THE RIGA CATHEDRAL IN LATVIA
 USE THE 3D LASER SCANNING FOR DOCUMENTATION THE RIGA CATHEDRAL IN LATVIA Maris Kalinka, Elina Rutkovska, Department of Geomatic, Riga Technical University, Azenes 16-109, Riga, Latvia, geomatika@geomatika.lv
3D SPATIAL DATA ACQUISITION AND MODELING OF ANGHEL SALIGNY MONUMENT USING TERRESTRIAL LASER SCANNING
 JOURNAL OF APPLIED ENGINEERING SCIENCES VOL. 2(15), issue 2_2012 ISSN 2247-3769 ISSN-L 2247-3769 (Print) / e-issn:2284-7197 3D SPATIAL DATA ACQUISITION AND MODELING OF ANGHEL SALIGNY MONUMENT USING TERRESTRIAL
Virtually Real: Terrestrial Laser Scanning
 Check. They re Chartered. Geomatics Client Guides Virtually Real: Terrestrial Laser Scanning Understanding an evolving survey technology Summary This guide gives you an overview of the technique, some
REPRESENTATION REQUIREMENTS OF AS-IS BUILDING INFORMATION MODELS GENERATED FROM LASER SCANNED POINT CLOUD DATA
 REPRESENTATION REQUIREMENTS OF AS-IS BUILDING INFORMATION MODELS GENERATED FROM LASER SCANNED POINT CLOUD DATA Engin Burak Anil 1 *, Burcu Akinci 1, and Daniel Huber 2 1 Department of Civil and Environmental
With FARO PointSense for Revit. Jörg Braunes Platform Owner Software Chris Palmer Sales Engineer 1
 From Point Clouds to BIM Models With FARO PointSense for Revit Jörg Braunes Platform Owner Software Chris Palmer Sales Engineer 1 Agenda Scan to BIM with Revit PointClouds in Revit Advanced Workflow with
Unwrapping of Urban Surface Models
 Unwrapping of Urban Surface Models Generation of virtual city models using laser altimetry and 2D GIS Abstract In this paper we present an approach for the geometric reconstruction of urban areas. It is
Surveying Software Tools for Parametric modelling of Architectural Heritage
 Surveying Software Tools for Parametric modelling of Architectural Heritage PierreSMARS Abstract Various techniques are available to survey Historical Buildings: traditional hand measurements, digital
LiDAR & Orthophoto Data Report
 LiDAR & Orthophoto Data Report Tofino Flood Plain Mapping Data collected and prepared for: District of Tofino, BC 121 3 rd Street Tofino, BC V0R 2Z0 Eagle Mapping Ltd. #201 2071 Kingsway Ave Port Coquitlam,
Airborne Laser Survey Systems: Technology and Applications
 Abstract Airborne Laser Survey Systems: Technology and Applications Guangping HE Lambda Tech International, Inc. 2323B Blue Mound RD., Waukesha, WI-53186, USA Email: he@lambdatech.com As mapping products
3GSM GmbH. Plüddemanngasse 77 A-8010 Graz, Austria Tel Fax:
 White Paper Graz, April 2014 3GSM GmbH Plüddemanngasse 77 A-8010 Graz, Austria Tel. +43-316-464744 Fax: +43-316-464744-11 office@3gsm.at www.3gsm.at Measurement and assessment of rock and terrain surfaces
3D recording of archaeological excavation
 5 th International Conference Remote Sensing in Archaeology The Age of Sensing 13-15 October 2014 - Duke University 3D recording of archaeological excavation Stefano Campana UNIVERSITY of CAMBRIDGE Faculty
THE USE OF OPTICAL METHODS FOR LEAK TESTING DAMPERS
 DAAAM INTERNATIONAL SCIENTIFIC BOOK 2013 pp. 787-794 CHAPTER 47 THE USE OF OPTICAL METHODS FOR LEAK TESTING DAMPERS TOMASIAK, J. Abstract: The present paper presents the possible use of a portable structural
ROAD SURFACE STRUCTURE MONITORING AND ANALYSIS USING HIGH PRECISION GPS MOBILE MEASUREMENT SYSTEMS (MMS)
") ROAD SURFACE STRUCTURE MONITORING AND ANALYSIS USING HIGH PRECISION GPS MOBILE MEASUREMENT SYSTEMS (MMS) Bonifacio R. Prieto PASCO Philippines Corporation, Pasig City, 1605, Philippines Email: bonifacio_prieto@pascoph.com
ROAD SURFACE STRUCTURE MONITORING AND ANALYSIS USING HIGH PRECISION GPS MOBILE MEASUREMENT SYSTEMS (MMS) Bonifacio R. Prieto PASCO Philippines Corporation, Pasig City, 1605, Philippines Email: bonifacio_prieto@pascoph.com
HIGH-PERFORMANCE LONG-RANGE LASER SCANNER WITH CALIBRATED DIGITAL CAMERA: A HYBRID 3D LASER SENSOR SYSTEM
 HIGH-PERFORMANCE LONG-RANGE LASER SCANNER WITH CALIBRATED DIGITAL CAMERA: A HYBRID 3D LASER SENSOR SYSTEM ANDREAS ULLRICH Technical Director RIEGL Laser Measurement Systems GmbH Horn, Austria www.riegl.co.at
TcpMDT Version 7.0 Summary of Differences with Version 6.5
 Sumatra, 9 E-29190 Málaga (Spain) www.aplitop.com Tel.: +34 95 2439771 Fax: +34 95 2431371 TcpMDT Version 7.0 Summary of Differences with Version 6.5 CAD Versions supported TcpMDT 7 works with several
GABRIELE GUIDI, PHD POLITECNICO DI MILANO, ITALY VISITING SCHOLAR AT INDIANA UNIVERSITY NOV OCT D IMAGE FUSION
 GABRIELE GUIDI, PHD POLITECNICO DI MILANO, ITALY VISITING SCHOLAR AT INDIANA UNIVERSITY NOV 2017 - OCT 2018 3D IMAGE FUSION 3D IMAGE FUSION WHAT A 3D IMAGE IS? A cloud of 3D points collected from a 3D
Digital Preservation of the Aurelius Church and the Hirsau Museum Complex by Means of HDS and Photogrammetric Texture Mapping
 Master Thesis Ruxandra MOROSAN Ruxandra MOROSAN Digital Preservation of the Aurelius Church and the Hirsau Museum Complex by Means of HDS and Photogrammetric Texture Mapping Duration of the Thesis: 6 months
A NEW TOOL FOR ARCHITECTURAL PHOTOGRAMMETRY: THE 3D NAVIGATOR S. Dequal, A. Lingua, F. Rinaudo - Politecnico di Torino - ITALY
 A NEW TOOL FOR ARCHITECTURAL PHOTOGRAMMETRY: THE 3D NAVIGATOR S. Dequal, A. Lingua, F. Rinaudo - Politecnico di Torino - ITALY KEY WORDS: 3D navigation, Digital Images, LIS, Archiving, ABSTRACT People
Deformation Monitoring and Analysis of Structures Using Laser Scanners
 Deformation Monitoring and Analysis of Structures Using Laser Scanners Gethin ROBERTS and Laura HIRST, United Kingdom Keywords: deformation monitoring, laser scanner SUMMARY Laser Scanners are relatively
Leica Cyclone 5.4 Technical Specifications
 Leica Cyclone 5.4 Technical Specifications HDS Scanner control and operation Scan Scan Scan Register Model Survey Viewer Acquire and display image Acquire image at specified resolution (high, medium, low)
CE 59700: LASER SCANNING
 Digital Photogrammetry Research Group Lyles School of Civil Engineering Purdue University, USA Webpage: http://purdue.edu/ce/ Email: ahabib@purdue.edu CE 59700: LASER SCANNING 1 Contact Information Instructor:
Processing 3D Surface Data
 Processing 3D Surface Data Computer Animation and Visualisation Lecture 12 Institute for Perception, Action & Behaviour School of Informatics 3D Surfaces 1 3D surface data... where from? Iso-surfacing
FARO Scanning Plugin
 FARO Scanning Plugin for Geomagic Studio 6 service release 4, Geomagic Qualify 6 service release 2, and Geomagic Qualify 7 Document version B Copyright 2004, Raindrop Geomagic, Inc. The FARO scanner is
THE USE OF TERRESTRIAL LASER SCANNING IN THE RENOVATION OF HISTORIC BUILDINGS
 THE USE OF TERRESTRIAL LASER SCANNING IN THE RENOVATION OF HISTORIC BUILDINGS Eleftherios Tournas, Maria Tsakiri National Technical University of Athens, School of Rural and Surveying Engineering, 9, Iroon
LAS extrabytes implementation in RIEGL software WHITEPAPER
 in RIEGL software WHITEPAPER _ Author: RIEGL Laser Measurement Systems GmbH Date: May 25, 2012 Status: Release Pages: 13 All rights are reserved in the event of the grant or the registration of a utility
Processing 3D Surface Data
 Processing 3D Surface Data Computer Animation and Visualisation Lecture 15 Institute for Perception, Action & Behaviour School of Informatics 3D Surfaces 1 3D surface data... where from? Iso-surfacing
Laser scanning and CAD conversion accuracy correction of a highly curved engineering component using a precision tactile measuring system
 Laser scanning and CAD conversion accuracy correction of a highly curved engineering component using a precision tactile measuring system Athanasios Giannelis 1, Ioanna Symeonidou 2, Dimitrios Tzetzis
Displayed with permission The American Surveyor April/May Copyright 2009 Cheves Media
 NASA s Environmental Simulation Chamber A at the Johnson Space Center in Houston will require upgrades to accommodate testing of components for the new space telescopes. Laser scanning with the FARO LS
round decimals to the nearest decimal place and order negative numbers in context
 6 Numbers and the number system understand and use proportionality use the equivalence of fractions, decimals and percentages to compare proportions use understanding of place value to multiply and divide
TLS Parameters, Workflows and Field Methods
 TLS Parameters, Workflows and Field Methods Marianne Okal, UNAVCO June 20 th, 2014 How a Lidar instrument works (Recap) Transmits laser signals and measures the reflected light to create 3D point clouds.
Advanced point cloud processing
 Advanced point cloud processing George Vosselman ITC Enschede, the Netherlands INTERNATIONAL INSTITUTE FOR GEO-INFORMATION SCIENCE AND EARTH OBSERVATION Laser scanning platforms Airborne systems mounted
Geospatial database for heritage building conservation
 IOP Conf. Series: Earth and Environmental Science 18 (2014) 012087 doi:10.1088/1755-1315/18/1/012087 Geospatial database for heritage building conservation W N F W A Basir1,3, H Setan1, Z M ajid1, A Chong2
3D Terrestrial Laser Scanner Innovative Applications for 3D Documentation
 3D Terrestrial Laser Scanner Innovative Applications for 3D Documentation Rodney Chaffee Head of Sales, FARO Asia Pacific 3D Laser Scaning Market 2017 2.3 Billion $ 2012 1.3 Billion $ CAGR : > 12% Source:
TERRESTRIAL AND NUMERICAL PHOTOGRAMMETRY 1. MID -TERM EXAM Question 4
 TERRESTRIAL AND NUMERICAL PHOTOGRAMMETRY 1. MID -TERM EXAM Question 4 23 November 2001 Two-camera stations are located at the ends of a base, which are 191.46m long, measured horizontally. Photographs
A New Protocol of CSI For The Royal Canadian Mounted Police
 A New Protocol of CSI For The Royal Canadian Mounted Police I. Introduction The Royal Canadian Mounted Police started using Unmanned Aerial Vehicles to help them with their work on collision and crime
MODERN DIMENSIONAL MEASURING TECHNIQUES BASED ON OPTICAL PRINCIPLES
 MODERN DIMENSIONAL MEASURING TECHNIQUES BASED ON OPTICAL PRINCIPLES J. Reichweger 1, J. Enzendorfer 1 and E. Müller 2 1 Steyr Daimler Puch Engineering Center Steyr GmbH Schönauerstrasse 5, A-4400 Steyr,
OLERDOLA S CAVE, CATALONIA, PAST AND PRESENT: A VIRTUAL REALITY RECONSTRUCTION FROM TERRESTRIAL LASER SCANNER AND GIS DATA
 LM VC OLERDOLA S CAVE, CATALONIA, PAST AND PRESENT: A RECONSTRUCTION FROM TERRESTRIAL AND GIS DATA B. Pucci a, A. Marambio a a Virtual City Modelling Lab, Politecnical University of Catalonia, 08012 Barcelona,
ScienceDirect. The use of Optical Methods for Leak Testing Dampers
 Available online at www.sciencedirect.com ScienceDirect Procedia Engineering 69 ( 2014 ) 788 794 24th DAAAM International Symposium on Intelligent Manufacturing and Automation, 2013 The use of Optical
TCP MDT Digital Terrain Model - V7.5
 TCP MDT Digital Terrain Model - V7.5 Standard Version Introduction The Standard Version is suitable for carrying out all kinds of topographical survey projects, terrain profiles, volume calculations etc.
Advanced Highway Maintenance and Construction Technology Research Center
 Advanced Highway Maintenance and Construction Technology Research Center Department of Mechanical and Aerospace Engineering University of California at Davis Creating Standards and Specifications for the
EVOLUTION OF POINT CLOUD
 Figure 1: Left and right images of a stereo pair and the disparity map (right) showing the differences of each pixel in the right and left image. (source: https://stackoverflow.com/questions/17607312/difference-between-disparity-map-and-disparity-image-in-stereo-matching)
Artescan, 3D Scanning IPN TecBis, Edif. E Rua Pedro Nunes, Coimbra, Portugal
 1 Displacement and surface pathology monitoring of former Tejo Power Station building by combining terrestrial laser scanning, micro-geodesy, photogrammetry and GIS Adriano OLIVEIRA, João BOAVIDA, Bruno
We can use square dot paper to draw each view (top, front, and sides) of the three dimensional objects:
 of the three dimensional objects:") Unit Eight Geometry Name: 8.1 Sketching Views of Objects When a photo of an object is not available, the object may be drawn on triangular dot paper. This is called isometric paper. Isometric means equal
Unit Eight Geometry Name: 8.1 Sketching Views of Objects When a photo of an object is not available, the object may be drawn on triangular dot paper. This is called isometric paper. Isometric means equal
TLS Parameters, Workflows and Field Methods
 TLS Parameters, Workflows and Field Methods Marianne Okal, UNAVCO GSA, September 23 rd, 2016 How a Lidar instrument works (Recap) Transmits laser signals and measures the reflected light to create 3D point
PAST, PRESENT & FUTURE: Using Digital Technologies to Support Conservation. (photogrammetry vs. laser scanning)
") PAST, PRESENT & FUTURE: Using Digital Technologies to Support Conservation (photogrammetry vs. laser scanning) Dr Eujin Pei and Anthony Eland School of Design, De Montfort University Introduction Project
PAST, PRESENT & FUTURE: Using Digital Technologies to Support Conservation (photogrammetry vs. laser scanning) Dr Eujin Pei and Anthony Eland School of Design, De Montfort University Introduction Project
Robust Automatic 3D Point Cloud Registration and Object Detection
 FEATURE EXTRACTION FOR BIM Robust Automatic 3D Point Cloud Registration and Object Detection BY DAVID SELVIAH This article presents a ground-breaking approach to generating survey data for a BIM process
Multiple View Geometry
 Multiple View Geometry Martin Quinn with a lot of slides stolen from Steve Seitz and Jianbo Shi 15-463: Computational Photography Alexei Efros, CMU, Fall 2007 Our Goal The Plenoptic Function P(θ,φ,λ,t,V
NATIONWIDE POINT CLOUDS AND 3D GEO- INFORMATION: CREATION AND MAINTENANCE GEORGE VOSSELMAN
 NATIONWIDE POINT CLOUDS AND 3D GEO- INFORMATION: CREATION AND MAINTENANCE GEORGE VOSSELMAN OVERVIEW National point clouds Airborne laser scanning in the Netherlands Quality control Developments in lidar
Automatic reconstruction of old globes by photogrammetry and its accuracy
 Mátyás Gede Automatic reconstruction of old globes by photogrammetry and its accuracy Keywords: Globes, 3D reconstruction, photogrammetry, accuracy Summary: Virtual 3D model of an old globe can be created
A 3D Scanner Based Technology for Land Levelling
 A 3D Scanner Based Technology for Land Levelling Kunal Chakraborti, Rupam Ghosh Student, Dept of Civil Engineering, Modern Institute of Engineering & Technology, Bandel, Hooghly, West Bengal, India ABSTRACT:
Adaptive Point Cloud Rendering
 1 Adaptive Point Cloud Rendering Project Plan Final Group: May13-11 Christopher Jeffers Eric Jensen Joel Rausch Client: Siemens PLM Software Client Contact: Michael Carter Adviser: Simanta Mitra 4/29/13
MODELING CITY HALL S FAÇADE USING LASER SCANNING TECHNOLOGY
 Преглед НЦД 15 (2009), 59 63 Vladimir Pajić, Dušan Jovanović Miro Govedarica (Faculty of Technical Sciences, Novi Sad, Serbia) MODELING CITY HALL S FAÇADE USING LASER SCANNING TECHNOLOGY Abstract. This
Trimble Realworks Software
 TECHNICAL NOTES Trimble Realworks Software A Powerful 3D Laser Scanning Office Software Suite DESIGNED FOR TODAY S MULTIFACETED SCANNING PROFESSIONAL, TRIMBLE REALWORKS IS A POWERFUL OFFICE SOFTWARE THAT
A METHOD TO PREDICT ACCURACY OF LEAST SQUARES SURFACE MATCHING FOR AIRBORNE LASER SCANNING DATA SETS
 A METHOD TO PREDICT ACCURACY OF LEAST SQUARES SURFACE MATCHING FOR AIRBORNE LASER SCANNING DATA SETS Robert Pâquet School of Engineering, University of Newcastle Callaghan, NSW 238, Australia (rpaquet@mail.newcastle.edu.au)
Terrestrial Laser Scanning assignment
 Terrestrial Laser Scanning assignment Objective: Underground 3D survey using terrestrial laser scanning Location: Otaniemi campus, Innopoli 3 Business Area Equipment: Faro Focus 3D Methodology: Multiple
TRAINING MATERIAL HOW TO OPTIMIZE ACCURACY WITH CORRELATOR3D
 TRAINING MATERIAL WITH CORRELATOR3D Page2 Contents 1. UNDERSTANDING INPUT DATA REQUIREMENTS... 4 1.1 What is Aerial Triangulation?... 4 1.2 Recommended Flight Configuration... 4 1.3 Data Requirements for
Comparing Aerial Photogrammetry and 3D Laser Scanning Methods for Creating 3D Models of Complex Objects
 Comparing Aerial Photogrammetry and 3D Laser Scanning Methods for Creating 3D Models of Complex Objects A Bentley Systems White Paper Cyril Novel Senior Software Engineer, Bentley Systems Renaud Keriven
INVESTIGATION ON LASER SCANNERS *
 IWAA2004, CERN, Geneva, 4-7 October 2004 INVESTIGATION ON LASER SCANNERS * Brian Fuss, Catherine Le Cocq, Robert Ruland Stanford Linear Accelerator Center, Stanford, CA, USA Rudolf Staiger Essen University,
Gregory Walsh, Ph.D. San Ramon, CA January 25, 2011
 Leica ScanStation:: Calibration and QA Gregory Walsh, Ph.D. San Ramon, CA January 25, 2011 1. Summary Leica Geosystems, in creating the Leica Scanstation family of products, has designed and conducted
Comparing Aerial Photogrammetry and 3D Laser Scanning Methods for Creating 3D Models of Complex Objects
 www.bentley.com Comparing Aerial Photogrammetry and 3D Laser Scanning Methods for Creating 3D Models of Complex Objects A Bentley White Paper Cyril Novel Senior Software Engineer, Bentley Systems Renaud
RealWorks Software. A Powerful 3D Laser Scanning Office Software Suite
 TECHNICAL NOTES RealWorks Software A Powerful 3D Laser Scanning Office Software Suite Trimble RealWorks is a powerful office software that imports rich data from your 3D laser scanning instrument and transforms
APPLICATION OF DIGITAL PHOTOGRAMMETRY AND AUTOCAD TO SUPPORT OF HISTORICAL BUILDINGS
 APPLICATION OF DIGITAL PHOTOGRAMMETRY AND AUTOCAD TO SUPPORT OF HISTORICAL BUILDINGS SEYED YOUSEF SADJADI Department of Geography and Geomatics Centre for Geosciences University of Glasgow University Avenue,
Industrial 2D LASER SCANNER LMS-Q120ii
 LMS-Q120ii Preliminary Datasheet Industrial 2D LASER SCANNER LMS-Q120ii The RIEGL LMS-Q120ii 2D - laser scanner provides accurate noncontact line scanning using a narrow infrared laser beam. The instrument
Digital Softcopy Photogrammetry
 LLP Erasmus IP EPOCHE 2013 Thassos Island, Greece, 2-16 June 2013 Digital Softcopy Photogrammetry Prof. Levente DIMEN The 1 Decembrie 1918 University of Alba Iulia, Romania GENERAL CONTEXT In the last
Leica 3D Disto PROJECTOR function for stair case applications
 Leica 3D Disto PROJECTOR function for stair case applications Workflow description: Measurement Stair Design Set Out of fixing points Preparing the measurement 1 mark 1 point on each wall of the stair
Modelling. Ruth Aylett
 Modelling Ruth Aylett Overview Basic issues Modelling packages Low polygon modelling Importing models Buildings Photogrammetry Laser range finders LIDAR The great outdoors Cheap methods 3D Authoring tools
Geospatial Engineering Problems & Solutions Associated With NDP Roads, Tunnelling & Civil Engineering Projects Use of HDS Leica Laser Scanners
 Geospatial Engineering Problems & Solutions Associated With NDP Roads, Tunnelling & Civil Engineering Projects Use of HDS Leica Laser Scanners Laser Scanning Laser Scanning is a method of collecting large
Chapter 3 Image Registration. Chapter 3 Image Registration
 Chapter 3 Image Registration Distributed Algorithms for Introduction (1) Definition: Image Registration Input: 2 images of the same scene but taken from different perspectives Goal: Identify transformation
Performance Evaluation of Optech's ALTM 3100: Study on Geo-Referencing Accuracy
 Performance Evaluation of Optech's ALTM 3100: Study on Geo-Referencing Accuracy R. Valerie Ussyshkin, Brent Smith, Artur Fidera, Optech Incorporated BIOGRAPHIES Dr. R. Valerie Ussyshkin obtained a Ph.D.
3D CITY MODELLING WITH CYBERCITY-MODELER
 1 3D CITY MODELLING WITH CYBERCITY-MODELER Kilian Ulm 1 and Daniela Poli 1 1. CyberCity AG, Zurich, Switzerland, (kilian.ulm, daniela.poli)@cybercity.tv ABSTRACT 3D city models using stereo aerial-/satellite
3D Scanning 101 The Fundamentals of the Structured Light 3D Scanning Process
 3D Scanning 101 The Fundamentals of the Structured Light 3D Scanning Process 3D3 Solutions is a developer of innovative structured light 3D scanners. Based in Vancouver, Canada with more than 20 distributors
Outline of Presentation. Introduction to Overwatch Geospatial Software Feature Analyst and LIDAR Analyst Software
 Outline of Presentation Automated Feature Extraction from Terrestrial and Airborne LIDAR Presented By: Stuart Blundell Overwatch Geospatial - VLS Ops Co-Author: David W. Opitz Overwatch Geospatial - VLS
technical notes trimble realworks software
 technical notes trimble realworks software A POWERFUL 3D LASER SCANNING OFFICE SOFTWARE SUITE Designed for today s multifaceted scanning professional, Trimble RealWorks is a powerful office software that
High Definition Modeling of Calw, Badstrasse and its Google Earth Integration
 Master Thesis Yuanting LI High Definition Modeling of Calw, Badstrasse and its Google Earth Integration Duration of the Thesis: 6 months Completion: July, 2014 Supervisors: Prof.Dr.-Ing.Dieter Fritsch
3D MODELING OF CLOSE-RANGE OBJECTS: PHOTOGRAMMETRY OR LASER SCANNING?
 3D MODELING OF CLOSE-RANGE OBJECTS: PHOTOGRAMMETRY OR LASER SCANNING? F. Remondino 1 A. Guarnieri 2 A. Vettore 2 1 Institute of Geodesy and Photogrammetry ETH Hönggerberg - Zurich, Switzerland e-mail:
Computer Vision. 3D acquisition
 è Computer 3D acquisition Acknowledgement Courtesy of Prof. Luc Van Gool 3D acquisition taxonomy s image cannot currently be displayed. 3D acquisition methods Thi passive active uni-directional multi-directional
VERSATILE AND EASY-TO-USE 3D LASER SCANNERS
 VERSATILE AND EASY-TO-USE 3D LASER SCANNERS > > A WORLD OF APPLICATIONS Z Corporation, producers of the industry s fastest, easiest-to-use and most versatile 3D scanners, makes 3D scanning ideal for a
Integrated Multi-Source LiDAR and Imagery
 Figure 1: AirDaC aerial scanning system Integrated Multi-Source LiDAR and Imagery The derived benefits of LiDAR scanning in the fields of engineering, surveying, and planning are well documented. It has
Modelling. Ruth Aylett
 Modelling Ruth Aylett Overview Basic issues Modelling packages Low polygon modelling Importing models Buildings Photogrammetry Laser range finders LIDAR The great outdoors Cheap methods 3D Authoring tools
Efficient and Effective Quality Assessment of As-Is Building Information Models and 3D Laser-Scanned Data
 Efficient and Effective Quality Assessment of As-Is Building Information Models and 3D Laser-Scanned Data Pingbo Tang 1, Engin Burak Anil 2, Burcu Akinci 2, Daniel Huber 3 1 Civil and Construction Engineering
3D Models from Range Sensors. Gianpaolo Palma
 3D Models from Range Sensors Gianpaolo Palma Who Gianpaolo Palma Researcher at Visual Computing Laboratory (ISTI-CNR) Expertise: 3D scanning, Mesh Processing, Computer Graphics E-mail: gianpaolo.palma@isti.cnr.it
Realworks Software. A Powerful 3D Laser Scanning Office Software Suite
 TECHNICAL NOTES Realworks Software A Powerful 3D Laser Scanning Office Software Suite Trimble RealWorks is a powerful office software that imports rich data from your 3D laser scanning instrument and transforms
ArchiCAD 11 manual Chapter 1
 ArchiCAD 11 manual Chapter 1 1/16 ArchiCAD ArchiCAD is an architectural BIM (Building Information Modeling) CAD software for Macintosh and Windows developed by the Hungarian company Graphisoft. Development
Convergent Modeling and Reverse Engineering
 Convergent Modeling and Reverse Engineering 25 October 2017 Realize innovation. Tod Parrella NX Design Product Management Product Engineering Solutions tod.parrella@siemens.com Realize innovation. Siemens
3D Terrain Modelling of the Amyntaio Ptolemais Basin
 2nd International Workshop in Geoenvironment and 1 3D Terrain Modelling of the Amyntaio Ptolemais Basin G. Argyris, I. Kapageridis and A. Triantafyllou Department of Geotechnology and Environmental Engineering,
REFINEMENT OF COLORED MOBILE MAPPING DATA USING INTENSITY IMAGES
 REFINEMENT OF COLORED MOBILE MAPPING DATA USING INTENSITY IMAGES T. Yamakawa a, K. Fukano a,r. Onodera a, H. Masuda a, * a Dept. of Mechanical Engineering and Intelligent Systems, The University of Electro-Communications,
Structured light 3D reconstruction
 Structured light 3D reconstruction Reconstruction pipeline and industrial applications rodola@dsi.unive.it 11/05/2010 3D Reconstruction 3D reconstruction is the process of capturing the shape and appearance
3D Model - Data Transfer Guide
 Introduction 3D Model - The Leicester City model is a photogrammetric survey based 3D representation of 380ha of Leicester s Central Regeneration Area. The model is to be: Used for marketing and inward
The application of a SMARTTECH 3D scanner for the production of additional parts / industry: motorcycle accessories
 The application of a SMARTTECH 3D scanner for the production of additional parts / industry: motorcycle accessories Enduro-Tech is a company that manufactures accessories for enduro motorcycles. It was