14 Years of Object-Oriented Visualization. Bill Lorensen General Electric Corporate Research and Development
|
|
|
- Jonah Hampton
- 5 years ago
- Views:
Transcription
1 14 Years of Object-Oriented Visualization Bill Lorensen General Electric Corporate Research and Development

2 Object-Oriented Visualization
3 Outline Beginnings Object-Oriented Visualization Motivation Systems versus Toolkits
4 Outline A System: LYMB A Toolkit: VTK Lessons Learned 1998 and Beyond
5 Computing in 1984 Vax 11/780 1 mip time shared alphanumeric terminals
6 Graphics Hardware in 1984 Tektronix Storage Tubes Plotters Framebuffers Lexidata 3400 (640x512x12) Raster Technologies (640x512x24) Hardcopy 16 mm Cameras
7 Graphics Software in 1984 Tektronix Plot10 Evans and Sutherland Chart/Line drawing Proprietary, Vector refresh Movie.BYU Shaded, batch mode No such animal as a graphics API!
8 Software Methods in 1984 Peak of structured programming Beginnings of OO Simula 67 Smalltalk Lisp Machine Objective-C Few college courses and texts

9 Robot Simulation 1984


10 Marching Cubes 1984

11 GERT - GE Ray Tracer 1985


12 Siggraph 87

13 Baseball Visualization 1989

14 Stream Polygons


15 1991

16 Triangle Decimation

17 IEEE CG&A 1992

18 Swept Surfaces 1993 Removal Path Swept Surface


19 Virtual Endoscopy 1994

20 vtk vtk

21 Visualization The transformation of data into images
22 Visualization Data Transform Map Display
23 Object-Oriented Visualization Goals Reusability Portability»Operating System»Graphics API»User interface
24 Object-Oriented Visualization Goals Longevity Simplicity
25 Motivation Visualization is still evolving New techniques introduced yearly Multiple algorithms often used
26 Anatomy of a Visualization Read data Threshold points Mask points Cones Apply glyphs Display

27 Glyphs and Isosurfaces Isosurface Glyphs

28 Slicing Alpha-blended planes

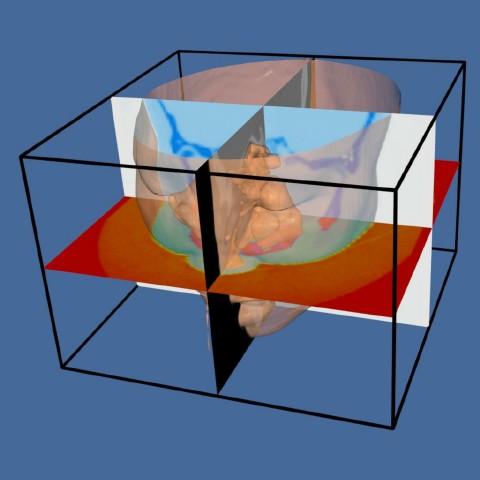
29 Volume Rendering using Alpha Planes Alpha-blended planes Isosurface

30 Data Probing Computational Grid Resampled grid

31 Texture Mapping

32 High Quality Software Rendering

33 Volume Rendering
34 Why Object-Oriented? Visualization is a complex task Easy to map application domain to implementation domain OO can deal with complexity great fit with graphics OO promotes modular systems
35 Why Object-Oriented? OO Technology is mature OO Technology is being taught in college There are several texts available OO Technology is accepted by industry
36 Systems versus Toolkits Systems Self-contained Often turn-key Great reuse Integrated user interface All or nothing
37 Systems versus Toolkits Toolkits More than a library Includes an architecture Use only what you need Independent of user interface


38 Systems Examples AVS Iris Explorer Data Explorer

39 Toolkits Examples The Visualization Toolkit Inventor ISG s IAP
40 LYMB An object-oriented system Lorensen, Yamrom, McLachlan, Barry A methodology for implementing OO concepts in C An interpreter for implementing object interaction Object interaction via run-time message passing
41 LYMB s History Started in 1984 as an animation system OSCAR - Object-oriented SCene AnimatoR Initial system had 25 classes for animation and rendering Current system has over 600 classes After a short time, we realized that we had much more than an animation system
42 LYMB Applications Decimation triangle reduction Visage scientific visualization Golf golf green and putting visualization Product Vision design for maintainability Dozens of small custom interfaces
43 OSCAR Classes System core Rendering classes message passing, argument handling parser collection, scalars, vectors actors, cameras, lights renderers Animation classes scenes, cues keyframes
44 LYMB Classes Visualization marching cubes decimation stream polygons User Interface Xlib Motif
45 LYMB Architecture script Object 1 parser msg user Object 2 Efficient (object implemented in C) Rapid application development (interpreter) Objects and users interact via uniform message passing protocol Portable C, Unix, X, Motif, Graphics Standards

46 Graphics Example (simple) ply_modeller new: bunnymodel filename=`bunny.ply ; actor new: bunny modeller=bunnymodel; renderer new: aren actors=bunny; aren render!;
47 Graphics Example (interaction) <motif_renderer.meta obj_modeller new: beet_obj filename=`beethoven.obj ; actor new: beethoven modeller=beet_obj property=brass; property new: brass diffuse_color=(.2,.8,.4) specular=.4 specular_power=30; motif_renderer new: aren actors=[actor instances?] render!; motif start!;


48 1992 LYMB Recognition
49 LYMB: The Good Simple Concepts Started Small High reuse rate Portable (Unix only) Easy to use High acceptance Uniform methodology
50 LYMB: and The Bad Complex concepts Creeping features Weak documentation Big learning curve All or nothing Proprietary
51 The Visualization Toolkit Started as an example implementation for a text book Implemented in C++ runs on Unix workstations and PC s Many concepts from LYMB similar graphics abstractions visualization pipeline more flexible data model No interpreter (initially)
52 The Visualization Toolkit 2.0 vtk1.0 Plus Volume Rendering Image Processing Includes CD-ROM Unix/PC Source code Documentation PC executable Examples
53 The Visualization Toolkit Interpreters added through automatically generated wrappers tcl java, java beans python... All documentation contained within code makes for easy man page, html, etc... generation Source code available via Internet
54 Compiled versus Interpreted Edit Compiler Development Cycle Compile Slower development Faster execution Load Run
55 Compiled versus Interpreted Interpreter Development Cycle Edit Run Faster development Slower execution
56 VTK - C++ Example vtkrenderer *aren = vtkrenderer::new(); vtkrenderwindow *renwin = vtkrenderwindow::new(); renwin->addrenderer( aren); vtkrenderwindowinteractor iren = vtkrenderwindowinteractor::new(); iren->setrenderwindow(renwin); vtkstlreader stl = vtkstlreader::new(); stl->setfilename ( cad.stl ); vtkpolydatanormals normals = vtkpolydatanormals::new(); normals->setinput (stl.getoutput ()); normals->setfeatureangle (30); vtkpolydatamapper mapper = vtkpolydatamapper::new(); mapper->setinput (normals.getoutput ()); vtkactor actor1 = vtkactor::new(0; actor1->setmapper (mapper); actor1->getproperty () ->SetColor (.8, 1,.9); aren->addactors(&actor1); renwin->render (); iren->start ();
57 VTK - Tcl Example vtkrenderer aren vtkrenderwindow renwin renwin AddRenderer aren vtkrenderwindowinteractor iren iren SetRenderWindow renwin vtkstlreader stl stl SetFileName cad.stl vtkpolydatanormals normals normals SetInput [stl.getoutput] normals SetFeatureAngle 30 vtkpolydatamapper mapper mapper SetInput [normals GetOutput] vtkactor actor1 actor1 SetMapper mapper [actor1 GetProperty] SetColor aren AddActors actor1 renwin Render iren Start
58 A System Application: LYMB parser msg lymb objects motif lib
59 A Toolkit Application: VTK tcl interpreter java vtk library C++ application C++ class libraries
60 Lessons Learned Object-oriented is good Interpreters are good if you enforce a methodology but don t invent your own Abstractions are good they protect against future changes beyond your control
61 Lessons Learned C++ is mature Isolate the user interface Keep it simple! Watch those features! Proprietary is bad!!!
62 Visualization Today The Visualization Community is no longer in control Technology drivers have changed Customers expectations are high but we do have lots of software experience OO is a proven technology We have a large installed base We know our application domain
63 External Forces Internet Wintel Standards Language Wars
64 Internet The right information, to the right person, at the right time In the future, Most applications will be Internet-ready Finance market will solve security problem But, Performance remains an issue
65 Wintel Microsoft OS s and API s dominate Intel processors dominate Scientific Visualization is a small player compared to Entertainment Word Processing What can we leverage???
66 Standards OpenGL Available on Unix and PC s Cheap accelerator boards Impacts graphics and volume rendering Java Write once, run anywhere (???) Performance
67 Language Wars Java Wars Java vs C++ Sun vs Microsoft Portability vs Performance Java3D Sun vs the world We need strategies to protect our software investment
68 Visualization 1998 and Beyond Hybrid surface / volume rendering Visualization components Even higher, richer abstractions Information visualization More abstract information Space/Time, Uncertainty Embedded Visualization Vis is just a piece of the puzzle

69 Surface and Volume Rendering


70 Tissue Lens Multi-Modality Fusion

71 Spatio-Temporal Visualization
72 User Support and Software Quality Support Mailing List Bug Tracking Nightly Releases Quality Regression Testing Cross Platform Builds Coverage Testing
73 Visualization Toolkit (VTK) Software Process Requirements Major Release User Feedback Design Defect Tracking Source Code Maturity Analysis Data Query Coverage New Quality Procedures Regression Tests Data Dependency Analysis Increased Quality Activity Source Code Style Verification Test Configuration Management Cross Platform Testing Green Belt Projects Documentation Coverage Implement Dynamic Memory Analysis Source Code Coverage Nightly Release
74 14 Years of OO Visualization Revolutionary changes in hardware Mature methodologies and languages But the drivers have changed And, systems are getting more complex, multi-disciplinary
PDF created with pdffactory trial version
 PDF created with pdffactory trial version www.pdffactory.com PDF created with pdffactory trial version www.pdffactory.com 31 3 2014 9 JOURNAL OF SHANGHAI SECOND POLYTECHNIC UNIVERSITY Vol. 31 No. 3 Sep.
The Visualization Pipeline
 The Visualization Pipeline The Visualization Pipeline 1-1 Outline Object oriented programming VTK pipeline Example 1-2 Object Oriented Programming VTK uses object oriented programming Impossible to Cover
Visualization ToolKit (VTK) Part I
 Part I") Visualization ToolKit (VTK) Part I Weiguang Guan RHPCS, ABB 131-G Email: guanw@mcmaster.ca Phone: 905-525-9140 x 22540 Outline Overview Installation Typical structure of a VTK application Visualization
Visualization ToolKit (VTK) Part I Weiguang Guan RHPCS, ABB 131-G Email: guanw@mcmaster.ca Phone: 905-525-9140 x 22540 Outline Overview Installation Typical structure of a VTK application Visualization
Visualization Systems. Ronald Peikert SciVis Visualization Systems 11-1
 Visualization Systems Ronald Peikert SciVis 2008 - Visualization Systems 11-1 Modular visualization environments Many popular visualization software are designed as socalled modular visualization environments
Computer Graphics: Introduction to the Visualisation Toolkit
 Computer Graphics: Introduction to the Visualisation Toolkit Visualisation Lecture 2 Taku Komura Institute for Perception, Action & Behaviour Taku Komura Computer Graphics & VTK 1 Last lecture... Visualisation
AUTOMATIC GRAPHIC USER INTERFACE GENERATION FOR VTK
 AUTOMATIC GRAPHIC USER INTERFACE GENERATION FOR VTK Wilfrid Lefer LIUPPA - Université de Pau B.P. 1155, 64013 Pau, France e-mail: wilfrid.lefer@univ-pau.fr ABSTRACT VTK (The Visualization Toolkit) has
VTK: The Visualiza.on Toolkit
 VTK: The Visualiza.on Toolkit Part I: Overview and Graphics Models Han- Wei Shen The Ohio State University What is VTK? An open source, freely available soiware system for 3D graphics, image processing,
CPS 533 Scientific Visualization
 CPS 533 Scientific Visualization Wensheng Shen Department of Computational Science SUNY Brockport Chapter 4: The Visualization Pipeline This chapter examines the process of data transformation and develops
Introduction to Python and VTK
 Introduction to Python and VTK Scientific Visualization, HT 2013 Lecture 2 Johan Nysjö Centre for Image analysis Swedish University of Agricultural Sciences Uppsala University 2 About me PhD student in
Introduction to Scientific Visualization
 CS53000 - Spring 2018 Introduction to Scientific Visualization Introduction to January 11, 2018 The Visualization Toolkit Open source library for Visualization Computer Graphics Imaging Written in C++
Introduction to Scientific Visualization
 Introduction to Scientific Visualization Data Sources Scientific Visualization Pipelines VTK System 1 Scientific Data Sources Common data sources: Scanning devices Computation (mathematical) processes
Visualization on TeraGrid at TACC
 Visualization on TeraGrid at TACC Drew Dolgert Cornell Center for Advanced Computing TeraGrid-Scale Visualization at Texas Advanced Computing Center Ranger: Sun cluster, 3936 nodes, 62976 cores Spur: Sun
CPS 533 Scientific Visualization
 CPS 533 Scientific Visualization Wensheng Shen Department of Computational Science SUNY Brockport Chapter 3: Computer Graphics Primer Computer graphics is the foundation of data visualization Visualization
Visualization Toolkit (VTK) An Introduction
 An Introduction") Visualization Toolkit (VTK) An Introduction An open source, freely available software system for 3D computer graphics, image processing, and visualization Implemented as a C++ class library, with interpreted
Visualization Toolkit (VTK) An Introduction An open source, freely available software system for 3D computer graphics, image processing, and visualization Implemented as a C++ class library, with interpreted
IN4307 Medical Visualisation Module IDPVI
 IN4307 Medical Visualisation Module IDPVI Dr. Charl P. Botha Week 6, 2012 1 / 38 Welcome! Visualisation in Medicine Definition in research, medicine and industry. Learning goals: Function as MedVis engineer
IN4307 Medical Visualisation Module IDPVI
 IN4307 Medical Visualisation Module IDPVI Dr. Charl P. Botha Week 6, 2012 Course Introduction.................................................................... 2 Logistics.............................................................................
Simple visualizations of unstructured grids with VTK
 Simple visualizations of unstructured grids with VTK Roman Putanowicz, Frédéric Magoulès To cite this version: Roman Putanowicz, Frédéric Magoulès. Simple visualizations of unstructured grids with VTK.
The Design and Implementation Of An Object-Oriented Toolkit For 3D Graphics And Visualization
 The esign and Implementation Of An Object-Oriented Toolkit For 3 Graphics And Visualization Abstract The Visualization Toolkit (vtk) is a freely available C++ class library for 3 graphics and visualization.
Visualization with ParaView
 Visualization with Before we begin Make sure you have 3.10.1 installed so you can follow along in the lab section http://paraview.org/paraview/resources/software.html http://www.paraview.org/ Background
C++ programing for 3D visualization 2009
 /*========================================================================= This script is written to visualize the point cloud data (PCD) generated from LiDAR system, and provide the result of voxelization
Introduction to Python and VTK
 Introduction to Python and VTK Scientific Visualization, HT 2014 Lecture 2 Johan Nysjö Centre for Image analysis Swedish University of Agricultural Sciences Uppsala University About me PhD student in Computerized
Scalar Visualization Part I. Lisa Avila Kitware, Inc.
 Scalar Visualization Part I Lisa Avila Kitware, Inc. Overview Topics covered in Part I: Color mapping Cutting Contouring Image processing Topics covered in Part II: Volume rendering Controlling the volume
CG & Vis Primer. CG & Vis Primer. CG & Vis Primer. Tutorials Applied Visualizaton Why? A few remarks
 Tutorials Applied Visualizaton Why? Summer Term 2009 Part IV - Computer Graphics and Visualization Visualization means draw an image from data Hence, we cannot visualize, if we don t know how a computer
2: Introducing image synthesis. Some orientation how did we get here? Graphics system architecture Overview of OpenGL / GLU / GLUT
 COMP27112 Computer Graphics and Image Processing 2: Introducing image synthesis Toby.Howard@manchester.ac.uk 1 Introduction In these notes we ll cover: Some orientation how did we get here? Graphics system
CHAPTER 1 Graphics Systems and Models 3
 ?????? 1 CHAPTER 1 Graphics Systems and Models 3 1.1 Applications of Computer Graphics 4 1.1.1 Display of Information............. 4 1.1.2 Design.................... 5 1.1.3 Simulation and Animation...........
Basic data representations
 Basic data representations Basic data representations 2-1 Overview This chapter will introduce you to basic data representations used for Scientific Visualization. We will discuss different grid structures
Computer Graphics CS 543 Lecture 1 (Part I) Prof Emmanuel Agu. Computer Science Dept. Worcester Polytechnic Institute (WPI)
 Prof Emmanuel Agu. Computer Science Dept. Worcester Polytechnic Institute (WPI)") Computer Graphics CS 543 Lecture 1 (Part I) Prof Emmanuel Agu Computer Science Dept. Worcester Polytechnic Institute (WPI) About This Course Computer graphics: algorithms, mathematics, data structures..
Computer Graphics CS 543 Lecture 1 (Part I) Prof Emmanuel Agu Computer Science Dept. Worcester Polytechnic Institute (WPI) About This Course Computer graphics: algorithms, mathematics, data structures..
Computer Graphics. Bing-Yu Chen National Taiwan University
 Computer Graphics Bing-Yu Chen National Taiwan University Introduction The Graphics Process Color Models Triangle Meshes The Rendering Pipeline 1 INPUT What is Computer Graphics? Definition the pictorial
Visualization Computer Graphics I Lecture 20
 15-462 Computer Graphics I Lecture 20 Visualization Height Fields and Contours Scalar Fields Volume Rendering Vector Fields [Angel Ch. 12] November 20, 2003 Doug James Carnegie Mellon University http://www.cs.cmu.edu/~djames/15-462/fall03
MMGD0206 Computer Graphics. Chapter 1 Development of Computer Graphics : History
 MMGD0206 Computer Graphics Chapter 1 Development of Computer Graphics : History What is Computer Graphics? Computer graphics generally means creation, storage and manipulation of models and images Such
Introduction to Computer Graphics. Overview. What is Computer Graphics?
 INSTITUTIONEN FÖR SYSTEMTEKNIK LULEÅ TEKNISKA UNIVERSITET Introduction to Computer Graphics David Carr Fundamentals of Computer Graphics Spring 2004 Based on Slides by E. Angel Graphics 1 L Overview What
VisKo: Supporting Declarative Visualization Requests
 BOA Meeting 2012, February 16-17 VisKo: Supporting Declarative Visualization Requests Nicholas Del Rio 1 Outline Visualization Requests and Pipelines Visualization Query Language Query Answering Query
Computer Graphics: Programming, Problem Solving, and Visual Communication
 Computer Graphics: Programming, Problem Solving, and Visual Communication Dr. Steve Cunningham Computer Science Department California State University Stanislaus Turlock, CA 95382 copyright 2002, Steve
Data analysis with ParaView CSMP Workshop 2009 Gillian Gruen
 Data analysis with ParaView 3.4.0 CSMP Workshop 2009 Gillian Gruen How to...... display a data set ( Contour, Glyph, Clip, Slice) be efficient in displaying similar data sets ( work with Lookmarks )...
Scalable and Distributed Visualization using ParaView
 Scalable and Distributed Visualization using ParaView Eric A. Wernert, Ph.D. Senior Manager & Scientist, Advanced Visualization Lab Pervasive Technology Institute, Indiana University Big Data for Science
CS GAME PROGRAMMING Question bank
 CS6006 - GAME PROGRAMMING Question bank Part A Unit I 1. List the different types of coordinate systems. 2. What is ray tracing? Mention some applications of ray tracing. 3. Discuss the stages involved
Visualization Toolkit(VTK) Atul Kumar MD MMST PhD IRCAD-Taiwan
 Atul Kumar MD MMST PhD IRCAD-Taiwan") Visualization Toolkit(VTK) Atul Kumar MD MMST PhD IRCAD-Taiwan Visualization What is visualization?: Informally, it is the transformation of data or information into pictures.(scientific, Data, Information)
Visualization Toolkit(VTK) Atul Kumar MD MMST PhD IRCAD-Taiwan Visualization What is visualization?: Informally, it is the transformation of data or information into pictures.(scientific, Data, Information)
Systems Architecture for Visualisation
 Systems Architecture for Visualisation Visualisation Lecture 4 Taku Komura Institute for Perception, Action & Behaviour School of Informatics Taku Komura Systems Architecture 1 Last lecture... Basics of
Development of Computer Graphics
 1951 Whirlwind, Jay Forrester (MIT) CRT displays mid 1950s SAGE air defense system command & control CRT, light pens late 1950s Computer Art, James Whitney Sr. Visual Feedback loops 1962 Sketchpad, Ivan
National Chiao Tung Univ, Taiwan By: I-Chen Lin, Assistant Professor
 Computer Graphics 1. Graphics Systems National Chiao Tung Univ, Taiwan By: I-Chen Lin, Assistant Professor Textbook: Hearn and Baker, Computer Graphics, 3rd Ed., Prentice Hall Ref: E.Angel, Interactive
Rapid Application Prototyping Environment. Currently 920+ Standard modules in the MeVisLab SDK core, modules delivered in total
 1 MeVisLab MIP Prototyping 2 MeVisLab http://www.mevislab.de/ In more than 20 years of development, MeVisLab has become one of the most powerful development platforms for medical image computing research.
Visual HTML5. Human Information Interaction for Knowledge Extraction, Interaction, Utilization, Decision making HI-I-KEIUD
 Visual HTML5 1 Overview HTML5 Building apps with HTML5 Visual HTML5 Canvas SVG Scalable Vector Graphics WebGL 2D + 3D libraries 2 HTML5 HTML5 to Mobile + Cloud = Java to desktop computing: cross-platform
Grafica Computazionale: Lezione 30. Grafica Computazionale. Hiding complexity... ;) Introduction to OpenGL. lezione30 Introduction to OpenGL
 Introduction to OpenGL. lezione30 Introduction to OpenGL") Grafica Computazionale: Lezione 30 Grafica Computazionale lezione30 Introduction to OpenGL Informatica e Automazione, "Roma Tre" May 20, 2010 OpenGL Shading Language Introduction to OpenGL OpenGL (Open
Grafica Computazionale: Lezione 30 Grafica Computazionale lezione30 Introduction to OpenGL Informatica e Automazione, "Roma Tre" May 20, 2010 OpenGL Shading Language Introduction to OpenGL OpenGL (Open
Principles of Computer Game Design and Implementation. Lecture 3
 Principles of Computer Game Design and Implementation Lecture 3 We already knew Introduction to this module History of video High-level information for a game (such as Game platform, player motivation,
Dave Shreiner, ARM March 2009
 4 th Annual Dave Shreiner, ARM March 2009 Copyright Khronos Group, 2009 - Page 1 Motivation - What s OpenGL ES, and what can it do for me? Overview - Lingo decoder - Overview of the OpenGL ES Pipeline
Development of Computer Graphics. mid 1950s SAGE air defense system command & control CRT, light pens
 1951 Whirlwind, Jay Forrester (MIT) CRT displays mid 1950s SAGE air defense system command & control CRT, light pens late 1950s Computer Art, James Whitney Sr. Visual Feedback loops 1962 Sketchpad, Ivan
Dancing Proteins: 3-D Visualization of Protein Structure and Dynamics on Next-Generation Graphics Hardware
 Dancing Proteins: 3-D Visualization of Protein Structure and Dynamics on Next-Generation Graphics Hardware John E. Stone Beckman Institute University of Illinois Overview Intro to biomolecular visualization
Graphics Hardware and Display Devices
 Graphics Hardware and Display Devices CSE328 Lectures Graphics/Visualization Hardware Many graphics/visualization algorithms can be implemented efficiently and inexpensively in hardware Facilitates interactive
Scalar Visualization
 Scalar Visualization Visualizing scalar data Popular scalar visualization techniques Color mapping Contouring Height plots outline Recap of Chap 4: Visualization Pipeline 1. Data Importing 2. Data Filtering
Adding Advanced Shader Features and Handling Fragmentation
 Copyright Khronos Group, 2010 - Page 1 Adding Advanced Shader Features and Handling Fragmentation How to enable your application on a wide range of devices Imagination Technologies Copyright Khronos Group,
OpenGL SUPERBIBLE. Fifth Edition. Comprehensive Tutorial and Reference. Richard S. Wright, Jr. Nicholas Haemel Graham Sellers Benjamin Lipchak
 OpenGL SUPERBIBLE Fifth Edition Comprehensive Tutorial and Reference Richard S. Wright, Jr. Nicholas Haemel Graham Sellers Benjamin Lipchak AAddison-Wesley Upper Saddle River, NJ Boston Indianapolis San
Introduction to Visualization on Stampede
 Introduction to Visualization on Stampede Aaron Birkland Cornell CAC With contributions from TACC visualization training materials Parallel Computing on Stampede June 11, 2013 From data to Insight Data
Visualization. Images are used to aid in understanding of data. Height Fields and Contours Scalar Fields Volume Rendering Vector Fields [chapter 26]
![Visualization. Images are used to aid in understanding of data. Height Fields and Contours Scalar Fields Volume Rendering Vector Fields [chapter 26]](/thumbs/74/70771954.jpg "Visualization. Images are used to aid in understanding of data. Height Fields and Contours Scalar Fields Volume Rendering Vector Fields [chapter 26]") Visualization Images are used to aid in understanding of data Height Fields and Contours Scalar Fields Volume Rendering Vector Fields [chapter 26] Tumor SCI, Utah Scientific Visualization Visualize large
Visualization Images are used to aid in understanding of data Height Fields and Contours Scalar Fields Volume Rendering Vector Fields [chapter 26] Tumor SCI, Utah Scientific Visualization Visualize large
Using VTK and the OpenGL Graphics Libraries on HPCx
 Using VTK and the OpenGL Graphics Libraries on HPCx Jeremy Nowell EPCC The University of Edinburgh Edinburgh EH9 3JZ Scotland, UK April 29, 2005 Abstract Some of the graphics libraries and visualisation
Volume Rendering. Computer Animation and Visualisation Lecture 9. Taku Komura. Institute for Perception, Action & Behaviour School of Informatics
 Volume Rendering Computer Animation and Visualisation Lecture 9 Taku Komura Institute for Perception, Action & Behaviour School of Informatics Volume Rendering 1 Volume Data Usually, a data uniformly distributed
Hot Chips Bringing Workstation Graphics Performance to a Desktop Near You. S3 Incorporated August 18-20, 1996
 Hot Chips 1996 Bringing Workstation Graphics Performance to a Desktop Near You S3 Incorporated August 18-20, 1996 Agenda ViRGE/VX Marketing Slide! Overview of ViRGE/VX accelerator features 3D rendering
WWW home page:
 alexander.pletzer@noaa.gov, WWW home page: http://ncvtk.sf.net/ 1 Ncvtk: A program for visualizing planetary data Alexander Pletzer 1,4, Remik Ziemlinski 2,4, and Jared Cohen 3,4 1 RS Information Systems
Introduction to VTK and Python. Filip Malmberg Uppsala universitet
 Introduction to VTK and Python Filip Malmberg filip@cb.uu.se IT Uppsala universitet Todays lecture Introduction to the Visualization Toolkit (VTK) Some words about the assignments Introduction to Python
Current Trends in Computer Graphics Hardware
 Current Trends in Computer Graphics Hardware Dirk Reiners University of Louisiana Lafayette, LA Quick Introduction Assistant Professor in Computer Science at University of Louisiana, Lafayette (since 2006)
Last Time. Why are Shadows Important? Today. Graphics Pipeline. Clipping. Rasterization. Why are Shadows Important?
 Last Time Modeling Transformations Illumination (Shading) Real-Time Shadows Viewing Transformation (Perspective / Orthographic) Clipping Projection (to Screen Space) Graphics Pipeline Clipping Rasterization
EXPLORER, A VISUALIZATION SYSTEM FOR RESERVOIR SIMULATIONS
 INTERNATIONAL JOURNAL OF NUMERICAL ANALYSIS AND MODELING Volume 2, Supp, Pages 169 176 c 2005 Institute for Scientific Computing and Information EXPLORER, A VISUALIZATION SYSTEM FOR RESERVOIR SIMULATIONS
Representing Graphical Data
 Representing Graphical Data Chapman & Chapman, chapters 3,4,5 Richardson 1 Graphics in IT82 What does computer graphics cover? IT82 Input, output, and representation of graphical data Creation of graphics
Books: 1) Computer Graphics, Principles & Practice, Second Edition in C JamesD. Foley, Andriesvan Dam, StevenK. Feiner, John F.
 Computer Graphics, Principles & Practice, Second Edition in C JamesD. Foley, Andriesvan Dam, StevenK. Feiner, John F.") Computer Graphics Books: 1) Computer Graphics, Principles & Practice, Second Edition in C JamesD. Foley, Andriesvan Dam, StevenK. Feiner, John F. Huges 2) Schaim s Outline Computer Graphics Roy A. Plastock,
Computer Graphics Books: 1) Computer Graphics, Principles & Practice, Second Edition in C JamesD. Foley, Andriesvan Dam, StevenK. Feiner, John F. Huges 2) Schaim s Outline Computer Graphics Roy A. Plastock,
GLOBAL EDITION. Interactive Computer Graphics. A Top-Down Approach with WebGL SEVENTH EDITION. Edward Angel Dave Shreiner
 GLOBAL EDITION Interactive Computer Graphics A Top-Down Approach with WebGL SEVENTH EDITION Edward Angel Dave Shreiner This page is intentionally left blank. Interactive Computer Graphics with WebGL, Global
11/1/13. Visualization. Scientific Visualization. Types of Data. Height Field. Contour Curves. Meshes
 CSCI 420 Computer Graphics Lecture 26 Visualization Height Fields and Contours Scalar Fields Volume Rendering Vector Fields [Angel Ch. 2.11] Jernej Barbic University of Southern California Scientific Visualization
Visualization. CSCI 420 Computer Graphics Lecture 26
 CSCI 420 Computer Graphics Lecture 26 Visualization Height Fields and Contours Scalar Fields Volume Rendering Vector Fields [Angel Ch. 11] Jernej Barbic University of Southern California 1 Scientific Visualization
For Intuition about Scene Lighting. Today. Limitations of Planar Shadows. Cast Shadows on Planar Surfaces. Shadow/View Duality.
 Last Time Modeling Transformations Illumination (Shading) Real-Time Shadows Viewing Transformation (Perspective / Orthographic) Clipping Projection (to Screen Space) Graphics Pipeline Clipping Rasterization
User Interface Software Projects
 User Interface Software Projects Assoc. Professor Donald J. Patterson INF 134 Winter 2013 The author of this work license copyright to it according to the Creative Commons Attribution-Noncommercial-Share
Drawing Fast The Graphics Pipeline
 Drawing Fast The Graphics Pipeline CS559 Fall 2015 Lecture 9 October 1, 2015 What I was going to say last time How are the ideas we ve learned about implemented in hardware so they are fast. Important:
Next Generation OpenGL Neil Trevett Khronos President NVIDIA VP Mobile Copyright Khronos Group Page 1
 Next Generation OpenGL Neil Trevett Khronos President NVIDIA VP Mobile Ecosystem @neilt3d Copyright Khronos Group 2015 - Page 1 Copyright Khronos Group 2015 - Page 2 Khronos Connects Software to Silicon
INTRODUCTION. Computer Graphics
 INTRODUCTION Computer Graphics 1 INTRODUCTION: THE OUTLINE I. Image Processing / Computer Graphics II. Advantages III. Representative Uses IV. Classification of Applications V. History VI. Conceptual Framework
gltf 2.0: Status and Outlook
 gltf 2.0: Status and Outlook 31st July 2018 by Norbert Nopper (nopper@ux3d.io, @McNopper) Content Status (15 minutes) Outlook (35 minutes) Questions & Answers (10 minutes) Status gltf 2.0 What we currently
Computer Science 175. Introduction to Computer Graphics lib175 time: m/w 2:30-4:00 pm place:md g125 section times: tba
 Computer Science 175 Introduction to Computer Graphics www.fas.harvard.edu/ lib175 time: m/w 2:30-4:00 pm place:md g125 section times: tba Instructor: Steven shlomo Gortler www.cs.harvard.edu/ sjg sjg@cs.harvard.edu
graphics pipeline computer graphics graphics pipeline 2009 fabio pellacini 1
 graphics pipeline computer graphics graphics pipeline 2009 fabio pellacini 1 graphics pipeline sequence of operations to generate an image using object-order processing primitives processed one-at-a-time
Graphics in IT82. Representing Graphical Data. Graphics in IT82. Lectures Overview. Representing Graphical Data. Logical / Physical Representation
 Graphics in IT82 What does computer graphics cover? Representing Graphical Data Chapman & Chapman, chapters 3,4,5 Richardson IT82 Input, output, and representation of graphical data Creation of graphics
graphics pipeline computer graphics graphics pipeline 2009 fabio pellacini 1
 graphics pipeline computer graphics graphics pipeline 2009 fabio pellacini 1 graphics pipeline sequence of operations to generate an image using object-order processing primitives processed one-at-a-time
Next-Generation Graphics on Larrabee. Tim Foley Intel Corp
 Next-Generation Graphics on Larrabee Tim Foley Intel Corp Motivation The killer app for GPGPU is graphics We ve seen Abstract models for parallel programming How those models map efficiently to Larrabee
Java FX 2.0. Dr. Stefan Schneider Oracle Deutschland Walldorf-Baden
 Java FX 2.0 Dr. Stefan Schneider Oracle Deutschland Walldorf-Baden Keywords: JavaFX, Rich, GUI, Road map. Introduction This presentation gives an introduction into JavaFX. It introduces the key features
Volume visualization. Volume visualization. Volume visualization methods. Sources of volume visualization. Sources of volume visualization
 Volume visualization Volume visualization Volumes are special cases of scalar data: regular 3D grids of scalars, typically interpreted as density values. Each data value is assumed to describe a cubic
Introduction. What s New in This Edition
 Introduction Welcome to the fourth edition of the OpenGL SuperBible. For more than ten years, we have striven to provide the world s best introduction to not only OpenGL, but 3D graphics programming in
Scalar Algorithms -- surfaces
 Scalar Algorithms -- surfaces Color Mapping Slicing Clipping Contouring / iso-surface 1 Sources of Scalar Data Sensors CT/MRI Surface Scanners: laser/range scans Simulations CFD/FEM Mathematical Implicit
Cornell CS4620 Fall 2011!Lecture Kavita Bala (with previous instructors James/Marschner) Cornell CS4620 Fall 2011!Lecture 1.
 Cornell CS4620 Fall 2011!Lecture 1.") Computer graphics: The study of creating, manipulating, and using visual images in the computer. CS4620/5620: Introduction to Computer Graphics Professor: Kavita Bala 1 2 4 6 Or, to paraphrase Ken Perlin...
Computer graphics: The study of creating, manipulating, and using visual images in the computer. CS4620/5620: Introduction to Computer Graphics Professor: Kavita Bala 1 2 4 6 Or, to paraphrase Ken Perlin...
I expect to interact in class with the students, so I expect students to be engaged. (no laptops, smartphones,...) (fig)
 (fig)") Computer Science 175 Introduction to Computer Graphics www.fas.harvard.edu/ lib175 time: m/w 2:30-4:00 pm place:md g125 section times: tba Instructor: Steven shlomo Gortler www.cs.harvard.edu/ sjg sjg@cs.harvard.edu
Computer Science 175 Introduction to Computer Graphics www.fas.harvard.edu/ lib175 time: m/w 2:30-4:00 pm place:md g125 section times: tba Instructor: Steven shlomo Gortler www.cs.harvard.edu/ sjg sjg@cs.harvard.edu
Drawing Fast The Graphics Pipeline
 Drawing Fast The Graphics Pipeline CS559 Spring 2016 Lecture 10 February 25, 2016 1. Put a 3D primitive in the World Modeling Get triangles 2. Figure out what color it should be Do ligh/ng 3. Position
Animation & Rendering
 7M836 Animation & Rendering Introduction, color, raster graphics, modeling, transformations Arjan Kok, Kees Huizing, Huub van de Wetering h.v.d.wetering@tue.nl 1 Purpose Understand 3D computer graphics
Automated JAVA GUI Testing. Challenges and Experiences
 Automated JAVA GUI Testing Challenges and Experiences Java Forum Stuttgart 2008 About me Reginald Stadlbauer Co-founder and CEO of froglogic GmbH, Hamburg, Germany Former Senior
Mention driver developers in the room. Because of time this will be fairly high level, feel free to come talk to us afterwards
 1 Introduce Mark, Michael Poll: Who is a software developer or works for a software company? Who s in management? Who knows what the OpenGL ARB standards body is? Mention driver developers in the room.
<Insert Picture Here> JavaFX 2.0
 1 JavaFX 2.0 Dr. Stefan Schneider Chief Technologist ISV Engineering The following is intended to outline our general product direction. It is intended for information purposes only,
Visualization Computer Graphics I Lecture 20
 15-462 Computer Graphics I Lecture 20 Visualization Height Fields and Contours Scalar Fields Volume Rendering Vector Fields [Angel Ch. 12] April 15, 2003 Frank Pfenning Carnegie Mellon University http://www.cs.cmu.edu/~fp/courses/graphics/
Height Fields and Contours Scalar Fields Volume Rendering Vector Fields [Angel Ch. 12] April 23, 2002 Frank Pfenning Carnegie Mellon University
![Height Fields and Contours Scalar Fields Volume Rendering Vector Fields [Angel Ch. 12] April 23, 2002 Frank Pfenning Carnegie Mellon University](/thumbs/90/102611276.jpg "Height Fields and Contours Scalar Fields Volume Rendering Vector Fields [Angel Ch. 12] April 23, 2002 Frank Pfenning Carnegie Mellon University") 15-462 Computer Graphics I Lecture 21 Visualization Height Fields and Contours Scalar Fields Volume Rendering Vector Fields [Angel Ch. 12] April 23, 2002 Frank Pfenning Carnegie Mellon University http://www.cs.cmu.edu/~fp/courses/graphics/
15-462 Computer Graphics I Lecture 21 Visualization Height Fields and Contours Scalar Fields Volume Rendering Vector Fields [Angel Ch. 12] April 23, 2002 Frank Pfenning Carnegie Mellon University http://www.cs.cmu.edu/~fp/courses/graphics/
Last Time. Reading for Today: Graphics Pipeline. Clipping. Rasterization
 Last Time Modeling Transformations Illumination (Shading) Real-Time Shadows Viewing Transformation (Perspective / Orthographic) Clipping Projection (to Screen Space) Scan Conversion (Rasterization) Visibility
Survey in Computer Graphics Computer Graphics and Visualization
 Example of a Marble Ball Where did this image come from? Fall 2010 What hardware/software/algorithms did we need to produce it? 2 A Basic Graphics System History of Computer Graphics 1200-2008 Input devices
Computer Graphics Introduction. Taku Komura
 Computer Graphics Introduction Taku Komura What s this course all about? We will cover Graphics programming and algorithms Graphics data structures Applied geometry, modeling and rendering Not covering
Interactive Computer Graphics A TOP-DOWN APPROACH WITH SHADER-BASED OPENGL
 International Edition Interactive Computer Graphics A TOP-DOWN APPROACH WITH SHADER-BASED OPENGL Sixth Edition Edward Angel Dave Shreiner Interactive Computer Graphics: A Top-Down Approach with Shader-Based
CS130 : Computer Graphics Lecture 2: Graphics Pipeline. Tamar Shinar Computer Science & Engineering UC Riverside
 CS130 : Computer Graphics Lecture 2: Graphics Pipeline Tamar Shinar Computer Science & Engineering UC Riverside Raster Devices and Images Raster Devices - raster displays show images as a rectangular array
Computer Graphics (CS 543) Lecture 1 (Part 1): Introduction to Computer Graphics
 Lecture 1 (Part 1): Introduction to Computer Graphics") Computer Graphics (CS 543) Lecture 1 (Part 1): Introduction to Computer Graphics Prof Emmanuel Agu Computer Science Dept. Worcester Polytechnic Institute (WPI) What is Computer Graphics (CG)? Computer
Computer Graphics (CS 543) Lecture 1 (Part 1): Introduction to Computer Graphics Prof Emmanuel Agu Computer Science Dept. Worcester Polytechnic Institute (WPI) What is Computer Graphics (CG)? Computer
Drawing Fast The Graphics Pipeline
 Drawing Fast The Graphics Pipeline CS559 Fall 2016 Lectures 10 & 11 October 10th & 12th, 2016 1. Put a 3D primitive in the World Modeling 2. Figure out what color it should be 3. Position relative to the
PRISM Project for Integrated Earth System Modelling An Infrastructure Project for Climate Research in Europe funded by the European Commission
 PRISM Project for Integrated Earth System Modelling An Infrastructure Project for Climate Research in Europe funded by the European Commission under Contract EVR1-CT2001-40012 The VTK_Mapper Application
Parallel Programming on Larrabee. Tim Foley Intel Corp
 Parallel Programming on Larrabee Tim Foley Intel Corp Motivation This morning we talked about abstractions A mental model for GPU architectures Parallel programming models Particular tools and APIs This
Real-Time Rendering (Echtzeitgraphik) Michael Wimmer
 Michael Wimmer") Real-Time Rendering (Echtzeitgraphik) Michael Wimmer wimmer@cg.tuwien.ac.at Walking down the graphics pipeline Application Geometry Rasterizer What for? Understanding the rendering pipeline is the key
Real-Time Rendering (Echtzeitgraphik) Michael Wimmer wimmer@cg.tuwien.ac.at Walking down the graphics pipeline Application Geometry Rasterizer What for? Understanding the rendering pipeline is the key