DAD: DISTRIBUTIVE ANALYSIS / ANALYSE DISTRIBUTIVE
|
|
|
- Suzan Cannon
- 5 years ago
- Views:
Transcription

1 DAD: DISTRIBUTIVE ANALYSIS / ANALYSE DISTRIBUTIVE USER S MANUAL Jean-Yves Duclos Abdelrm Araar Carl Fortn : jyves@ecn.ulaval.ca : aabd@ecn.ulaval.ca : cfortn@ecn.ulaval.ca Unversté Laval
2 Introducton DAD was desgned to facltate the analyss and the comparsons of socal welfare, nequalty, poverty and equty across dstrbutons of lvng standards. Its features nclude the estmaton of a large number of ndces and curves that are useful for dstrbutve comparsons as well as the provson of asymptotc standard errors to enable statstcal nference. The features also nclude basc descrptve statstcs and provde smple nonparametrc estmatons of densty functons and regressons. The man facltes of DAD are the: - Estmaton of ndces of: - Poverty (Watts, CHU, FGT, S-Gn. Sen): normalsed and un-normalsed (or absolute and relatve poverty ndces), wth absolute and relatve poverty lnes - Socal Welfare (Atnson, S-Gn, Atnson-Gn) - Inequalty (S-Gn, Atson, Entropy, Atnson-Gn and others) - Redstrbuton, progressvty, vertcal equty, reranng and horzontal nequty. - Decomposton of: - Poverty across populaton subgroups 3- Inequalty across populaton subgroups or by factor components (e.g., by type of consumpton expendtures or source of ncome) 4- Progressvty and equty across dfferent taxes and/or tranfers and subsdes 5- Poverty changes across growth and redstrbuton effects. 6- Checs for the robustness of dstrbutve comparsons. 7- Estmaton of stochastc domnance curves of the prmal and dual types, for poverty, socal welfare, nequalty and equty domnance. 8- Robustness of decompostons nto populaton subgroups and factor components. 9- Estmaton of popular dual curves: ordnary and generalsed Lorenz curves, Cumulatve Poverty Gap curves, quantle curves, normalsed quantle curves, poverty gap curves, ordnary and generalsed concentraton curves. 0- Estmaton of popular prmal curves: cumulatve dstrbuton functons, poverty defct curves, poverty depth curves, etc - Estmaton of dfferences n curves and ndces. - Estmaton of crtcal poverty lnes for absolute and relatve poverty comparsons. 3- Estmaton of crossng ponts for dual curves. 4- Provson of asymptotc standard devatons on all estmates of ndces, ponts on curves, crtcal poverty lnes, crossng ponts, etc, allowng for dependence or ndependence n the samples beng compared. These standard devatons are currently computed under the assumpton of dentcally and ndependently dstrbuted sample observatons, but the computatons tae nto account the randomness of the samplng weghts when such weghts are provded by the user. 5- Allowance for samplng errors n the poverty lnes specfed to compute absolute and relatve poverty ndces.
3 DAD s envronment s user-frendly and uses menus to select the varables and optons needed for all applcatons. The software can load smultaneously two data bases, can carry out applcatons wth only one data base or two, and can allow for dependence or ndependence of data bases and vectors of lvng standards n computng standard errors on dfferences n ndces and curves. The databases can be bult wth the software or can be loaded from a hard ds or a floppy or CD-ROM drver. The databases can be edted, new observatons can be added, and new vectors of data can be generated usng arthmetcal or logcal operators. Features of verson 4.3 of DAD Standard devatons, confdence ntervals and hypothess DAD4.3 can now compute confdence ntervals and perform statstcal tests usng standard or pvotal bootstrap approaches for some of the dstrbutve ndces programmed n DAD. Ths can serve as alternatves to the longavalable asymptotc standard devatons n DAD. Graph optons The possblty of savng graphs n the DAD Graph Format (*.dgf) that one can load and update. The possblty of deletng a selected curves New applcatons Poverty Bounded Income and Overload Indces These ndces shed lght on dstrbutons of lvng standards usng the sze and the ncomes of dfferent economc groups, such as: The poor Those vulnerable to poverty The mddle class The rchness Inequalty The Share Rato Decomposton The decomposton of the S-Gn ndex by sources (Natural or Shapley approach). The decomposton of the S-Gn ndex by populaton groups (Natural or Shapley approach). Curves The Relatve Deprvaton Curve 3

4 Installaton and requred equpment DAD s conceved to run on operatng systems Wndows NT, Wndows000 and Wndows XP. A PC of 300MHz or more s also requred. The steps for nstallaton of ths software are as follows: - Insert the CD-ROM that contans the DAD nstallaton fle and clc on the con "jnstall". The followng wndow appears: Clc on the button "contnue" and specfy the nstallaton drectory. At the end of the procedure of nstallaton, you can run ths software le any other program by clcng on the button "Start" and selectng the tem "Program Dstrbutve Analyss DAD4.3" 4

5 Databases n DAD4.3 A database used n DAD s a set of vectors of data. Each vector represents a specfc varable. By default, the length of each vector determnes the number of observatons for that varable. Each database contans a set of vectors whose number of observatons must be the same. Constructng a database wth DAD After openng DAD, the followng wndow appears: A C D B E F G A Man menu; B - Toolbar; C The selected cell; D - Value of the selected cell; E - Name of column; F - Index of observaton; G - The selected fle.

6 To construct a new database wth DAD, follow these steps:. In the man menu, clc on the command "Fle" and select the opton "New Fle". A wndow ass the user to ndcate the desred number of observatons for the new fle:. Enter the number of observatons of the new fle and clc on the button OK. To begn edtng the new vectors, follow these steps: 3. Clc on the cell (vector #, ndex=). The contour of ths cell changes to yellow. 4. Wrte the new value of the cell. As a general rule wth DAD, the decmal part should be separated by a dot (.). 5. Press "Enter. 6. Wrte the value of the next cell and repeat the procedure untl all of values of vector # are regstered. 7. To edt another vector, select the frst cell of ths vector and repeat steps 3 up to 6. If you want to modfy the value of any one cell, follow these steps:. Select the cell subject to be modfed by clcng on t.. Wrte the new value of the cell. 3. Press "Enter". Loadng an ASCII data base To load an ASCII data fle, clc on the command "Fle", select the command "Open". The followng wndow appears, asng for some nformaton concernng the data fle.
7 Remar: f your ASCII fle s extenson s not.txt,.dat, or.prn, choose *.* n the opton Type of Fle, then ndcate the fle name. After choosng the desred ASCII fle and clcng on OK, the followng wndow appears.
8 These wndows contan many optons that facltate the loadng of an ASCII fle. By default the delmter (the character that separates varables) s a space, but you can specfy other delmters. You can also specfy the delmter wth the opton Other. In the Panel Other Informaton, you can ndcate the followng nformaton: - By default, the opton Treat consecutve delmters as one s selected. Choosng ths opton maes t such that several succeedng delmters are treated as one. - By default, the opton Frst row ncludes names of varables s not selected. In ths example, the ASCII fle s frst row ncludes the names of varables; we thus select the opton. 3- Clcng on the button Advanced maes the followng wndows appear:

9 We do not by default need to specfy what the separator of decmals s, but f we ndcate that t s a dot, then we may specfy that the separator between the varables can be a comma. Remar: If the delmter of columns s a comma, the delmter of decmals cannot also be a comma. By selectng the opton Drop frst spaces, we do not tae nto account spaces whch precede the values of the frst column. We can also ndcate the number of lnes n the ASCII fle to be treated, as well as the number of mssng or not-convertble values to be edted. The panel Prevew results shows the number of observatons and the number of columns n the ASCII fle. The panel Data Prevew dsplays nstantaneously the data as ther readng changes accordng to selected optons. Ths a useful tool for relable loadng of ASCII data fles. Note n the panel Prevew Results the message Button Warnng. If we clc on the button, the followng wndow appears :

10 In the panel Choose one opton there are three optons to treat mssng or not convertble values. In our example, we would just ndcate that the frst row ncludes the names of varables. Hence, we clc on the button cancel and we ndcate ths.

11 After selectng the opton Frst row ncludes names of varables, the button Compact replaces the button Warnng. Ths button ndcates that all values n the three columns are acceptable to DAD. At ths stage, you can clc on the button ENTER to fnalze the loadng of the data. Remar: after loadng the ASCII fle we can save ths fle wth the DAD ASCII format *.daf. Loadng a second ASCII database As already mentoned, for many applcatons n DAD we can use smultaneously two databases. To actvate a second database, the user should load another fle. To actvate a second database, follow these steps:. Actvate the second fle by clcng on the button Fle.. The procedures to follow after ths are dentcal to those presented for loadng the frst ASCII fle. Remar: The actve fle n the software DAD s the selected fle.
, select the fle, and clc on the Button Open.")
12 Loadng a DAD ASCII format fle Wth DAD, you can also save and load fles n DAD s specfc format and wth the extenson *.daf. To open a.daf fle, clc on the command "Fle" and select the command "Open". The followng wndow appears, asng for some nformaton concernng the data fle. After ths, select the fle type DAD fle (*.daf), select the fle, and clc on the Button Open. Loadng a DAD fle Wth DAD, you can also save and load fles n DAD s specfc format and wth the extenson *.dad. To open a.dad fle, clc on the command "Fle" and select the command "Open". The followng wndow appears, asng for some nformaton concernng the data fle.
. The procedure s smple.")
13 After ths, select the fle type DAD fle (*.dad), select the fle, and clc on the Button Open. Remar: DAD fles contan two sheets, such as Fle and Fle, wth every sheet contanng one database. It s possble that one of the two sheets be empty. Savng a fle You can save an actve fle n DAD s fle format (*.daf or *.dad). The procedure s smple. Begn wth the command "Fle" and select the tem "Save". The next wndow ass for the name and the drectory where you would le to save the fle: After specfyng your choce for the name and drectory, clc on "Save" to save the actve fle. Close a fle To close the actve fle, clc on "Fle" and then select "Close". Ext the software To ext the software, clc on "Fle" and then select "Ext".
14 The next wndow appears for the specfcaton of the type of operaton that you wsh to apply: A B C D - Choose the type of operaton you need to carry out by clcng on the con "A". 3- Select the vectors to be used to generate the new vector by clcng on the cons " B" and "C". 4- If a number s used to generate the new vector, wrte ts value after "Number". By default, ths number s set to Select the vector of results by clcng on the con "D". Denote vector by S() and vector by S(). The followng table then presents the type of operatons avalable and ther results. Type of operaton Results Seres + Seres S() + S() Seres - Seres S() - S() Seres * Seres S() * S() Seres / Seres S() / S() Seres + Number S() + Number Seres - Number S() - Number Seres * Number S() * Number Seres / Number S() / Number Exp (Seres ) Exp(S()) Log (Seres ) Log(S()) Seres = Seres :f S() = S(), otherwse 0 Seres = Number :f S() = S(), otherwse 0 Seres Seres :f S() S(), otherwse 0 Seres Number :f S() S(), otherwse 0 Seres Seres :f S() S(), otherwse 0 Seres Number :f S() S(), otherwse 0
15 6- Fnally, clc on the button "Executon" to generate the new vector. Copy, paste and clear commands You can select some cells wth your mouse and use the commands copy, paste, and clear to edt your database. GetOBS and SetOBS commands To obtan the number of observatons of your actve fle, choose the command GetOBS. If you would le to set a new number of observatons, choose the command SetOBS. The followng wndow appears: After ths, enter the new number of observatons and clc on the button OK. The frst SetOBS observatons wll now be used for the computatons. Changng the names of spreadsheet To change the name of the spreadsheet, from the man menu, select the tem Edt Change current sheet name and ndcate the new name. Dmenson of the spreadsheet The length of the spreadsheet vares accordng to the followng: By default, the length of the spreadsheet s observatons. Ths s done when a new fle s created. If you download an ASCII fle, the length of spreadsheet corresponds to the number of observatons read from ths fle. In all cases, you can specfy explctly a desred length for the spreadsheet by ndcatng the new length after choosng the command Edt and the tem Enter the new length of the spreadsheet 3
16 The new length of the spreadsheet cannot be below the number of observatons OBS. The number of columns fxes the wdth of the spreadsheet. By default the number of columns s 6. 4

17 Modfyng the database DAD offers the possblty to modfy the dmenson of a database and also to generate a new vector of data usng logcal or arthmetc operators. Changng the names of vectors To change the names of vectors, clc on the button "Edt" and then select the tem "Change column name". The followng wndows appears: You can nsert the new name of a vector and clc on the button OK to confrm the change. Generatng new vectors You may need to generate a new vector n the actve database. The followng steps descrbe the necessary procedures for ths: - In the man menu, choose the command "Edt" and select the tem "Edton of columns".
18 The next wndow appears for the specfcaton of the type of operaton that you wsh to apply: A B C D - Choose the type of operaton you need to carry out by clcng on the con "A". 3- Select the vectors to be used to generate the new vector by clcng on the cons " B" and "C". 4- If a number s used to generate the new vector, wrte ts value after "Number". By default, ths number s set to Select the vector of results by clcng on the con "D". Denote vector by S() and vector by S(). The followng table then presents the type of operatons avalable and ther results. Type of operaton Results Seres + Seres S() + S() Seres - Seres S() - S() Seres * Seres S() * S() Seres / Seres S() / S() Seres + Number S() + Number Seres - Number S() - Number Seres * Number S() * Number Seres / Number S() / Number Exp (Seres ) Exp(S()) Log (Seres ) Log(S()) Seres = Seres :f S() = S(), otherwse 0 Seres = Number :f S() = S(), otherwse 0 Seres Seres :f S() S(), otherwse 0 Seres Number :f S() S(), otherwse 0 Seres Seres :f S() S(), otherwse 0 Seres Number :f S() S(), otherwse 0
19 6- Fnally, clc on the button "Executon" to generate the new vector. Copy, paste and clear commands You can select some cells wth your mouse and use the commands copy, paste, and clear to edt your database. GetOBS and SetOBS commands To obtan the number of observatons of your actve fle, choose the command GetOBS. If you would le to set a new number of observatons, choose the command SetOBS. The followng wndow appears: After ths, enter the new number of observatons and clc on the button OK. The frst SetOBS observatons wll now be used for the computatons. Changng the names of spreadsheet To change the name of the spreadsheet, from the man menu, select the tem Edt Change current sheet name and ndcate the new name. Dmenson of the spreadsheet The length of the spreadsheet vares accordng to the followng: By default, the length of the spreadsheet s observatons. Ths s done when a new fle s created. If you download an ASCII fle, the length of spreadsheet corresponds to the number of observatons read from ths fle. In all cases, you can specfy explctly a desred length for the spreadsheet by ndcatng the new length after choosng the command Edt and the tem Enter the new length of the spreadsheet 3
20 The new length of the spreadsheet cannot be below the number of observatons OBS. The number of columns fxes the wdth of the spreadsheet. By default the number of columns s 6. 4

21 Introducton to applcatons Applcatons n DAD Remember that DAD can actvate one or two databases. Once a database s actvated, the user can then call dfferent applcatons of DAD. Before you reach those applcatons, however, you must ndcate how many databases are to be used n the applcaton, and whch ones. Ths s done through the followng wndow: Each database represents one dstrbuton. Generally, you should ndcate the followng nformaton: - The number of dstrbutons - The name of the fle representng the frst dstrbuton. 3- The name of the fle representng the second dstrbuton. 4- When two dstrbutons are to be used, you should ndcate f the two dstrbutons represent dependent or ndependent samples for the accurate computaton of standard errors that use nformaton on the jont dstrbuton. Confrm your choce by clcng on the button "OK". Once the choce s confrmed, you can reach the desred applcaton. Remar: If the number of dstrbutons s one, the actvated fle s automatcally the fle specfed on the st lne.

22 A C B F E D A: Man menu B: The name of the applcaton and the name of the fle used C: Set of varables and parameters to be chosen as: Choce of varable of nterest. Choce of sze varable. Choce of group varable. Choce of group number. D: Opton to compute wth or wthout standard devaton. E: Parameters to be specfed. F: Set of Commands for ths applcaton. You can to specfy a weghtng vector n order to weght your observatons. Also, optons shown n C allow you to compute an estmate for one specfc group (or sub-sample) or sub-vector. The followng example llustrates those dfferent optons.
23 Example j Suppose that you wsh to compute the mean of a varable y, wth y, denotng the th observaton household- of a person j. We call the vector to be used the "Varable of Interest". The followng table dsplays the observatons of y for a sample of ten households. The vector of sw ("Samplng Weght varable") s the samplng weght to be appled to these observatons and s s the sze of observaton -household-. We can also assgn to each of these observatons a code c that ndcates the subgroup of the populaton to whch the th observaton belongs. For example, code may ndcate that households lve n town "V" and code that they lve n town "V": Observaton y c sw Varable of Group Samplng Sze nterest Varable Weght Varable varable The user then has sx possbltes for computng the mean, as shown n the followng table: s The mean Varable of Interest Sze Varable Group Varable Index of group For the 0 households Wthout sze For the 0 households Wth sze 3 For households lvng n town V Wthout sze 4 For households lvng n town V Wth sze 5 For households lvng n town V Wthout sze 6 For households lvng n town V Wth sze y y y y y y Wthout Sze No selecton (*) s No selecton (*) Wthout c Sze s c Wthout c Sze s c 3
24 - (*): Ths choce does not affect the results snce no group varable has been selected. - Consult the Samplng desgn secton to now how can we ntalse the samplng weght. 3- Fnally, to compute the standard devaton on the estmate of the mean, you just need to select the opton of computng wth STD. 4
25 Basc Notaton n DAD In ths followng table, we present the basc notatons used n the user manual of DAD. Symbol Indcaton y the varable of nterest. y the value of the varable of nterest for observaton sw the Samplng Weght. sw the Samplng Weght for observaton. s the sze varable. the sze of observaton (for example the sze of household ). s w sw * s c the group varable. c the group of observaton. A group value (an nteger). w =w f c =, and w =0 otherwse. w Example: The mean of group, µ (), s then estmated as: n = µ ( ) = n = w w y
26 Tang nto account samplng desgn n DAD Samplng Desgn and DAD Wth verson 4. and hgher of DAD, the Samplng Desgn (SD) of the database can be specfed n order to calculate the correct asymptotc samplng dstrbuton of the varous ndces and statstcs provded by DAD. Data from sample surveys usually dsplay four mportant characterstcs: - they come wth samplng weghts (SW), also called nverse probablty weghts; - they are stratfed; 3- they are clustered; 4- sample observatons provde aggregate nformaton (such as household expendtures) on a numberof statstcal unts (such as ndvduals) Fgure shows a graphcal SD representaton for the case of Smple Random Samplng (SRS), n whch t s supposed that sample observatons are drectly and randomly selected from a base of samplng unts (SUs) (e.g., the lst of all households wthn n a country). Fgure : Smple Random Samplng Populaton SU SU SU 3 SU 4 SU 5 SU 6 SU 7 SU 8 SU 9 SU 0 Sample observatons (e.g., households), or selected sample unts Unts wthn SU 4 Unts wthn sample observaton 4 (e.g., all ndvduals n household 4) Random Selecton Sample observatons Complete Selecton
27 SRS s rarely used to generate household surveys. Hence, most SD encountered n practce wll not loo le that n Fgure. Most SD wll loo nstead le that of Fgure. A country s frst dvded nto geographcal or admnstratve zones and areas, called strata. Each zone or area thus represents a strata n Fgure. The frst random selecton taes place wthn the Prmary Samplng Unts (denoted as PSU s) of each stratum. Wthn each stratum, a number of PSU s are randomly selected. Ths random selecton of PSU s provdes clusters of nformaton. PSU s are often provnces, departments, vllages, etc Wthn each PSU, there may then be other levels of random selecton. For nstance, wthn each provnce, a number of vllages may be randomly selected, and wthn every selected vllage, a number of households may be randomly selected. The fnal sample observatons consttute the Last Samplng Unts (LSU s). Each sample observaton may then provde aggregate nformaton (such as household expendtures) on all ndvduals or agents found wthn that LSU. These ndvduals or agents are not selected nformaton on all on them appears n the sample. They therefore do not represent the LSUs n statstcal termnology. Fgure : Samplng Desgn wth two levels of random selecton Strata Strata Strata Strata 3 I PSU(,) PSU(,) PSU(3,) PSU(3,) PSU(,) PSU(,) Prmary Samplng Unts PSU(,j) for stata II LSU,, LSU,, LSU,, LSU,, LSU 3,, LSU 3,, LSU 3,, LSU 3,, LSU,, LSU,, Last Samplng Unts (LSU) for each PSU Sub-Unts Sub-Unts wthn each LSU Random Selecton Stratfcaton Complete Selecton
28 Impact of SD on the samplng error of DAD s estmators a) Impact of stratfcaton Generally speang, a varable of nterest, such as household ncome, tends to be less varable wthn strata than across the entre populaton. Ths s because households wthn the same stratum typcally share to a greater extent than n the entre populaton some soco-economc characterstcs, such as geographcal locatons, clmatc condtons, and demographc characterstcs,and that these characterstcs are determnants of the lvng standards of these households. Stratfcaton ensures that a certan number of observatons are selected from each of a certan number of strata. Hence, t helps generate sample nformaton from a dversty of soco-economc areas. Because nformaton from a broader spectrum of the populaton leads on average to more precse estmates, stratfcaton generally decreases the samplng varance of estmators. For nstance, suppose at the extreme that household ncome s the same for all households n a stratum, and ths, for all strata. In ths case, supposng also that the populaton sze of each stratum s nown, t s suffcent to draw one household from each stratum to now exactly the dstrbuton of ncome n the populaton. b) Impact of clusterng (or mult-stage samplng) Mult-stage samplng mples observatons end up n a sample only subsequently to a process of multple selecton. Groups of observatons are frst randomly selected wthn a populaton (whch may be stratfed); ths s followed by further samplng wthn the selected groups, whch may be followed by yet another process of random selecton wthn the subgroups selected n the prevous stage. The frst selecton stage taes place at the level of PSU s, and generates what are often called clusters. Generally, varables of nterest (such as lvng standards) vary less wthn a cluster than between clusters. Hence, mult-stage selecton reduces the dversty of nformaton generated by samplng. The mpact of clusterng sample observatons s therefore to tend to decrease the precson of populatons estmators, and thus to ncrease ther samplng varance. Ceters parbus, the lower the varablty of a varable of nterest wthn clusters, the larger the loss of nformaton that there s n samplng further wthn the same clusters. To see ths, suppose for nstance an extreme case n whch household ncome happens to be the same for all households n a cluster, and ths, for all clusters. In such cases, t s clearly wasteful to adopt mult-stage samplng: t would be suffcent to draw one household from each cluster n order to now the dstrbuton of ncome wthn that cluster. It would be more nformatve to draw randomly other clusters. Samplng Desgn n DAD By default, when a data fle s loaded n DAD, the type of SD assgned to the data s the SRS presented n Fgure. Once the data are loaded, the exact SD structure can nevertheless be easly specfed. Up to 5 vectors can help specfy that structure: Table : Descrpton of vectors used n DAD to specfy the SD 3
29 Vectors Strata PSU LSU SW FPC Descrpton Specfes the name of the varable (nteger type) that contans stratum dentfers Specfes the name of the varable (nteger type) that contans dentfers for the Prmary Samplng Unts Specfes the name of the varable (nteger type) that contans dentfers for the Last Samplng Unts Specfes the name of the varable for the Samplng Weghts. Samplng weghts are the nverse of the samplng rate. Roughly speang, they equal the number of observatons n the underlyng populaton that are represented by each sample observaton. Specfes the name of the varable for the Fnte Populaton Correcton factor. Wth FPC, DAD derves an ndcator f h for each observaton h, whch s then used to compute SD-corrected samplng errors. If the varable FCP s not specfed, f_h=0 for all observatons; When the varable specfed has values <=, t s drectly nterpreted as a stratum samplng rate f_h =n_h/n_h, where n_h = number of PSUs sampled from the strata to whch h belongs and N_h = total number of PSUs n the populaton belongng to stratum h. When the varable specfed has values greater than or equal to n_h, t s nterpreted as representng N_h; f_h s then set to n_h/n_h. The followng table contans an example of vectors used to specfy the type of SD shown n Fgure. Table : Example of SD. OBS Strata PSU LSU SW SUM Omttng SW wll systematcally bas both the estmators of the values of ndces and ponts on curves as well as the estmaton of the samplng varance of those estmators. Consder for nstance the estmaton of total populaton ncome from the data shown n table. 4 households appear n strata, but the populaton number of households n that strata s sx tmes as large (that 4
30 s, 4), and ths s captured by the SW varable. Total populaton ncome for strata would therefore be estmated to be sx tmes that of total sample ncome for strata. Table 3: Example of SD. OBS Strata LSU SW N_h SUM The FPC factor accounts for the reducton n samplng varance that occurs when a sample s drawn wthout replacement from a fnte populaton (as compared to samplng wth replacement). Accordng to table 3, the four LSU s of strata were selected wthout replacement from a populaton of 4 LSU s. These fuor LSU s are then necessarly dstnct by desgn. If samplng had been done wth replacement, then multple observatons of the same populaton LSU s could have been generated. Because samplng wthout replacement guarantees that sample observatons represent dfferent samplng unts, t therefore generates greater samplng nformaton and leads to smaller samplng varances than wth samplng wth replacement. For strata of Table 3, data from four dstnct LSU s (or PSU s) out of 4 are necessarly generated after samplng. The f h factor for that strata s then 4/4= Important Remar: We can ntalse and use the FPC correcton just when the SD s based on one stage of random selecton of LSU s. In ths case PSU s and LSU s are equvalent. To ntalze the SD after loadng the database, select from the man menu the tem Edt->Set Sample Desgn. The followng wndow then appears. 5

31 Ths allows DAD to tae nto account a wde varety of possble SD. Ths s made by selectng (or not selectng) vectors for any of the fve choces offered above. In the case of SRS wthn a number of strata, there would be an ndcator of a strata vector wthout any ndcaton of a vector of PSU s. The followng table presents some of these combnatons. Strata PSU LSU SW FPC Indcaton SD s SRS wthout samplng weghts X X SD s stratfed wth SW X X X No stratfcaton, but mult-stage samplng and SW X X Random (one-stage) samplng of LSU s wth LSUspecfc selecton probabltes. Ths can occur for nstance f, once an ndvdual s selected, all ndvduals n hs household are also automatcally selected. Implctly, then, t s the household that s selected as a LSU X X X Stratfcaton wth only the frst samplng stage specfed by the user X X Stratfcaton wth one-stage samplng and samplng weghts (wrongly?) omtted X X X Stratfcaton wth one-stage samplng and samplng weghts (wrongly?) omtted X X X Stratfcaton wth mult-stage samplng and samplng weghts (wrongly?) omtted X X X X Stratfcaton wth mult-stage samplng and samplng weghts provded X X X X X Stratfcaton wth mult-stage samplng and samplng weghts provded. The fnte populaton correcton factor s also provded; ths supposes that samplng for the statstcal nferences X: Indcate that the varable s selected Note that when DAD fnds the values of the strata-psu-lsu varables to be the same across observatons, t supposes that these observatons comefrom just one LSU. 6
 strata, PSU s and LSU s. There should be more than one PSU wthn each stratum. e.g.")
32 If the opton Auto-compute FPC s actvated, DAD generates mplctly the FPC vector. Remars: After ntalzaton of the SD nformaton, the dataset s automatcally ordered by (when specfed) strata, PSU s and LSU s. There should be more than one PSU wthn each stratum. e.g.:) before ntalzaton of the SD ) after ntalzaton of the SD: data s ordered accordng to strata, PSU and LSU 7

33 To show the SD nformaton, select from man menu the tem Edt->Summarze Sample Desgn. The followng wndow appears. 8
34 Computaton of standard errors n DAD Ths secton shows how the standard errors of DAD s estmators of dstrbutve ndces and curves are computed. The methodology s based on the asymptotc samplng dstrbuton of such ndces and curves. All of DAD s estmators are asymptotcally normally dstrbuted around ther true populaton value. As wll be dscussed below, we expect ths methodology to provde a good approxmaton to the true samplng dstrbuton of DAD s estmators for relatve large samples. Estmators of the dstrbutve ndces Estmators of dstrbutve ndces (such as poverty and nequalty ndces) tae the followng general form: θˆ = g( αˆ, αˆ, αˆ K ) wth α asymptotcally expressble as α m = y, j j= where θ can be expressed as a contnuous functon g of the α s, m s the number of sample observatons and y,j s usually some transform of the lvng standard of ndvdual or household j. We use Rao s (973) lnearzaton approach to derve the standard error of these dstrbutve ndces. Ths approach says that the samplng varance θˆ equals the varance of a lnear approxmaton of θˆ : θ θ θ Var(ˆ) θ = Var (ˆ α α + αˆ α + + αˆ ) ( ) ( K αk ) α α α K In matrx format, the varance of θˆ s gven by Var ( θ ˆ ) = Var(V MV ) wth M the covarance matrx of the αˆ and V the gradent of θ : V = θ α θ α θ α K Rao,C.R. (973). Lnear Statstcal Inference and Its Applcaton. New Yor: Wley.
35 θ θ The gradent elements,, can be estmated consstently usng estmates α α θˆ θˆ,, of the true dervatves. The covarance matrx s defned as αˆ αˆ M = Var( α Cov( α Cov( α K ), α, α ) ) Cov( α Var( α Cov( α K, α ), α ) ) Cov( α Cov( α Var( α, α, α K ) K K ) ) The elements of the covarance matrx are agan estmated consstently usng the sample data, replacng for nstance Var (ˆ α ) by Vˆ ar( α ˆ ). It s at the level of the estmaton of these covarance elements that the full samplng desgn structure s taen nto account. Fnte-sample propertes of asymptotc results It may be nstructve to compare the results of the above asymptotc approach to those of a numercal smulaton approach le the bootstrap. The bootstrap (BTS) s a method for estmatng the samplng dstrbuton of an estmator whch proceeds by re-samplng repettvely one s data. For each smulated sample, one recalculates the value of ths estmator and then uses that BTS dstrbuton to carry out statstcal nference. In fnte samples, nether the asymptotc nor the BTS samplng dstrbuton s necessarly superor to the other. In nfnte samples, they are usually equvalent. Bootstrap and smple random samplng The followng steps the BTS approach for a sample drawn usng Smple Random Samplng: - Draw wth replacement m observatons from the ntal sample. - Compute the dstrbutve estmator from ths new generated sample. 3- Repeat the frst two steps N tmes. 4- Compute the varance or the BTS dstrbutons usng these N generated estmators. Bootstrap and complex samplng desgn The steps here are smlar to those above wth Smple Random Samplng. Only the frst step dffers to tae nto account the precse way n whch the orgnal sample was drawn. Suppose for example that: The data were drawn from two strata, wth m observatons n stratum and m observatons n stratum. Observatons n every stratum were selected randomly wth equal probabltes
36 The frst step wll then consst n selectng randomly and wth the same probablty m observatons from stratum and (ndependently) m observatons from stratum. Aggregatng these two sub samples wll yeld the new generated sample. Repeatng ths N tmes wll generate the BTS samplng dstrbuton. Illustratons The followng table presents the samplng desgn nformaton of a hypothetcal sample of 800 observatons. Samplng Desgn Informaton Number of observatons 800 Sum of weghts Number of strata strata n the Samplng Desgn CODE STRATA PSU LSU OBS P(strata) FPC (f_h) , , Total The followng tables present estmates of the standard errors of some dstrbutve ndces usng asymptotc theory (DAD) and the BTS procedure. Atnson Index (ε =0.5) = 0,0939 W Strata Psu Lsu Sze =psu St.err. DAD St.err. BTS r 0, , r r 0, , r r 0, , r r r 0, , r r r r 0, , FGT ( α =; z=3000) = W Strata Psu Lsu Sze =psu St.err. DAD St.err. BTS r 30, ,30686 r r 9, , r r 34, , r r r 3, , r r r r 40, , Lorenz (p=0.5) =0,63764 W Strata Psu Lsu Sze =psu St.err. DAD St.err. BTS r 0, , r r 0, , r r 0, , r r r 0, , r r r r 0, ,
37 Gn ( ρ =) = 0, W Strata Psu Lsu Sze =psu St.err. DAD St.err. BTS r 0, , r r 0, , r r 0, , r r r 0, , r r r r 0, , Notes: W r Samplng weght Samplng-desgn feature s used 4
38 Standard devaton, confdence ntervals and hypothess testng Startng wth verson 4.3 of DAD, one can, for some of the applcatons, compute confdence ntervals and perform statstcal tests by usng standard or pvotal bootstrap approaches. To see how, actvate the followng dalogue box (from the applcaton frame) by clcng on the button S.D. STD After choosng the desred optons, clc on the button Confrm to confrm your choce. Optons: A) Samplng Desgn opton; One can choose between two categores of samplng desgn: ) A broad and general one, actvated through The full samplng desgn. ) A smple one, actvated through Smple random samplng. For more nformaton concernng ths, see the secton Tang nto account samplng desgn n DAD B) Approaches to estmatng the samplng varablty of DAD s estmates; DAD generally supports two approaches: ) The asymptotc approach (for many of the applcatons) ) The bootstrap approach. (for some of the applcatons) C) Bootstrap optons; We can choose between two types of bootstrap optons and the number of bootstrap replcatons: ) standard ) and pvotal D) Confdence Level; Here, we can choose the: ) Confdence level (by default 95%) of our confdence ntervals ) and whether the confdence ntervals: should be Tw o Sded or be Lower Bounded or Upper Bounded.
39 E) Hypothess testng; We can carry out hypothess testng by checng the box Do test and by nsertng the approprate values for the hypothess test procedure:. Asymptotc approach Usng the law of large numbers and the central lmt theorem, t s possble to show that most of DAD s estmators ( ˆµ, say) of some dstrbutve value µ are consstent and asymptotcally normally dstrbuted, wth a samplng varance gven by we can generally estmate t consstently by asymptotcally, we can wrte that s ˆµ. s ˆµ s almost always unnown, but ŝ ˆ µ and ths s typcally provded by DAD. Then, ˆµ Nµ,ŝ ( ˆµ ) whch also mples that: ˆµ-µ N(0,) ŝ ˆµ Hypothess testng and statstcal decsons The decson to reject or not some null hypothess depends on the sgnfcance level a of the test. Let m be the value that ˆµ taes n a partcular sample (the estmate of µ ). The rejecton rule can be descrbed as follows: Case a: a symmetrc test Reject H:µ=µ 0 0 n favor of H:µ µ 0 f and only f : µ<m- 0 sˆµ ˆz-a/ or µ>m- 0 s ˆµ ˆza/ Ths s because we have that P µ+ sˆµ ˆz >µ ˆ or µ>µ ˆ + sˆµ ˆz =a 0 a/ 0 -a/. Note that ths s equvalent to: z<z 0 a/ or z>z 0 -a/ where z 0=(m-µ 0)/ŝ ˆµ Case b: testng an upper-bound null hypothess Reject H:µ 0 µ 0 n favour of H:µ>µ 0 f and only f : µ<m-ŝ ˆµ z, whch s equvalent to z >z 0 -a 0 -a Case c: testng a lower-bound null hypothess test: Reject H:µ 0 µ 0 n favour of H:µ<µ 0 f and only f : µ>m-ŝ ˆµ z z<z 0 a 0 a The followng table summarzes the confdence ntervals and p-values correspondng to each of the three cases of the above hypothess tests:
40 Case Confdencenterval p Value Type a [m-sˆ z,m-ˆ z ] µ ˆ -a/ s µ ˆ a/ [-F( z 0 )] Two sded b [m-dˆ µ z -a,+ ] -F(z 0) Lower-bounded confdence nterval c [, m-dˆ z] µ a F(z 0) Upper-bounded confdence nterval. Standard bootstrap approach Let the vector V regroup the ordered sample values of the estmator µ computed from B smulated or bootstrap samples, each drawn from the same ntal sample. In the bootstrap approach, the vector V s the man tool to capture the dstrbuton of the estmator µ. The number of replcatons B should be chosen so that a(b+) s an nteger andb (-a)/a α -quntle of the vector V. Once the sgnfcance level of the test s chosen, the rejecton rule becomes: a RejectH : µ=µ vs H :µ µ f :µ >µ or µ <µ α/ 0 α/ α α b RejectH : µ µ vs H :µ<µ f :µ >µ c Reject H : µ µ vs H :µ>µ f :µ <µ. Let * µ α be the The followng table summarzes the confdence ntervals and p-values accordng to the standard bootstrap approach: Case Confdencenterval p Value Type B B * * a [µ,µ ] mn( I(µ * µ ), I(µ * µ ))/B Two sded a/ -a/ 0 0 = = B * * a + 0 = b [µ, ] I(µ µ)/b Lower-bounded confdence nterval c B * * -a 0 = [, µ ] I(µ µ)/b Upper-bounded confd ence nterval 3. Pvotal bootstrap approach Let the vector V be defned as such that: V={t,t,, t} * * * B µ-µ t= ŝ * * * 3
41 * ŝ Where µ µ and are respectvely the average of the bootstrap *, and the standard devaton of the ŝ estmator estmated from the bootstrap sample wth estmate *. The rejecton rule s then: a-rejecth : µ=µ n favour of H:µ µ f:µ <m- t or µ>µ- ˆ t * * sˆµ ˆ -a/ 0 sˆµ ˆ a/ * ŝ ˆµ -a * ŝ ˆµ a b-rejecth : µ µ n favour of H:µ>µ f:µ <m- t c-rejecth : µ µ n favour of H:µ<µ f:µ >m- t The followng table summarzes the confdence ntervals and p-values accordng to the pvotal bootstrap approach: Case Confdencenterval p Value Type B B * * * * µ -a/ sˆ µ a/ 0 0 = = a [ µ -sˆ t, µ - t ] *mn( I(t t), I(t t))/b Two sded B * * µ -a 0 = b [ µ -ŝ t, + ] I(t t)/b Lower-bounded confdence nterval B * * µ a t0 = c [,µ -ŝ t] I(t )/B Upper-bounded confdence nterval 4
42 Inequalty y s the lvng standard of observaton. We assume that the n observatons have been ordered n ncreasng values of y, such that y y,,..., + = n. The varable c ndcates the group to whch observaton belongs. The samplng weghts are defned as: w = w f c =. w = 0 f c. where represents the ndex of a populaton subgroup. The Atnson ndex Denote the Atnson ndex of nequalty for the group by I (; ε ). It can be expressed as follows: I(; e) µ () ξ(; ε) = µ () where The Atnson ndex of socal welfare s as follows: n w y = µ () = n w =? (;e) = n w = n w = ( y Exp n w = e ) n w = ε f ε and ln( y ) e = ε 0 Case : One dstrbuton If you wsh to compute the Atnson ndex of nequalty for only one dstrbuton, follow these steps: - From the man menu, choose "Inequalty Atnson ndex". - In the confguraton of the applcaton, choose dstrbuton.
43 3- After confrmng the confguraton, the applcaton appears. Choose the dfferent vectors and values of parameters as follows: Indcaton Varables or parameters Choce s: Varable of nterest y Sze varable s Optonal Group Varable c Optonal Group Number Optonal epslon ε Among the buttons, you fnd the followng commands: "Compute : to compute the Atnson ndex. If you also want the standard devaton of ths ndex, choose the opton for computng wth a standard devaton. "Graph : to draw the value of the ndex accordng to the parameter ε. If you want to specfy a range for the horzontal axs, choose the tem " Graph Management Change range of x " from the man menu. Case : Two dstrbutons To compute the Atnson ndex of two dstrbutons: - From the man menu, choose the tem: "Inequalty Atnson ndex". - In the confguraton of applcaton, choose dstrbutons. 3- Choose the dfferent vectors and parameter values as follows: Indcaton Vectors or parameters Choce s: Varable of nterest y Sze varable Group Varable c Group Number epslon Dstrbuton Dstrbuton y s s c ε ε Optonal Optonal Optonal
44 Among the buttons, you fnd the command «Compute». To compute the standard devaton of ths ndex, choose the opton for computng wth standard devaton. S-Gn ndex Denotng the S-Gn ndex of nequalty for the group by I (; ρ ), and the S-Gn socal welfare ndex by ξ ( ; ρ ), we have: µ () ξ(; ρ) I(; ρ ) = µ () where and Case : One dstrbuton n ξ(; ρ) = = (V ) n ρ ρ + ) ρ (V [ V ] V = w h To compute the S-Gn ndex of nequalty for only one dstrbuton: - From the man menu, choose the tem: "Inequalty S-Gn ndex". - In the confguraton of the applcaton, choose dstrbuton. 3- After confrmng the confguraton, the applcaton appears. Choose the dfferent vectors and values of parameters as follows: h= y Indcaton Varables or parameters Choce s: Varable of nterest y Sze varable s Optonal Group Varable c Optonal Group Number Optonal rho ρ Two choces of commands appear among the buttons: Compute : to compute the S-Gn ndex. To compute the standard devaton of ths ndex, choose the opton for computng wth standard devaton. Graph : to draw the value of the ndex accordng to the parameter ρ. To specfy such a range for the horzontal axs, choose the tem " Graph Management Change range of x " from the man menu. 3
45 Case : Two dstrbutons To reach the S-Gn applcaton wth two dstrbutons: - From the man menu, choose the tem: "Inequalty S-Gn ndex". - In the confguraton of applcaton, choose dstrbutons. 3- Choose the dfferent vectors and parameter values as follows: Indcaton Vectors or parameters Choce s: Varable of nterest y Sze varable Group Varable c Group Number rho Dstrbuton Dstrbuton y s s c ρ ρ Optonal Optonal Optonal Among the buttons, you wll fnd the command «Compute». To compute the standard devaton of ths ndex, choose the opton for computng wth standard devaton. The Atnson-Gn ndex Denotng the Atnson-Gn ndex of nequalty for the group by I(; ε, ρ), and the S- Gn socal welfare ndex by ξ ( ; ε, ρ), we have: where µ () ξ(; ε, ρ) I(; ε, ρ) = µ () and n ρ ρ (V ) (V ε + ) ε (y ρ ) = (V ) ξ(; ε, ρ) = n ρ ρ (V ) (V+ ) Exp ln( y ) ρ = (V) ε, ε 0 ε = and and ρ ρ n V = w h h= 4
46 Case : One dstrbuton To compute ths ndex of nequalty for only one dstrbuton: - From the man menu, choose the tem: "Inequalty Atnson-Gn ndex". - In the confguraton of the applcaton, choose dstrbuton. 3- After confrmng the confguraton, the applcaton appears. Choose the dfferent vectors and parameter values as follows: Indcaton Varables or parameters Choce s: Varable of nterest y Sze varable s Optonal Group Varable c Optonal Group Number Optonal epslon ε rho ρ Among the buttons you wll fnd the command "Compute", whch computes the Atnson-Gn ndex. To compute the standard devaton of ths ndex, choose the opton for computng wth standard devaton. Case : Two dstrbutons To reach the Atnson-Gn applcaton wth two dstrbutons: - From the man menu, choose the tem: "Inequalty Atnson-Gn". - In the confguraton of applcaton, choose dstrbutons. 3- Choose the dfferent vectors and parameter values as follows: Indcaton Vectors or parameters Choce s: Varable of nterest y Sze varable Group Varable c Group Number rho epslon Dstrbuton Dstrbuton y s s c ρ ρ ε ε Optonal Optonal Optonal 5
47 Among the buttons you wll fnd the command «Compute». To compute the standard devaton of ths ndex, choose the opton for computng wth standard devaton. 6
48 The Generalsed Entropy ndex of nequalty The Generalsed Entropy Index of nequalty for the group s as follows: I ( ; θ) θ = n w = n w = ( θ ) n = w w w y µ () w y µ () µ () log y y log µ () θ f f f θ 0, θ = 0 θ = Case : One dstrbuton To compute the Generalsed Entropy ndex of nequalty for only one dstrbuton: - From the man menu, choose the tem: "Inequalty Entropy ndex". - In the confguraton of the applcaton, choose dstrbuton. 3- After confrmng the confguraton, the applcaton appears. Choose the dfferent vectors and parameter values as follows: Indcaton Varables or Choce s: parameters Varable of nterest y Sze varable s Optonal Group Varable c Optonal Group Number Optonal theta θ Among the buttons., you fnd the followng choces: "Compute : computes the Generalsed Entropy ndex. To compute the standard devaton of ths ndex, choose the opton for computng wth the standard devaton. "Graph : to draw the value of ndex accordng to the parameter θ. To specfy a range for the horzontal axs, choose the tem " Graph Ma nagement Change range of x " from the man menu. 7
49 Case : Two dstrbutons To calculate the Generalsed Entropy ndex for two dstrbutons: - From the man menu, choose the tem: "Inequalty Entropy ndex". - In the confguraton of applcaton, choose dstrbutons. 3- Choose the dfferent vectors and parameter values as follows: Indcaton Vectors or parameters Choce s: Varable of nterest y Sze varable Group Varable c Group Number theta Dstrbuton Dstrbuton y w w c θ θ Optonal Optonal Optonal Among the buttons, you wll fnd the command «Compute». To compute the standard devaton of ths ndex, choose the opton for computng wth standard devaton. The Quantle Rato and the Interquantle Rato Index Denote the Quantle Rato for group by QR(; p,p ); t can be expressed as follows: Q(, p) QR(; p,p ) = Q(, p ) where Q(,p) denote the p-quantle of group. The Interquantle Rato IQR(; p, p ) s defned as: Q(,p) Q(,p) IQR(; p, p ) = µ Remar: The nstructons for the Interquantle Rato are smlar to those for the Quantle Rato. Case : One dstrbuton If you wsh to compute the Quantle Rato for only one dstrbuton, follow these steps: - From the man menu, choose "Inequalty Quantle Rato ndex". - In the confguraton of the applcaton, choose dstrbuton. 8
50 3- After confrmng your choce, the applcaton appears. Choose the dfferent vectors and values of parameters as follows: Indcaton Varables or parameters Choce s: Varable of nterest y Sze varable s Optonal Group Varable c Optonal Group Number Optonal Percentle for numerator Percentle denomnator for p p Among the buttons., you wll fnd the followng command: "Compute : to compute the Quantle raton. If you also want the standard devaton on the estmator of that ndex, choose the opton for computng wth a standard devaton. Case : Two dstrbutons To compute the Quantle Rato ndex wth two dstrbutons: - From the man menu, choose the tem: "Inequalty Quantle Rato ndex". - In the confguraton of applcaton, choose as the number of dstrbutons. 3- Choose the dfferent vectors and parameter values as follows: Indcaton Vectors or parameters Choce s: Varable of nterest y Sze varable Group Varable c Group Number Percentle for numerator Percentle denomnator for Dstrbuton Dstrbuton y s s c p p p p Optonal Optonal Optonal 9
51 Among the buttons, you wll fnd the command «Compute». To compute the standard devaton of the estmator of that ndex, choose the opton for computng wth standard devaton. The Coeffcent of Varaton Index Denote the Coeffcent of Varaton ndex of nequalty for the group by CV. It can be expressed as follows: CV = n n w y / = = µ w µ Case : One dstrbuton If you wsh to compute the Coeffcent of Varaton ndex of nequalty for only one dstrbuton, follow these steps: - From the man menu, choose the tem "Inequalty Coeffcent of Varaton ". - In the confguraton of the applcaton, choose dstrbuton. 3- After confrmng the confguraton, the applcaton appears. Choose the dfferent vectors and values of parameters as follows: Indcaton Varables or parameters Choce s: Varable of nterest y Sze varable s Optonal Group Varable c Optonal Group Number Optonal Among the buttons, you wll fnd the followng command: "Compute : to compute the Varaton Logarthms ndex. If you also want the standard devaton of ths ndex, choose the opton for computng wth a standard devaton. 0
52 Case : Two dstrbutons To compute the Coeffcent of Varaton of two dstrbutons: - From the man menu, choose the tem: "Inequalty Coeffcent of Varaton ". - In the confguraton of applcaton, choose dstrbutons. 3- Choose the dfferent vectors and parameter values as follows: Indcaton Vectors or parameters Choce s: Varable of nterest y Sze varable Group Varable c Group Number Dstrbuton Dstrbuton y s s c Optonal Optonal Optonal Among the buttons, you wll fnd the command «Compute». To compute the standard devaton of ths ndex, choose the opton for computng wth standard devaton. The Logarthmc Varance Index Denote the Logarthmc Varance ndex of nequa lty for the group by LV; t can be expressed as follows: LV = n w = ( log(y ) lmu) n w = where n w y = lmu = log n w = Case : One dstrbuton If you wsh to compute the Logarthmc Varance ndex of nequalty for only one dstrbuton, follow these steps: - From the man menu, choose the followng tems "Inequalty Logarthmc Varance ". - In the confguraton of the applcaton, choose dstrbuton. 3- After confrmng the confguraton, the applcaton appears. Choose the dfferent vectors and values of parameters as follows:
53 Indcaton Varables or parameters Choce s: Varable of nterest y Sze varable s Optonal Group Varable c Optonal Group Number Optonal Among the buttons, you fnd the followng command: "Compute : to compute the Logarthmc Varance ndex. If you also want the standard devaton of ths ndex, choose the opton for computng wth a standard devaton. Case : Two dstrbutons To compute the Logarthmc Varance ndex of two dstrbutons: - From the man menu, choose the tem: "Inequalty Logarthmc Varance ". - In the confguraton of applcaton, choose dstrbutons. 3- Choose the dfferent vectors and parameter values as follows: Indcaton Vectors or parameters Choce s: Varable of nterest y Sze varable Group Varable c Group Number Dstrbuton Dstrbuton y s s c Optonal Optonal Optonal Among the buttons, you fnd the command «Compute». To compute the standard devaton of ths ndex, choose the opton for computng wth standard devaton. The Varance of Logarthms Denote the Varance of Logarthms ndex of nequalty for group by VL. It can be expressed as follows:
54 VL = n w = ( ) log(y ) lmu n w = where n w log(y ) = lmu = n w = Case : One dstrbuton If you wsh to compute the Varance of Logarthms ndex of nequalty for only one dstrbuton, follow these steps: - From the man menu, choose the tem "Inequalty Varance of Logarthms ". - In the confguraton of the applcaton, choose dstrbuton. 3- After confrmng the confguraton, the applcaton appears. Choose the dfferent vectors and values of parameters as follows: Indcaton Varables or parameters Choce s: Varable of nterest y Sze varable s Optonal Group Varable c Optonal Group Number Optonal Among the buttons, you wll fnd the command: "Compute : to compute the Varance of Logarthms. If you also want the standard devaton of ths ndex, choose the opton for computng wth a standard devaton. Case : Two dstrbutons To compute the Varance of Logarthms of two dstrbutons: - From the man menu, choose the tem: "Inequalty Varance of Logarthms ". - In the confguraton of applcaton, choose dstrbutons. 3- Choose the dfferent vectors and parameter values as follows: Indcaton Vectors or parameters Choce s: 3
55 Varable of nterest y Sze varable Group Varable c Group Number Dstrbuton Dstrbuton y s s c Optonal Optonal Optonal Among the buttons, you wll fnd the command «Compute». To compute the standard devaton of ths ndex, choose the opton for computng wth standard devaton. The Relatve Mean Devaton Index Denote the Relatve Mean Devaton ndex of nequalty for the group by RMD. It can be expressed as follows: RMD = n w = ( ) n w = y / µ Case : One dstrbuton If you wsh to compute the relatve mean devaton ndex of nequalty for only one dstrbuton, follow these steps: - From the man menu, choose the followng tems "Inequalty Relatve Mean Devaton ". - In the confguraton of the applcaton, choose dstrbuton. 3- After confrmng the confguraton, the applcaton appears. Choose the dfferent vectors and values of parameters as follows: Indcaton Varables or parameters Choce s: Varable of nterest y Sze varable s Optonal Group Varable c Optonal Group Number Optonal Among the buttons, you wll fnd: 4
56 "Compute : to compute the relatve mean devaton. If you also want the standard devaton of ths ndex, choose the opton for computng wth a standard devaton. Case : Two dstrbutons - To compute the relatve mean devaton of two dstrbutons: - From the man menu, choose the tem: "Inequalty Relatve Mean Devaton ". 3- In the confguraton of applcaton, choose dstrbutons. 4- Choose the dfferent vectors and parameter values as follows: Indcaton Vectors or parameters Choce s: Varable of nterest y Sze varable Group Varable c Group Number Dstrbuton Dstrbuton y s s c Optonal Optonal Optonal Among the buttons, you wll fnd the command «Compute». To compute the standard devaton of ths ndex, choose the opton for computng wth standard devaton. The Condtonal Mean Rato Denote the Condtonal Mean for group by µ (; p;p ), where p and p specfy the percentle (p) range of those we wsh to nclude n the computaton of the condtonal mean. These percentle values p are such that p p p. µ (; p; p ) s formally defned as: µ (;p ; p ) = p p Q(; p)dp and s the average ncome of those whose ran n the populaton s between p and p. The Condtonal Mean Rato for group s then gven by CMR(, ;,p,p,p 3,p 4 ) and s defned as p p 5
57 CMR(, µ (; p;p ) ; p, p, p3, p4) = µ ( ; p ; p ) 3 4 Case : One dstrbuton If you wsh to compute the Condtonal Mean Rato ndex of nequalty for only one dstrbuton, follow these steps: - From the man menu, choose "Inequalty Condtonal Mean Rato ndex". - In the confguraton of the applcaton, choose dstrbuton. 3- After confrmng the confguraton, the applcaton appears. Choose the dfferent vectors and parameter values as follows: Indcaton Varables or parameters Choce s: Varable of nterest y Sze varable s Optonal Group Varable c Optonal Group Number Optonal Percentle p Percentle p Percentle p 3 Percentle p 4 Among the buttons., you wll fnd the followng command: "Compute : to compute the Condtonal Mean Rato. If you also want the standard devaton of ths ndex, choose the opton for computng wth a standard devaton. Case : Two dstrbutons To compute the Condtonal Mean Rato wth two dstrbutons: - From the man menu, choose the tem: "Inequalty Condtonal Mean Rato ndex". - In the confguraton of applcaton, choose for the number of dstrbutons. 3- Choose the dfferent vectors and parameter values as follows: Indcaton Vectors or parameters Choce s: Dstrbuton Dstrbuton 6
58 Varable of nterest y Sze varable Group Varable c Group Number percentle percentle percentle percentle y s s c p p p p p 3 p 3 p 4 p 4 Optonal Optonal Optonal Among the buttons, you wll fnd the command «Compute». To compute the standard devaton of ths ndex, choose the opton for computng wth standard devaton. The Share Rato Denote the Share Rato for populaton doman by SR(; p, p, p3, p4), where p and p are lower and upper percentles that delmtate a frst group and p3 and p4 are lower and upper percentles that delmtate a second group. The Share Rato s the rato of the ncome share of the frst group over the ncome share of the second group: SR(; p, p, p3, p4) = L(p)- L(p) L(p4)- L(p3) Case : One dstrbuton If you wsh to compute the Share Rato for only one dstrbuton, follow these steps: - From the man menu, choose "Inequalty Share Rato ndex". - In the confguraton of the applcaton, choose dstrbuton. 3- After confrmng the confguraton, the applcaton appears. Choose the dfferent vectors and parameter values as follows: Indcaton Varables or parameters Choce s: Varable of nterest y Sze varable s Optonal Group Varable c Optonal Group Number Optonal Percentle Percentle p p 7
59 Percentle Percentle p 3 p 4 Among the buttons. you wll fnd the followng command: "Compute : to compute the Share Rato. If you also want the standard devaton of ths ndex, choose the opton for computng wth a standard devaton. Case : Two dstrbutons To compute the Share Rato wth two dstrbutons: - From the man menu, choose the tem: "Inequalty Share Rato ndex". - In the confguraton of applcaton, choose for the number of dstrbutons. 3- Choose the dfferent vectors and parameter values as follows: Indcaton Vectors or parameters Choce s: Varable of nterest y Sze varable Group Varable c Group Number percentle percentle percentle percentle Dstrbuton Dstrbuton y s s c p p p p p 3 p 3 p 4 p 4 Optonal Optonal Optonal Among the buttons, you wll fnd the command «Compute». To compute the standard devaton of ths ndex, choose the opton for computng wth standard devaton. 8
60 Income-Component Proportonal Growth Change per 00 % Opton Let J components y J j = y j= j y add up to y, that s: The S-Gn ndex of nequalty can be expressed as follows: I( ρ) = J j= µ µ j y IC j ( ρ) The contrbuton of the j th component to total nequalty n y s ( ρ) IC j ( ρ ) s the coeffcent of concentraton of the j th component and that component. µ µ j y IC j, where µ s the mean of j The mpact on the S-Gn ndex of growth n y comng exclusvely from growth n the th j component s: I( ρ) j y µ y / µ j y y = IC ( ρ) I( ρ) j When multpled by %, ths says for nstance by how much (n absolute, not n percentage, terms) the Gn ndex wll change f total ncome ncreases by % when that growth s entrely due to growth from the th j component. If you wsh to compute ths statstcs, choose from the man menu the followng tems "Inequalty Impact of Component Growth". Indcaton Varables or parameters Choce s: Varable of nterest y Component y j Sze varable s Optonal Group Varable c Optonal Group Number Optonal Rho ρ 9
61 Among the buttons, you wll fnd: "Compute : to compute the mpact on the S-Gn ndex of growth n y comng exclusvely from growth n the j th component. If you also want ts standard devaton, choose the opton for computng wth a standard devaton. Elastcty wth respect to component opton The Gn j th -component elastcty s gven by: I( ρ) j y I( ) IC j ( ρ) / ρ = µ y µ y I( ρ) j y Ths gve the elastcty of the Gn ndex wth respect to total ncome, when the change n total ncome s entrely due to growth from the j th component. To compute ths elastcty, choose from the man menu the followng tems "Inequalty Gn Component Elastcty". Indcaton Varables or parameters Choce s: Varable of nterest y Component y j Sze varable s Optonal Group Varable c Optonal Group Number Optonal rho ρ Among the buttons, you wll fnd: "Compute : to compute the Gn component elastcty. To obtan the standard devaton of that estmate, choose the opton for computng wth a standard devaton. 0
62 Poverty ndces DAD offers four possbltes for fxng the poverty lne: - A determnstc poverty lne set by the user. - A poverty lne equal to a proporton l of the mean. 3- A poverty lne equal to a proporton m of a quantle Q(p). 4- An estmated poverty lne that s asymptotcally normally dstrbuted wth a standard devaton specfed by the user. For the frst possblty, just ndcate the value of the determnstc poverty lne n front of the ndcaton "Poverty lne". For the three other possbltes, proceed as follows: Clc on the button "Compute lne ". Choose one of the three followng optons: a) Proporton of mean: the proporton l should be ndcated. b) Proporton of quantle: ndcate the proporton m and the quantle Q(p) by specfyng the desred percentle p of the populaton. c) Estmated lne: ndcate the estmate of the poverty lne z and ts standard devaton stdz. To compute the poverty lne n the case of two dstrbutons: Clc on the button "Computate lne ". Choose one of these three followng optons: a) Proporton of mean: ndcate the proportons l and l for the dstrbutons and respectvely. b) Proporton of quantle: ndcate the proportons m and m, and specfy the desred quantles by ndcatng the percentles of populaton p and p. c) Estmated lne: ndcate the estmates of the poverty lnes z and z and ther standard devatons stdz and stdz. The FGT ndex The Foster-Greer-Thorbece poverty ndex FGT P(; z; α) for the populaton subgroup s as follows: P(;z; α) = n = w n = w (z y ) α +
63 where z s the poverty lne and x + = max( x,0). The normalsed ndex s defned by: Case : One dstrbuton To compute the FGT ndex: P (; z; α ) = P(;z; α) /(z) - From the man menu, choose the tem: " Poverty FGT ndex". - In the confguraton of applcaton, choose dstrbuton. 3- Choose the dfferent vectors and parameter values as follows: α Indcaton Varables or Choce s: parameters Varable of nterest y Sze varable s Optonal Group Varable c Optonal Group number Optonal Poverty lne z alpha α 4- To compute the normalsed ndex, choose that opton n the wndow of nputs. Among the buttons, you fnd: The command "Compute : to compute the FGT ndex. To compute the standard devaton of ths ndex, choose the opton for computng wth standard devaton. The command "Graph : to draw the value of the ndex as a functon of a range of poverty lnes z. To specfy the range (for the horzontal axs), choose the tem " Graph Management Change range of x " from the man menu. The command "Graph : to draw the value of (FGT) as a functon of a range of parameter α. To specfy such a range for the horzontal axs, choose the tem " Graph Management Change range of x " from the man menu. /α Case : Two dstrbutons To compute the FGT ndex wth two dstrbutons: - From the man menu, choose the tem: " Poverty FGT ndex". - In the confguraton of applcaton, choose dstrbutons. 3- Choose the dfferent vectors and parameter values as follows:
64 Indcaton Vector or parameter Choce s: Varable of nterest Sze varable s Group Varable Group number Poverty lnes alpha Dstrbuton Dstrbuton y y s c c Optonal Optonal Optonal z z α α To compute the standard devaton of ths ndex, choose the opton for computng wth standard devaton. 4- To compute the normalsed ndex, choose ths opton n the wndow of nputs. The Bounded Income and Overload Indces Gap ndex: The Gap ndex GI(; z; z; α) for the populaton subgroup s as follows: n α w (z y)i(z y z) = GI(;z,z; α ) = n w If the ndex s relatve to the group of those wth Surplus ndex: n = z y z, we have: α w (z y)i(z y z) = GI(;z,z; α ) = n wi(z y z) The Surplus ndex SI(; z; z; α) for the populaton subgroup s as follows: n = α w (y z) I(z y z) SI(;z,z; α ) = = n w = If the ndex s relatve to the group z y z, we have: 3
65 n α w (y z) I(z y z) SI(;z,z; α ) = = n wi(z y z) = Overload ndex: The Over Load Index OLI(; z; α) for the populaton subgroup s as follows: GI(;z= 0;z= z; α) OLI( α ) = SI(,z3= z,z4 =+ α, ) Where s the poor group and the non poor group of populaton. - From the man menu, choose the tem: Poverty Bounded ncome ndex". - Choose the dfferent vectors and parameter values as follows: Indcaton Varables or Choce s: parameters Varable of nterest y Sze varable s Optonal Group Varable c Optonal Group number Optonal Lower bound z Upper bound z Poverty lne z for OLI alpha α Among the buttons, you fnd: The command "Compute : to compute the selected ndex. To compute the standard devaton of ths ndex, choose the opton for computng wth standard devaton. The command "Graph : to draw the value of the overload ndex as a functon of a range of poverty lnes z. To specfy the range (for the horzontal axs), choose the tem "Graph Management Change range of x " from the man menu. The Watts poverty ndex The Watts poverty ndex PW (; z) for the populaton subgroup s defned as: 4
66 PW (;z) n w = = n where z s the poverty lne and x + = max( x,0). Case : One dstrbuton To compute the Watts ndex: ( log( y / z) ) - From the man menu, choose the tem: " Poverty Watts ndex". - In the confguraton of applcaton, choose for the number of dstrbutons. 3- Choose the dfferent vectors and parameter values as follows: Indcaton Varables or Choce s: parameters Varable of nterest y Sze varable s Optonal Group Varable c Optonal Group number Optonal Poverty lne z = w + Commands: The command "Compute : to compute the Watts ndex. To compute the standard devaton, choose the opton for computng wth standard devaton. The command "Graph : to draw the value of ndex accordng to a range of poverty lnes z. To specfy such a range for the horzontal axs, choose the tem " Graph Management Change range of x " from the man menu. Case : Two dstrbutons To compute the Watts ndex wth two dstrbutons: - From the man menu, choose the tem: " Poverty Watts ndex". - In the confguraton of applcaton, choose dstrbutons. 3- Choose the dfferent vectors and parameter values as follows: 5
67 Indcaton Vector or parameter Choce s: Varable of nterest Sze varable Group Varable Group number Poverty lnes Dstrbuton Dstrbuton y y s s c c z z Optonal Optonal Optonal To compute the standard devaton, choose the opton for computng wth standard devaton. The S-Gn poverty ndex The S-Gn poverty ndex P(;z; ρ ) for the populaton subgroup s defned as: P (;z; ρ) = z n = (V ) ρ ρ (V + ) ρ [ V ] (z y ) + and V n = w h= h where z s the poverty lne and x + = max( x,0). Case : One dstrbuton To compute the S-Gn ndex: - From the man menu, choose the tem: "Poverty S-Gn ndex". - In the confguraton of applcaton, choose dstrbuton. 3- Choose the dfferent vectors and parameter values as follows: Indcaton Varables or Choce s: parameters Varable of nterest y Sze varable s Optonal Group Varable c Optonal Group number Optonal Poverty lne z rho ρ 6
68 4- To compute the normalsed ndex, choose ths opton n the wndow of nputs. Commands: The command "Compute : to compute the S-Gn ndex. To compute the standard devaton, choose the opton for computng wth standard devaton. The command "Graph : to draw the value of the ndex accordng to a range of poverty lnes z. To specfy such a range for the horzontal axs, choose the tem " Graph Management Change range of x " from the man menu. Case : Two dstrbutons To compute the S-Gn ndex wth two dstrbutons: - From the man menu, choose the tem: "Poverty S-Gn ndex". - In the confguraton of applcaton, choose dstrbutons. 3- Choose the dfferent vectors and parameter values as follows: Indcaton Vectors or parameters Choce s: Varable of nterest Sze varable Dstrbuton Dstrbuton y y s s Optonal Group Varable c c Optonal Group number Optonal Poverty lnes z z rho ρ ρ The frst executon bar contans the command «Compute». To compute the standard devaton, choose the opton for computng wth standard devaton. 4- To compute the normalsed ndex, choose ths opton n the wndow of nputs. The Clar, Hemmng and Ulph (CHU) poverty ndex The poverty ndex P(; z; ε ) for the populaton subgroup s defned as: 7
69 n * ε w (y ) = z n w = P(;z, ε) = n * w ln y = z exp n w = /( ε) f ε and f ε 0 ε = where z s the poverty lne and y * y = z f y otherwse z Case : One dstrbuton To compute the CHU ndex: - From the man menu, choose the tem: "Poverty CHU ndex". - In the confguraton of applcaton, choose for the number of dstrbutons. 3- Choose the dfferent vectors and parameter values as follows: Indcaton Varables or Choce s: parameters Varable of nterest y Sze varable s Optonal Group Varable c Optonal Group number Optonal Poverty lne z epslon ε 4- To compute the normalsed ndex, choose ths opton n the wndow of nputs. Commands: The command "Compute : to compute the CHU ndex. To compute the standard devaton, choose the opton for computng wth standard devaton. The command "Graph : to draw the value of the ndex accordng to a range of poverty lnes z. To specfy such a range for the horzontal axs, choose the tem "Graph Management Change range of x" from the man menu. 8
70 Case : Two dstrbutons To compute the CHU ndex wth two dstrbutons: - From the man menu, choose the tem: " Poverty CHU ndex. - In the confguraton of applcaton, choose dstrbutons. 3- Choose the dfferent vectors and parameter values as follows: Indcaton Vectors or parameters Choce s: Varable of nterest Sze varable Group Varable Group number Poverty lnes epslon Dstrbuton Dstrbuton y y s s c c z z ε ε Optonal Optonal Optonal The frst executon bar contans the command «Compute». To compute the standard devaton, choose the opton for computng wth standard devaton. The Sen Index The Sen ndex of poverty PS(; z, ρ ) for the populaton subgroup s defned as: PS = H I * [ + ( I)G ] H = n w = * I(y n w = z) q = n w = * I(z y n w = ) + 9
71 G * s the Gn ndex of nequalty among the poor, and where z s the poverty lne and x = max( x,0) +. Case : One dstrbuton To compute the Sen ndex: - From the man menu, choose the tem: "Poverty Sen ndex". - In the confguraton of applcaton, choose dstrbuton. 3- Choose the dfferent vectors and parameter values as follows: Indcaton Varables or parameters Choce s: Varable of nterest y Sze varable s Optonal Group Varable c Optonal Group number Optonal Poverty lne z rho ρ 4- To compute the normalsed ndex, choose ths opton n the wndow of nputs. Commands: The command "Compute : to compute the Sen ndex. To compute the standard devaton, choose the opton for computng wth standard devaton. The command "Graph : to draw the value of the ndex accordng to a range of poverty lnes z. To specfy such a range for the horzontal axs, choose the tem " Graph Management Change range of x " from the man menu. Case : Two dstrbutons To compute the Sen ndex wth two dstrbutons: - From the man menu, choose the tem: "Poverty Sen ndex". - In the confguraton of applcaton, choose for the number of dstrbutons. 3- Choose the dfferent vectors and parameter values as follows: 0
72 Indcaton Vectors or parameters Choce s: Varable of nterest Sze varable Group Varable Group number Poverty lnes rho Dstrbuton Dstrbuton y y s s c c Optonal Optonal Optonal z z ρ ρ 4- To compute the normalsed ndex, choose ths opton n the wndow of nputs. The B-dmensonal FGT ndex The Foster-Greer-Thorbece poverty ndex for a good g, P g (; z; α), for the populaton subgroup s as follows: g P (;z ; α) = g n = w (z n = g w x ) g α + where z g s the poverty lne for good g, and t + = max( t,0). The normalsed ndex s defned by: g g g P (;z ; α ) = P (;z ; α)/(z ) g g α Unon headcount The unon headcount, based on G dmensons or commodtes, s equal to: P (;z, z,...) n G w = g = = n w = I(z g < x g )
73 Intersecton headcount The ntersecton headcount, based on G dmensons or commodtes, s equal to: = = = = n n G g g g w ) x I(z w,...) z, (;z P Unon sum of gaps The unon sum of gaps, usng G dmensons or commodtes, s equal to: = = + = = n G g g g n w ) x (z w,...) z, (;z P Intersecton sum of gaps The ntersecton sum of gaps, usng G dmensons or commodtes, s equal to: = = = + = = n G g g G g g g n w ) x I(z * ) x (z w,...),z (;z P Intersecton product of gaps The ntersecton product of gaps, usng G dmensons or commodtes, s equal to: = = = + α = = α α n G g g G g g g n w ) x I(z * ) x (z w,...),,...; z, P(;z g
74 Graphcal llustraton for two commodtes Z Commodty I II III Z Commodty Case : One dstrbuton To compute the b-dmensonal FGT ndces for two goods: - From the man menu, choose the tem: " Poverty Bdmensonal FGT ndex". - Choose the dfferent vectors and parameter values as follows: Indcaton Varables or Choce s: parameters Commodty x Commodty x Sze varable s Optonal Group Varable c Optonal Group Number Optonal Poverty lne z Poverty lne z alpha α alpha α Results of ths applcaton are: FGT ndex for commodty : correspondng to areas (I+II) n the graphcal llustraton. 3
: correspondng to areas (II) n the graphcal llustraton. Example: Food and non-food expendtures per day n F CFA (Cameroon 996).")
75 FGT ndex for commodty : correspondng to areas (II+III) n the graphcal llustraton. FGT ndex for the two commodtes (Unon approach): correspondng to areas (I+II+III) n the graphcal llustraton. FGT ndex for the two commodtes (Intersecton approach): correspondng to areas (II) n the graphcal llustraton. Example: Food and non-food expendtures per day n F CFA (Cameroon 996). Food poverty lne evaluated at 56 F CFA and non-food poverty lne evaluated at 7 F CFA. Case : Two dstrbutons To compute the FGT ndces for two goods and for two dstrbuton: - From the man menu, choose the tem: " Poverty Two Dmensons FGT ndex ". - In the confguraton of applcaton, choose for the number of dstrbutons. 3- Choose the dfferent vectors and parameter values as follows: 4
76 Indcaton Vectors or parameters Choce s: Dstrbuton Dstrbuton Commodty x x Commodty x x Sze varable s S Optonal Group Varable c c Optonal Group Number Optonal Poverty lne z Z Poverty lne z z alpha α α alpha α α Impact of a prce change on the FGT ndex The mpact of a good s margnal prce change (denoted IMP) on the FGT poverty ndex P(; z; α) s as follows: IMP = P(;z; α) * pc p l = CD α+ l (;z)* pc where z s the poverty lne, s the populaton subgroup for whch we wsh to assess the mpact of the prce change, and pc s the percentage prce change for good l. 5
77 IMP α n w z = α = n w = E x = α = n n w [ y = z] z y w z ( z y ) * f(z) = n = α + α x + x w K (z y )* x h n = w f f f α and Normalsed α and Not Normalsed α = 0 where x l s expendture on commodty l by ndvdual, and f = max( f,0 ). Note that f + α+ the FGT ndex s normalzed: IMP = CD l(;z)* pc To compute the mpact of the prce change: - From the man menu, choose the tem: "Poverty Impact of prce change". - Choose the dfferent vectors and parameter values as follows: Indcaton Varables or parameters Choce s: Varable of nterest y Sze varable s Optonal Commodty x Group Varable c Optonal Group Number Optonal Poverty lne z alpha α Prce change n % pc 6
78 Commands: "Compute : to compute the mpact of the prce change. To compute the standard devaton of ths estmated mpact, choose the opton for computng wth standard devaton. "Graph : to draw the value of the mpact as a functon of a range of poverty lnes z. To specfy that range (and thus the range of the horzontal axs), choose the command Range. Impact of a tax reform on the FGT ndces Ths tax reform conssts of a varaton n the prces of two commodtes and, under the constrant that t leaves unchanged total government revenue. The effect of ths constrant s gven by an effcency parameter, gamma ( γ ), whch s the rato of the margnal cost of publc funds (MCPF) from a tax on over the MCPF from a tax on. The mpact of ths tax reform (denoted IMTR) on the FGT poverty ndex P(; z; α) s as follows: IMTR α + X α+ = CD (;z) γ CD (;z) * pc X where z s the poverty lne, CD α+ (;z) and CD α+ (;z) are the consumpton domnance curves of commodtes and, and pc s the percentage prce change of commodty. Under the government revenue constrant, the percentage prce change of commodty s X gven by γ pc. X To compute the mpact of the tax reform: - From the man menu, choose the tem: " Poverty Impact of tax reform". - Choose the dfferent vectors and parameter values as follows: 7
79 Indcaton Varables or parame ters Choce s: Varable of nterest y Sze varable s Optonal Commodty x Commodty x Group Varable c Optonal Group Number Optonal Poverty lne z alpha α gamma γ s % prce change pc Commands: "Compute : to compute the mpact of the tax reform. To compute the standard devaton of ths estmated mpact, choose the opton for computng wth standard devaton. " Crtcal? : to compute the gamma at whch the tax reform wll have zero mpact on poverty. The value of ths crtcal gamma equals CD (;z)/ CD (;z) "Graph z : to draw the value of the mpact of the tax reform as a functon of a range of poverty lnes z. To specfy that range (and the horzontal axs), choose the command Range. " Graph? : to draw the value of the mpact as a functon of a range of MCPF ratos γ. To specfy that range (and the horzontal axs), choose the command Range. Lump-sum Targetng The per-capta-dollar mpact of a margnal addton of a constant amount of ncome to everyone wthn a group called Lump-Sum Targetng (LST) on the FGT poverty ndex P(; z; α), s as follows: α+ α+ LST αp(, z; α ) α = P(, z; α ) z f (, z) f f f α α α = 0 and and Not Normalsed Normalsed where z s the poverty lne, s the populaton subgroup for whch we wsh to assess the mpact of the ncome change, and f(,z) s the densty functon of the group at level of ncome z. 8
80 To compute that mpact: - From the man menu, choose the tem: "Poverty Lump-sum Targetng". - Choose the dfferent vectors and parameter values as follows: Indcaton Varables or parameters Choce s: Varable of nterest y Sze varable s Optonal Group Varable c Optonal Group Number Optonal Poverty lne z alpha α Commands: "Compute : to compute the mpact of the ncome change. To compute the standard devaton of ths estmated mpact, choose the opton for computng wth standard devaton. "Graph : to draw the value of the mpact as a functon of a range of poverty lnes z. To specfy that range (and thus the range of the horzontal axs), choose the command Range. Inequalty-neutral Targetng The per-capta-dollar mpact of a proportonal margnal varaton of ncome for the group, called Inequalty Neutral Targetng, on the FGT poverty ndex P(; z; α) s as follows: P(, z; α) zp(, z; α ) α µ P(, z; α) zp(, z; α ) INT = α µ zf (, z) µ f f f α α α = 0 and and FGTs not normalsed FGTs normalsed where z s the poverty lne, s the populaton subgroup for whch we wsh to assess the mpact of the ncome change, and f(,z) s the densty functon of the group at level of ncome z. 9
81 To compute that mpact: - From the man menu, choose the tem: "Poverty Inequalty-neutral Targetng". - Choose the dfferent vectors and parameter values as follows: Indcaton Varables or parameters Choce s: Varable of nterest y Sze varable w Optonal Group Varable c Optonal Group Number Optonal Poverty lne z alpha α Commands: "Compute : to compute the mpact. To compute the standard devaton of ths estmated mpact, choose the opton for computng wth standard devaton. "Graph : to draw the value of the mpact as a functon of a range of poverty lnes z. To specfy that range (and thus the range of the horzontal axs), choose the command Range. Growth Elastcty The overall growth elastcty (GREL) of poverty, when growth comes exclusvely from growth wthn a group (whch s, wthn that group, nequalty neutral), s gven by: P(, z; α) zp(, z; α ) α P(z, α) GREL = zf (, z) F(z) f f α α = 0 0
82 where z s the poverty lne, s the populaton subgroup n whch growth taes place, f(z) s the densty functon at level of ncome z, and F(z) s the headcount. To compute that growth elastcty: - From the man menu, choose the tem: "Poverty Growth Elastcty". - Choose the dfferent vectors and parameter values as follows: Indcaton Varables or parameters Choce s: Varable of nterest y Sze varable s Optonal Group Varable c Optonal Group Number Optonal Poverty lne z alpha α Commands: "Compute : to compute the growth elastcty. To compute the standard devaton of ts estmate, choose the opton for computng wth standard devaton. "Graph : to draw the value of the mpact as a functon of a range of poverty lnes z. To specfy that range (and thus the range of the horzontal axs), choose the command Range. Income-Component Proportonal Growth Change per 00% of component Assume that total ncome Y s the sum of C ncome components, wth Y = C λ c y c and c= where c s a factor that multples ncome component yc and that can be subject to growth. The dervatve of the normalzed FGT ndex wth respect to λ c s gven by P(;z, α) = λc λc=,c= C CDc (; z, α) Where C-domnance curve of component c. Change per $ of component
83 The per-capta-dollar mpact of growth n the j th component on the normalzed FGT ndex of the th group s as follows: P(;z, α) j y µ y j = j CD (; z, α) where CD s the normalzed C-domnance curve of the component j. Elastcty wth respect to component The th j component elastcty of poverty (measured by the normalzed FGT ndex) s: µ j CD (;z, α) P(; z, α) j where CD s the normalzed C-domnance curve of the component j. If you wsh to compute ths elastcty choose "Poverty Component Elastcty". If you wsh to compute that mpact, choose "Poverty Income-Component Proportonal Growth", and select one of the tree optons. Indcaton Varables or parameters Choce s: Varable of nterest y Income Component y j Sze varable w Optonal Group Varable c Optonal Group Number Optonal Alpha α Poverty lne z Among the buttons, you wll fnd: "Compute : to compute the statstcs. If you also want ts standard error, choose the opton for computng wth a standard devaton.
84 The mpact of demographc changes Ths applcaton computes the mpact of a change (by a gven percentage) n the proporton of a group t. That change s accompaned by an exactly offsettng change n the proporton of the other groups. If the populaton proporton of group t ncreases by pc percent, such that φ ( t) ( φ(t)( + pc) ), the total estmated mpact on poverty s as follows: K φ(t) P = φ(t)* P(t; z, α) * φ()* P(;z, α) * pc s φ(t) If the populaton proporton of group s ncreases by absolute pc percent of the total populaton, such that φ ( t) ( φ(t) + pc), the total estmated mpact on poverty s as follows: P = P(t;z, α) K s φ() * P(;z, α) * pc φ(t) where P(;z; α ) s the FGT poverty ndex for subgroup and φ () s the proporton of the populaton found n that subgroup. To perform ths estmaton: - From the man menu, choose: "Decomposton Impact of Demographc Change". - After confrmng the confguraton, the applcaton appears. Choose the dfferent vectors and parameter values as follows: Indcaton Varables or Choce s: parameters Varable of nterest y Sze Varable s Optonal Group Varable c Optonal Changed group t Poverty lne z Alpha α Group numbers separated by "-" - - Remar: The group numbers separated by the dash "-" should be nteger values. For example, we may have two subgroups coded by the ntegers and. In ths case, we would wrte n the feld «Group Numbers» the values "-" before proceedng to the decomposton. 3
85 The socal welfare ndces DAD can compute the followng types of socal welfare ndces: The Atnson socal welfare ndex Case : One dstrbuton To compute the Atnson ndex of socal welfare for one dstrbuton: - From the man menu, choose the followng tem: "Welfare Atnson ndex". - In the confguraton of the applcaton, choose for the number of dstrbutons. 3- After confrmng the confguraton, the applcaton appears. Choose the dfferent vectors and parameter values as follows: Commands: Indcaton Varables or parameters Choce s: Varable of nterest y Sze varable s Optonal Group Varable c Optonal Group number Optonal epslon ε The command "Compute": to compute the Atnson ndex. To compute the standard devaton, choose the opton for computng wth standard devaton. The command "Graph": to draw the value of the ndex accordng to a range of parameters ε. To specfy such a range for the horzontal axs, choose the tem "Graph Management Change range of x" from the man menu. Case : Two dstrbutons To compute the Atnson wth two dstrbutons: - From the man menu, choose the tem: "Welfare Atnson ndex". - In the confguraton of applcaton, choose for the number of dstrbutons. 3- Choose the dfferent vectors and parameter values as follows:
86 Indcaton Vector or parameter Choce s: Varable of nterest y Sze varable Group Varable Group number epslon Dstrbuton Dstrbuton y s s c c ε ε Optonal Optonal Optonal To compute the standard devaton, choose the opton for computng wth standard devaton. The S-Gn socal welfare ndex Case: One dstrbuton To compute the S-Gn ndex of socal welfare for one dstrbuton: - From the man menu, choose the followng tem: "Welfare S-Gn ndex". - In the confguraton of the applcaton, choose for the number of dstrbutons. 3- After confrmng the confguraton, the applcaton appears. Choose the dfferent vectors and parameter values as follows: Commands: Indcaton Varables or Choce s: parameters Varable of nterest y Sze varable s Optonal Group Varable c Optonal Group number Optonal rho ρ The command "Compute": to compute the S-Gn ndex. To compute the standard devaton, choose the opton for computng wth standard devaton. The command "Graph": to draw the value of the ndex accordng to a range of parameter ρ. To specfy such a range for the horzontal axs, choose the tem " Graph Management Change range of x " from the man menu.
87 Case : Two dstrbuton To compute the S-Gn wth two dstrbutons: - From the man menu, choose the tem: "Welfare S-Gn ndex". - In the confguraton of applcaton, choose for the number of dstrbutons. 3- Choose the dfferent vectors and parameter values as follows: Indcaton Vector or parameter Choce s: Varable of nterest Sze varable Group Varable Group number rho Dstrbuton Dstrbuton y y s s c c ρ ρ Optonal Optonal Optonal To compute the standard devaton, choose the opton for computng wth standard devaton. The Atnson-Gn socal welfare ndex To compute the Atnson-Gn socal welfare ndex: - From the man menu, choose the followng tem: "Welfare S-Gn ndex". - In the confguraton of the applcaton, choose for the number of dstrbutons. 3- After confrmng the confguraton, the applcaton appears. Choose the dfferent vectors and values of parameters as follows: Indcaton Varables or Choce s: parameters Varable of nterest y Sze varable s Optonal Group Varable c Optonal Group number Optonal epslon ε rho ρ Press the command "Compute to compute the Atnson-Gn ndex. To compute the standard devaton, choose the opton for computng wth standard devaton. 3
88 Case : Two dstrbutons To compute the Atnson-Gn socal welfare wth two dstrbutons: - From the man menu, choose the tem: "Welfare Atnson-Gn". - In the confguraton of applcaton, choose for the number of dstrbutons. 3- Choose the dfferent vectors and parameter values as follows: Indcaton Vector or parameter Choce s: Varable of nterest Sze varable Group Varable Group number rho epslon Dstrbuton Dstrbuton y y s s c c ρ ρ ε ε Optonal Optonal Optonal To compute the standard devaton, choose the opton for computng wth standard devaton. Impact of a prce change on the Atnson Socal Welfare Index The mpact of a good s margnal prce change (denoted IMPW) on the Atnson Socal ξ ε s as follows: Welfare ndex ( ) ξ( ε) IMPW = * pc p l and s = s = ε = ( s) ε * ( s) ε IMPW * (s3)* pc - exp(s/s) * s3/s* pc w w s = s = w y ε s3 = w log( y ) s3 = w y ε x f f w x / y ε ε f f ε ε = where x l s expendture on commodty l by ndvdual, y s the varable of nterest ( lvng standard ), and pc s the percentage prce change for good l. 4
89 To compute the mpact of the prce change: - From the man menu, choose: "Welfare Impact of prce change". - Choose the dfferent vectors and parameter values as follows: Indcaton Varables or parameters Choce s: Varable of nterest y Sze varable s Optonal Commodty x Group Varable c Optonal Group Number Optonal epslon ε Prce change n % pc The computaton can be made solely wthn a group of ndvduals. Ths s done by specfyng the group number and the group varable c. Commands: "Compute : to compute the mpact of the prce change. To compute the standard devaton of ths estmated mpact, choose the opton for computng wth standard devaton. "Graph : to draw the value of the mpact as a functon of a range for the parameter ε. To specfy that range (and thus the range of the horzontal axs), choose the command Range. Impact of a tax reform on the Atnson Socal Welfare Index Ths tax reform conssts of a varaton n the prces of two commodtes and, under the constrant that t leaves unchanged total government revenue. The effect of ths constrant s gven by an effcency parameter, gamma ( γ ), whch s the rato of the margnal cost of publc funds (MCPF) from a tax on over the MCPF from a tax on. The mpact of ths tax reform (denoted IMWTR) on the Atnson Socal Welfare ndex ξ ε s as follows: ( ) IMWTR ξ( ε) X = γ pl X ξ( ε) * pc p where pc s the percentage prce change of commodty, and X g s the total expendture on the good g. Under the government revenue constrant, the percentage prce change of 5
90 X commodty s gven by γ pc. The computaton can be made solely wthn a group of X ndvduals. Ths s done by specfyng the group number and the group varable c. To compute the mpact of the tax reform: - From the man menu, choose "Welfare Impact of tax reform". - Choose the dfferent vectors and parameter values as follows: Indcaton Varables or parameters Choce s: Varable of nterest y Sze varable s Optonal Commodty x Commodty x Group Varable c Optonal Group Number Optonal epslon ε gamma γ s % prce change pc Commands: "Compute : to compute the mpact of the tax reform. To compute the standard devaton of ths estmated mpact, choose the opton for computng wth standard devaton. Impact of Income-component growth on the Atnson Socal Welfare Index The mpact of growth n the th as follows: j component on the Atnson Socal Welfare ndex ξ( ε) s ε ξ( ε) = ( s) ε * ( s) ε * pc *(s3)* pc x j exp(s/s) * s3/s* pc f f ε ε and s = s = w w s = s = w y ε w log( y ) s3 = s3 = w y ε x w x / y j f f ε ε = 6
91 where x j s the value of component j for ndvdual and pc s the percentage change n that j ncome component. Ths tells us therefore by how much socal welfare wll change f a growth of pc s observed n a component j of total ncome. To compute the mpact of that change: From the man menu, choose the tem: "Welfare Impact of Income-component growth". Choose the dfferent vectors and parameter values as follows: Indcaton Varables or parameters Choce s: Varable of nterest y Sze varable s Optonal Component x Group Varable c Optonal Group Number Optonal Epslon ε Component change pc n % Commands: "Compute : to compute the mpact of the Income-component growth. To compute the standard devaton of ths estmated mpact, choose the opton for computng wth standard devaton. "Graph : to draw the value of the mpact as a functon of a range for parameter ε. To specfy that range (and thus the range of the horzontal axs), choose the command Range. 7
92 The decomposton of nequalty and poverty The decomposton of the FGT ndex The FGT poverty ndex for a populaton composed of K groups can be wrtten as follows: P(z; a) = f()p(; z; a) K = where P(; z; α ) s the FGT poverty ndex for subgroup and φ () s the proporton of the populaton n ths subgroup. The contrbuton of group to the poverty ndex for the whole populaton equals φ ( )P(;z; α). To perform the decomposton of the FGT ndex: - From the man menu, choose the tem: "Decomposton FGT Decomposton". - After confrmng the confguraton, the applcaton appears. Choose the dfferent vectors and parameter values as follows: Indcaton Varables or Choce s: parameters Varable of nterest y Sze Varable s Optonal Group Varable c Optonal Poverty lne z alpha α Group numbers separated by "-" - - Remar: The group numbers separated by the dash "-" should be nteger values. For example, we may have two subgroups coded by the ntegers and. In ths case, we would wrte n the feld «Group Numbers» the values "-" before proceedng to the decomposton. The decomposton of the FGT ndex for two groups To perform the decomposton of the FGT ndex for two groups: - From man menu, choose the tem: "Decomposton FGT Decomposton for two groups". - After confrmng the confguraton, the applcaton appears. Choose the dfferent vectors and parameter values as follows
93 Indcaton Varables or Choce s: parameters Varable of nterest y Sze Varable s Optonal Group Varable c Optonal Poverty lne z alpha α Numbers for the subgroups separated by - "-" In the output wndow, you wll fnd the followng nformaton: - The FGT ndex for the whole populaton. - The FGT ndex for each of the two subgroups. 3- The dfference n the ndces of the two groups: P(;z; α ) P(;z; α) 4- The percentage dfference n the contrbuton of the two populaton subgroups, ( φ ()P(; z; α) φ()p(; z; α)) / P(z; α) To compute the standard devatons for these statstcs, choose the opton computng wth standard devaton. The decomposton of the FGT ndex across growth and redstrbuton effects Accordng to Datt & Ravallon (99) approach, we can decompose varaton of the FGT Index between two perods, t and t, nto growth and redstrbuton effects as follows: P t t t t t t t t [ P( µ, π ) P( µ, π )] + [ P( µ, π ) P( µ, π )] + R / ref P = = Varaton P C t t t t t t t t [ P( µ, π ) P( µ, π )] + [ P( µ, π ) P( µ, π )] + R / ref P = = Varaton C C C Varaton = Dfference n poverty between t and t. C = Growth Impact. C = Contrbuton of redstrbuton effect R = Resdual Ref : Indcates the perod of reference. t t t P( µ, π ) : the FGT ndex of the frst perod when we multply all ncomes y of the t t frst perod by the rato µ /µ
94 t t P( µ, π ) : the FGT ndex of the second perod when we multply all ncomes t y of the second perod by the rato t t µ / µ Accordng Kawan (997) approach, we can decompose varaton of the FGT Index between two perods, t and t, nto growth and redstrbuton effects as follows: C C = = P + P = C C Varaton t t t t t t t t ([ P( µ, π ) P( µ, π )] + [ P( µ, π ) P( µ, )]) ([ t t t t ] [ t t t t P( µ, π ) P( µ, π ) + P( µ, π ) P( µ, )]) π π To perform the decomposton of the FGT ndex across growth and redstrbuton effects: - From the man menu, choose the tem: "Decomposton Growth and redstrbuton". - After confrmng the confguraton, the applcaton appears. Choose the dfferent vectors and parameter values as follows: Indcaton Vector or parameter Choce s: Dstrbuton - t Varable of nterest Sze Varable Group Varable Dstrbuton-t y y s s c c Optonal Optonal Index of group Optonal Poverty lnes z alpha α To compute the standard devaton of ths ndex, choose the opton for computng wth standard devaton. The sectoral decomposton of dfferences n FGT ndces We can decompose dfferences n FGT nto sub-group dfferences n poverty and populaton proportons as follows: 3
95 P P Varaton = K φ() = ( P (; z; α) P (;z; α) ) K + P (;z; α ) = K + P (;z; α) P (;z; α) = ( φ () φ ()) ( )( ) φ () φ () Varaton = Dfference n poverty between and. C = Intra-sectoral or ntra-group mpacts C = Impact of changes n subgroup proportons C3 = Interacton effect To perform ths decomposton: - From the man menu, choose: "Decomposton Sectoral". - After confrmng the confguraton, the applcaton appears. Choose the dfferent vectors and parameter values as follows: Indcaton Vector or parameter Choce s: Varable of nterest Sze Varable Group Varable Dstrbuton Dstrbuton y y s s c c Optonal Optonal Poverty lnes z alpha α Group numbers separated by "-" - - To compute the standard devaton of ths ndex, choose the opton for computng wth standard devaton. The decomposton of the S-Gn ndex by sources (or components); Let J components j y add up to y, that s: J j y = y j= 4
96 A natural approach One natural approach to decomposng the S-Gn ndex of nequalty s as follows: I( ρ) = J j= µ µ j IC j ( ρ) where IC j ( ρ ) s the coeffcent of concentraton of the th j component and µ s the j mean of that component. The contrbuton of the th j component to nequalty n y s then: µ j µ y IC j ( ρ), The followng results appear n the output wndow: - The S-Gn ndex for y. - The coeffcents of concentraton for every component of y. 3- The rato µ j / µ for every component of y. 4- The contrbuton for every component. The Shapley approach One supposes wth the Shapley approach that the contrbuton of component j to total nequalty s the expected value of ts margnal contrbuton when t s added randomly to anyone of the varous subsets of components that one can choose from the set of all components. When a component s mssng from that set, we assume that the observaton values of that component are everywhere replaced by ts average. The followng results appear n the output wndow: To perform that decomposton of the S-Gn ndex of nequalty: - From the man menu, choose the tem: "Welfare and nequalty Decomposton S-Gn decomposton". - Select the desred decomposton approach. 3- After confrmng the confguraton, the applcaton appears. Choose the dfferent vectors and parameter values as follows: 5
97 Indcaton Varables or parameters Choce s: Sze Varable s Optonal Rho ρ Vector(s) of nterest Index-ndex The decomposton of the S-Gn ndex by populaton groups; Let there be G populaton subgroups. We wsh to determne the contrbuton of every one of those subgroups to total populaton nequalty. Natural approach We rewrte the S-Gn ndex as: µ I I I G g ρ = φ g g, ρ+ ρ g= µ where φ g : the populaton share of group g; I ρ : the contrbuton of nter group nequalty to total nequalty; µ g : the average revenue of those n group g. µ : average revenue of total populaton. Ig, ρ : S-Gn of group g The Shapley approach Ths decomposton has two steps. The frst one s to decompose total nequalty nto nter-group and ntra group contrbutons. The second step s to espress the total ntra group contrbuton as a sum of contrbutons of each of the groups. In the frst step, we suppose that the two Shapley factors are nter-group and ntra group nequalty. The rules followed to compute nequalty n the presence of one or two factors are: to elmnate ntra-group nequalty and to calculate nter-group nequalty, we use a vector of ncomes where each observaton has the average ncome of ts group; to elmnate nter-group nequalty and to calculate ntra-group negalty, we use a vector of ncomes where each observaton has ts ncome multpled by the rato µ / µ. g The second step conssts n decomposng total ntra-group nequalty as a sum of group nequalty. To do ths, we proceed systematcally smply by replacng the revenues of 6
98 those n a group by the average ncome of that group, such as to elmnate the ntra group contrbuton of a gven group. To perform the decomposton of the S-Gn ndex by groups: - From the man menu, choose the tem: "Welfare and nequalty Decomposton S-Gn decomposton by groups". - Select the desred decomposton approach. 3- After confrmng the confguraton, the applcaton appears. Choose the dfferent vectors and parameter values as follows: Indcaton Varables or parameters Choce s: Sze Varable s Optonal rho ρ Group numbers separated by "-" - - The decomposton of the Generalsed Entropy ndex of nequalty The Generalsed Entropy ndex of nequalty can be decomposed as follows: θ K () I( ) () µ θ = φ.i(; θ) + I( θ) = µ y where: φ () s the proporton of the populaton found n subgroup. µ () s the mean ncome of group. I ( ;θ) s the nequalty wthn group. ( θ) I s populaton nequalty f each ndvdual n subgroup s gven the mean ncome of subgroup, µ(). To perform the decomposton of the entropy ndex: - From the man menu, choose the tem : "Welfare and nequalty Decomposton Entropy decomposton". - After confrmng the confguraton, the applcaton appears. Choose the dfferent vectors and parameter values as follows: 7
99 Indcaton Varables or Choce s: parameters Varable of nterest y Sze Varable s Optonal Group Varable c Optonal theta θ Group numbers separated by "-" - - The followng nformaton appears n the output wndow: - The entropy ndex for the whole populaton. - The entropy ndex for between-group nequalty I ( θ). 3- The entropy ndex wthn every subgroup I(; θ ). 4- The rato ( µ ()/ µ ) Normalsed mean for every subgroup. 5- The absolute contrbuton to total nequalty of nequalty wthn every subgroup, that s, θ ( µ () / µ ). φ().i(; θ) 6- The relatve contrbuton to total nequalty of nequalty wthn every subgroup. To compute the standard devatons for these statstcs, choose the opton computng wth standard devaton. Decomposton of varaton of socal welfare ndex between two perods We can decompose the dfference n socal welfare (as measured by the EDE Atnson ndex) between two populatons, and, as follows: where: ξ ( ε) ξ( ε) = (I I )* µ + ( µ µ )* ( I ) + ( µ µ )*(I I ) C C C3 C: Impact of change n nequalty. C: Impact of change n mean. C3: Interacton mpact. To perform ths decomposton: - From the man menu, choose: "Decomposton Decomposton of Socal Welfare". - Choose the dfferent vectors and parameter values as follows: 8
100 Indcaton Vector or parameter Choce s: Varable of nterest y Sze Varable Group Varable Group number epslon Dstrbuton Dstrbuton y s s c c ε ε Optonal Optonal Optonal To compute the standard devaton, choose the opton for computng wth standard devaton. 9
101 Domnance Ths secton loos at the prmal domnance condtons for orderng poverty and nequalty across two dstrbutons of lvng standards. Correspondng dual domnance condtons are consdered n the secton on Curves. Poverty domnance Dstrbuton domnates dstrbuton at order s over the condtonal range [ ], z + only f: + ( ζ; α) > P ( ζ; α) ζ [ z, z ] α = s. P for z f Ths nvolves comparng stochastc domnance curves at order s or FGT curves wth α = s. Ths applcaton checs for the ponts at whch there s a reversal of the domnance condtons. Sad dfferently, t provdes the crossng ponts of the domnance curves, that s, the values of ζ and ( ζ; α) for whch ( ζ ; α) = P ( ζ; ) when P P α ( ζ η; α) P ( ζ η; α)) = sgn (P ( ζ + η; α) P ( ζ + η; α)) sgn (P for a small η. The crossng ponts of ζ can also be referred to as crtcal poverty lnes. To chec for the crossng ponts of the domnance curves of two dstrbutons: - From man menu, choose the tem: "Domnance Poverty Domnance". - After confrmng the confguraton, the applcaton appears. Choose the dfferent vectors and parameter values as follows: Indcaton Vector or parameter Choce s: Dstrbuton Dstrbuton Varable of nterest y y Sze varable s s Optonal Group Varable c c Optonal Group Number Optonal s s
102 Commands: "Compute": to provde the crtcal poverty lnes and the crossng ponts of the sample domnance curves. When the opton wth STD s specfed, the standard devaton on the estmates of the crtcal poverty lnes and on the estmates of the crossng ponts of the FGT curves are also gven. "Range": to specfy the range of poverty lnes over whch to chec for the presence of crtcal poverty lnes. Wth ths command, you can also specfy the ncremental step of search for these crossng ponts. "Graph": to draw the FGT curves for the two dstrbutons. Inequalty domnance Dstrbuton domnates dstrbuton n nequalty at order s over the condtonal range of proportons of the mean + [, l ] + P ( λµ, α) > P ( λµ, α) λ [ l, l ] where α = s l only f These are normalsed stochastc domnance curves at order s or normalsed FGT curves for α = s. Ths applcaton checs for the ponts at whch there s a reversal of the above domnance condtons for nequalty orderngs. Sad dfferently, t provdes the crossng ponts of the FGT curves, that s, the values of λ and ( λµ ; α) for whch P α ( λµ ; α) = P ( λµ ; ) when P sgn (P (( λ η ) µ ; α) P (( λ η ) µ ; α)) = sgn (P (( λ + η ) µ ; α) P (( λ + η ) µ ; for a small η. α These crossng ponts at λ can also be referred to as crtcal relatve poverty lnes, when the poverty lnes are a proporton of the mean and when the ndces are normalsed by the poverty lne. To chec for those crossng ponts: - From man menu, choose the tem: "Domnance Inequalty Domnance". - After confrmng the confguraton, the applcaton appears. Choose the dfferent vectors and parameter values as follows: ))
103 Indcaton Vector or parameter Choce s: Dstrbuton Dstrbuton Varable of nterest y y Sze varable s s Optonal Group Varable c c Optonal Group Number Optonal s s Commands: "Compute": to provde the crtcal relatve poverty lnes and the crossng ponts of the sample normalsed domnance curves. When the opton wth STD s specfed, the standard devaton on the estmates of the crtcal relatve poverty lnes and on the estmates of the crossng ponts of the normalsed FGT curves are also gven. "Range": to specfy the range of λ over whch to chec the presence of crtcal values. Wth ths command, you can also specfy the ncremental step of search for these crossng ponts. "Graph": to draw the normalsed FGT curves for the two dstrbutons along values of the parameter λ. Indrect tax domnance Taxng commodty s better than taxng commodty at order of domnance s over the condtonal range [ z ], z + s s f only f: + CD (; ζ) > γcd (; ζ) ζ [ z, z ]. These are CD curves of order s. If ths condton holds, then an ncrease n the prce of good, wth the beneft of a decrease n the prce of good, wll decrease poverty for poverty lnes between z - and z + and for poverty ndces of order s. The rato of the margnal cost of publc funds (MCPF) from a tax on over the MCPF from a tax on s also used to determne whether ncreasng the tax on for the beneft of decreasng the tax on good can be deemed to be socally effcent. Ths applcaton computes dfferences between CD s (; ζ ) and γ CD s (; ζ). It also checs for the ponts at whch there s a reversal of the domnance condtons. Sad dfferently, t provdes the crossng ponts of the CD curves, that s, the values of ζ and CD s (; ζ) for whch CD (; ζ) = γcd (; ζ) s s s s when sgn (CD (; ζ η) γcd (; ζ η)) = sgn (CD (; ζ + η) CD (; ζ + η)) for a small η. The crossng ponts of ζ can also be referred to as crtcal poverty lnes. s s 3
104 Crtcal values of γ are also provded. These are the mnmum of α+ α+ over an nterval [ ] CD (;z)/ CD (;z) z, z + of poverty lnes z. It gves the maxmum rato of the MCPF (for commodty over that for commodty ) up to whch taxng commodty can be deemed socally effcent. To use these functons: - From the man menu, choose the tem: " Domnance Indrect tax domnance". - Choose the dfferent vectors and parameter values as follows: Indcaton Varables or parameters Choce s: Varable of nterest y Sze varable s Optonal Commodty x Commodty x Group Varable c Optonal Group Number Optonal Poverty lne z s s gamma γ Commands: " Crtcal z : to compute the values of the poverty lnes at whch the CD curves CD s (;z) and γ CD s (;z) cross. To specfy a range for a search of crossng ponts, choose the command Range. " Crtcal? : to compute the crtcal gamma for tax domnance. The range [ z ], z + s specfed under Range. "Dfference : to compute the dfference CD (;z) γcd(;z). "Graph : to draw the value of CD s (;z) and γ CD s (;z) as a functon of a range of poverty lnes z. To specfy that range, choose the command Range. Step : the value of the ncremental steps wth whch the crtcal z s searched. s s 4
105 Curves A number of curves are useful to present a general descrptve vew of the dstrbuton of lvng standards. Many of these curves can also serve to chec the robustness of dstrbutve orderngs n terms of poverty, nequalty, socal welfare and equty. Quantles and normalsed quantles Remar: The applcaton for computng normalsed quantles s smlar n structure to the one for computng quantles. The p-quantle at a percentle p of a contnuous populaton s gven by: Q(p) = F (p) where p = F(y) s the cumulatve dstrbuton functon at y. For a dscrete dstrbuton, let the n observatons of lvng standards be ordered, such that y y y y+ yn. If p [ F(y ), F(y+ ) ], then we defne Q (p) = y +. The normalsed quantle s defned as Q (p) = Q(p) / µ. Case : One dstrbuton To compute the quantles of one dstrbuton: - From the man menu, choose the tem: "Curves Quantle". - In the confguraton of applcaton, choose dstrbuton. 3- Choose the dfferent vectors and parameter values as follows: Commands: Indcaton Varables or Choce s: parameters Varable of nterest y Sze Varable s Optonal Group Varable c Optonal Group Number Optonal p p "Compute : to compute the quantle at a pont p. To compute the standard devaton, choose the opton for computng wth standard devaton.
106 "Graph : to draw the value of the curve accordng to the parameter p. To specfy a range for the horzontal axs (for the p values), choose the tem "Graph Management Change range of x " from the man menu. Case : Two dstrbutons To compute the quantles of two dstrbutons: - From the man menu, choose the tem: "Curves Quantle". - In the confguraton of applcaton, choose dstrbutons. 3- Choose the dfferent vectors and parameter values as follows: Indcaton Vector or parameter Choce s: Varable of nterest Sze Varable Group Varable Group Number p Dstrbuton Dstrbuton y y s s c c p p Optonal Optonal Optonal Commands: "Crossng": to chec f the two quantle curves ntersect. If the two curves ntersect, DAD ndcates the co-ordnates of the frst ntersecton and ther standard devaton f the opton of computng wth standard de vaton s chosen. To see an ntersecton over a partcular range of p, use Range to specfy ths range. "Dfference" : to compute the dfference Q(p) Q (p). "Graph" : to draw the dfference Q(p) Q (p) along values of the parameter p. "Range": to specfy the range for the search for a crossng of the two curves. also specfes the range of the horzontal axs.
107 Poverty Gap Curve The poverty gap quantle at a percentle p s: g (p;z) = (z Q(p)) + Case : One dstrbuton To compute the poverty gap quantle for one dstrbuton: - From the man menu, choose the tem: "Curves Poverty gap quantle". - In the confguraton of applcaton, choose dstrbuton. 3- Choose the dfferent vectors and parameter values as follows: Commands: Indcaton Varables or Choce s: parameters Varable of nterest y Sze Varable s Optonal Group Varable c Optonal Group Number Optonal Poverty lne z p p "Compute": to compute g (p; z). To compute the standard devaton, choose the opton for computng wth standard devaton. "Graph": to draw the value of g (p; z) as a functon of p. To specfy a range for the horzontal axs, choose the tem " Graph Management Change range of x " from the man menu. To compute the standard devaton, choose the opton for computng wth standard devaton. Case : Two dstrbutons To reach the applcaton for two dstrbutons: - From the man menu, choose the tem: "Curves Poverty Gap Quantle". - In the confguraton of applcaton, choose dstrbutons. 3- Choose the dfferent vectors and parameter values as follows: 3
108 Indcaton Vectors or parameters Choce s: Varable of nterest Sze Varable Group Varable Group Number Poverty lne p Dstrbuton Dstrbuton y y s s c c z z p p Optonal Optonal Optonal Commands: "Crossng" : to search the frst ntersecton of the curves. If the two curves ntersect, DAD ndcates the co-ordnates of the frst ntersecton and ther standard devaton f the opton of computng wth standard devaton s chosen. To see an ntersecton over a partcular range, use Range "Dfference" : to compute the dfference g(z;p ) g(z;p). "Graph" : to draw the dfference g(z,p) g(z;p) as a functon of p. "Range": to specfy the range for the search for a crossng between the two curves. Ths also specfes the range of the horzontal axs. Lorenz curve and generalsed Lorenz curve The Lorenz curve at p for a populaton subgroup s gven by: L(;p) = n w = y I(y n = w Q(;p)) where I(y Q(;p)) = f y Q(;p) and 0 otherwse. Q (; p) s the p- quantle of the subgroup. The generalsed Lorenz curve at p for a populaton subgroup s: y GL (; p) = µ.l(; p) Remar: The applcaton for the Lorenz curve s smlar n structure to the one for the generalsed Lorenz curve 4
109 Case : One dstrbuton To compute the Lorenz curve for one dstrbuton: - From the man menu, choose the tem: "Curves Lorenz curve". - In the confguraton of applcaton, choose dstrbuton. 3- Choose the dfferent vectors and parameter values as follows: Indcaton Varables or Choce s: parameters Varable of nterest y Sze Varable s Optonal Group Varable c Optonal Group Number Optonal rho ρ p p Commands: "Compute": to compute L (; p). To compute the standard devaton, choose the opton for computng wth standard devaton. "Graph": to draw the Lorenz curve. To specfy a range for the horzontal axs, choose the tem "Graph Management Change range of x" from the man menu. "Range": to specfy the range of the horzontal axs. To compute the standard devaton, choose the opton for computng wth standard devaton. Case : Two dstrbutons To compute the Lorenz curve wth two dstrbutons: - From the man menu, choose the tem: "Curves Lorenz curve". - In the confguraton of applcaton, choose for the number of dstrbutons. 3- Choose the dfferent vectors and parameter values as follows: 5
110 Indcaton Vectors or parameters Choce s: Varable of nterest Sze Varable Dstrbuton Dstrbuton y y s s Group Varable c c Group Number rho p ρ ρ p p Optonal Optonal Optonal Commands: "Crossng": to search the frst ntersecton of the curves. If the two curves ntersect, DAD ndcates the co-ordnates of the frst ntersecton and ther standard devaton f the opton of computng wth standard devaton s chosen. To see an ntersecton over a partcular range, use Range. "Dfference": to compute the dfference: L(;p) L( ; p ). "Graph": to draw the dfference L(;p) L(;p) as a functon of p. "Range": to specfy the range for the search of a crossng between the two curves. Ths also specfes the range of the horzontal axs. "S-Gn": to compute the dfference I (; ρ ) I (; ρ). "Covarance": to compute the followng covarance matrx: Cov(L ( ;0.),L Cov(L ( ;0.),L ( Cov(L ( ;),L ( ( ;0.)) ;0.)) ;0.)) Cov(L Cov(L ( ;0.),L ( Cov(L ( ( ;0.),L ;),L ( ( ;0.)) ;0.)) ;0.)) Cov(L ( ;0.),L ( Cov(L ( ;),L ( ;)) ;)) Concentraton curve and generalsed concentraton curve The concentraton curve for the varable T ordered n terms of y at p and for a populaton subgroup s: C T (; p) = n = w T I(y n = w Q(; p)) T 6
111 where I(y Q(;p)) = f y Q(; p) and 0 otherwse. Q (; p) s the p- quantle of y for the subgroup. The generalsed concentraton curve at p for a populaton subgroup p s: C T n w = (; p) = T I(y n = Q(; p)) Remar: The applcaton for the concentraton curve s smlar n structure to the one for the generalsed concentraton curve w Case : One dstrbuton To compute the concentraton curve for one dstrbuton: - From the man menu, choose the tem: "Curves concentraton curve". - In the confguraton of applcaton, choose dstrbuton. 3- Choose the dfferent vectors and parameter values as follows: Commands: Indcaton Varables or Choce s: parameters Varable of nterest T Ranng varable y Sze Varable s Optonal Group Varable c Optonal Group Number Optonal rho ρ p p "Compute": to compute the concentraton curve C (; p). To compute the standard devaton, choose the opton for computng wth standard devaton. "Graph": to draw the concentraton curve. To specfy a range for the horzontal axs, choose the tem "Graph Management Change range of x " from the man menu. "Range: to specfy the range of the horzontal axs. To compute the standard devaton, choose the opton for computng wth standard devaton. 7
112 Case : Two dstrbutons To compute the concentraton curve of two dstrbutons: - From the man menu, choose the tem: "Curves Concentraton curve". - In the confguraton of applcaton, choose dstrbutons. 3- Choose the dfferent vectors and parameter values as follows: Indcaton Vectors or parameters Choce s: Ranng varable Varable of nterest Sze Varable Group Varable Group Number rho p Dstrbuton Dstrbuton y y T T s s c c ρ ρ p p Optonal Optonal Optonal Commands: "Crossng : to search the frst ntersecton of the curves. If the two curves ntersect, DAD ndcates the co-ordnates of the frst ntersecton and ther standard devaton f the opton of computng wth standard devaton s chosen. To see an ntersecton over a partcular range, use Range. "Dfference : to compute the dfference n the concentraton curves. "Graph : to draw the dfference n the curves as a functon of p. "Range": to specfy the range for the search of a crossng between the two curves. Ths also specfes the range of the horzontal axs. "S-Gn": to compute the dfference IC (; ρ ) IC ( ; ρ). "Covarance": to compute the followng covarance matrx: Cov (C ( ;0.), C ( Cov (C ( ;0.), C ( Cov (C ( ;), C ( ;0.)) ;0.)) ;0.)) Cov (C ( ;0.), C ( Cov (C ( ;0.), C ( Cov (C ( ;), C ( ;0.)) ;0.)) ;0.)) Cov (C ( ;0.), C ( Cov (C ( ;), C ( ;)) ;)) 8
113 The Cumulatve Poverty Gap (CPG) curve The CPG curve at p for a subgroup and poverty lne z s: Case : One dstrbuton G(;p;z) = n = w (z y ) + I(y n = w Q(;p)) To compute the CPG curve for one dstrbuton: - From the man menu, choose the tem: "Curves CPG curve". - In the confguraton of applcaton, choose dstrbuton. 3- Choose the dfferent vectors and parameter values as follows: Commands: Indcaton Varables or Choce s: parameters Varable of nterest y Sze Varable s Optonal Group Varable c Optonal Group Number Optonal Poverty lne z p p "Compute": to compute G (; p; z). To compute the standard devaton, choose the opton for computng wth standard devaton. "Graph": to draw the curve as a functon accordng of p. To specfy a range for the horzontal axs, choose the tem "Graph Management Change range of x" from the man menu. To compute the standard devaton, choose the opton for computng wth standard devaton. Case : Two dstrbutons To reach the applcaton for two dstrbutons: - From the man menu, choose the tem: "Curves CPG curve". - In the confguraton of applcaton, choose dstrbutons. 9
114 3- Choose the dfferent vectors and parameter values as follows:. Indcaton Vectors or parameters Choce s: Varable of nterest Sze Varable Group Varable Group Number Poverty lne rho p Dstrbuton Dstrbuton y y s s c c z z ρ ρ p p Optonal Optonal Optonal Commands: "Crossng": to search the frst ntersecton of the curves. If the two curves ntersect, DAD ndcates the co-ordnates of the frst ntersecton and ther standard devaton f the opton of computng wth standard devaton s chosen. To see an ntersecton over a partcular range, use Range. "Dfference": to compute the dfference: G(; p;z) G ( ; p;z). "Graph": to draw the dfference G ( ; p; z ) G ( ; p; z ) as a functon of p. "Range": to specfy the range for the search for a crossng between the two curves. Ths also specfes the range of the horzontal axs. "S-Gn": to compute the dfference P (z; ρ ) P (z; ρ). "Covarance": to compute the followng covarance matrx: Cov(G ( ;0.;z ),G ( ;0.;z )) Cov(G ( ;0.;z ),G ( ;0.;z )) Cov(G ( ;;z ),G ( ;0.;z )) Cov(G ( ;0.;z ),G ( ;0.;z )) Cov(G ( ;0.;z ),G ( ;0.;z )) Cov(G ( ;;z ),G ( ;0.;z )) Cov(G ( ;0.;z ),G ( ;;z )) Cov(G ( ;;z ),G ( ;;z )) 0
115 C-Domnance Curve The th j Commodty or Component domnance curve s defned as follows: [ ] = = = = = + = + = = s f w y ) y K(z w f (z) z y E y s f y ) y (z w w ) (s s) (;z, CD n j n j j s n n j where K( ) s a ernel functon. Domnance of order s s che ced by settng α=s-. The C-Domnance curve normalzed by z, whch s denoted by CD, s gven by: [ ] = = = = = + = + = = α s f w y ) y K(z w f (z) z y E y s f y ) y (z w w z ) (s s) (;z, CD n j n j j s n n j The C-Domnance curve normalzed by the mean s defned as j j CD µ, and the C- Domnance curve normalzed both by z and the mean equals: j j CD µ. Case : One dstrbuton To compute the C-Domnance curve for one dstrbuton: - From the man menu, choose: "Curves C-Domnance curve". - In the confguraton of applcaton, choose dstrbuton. 3- Choose the dfferent vectors and parameter values as follows:
116 Indcaton Varables or parameters Choce s: Varable of nterest y Component y j Sze Varable sz Optonal Group Varable c Optonal Group Number Optonal Order s s Poverty lne z Among the buttons, you wll fnd: "Compute : to compute the C-Domnance curve at z and for a gven alpha. To obtan the standard devaton, choose the opton for computng wth a standard devaton. "Graph : to draw the value of the C-Domnance curve over a range of z. Case : Two dstrbutons To reach the applcaton for two dstrbutons: - From the man menu, choose: "Curves C-Domnance curve ". - In the confguraton of applcaton, choose dstrbutons. 3- Choose the dfferent vectors and parameter values as follows: Commands: Indcaton Vectors or parameters Choce s: Varable of nterest Dstrbuton Dstrbuton y y Component y,j y,j Sze Varable sz sz Optonal Group Varable c c Optonal Group Number Optonal Poverty lne z z Order s s s, j,j "Dfference": to compute the dfference: CD (;z,s) CD (;z, s). "Graph": to draw the dfference, j,j CD (;z, s) CD (;z, s) as a functon of z. "Range": to specfy the range of the horzontal axs.
117 The Relatve Deprvaton curve Let the relatve deprvaton of an ndvdual wth ncome Q(p), when comparng hmself to another ndvdual wth ncome Q(q), be gven by: δ ( q, p) 0, = Q(q) Q(p) f Q(p) Q(q) otherwse The expected relatve deprvaton of an ndvdual at ran p s then δ (p) : δ( p) = δ(q, p)dq 0 Case : One dstrbuton To compute the relatve deprvaton curve for one dstrbuton: - From the man menu, choose the tem: "Curves Relatve Deprvaton curve". - In the confguraton of applcaton, choose dstrbuton. 3- Choose the dfferent vectors and parameter values as follows: Commands: Indcaton Varables or Choce s: parameters Varable of nterest y Sze Varable s Optonal Group Varable c Optonal Group Number Optonal p p "Compute": to compute δ (p). To compute the standard devaton, choose the opton for computng wth standard devaton. "Graph": to draw the curve as a functon accordng of p. To specfy a range for the horzontal axs, choose the tem "Graph Management Change range of x " from the man menu. To compute the standard devaton, choose the opton for computng wth standard devaton. 3
118 Case : Two dstrbutons To reach the applcaton for two dstrbutons: - From the man menu, choose the tem: "Curves Relatve Deprvaton curve". - In the confguraton of applcaton, choose dstrbutons. 3- Choose the dfferent vectors and parameter values as follows: Indcaton Vectors or parameters Choce s: Varable of nterest Sze Varable Group Varable Group Number p Dstrbuton Dstrbuton y y s s c c p p Optonal Optonal Optonal Commands: "Dfference": to compute the dfference: δ p ) (p ) ( δ 4
119 Redstrbuton Ths secton regroups the followng applcatons: - Estmatng the progressvty of a tax or a transfer. - Comparng the progressvty of two taxes or two transfers. 3- Comparng the progressvty of a transfer and a tax. 4- Estmatng horzontal nequty. 5- Estmatng redstrbuton. 6- Estmatng a coeffcent of concentraton. Estmatng the progressvty of a tax or a transfer Let: - X be gross ncome; - T be a tax; - B be a transfer. ) TR progressvty: A tax T s TR-progressve f L X (p) CT (p) > 0 A transfer B s TR-progressve f CB (p) LX (p) > 0 ) IR-progressvty: p ] 0,[ p ] 0, [ A tax T s IR-progressve f CX T (p) L X(p) > 0 p ] 0, [ + B (p) L X (p) p ] 0, [ A transfer B s IR-progressve f CX > 0 To reach ths applcaton: - From the man menu, choose the tem: «Redstrbuton Tax or transfer". - Specfy f you wsh to estmate the progressvty of a tax or of a transfer. 3- Choose the approach to be ether TR or IR. 4- Choose the dfferent vectors and parameter values as follows
120 Indcaton Varables or parameters Choce s: Gross ncome X Tax (transfer) T or B Sze varable s Optonal Group Varable c Optonal Group number Optonal rho ρ p p Commands: The command "S-Gn": to compute: TR Approach IR Approach Tax ICT( ρ ) IX( ρ) IX ( ρ) ICX T ( ρ) Transfer I ( ρ ) IC ( ρ) I ( ) IC ( ρ) X B X ρ X+ B where IC( ρ ) s the S-Gn coeffcent of concentraton and I( ρ ) s the S-Gn ndex of nequalty. The command "Crossng": to see the frst ntersecton of the concentraton and Lorenz curves. DAD ndcates the co-ordnates of that frst ntersecton and ther standard devaton f the opton of computng wth standard devaton s chosen. The command "Dfference": to compute: TR Approach IR Approach Tax L X(p) CT (p) CX T(p) LX (p) Transfer CB (p) L X(p) CX+ B (p) LX (p) The command "Range": to specfy a range of p for the search of the frst ntersecton between the two curves. The command also allows to specfy the range of the horzontal axs n the drawng of a graph. The command "Graph": to draw the followng dfferences as a functon of p: TR Approach IR Approach Tax L X(p) CT (p) C X T(p) LX (p) Transfer CB(p) LX(p) CX+ B(p) LX(p)
121 Comparng the progressvty of two taxes or transfers Let: - X be gross ncome; - T and T be two taxes; - B and B be two transfers. ) TR Approach : T s more TR-progressve than T f : CT (p) CT (p) > 0 B s more TR-progressve than B f : (p) C (p) 0 ) IR approach : p ] 0,[ p ] 0, [ CB B > T s more IR-progressve than T f : (p) C (p) 0 B s more IR-progressve than To reach ths applcaton: CX T X T > p ] 0,[ + B(p) CX+ B (p) p ] 0,[ CX > B f : 0 - From the man menu, choose the tem: «Redstrbuton Transfer-Tax vs Transfer- Tax". - In front of the ndcators "Tax (Transfer)" and, specfy the two vectors of taxes or transfers. 3- Choose the approach to be ether TR or IR. 4- Choose the dfferent vectors and parameter values as follows: Indcaton Varables or parameters Choce s: Gross ncome X Tax (transfer) T or B Tax (transfer) T or B Sze varable s Optonal Group Varable c Optonal Group number Optonal rho ρ p p 3
122 Commands: The command "S-Gn": to compute: TR Approach IR Approach Tax ICT ( ρ ) ICT ( ρ) ICX T( ρ) ICX T( ρ) Transfer ICB ( ρ ) ICB( ρ) ICX+ B( ρ ) ICX+ B( ρ) where IC( ρ ) s the S-Gn coeffcent of concentraton. The command "Crossng": to see the frst ntersecton of the two concentraton curves. DAD ndcates the co-ordnates of that frst ntersecton and ther standard devaton f the opton of computng wth standard devaton s chosen. The command "Dfference": to compute: TR Approach IR Approach Tax CT(p) CT (p) CX T (p) CX T (p) Transfer CB (p) CB(p) CX + B (p) CX + B (p) The command "Range ": to specfy a range of p for the search of the frst ntersecton between the two curves. The command also allows to specfy the range of the horzontal axs n the drawng of a graph. The command "Graph : To draw the followng curves as a functon of p: TR Approach IR Approach Tax CT(p) CT (p) C X T( p ) C X T ( p ) Transfer CB (p) CB(p) CX + B (p) CX + B (p) Comparng the progressvty of a transfer and of a tax Let : - X be gross ncome; - T be a tax; - B a transfer. TR Approach: The transfer B s more TR-progressve than a tax T f: C (p) L (p) > L (p) C (p) p ] 0, [ IR Approach : The transfer B s more IR-progressve than a tax T f: C (p) C (p) p ] 0, [ B X+ B > X X T X T 4
123 To reach ths applcaton: - From the man menu, choose the tem: «Redstrbuton Transfer vs Tax". - Choose the approach to be ether TR or IR 3- Choose the dfferent vectors and parameter values as follows: Indcaton Varables or parameters Choce s: Gross ncome X Varable of tax T Varable of transfer B Sze varable s Optonal Group varable c Optonal Group number Optonal Rho ρ p p Commands: The command "S-Gn": to compute: TR Approach IR Approach I X( ρ ) ICT( ρ) ICB ( ρ) IC X T( ρ ) IC X+ B( ρ) where IC( ρ ) s the coeffcent of concentraton. The command "Crossng" : to see the frst pont at whch the progressvty ranng of the tax and transfer s reversed. DAD ndcates the co-ordnates of that frst reversal and ther standard devaton f the opton of computng wth standard devaton s chosen. These co-ordnates are: TR Approach IR Approach C B (p) L X (p) C X+ B (p) The command "Dfference" : to compute: C T TR Approach IR Approach (p) + C (p) L (p) C (p) C (p) B X X+ B The command "Range": to specfy a range of p for the search of the frst reversal of the progressvty ranng. The command also allows to specfy the range of the horzontal axs n the drawng of a graph. The command "Graph : to draw the followng curves as a functon of p: X T 5
124 C Horzontal nequty T TR Approach IR Approach (p) + C (p) L (p) C (p) C (p) B X X+ B A tax or a transfer T causes reranng (and s therefore horzontally nequtable) f: Tax : CX T (p) L X T(p) > 0 Transfer : C (p) L (p) 0 for at least one value of p ] 0,[ + T X+ T for at least one value of p ] 0,[ X > To reach ths applcaton: - From the man menu, choose the tem: «Redstrbuton Horzontal nequty". - Specfy f you are usng a tax or a transfer. 3- Choose the dfferent vectors and parameter values as follows: Commands: X T Indcaton Varables or parameters Choce s: Gross ncome X Tax (transfer) T or B Sze varable s Optonal Group varable c Optonal Group numberof nterest Optonal rho ρ p p The command "S-Gn" : to compute: Tax Transfer IX T ( ρ) ICX T ( ρ) IX + B( ρ ) ICX + B( ρ) The command "Dfference" : to compute: Tax Transfer CX T (p) LX T (p) CX + B(p) LX+ B(p) The command "Range": to specfy the range of the horzontal axs n the drawng of a graph. The command "Graph" : To draw the followng curves as a functon of p: 6
125 C X Tax Transfer T(p) LX T (p) C X + B (p) L X+ B (p) Redstrbuton A tax or a transfer T redstrbutes f : Tax : L X T(p) LX (p) > 0 Transfer : L (p) L (p) 0 p ] 0,[ + B X p ] 0,[ X > To reach ths applcaton: - From the man menu, choose the tem: «Redstrbuton Redstrbuton". - Specfy f you are usng a tax or a transfer. 3- Choose the dfferent vectors and parameter values as follows: Indcaton Varables or parameters Choce s: Basc varable X Interest varable T or B Sze varable s Optonal Group varable c Optonal Group number Optonal rho ρ p p Commands: The command "S-Gn": to compute: I X Tax Transfer ( ρ) I ( ρ) I ( ) I ( ρ) X T X ρ X+ B The command "Crossng": to see the frst pont at whch the curves L X T (p) and L X (p), or L X+ B (p) and L X (p), cross. DAD ndcates the co-ordnates of that frst crossng and ther standard devaton f the opton of computng wth standard devaton s chosen. The command "Dfference: wth ths command, to compute: 7
126 L X Tax Transfer T(p) LX (p) L X+ B(p) LX (p) The command "Range": to specfy a range of p for the search of the frst ntersecton between the two curves. The command also allows to specfy the range of the horzontal axs n the drawng of a graph. The command "Graph" : to draw the followng curves as a functon of p: L X Tax Transfer T(p) LX (p) L X+ B(p) LX (p) The coeffcent of concentraton Let a sample contan n jont observatons, ( y, T ), on a varable y and a varable T. Let observatons be ordered n ncreasng values of y, n such a way that y y. The S- + Gn coeffcent of concentraton of T for the group s denoted as IC T (; ρ ) and defned as: IC T (; ρ) = n ρ (V ) (V [ V ] µ = ρ + ) ρ T T where n V =. w h h= One dstrbuton To compute the coeffcent of concentraton for only one dstrbuton: - From the man menu, choose the followng tem: "Redstrbuton Coeffcent of concentraton". - In the confguraton of the applcaton, choose dstrbuton. 3- After confrmng the confguraton, the applcaton appears. Choose the dfferent vectors and parameter values as follows: Indcaton Varables or Choce s: parameters Ranng varable y Varable of nterest T Sze varable s Optonal Group Varable c Optonal 8
127 Group number Optonal rho ρ Commands: The command "Compute": to compute the coeffcent of concentraton. To compute the standard devaton of ths ndex, choose the opton for computng wth standard devaton. The command "Graph : to draw the value of the coeffcent as a functon of the parameter ρ. To specfy a range for the horzontal axs, choose the tem " Graph management Change range of x " from the man menu. Two dstrbutons To reach ths applcaton: - From the man menu, choose the tem: "Redstrbuton Coeffcent of concentraton". - In the confguraton of applcaton, choose dstrbutons. 3- Choose the dfferent vectors and parameter values as follows: Indcaton Vectors or parameters Choce s: Varable of nterest Ranng varable Sze varable Group varable Group number rho Dstrbuton Dstrbuton T T y y s s c c ρ ρ Optonal Optonal Optonal Press «Compute» to compute the concentraton coeffcents and ther dfference for each of the two varables of nterest. To compute the standard devaton of those estmates, choose the opton for computng wth standard devaton. 9
128 Descrptve statstcs Dstrbuton Ths applcaton provdes basc descrptve statstcs on varables n the database: the mean, the standard devaton, and the mnmum and the maxmum values of each of the vectors. To reach ths applcaton: - From the man menu, choose: "Dstrbuton Statstcs". - Choose the data bases f you have actvated two databases. 3- Choose the weght varable f the observatons must be weghted. 4- Choose the group varable and the group number f you would le to compute the statstcs for a specfc group. The results are as follows: Name of varable Mean Standard devaton Mnmum Maxmum Name of varable Mean Standard devaton Mnmum Maxmum : : : : : Statstcs Ths applcaton computes basc descrptve statstcs for a gven varable of nterest, as well as the rato of two such varables. The applcaton also computes the effect of the samplng desgn on the samplng error of these basc statstcs. - Total = w x - 3- Mean = Rato = w x w w w x y To actvate ths applcaton for one dstrbuton, follow these steps: - From the man menu, choose: "Dstrbuton Statstcs". - In the confguraton of applcaton, choose dstrbuton. 3- Choose the dfferent vectors and parameter values as follows:
129 Indcaton Varables or Choce s parameters Varable of nterest x Sze Varable s(x) Optonal Varable of nterest y Optonal Sze Varable s(y) Optonal Group Varable c Optonal Group Number Optonal To actvate ths applcaton for one dstrbuton, follow these steps: - From the man menu, choose the tem: "Dstrbuton Statstcs". - In the confguraton of applcaton, choose dstrbutons. 3- Choose the dfferent vectors and parameter values as follows: Indcaton Vector or parameter Choce s Dstrbuton Dstrbuton Varable of nterest x x Sze Varable s(x) s(x) Optonal Varable of nterest y y Optonal Sze Varable s(y) s(y) Optonal Group Varable c c Optonal Group Number Optonal Densty functon The gaussan ernel estmator of a densty functon f ( x) s defned as: fˆ (x) = w K n = w (x) and K (x) = h exp π ( 0.5 λ (x) ) and λ (x) = x x h where h s a bandwdth whch acts as a smoothng parameter.
130 To reach ths applcaton: - From the man menu, choose the tem: "Dstrbuton Densty functon". - Choose the dfferent vectors and parameter values as follows: Indcaton Varables or parameters Choce s: Varable of nterest y Sze varable s Optonal Group Varable c Optonal Group Number Optonal Parameter y Smoothng parameter h Optonal On the frst executon bar, you fnd: The command Compute : to compute f ( x). To compute the standard devaton, choose the opton for computng wth standard devaton. The command Graph : to draw the value of the functon as a functon of x. To specfy a range for the horzontal axs, choose the tem "Graph management Change range of x " from the man menu. The command Range : to specfy the range of the horzontal axs To compute the standard devaton, choose the opton for computng wth standard devaton. Corrected boundary Kernel estmators A problem occurs wth ernel estmaton when a varable of nterest s bounded. It may be for nstance that consumpton s bounded between two bounds, a mnmum and a maxmum, and that we wsh to estmate ts densty close to these two bounds. If the true value of the densty at these two bounds s postve, usual ernel estmaton of the densty close to these two bounds wll be based. A smlar problem occurs wth nonparametrc regressons. One way to allevate these problems s to use a smooth corrected Kernel estmator, followng a paper by Peter Bearse, Jose Canals and Paul Rlstone. A boundary-corrected Kernel densty estmator can then be wrtten as where fˆ(x) w K * = n = (x)k w (x) 3
 = M ls = K( λ)p( λ)p( λ) dλ ls : A =, B =, ls A h h = ( 0 0 0) mn s the mnmum bound, and max s the maxmum one. h s the usual bandwdth. Ths correcton removes bas to order h s.")
131 K (x) = h exp π ( 0.5 λ (x) ) and λ (x) = x x h and where the scalar K * (x) s defned as * K (x) = ψ(x) P( λ (x)) P( λ) = λ λ! s λ ( s )! B x max x mn ψ( x) = M ls = K( λ)p( λ)p( λ) dλ ls : A =, B =, ls A h h = ( 0 0 0) mn s the mnmum bound, and max s the maxmum one. h s the usual bandwdth. Ths correcton removes bas to order h s. DAD offers four optons, wthout correcton, and wth correcton of order, and 3. Example : Suppose that an observed vector of nterest y taes the form : y={,,3, +.999,000} because t s drawn from a unform dstrbuton. The densty at any ncome between 0 and 000 s the same and equals /000. The followng fgure shows the mpact of the above correcton on the densty estmaton: 4
/=50500. The populaton densty equals f(x)=x/500.")
132 Ths shows that a correcton of order corrects well the boundary problem of estmatng the densty close to 0 and 000. Example : Suppose that an observed vector of nterest y taes the form : y={,,,3,3,3,,.000,000}. The total number of observatons sums to N=000*(+000)/= The populaton densty equals f(x)=x/500.the followng fgure shows the mpact of a correcton of order and on the densty estmaton: The jont densty functon The gaussan ernel estmator of the jont densty functon f (x,y) s defned as: fˆ (x, y) n = w n = w h = To reach ths applcaton:. π x x exp h + y y h - From the man menu, choose the tem: "Dstrbuton Jont densty functon". - Choose the dfferent vectors and parameter values as follows: 5
133 Indcaton Varables or parameters Choce s: Varable of nterest x Varable of nterest y Sze varable s Optonal Group Varable c Optonal Group Number Optonal Parameter x Parameter y Smoothng parameter h Optonal On the frst executon bar, you fnd: The command Compute : to compute the estmate of the jont densty functon. To compute the standard devaton, choose the opton for computng wth standard devaton The dstrbuton functon To reach ths applcaton: - From the man menu, choose the tem: "Dstrbuton Dstrbuton functon". - Choose the dfferent vectors and parameter values as follows: Indcaton Varables or parameters Choce s: Varable of y nterest Sze varable s Optonal Group Varable c Optonal Group Number Optonal Parameter y On the frst executon bar, you fnd: The command Compute : to compute the estmate of the dstrbuton functon. To compute the standard devaton, choose the opton for computng wth standard devaton. 6
134 The command Graph : to draw the dstrbuton functon F(x) along values of x. To specfy a range for the horzontal axs, choose the tem "Graph management Change range of x " from the man menu. The command Range : to specfy the range of the horzontal axs Plot_Scatt_XY Ths applcaton plots a scatter graph of two varables. To actvate ths applcaton, choose from the man menu the tem: "Dstrbuton Plot_Scatt_XY. When the wndow of ths applcaton appears, choose the two X and Y varables and clc on the button Graph. You can also use the command Range to specfy the range of the horzontal axs (X). Non-parametrc regresson and non-parametrc dervatve regresson The Gaussan ernel regresson of y on x s as follows: α(x) Φ(y x) = = β(x) w K (x) y w K (x) From ths, the dervate of Φ (y x) wth respect to x s gven by Φ(y x) x = α(x) β(x) α(x) - β(x) β(x) Remar: the nstructons for non-parametrc dervatve regresson are smlar to those for non-parametrc regresson To reach ths applcaton: - From the man menu, choose the tem: "Dstrbuton Non-parametrc regresson". - Choose the dfferent vectors and parameter values as follows: Indcaton Varables or parameters Choce s: Exogenous Varable (X) x Endogenous Varable (Y) y Sze varable s Optonal Group Varable c Optonal Group Number Optonal Level of (X) or (p) x Smoothng parameter h Optonal 7
135 Remar : The opton "Level" vs "Percentle" allows the estmaton of the expected value of y ether at a level of x or at a p-quantle for x. Remar : The opton Normalsed vs Not normalzed by the mean or by x allows the estmaton of the expected value of y normalzed or not by x or by the overall mean of y. You wll fnd: The command Compute : to compute Φ (y x). To compute ts standard devaton, choose the opton for computng wth standard devaton. The command Compute h : to compute an optmal bandwdth accordng to the cross-valdaton method of Härdle (990), p When you clc on ths command, the followng wndow appears, gvng you the opton of choosng the mn/max bands and the percentage of observatons to be rejected on each sde of the range of x. The command Graph : to draw Φ ( y x ) as a functon of x. To specfy a range for the horzontal axs, choose the tem " Graph management Change range of x " from the man menu. The command Range : to specfy the range of the horzontal axs. Boundary-corrected non-parametrc regresson and nonparametrc dervatve regresson For the boundary-corrected non-parametrc regresson, the estmaton s as follows: Φ( y x) = w K w * K (x)k * (x)k The boundary-corrected non-parametrc dervate regresson s obtaned by dfferentatng the above wth respect to x: Φ (y x) = * * * * ( K (x) K (x) y + K (x)k (x) y ) w ( ) K (x) K (x) + K (x)k (x) * * w ( ) K (x)k (x) w K (x)k (x) w (x) (x) y 8
136 Note that: * K (x) = ψ(x) P( λ (x)) and P( λ) = λ λ! s λ ( s )! B x max x mn ψ( x) = M ls = K( λ)p( λ)p( λ) dλ ls : A =, B =, ls A h h = ( 0 0 0) * M (x) P( λ(x)) K (x) = l s P(w) + M (x) ls where x x M (x) M(x) = M (x) M (x) x x Condtonal standard devaton A ernel estmator for the Condtonal Standard Devaton of y at x can be defned as: ST(x) = w K(x, x) ( y y(x) ) w K(x, x) where K s a ernel functon and y(x) s the expected value of y condtonal on x. To reach ths applcaton: - From the man menu, choose: "Dstrbuton Condtonal Standard Devaton". - Choose the dfferent vectors and parameter values as follows: Indcaton Varables or parameters Choce s Exogenous Varable (X) x Endogenous Varable (Y) y Sze varable s Optonal Group Varable c Optonal Group Number Optonal Level of (X) or (p) Smoothng parameter h Optonal 9
137 Remar : The opton "Level" vs "Percentle" allows the estmaton of the condtonal standard devaton of y ether at a level of x or at a p-quantle for x. You wll fnd: The command Compute : to compute ST(x). The command Graph : to draw ST(x) as a functon of x. To specfy a range for the horzontal axs, choose the tem " Graph management Change range of x " from the man menu. The command Range : to specfy the range of the horzontal axs. Group nformaton Ths applcaton estmates the cross-group composton of a populaton. The group detals are provded by the user through ether or both of two Group varables. To reach ths applcaton: - From the man menu, choose: "Dstrbuton Group Informaton". - Choose the frst group varable. 3- Choose the sze varable f the observatons must be weghted by sze. 4- Choose the second group varable f you would le cross-group (or cross-tabulaton) nformaton to be provded across two groups. Example : 0
 OBS The number of observatons n the group W*S The sum of the products of Samplng Weght tmes Sze P(Group) The")
138 Ths example uses only one group varable INS-LEV (level of nstructon of the household head), categorzed as. Prmary. Secondary 3. Superor 4. Not avalable 5. None The output shows: Code The exact code of the group Group The group number: (,,3, ) OBS The number of observatons n the group W*S The sum of the products of Samplng Weght tmes Sze P(Group) The estmated proporton of populaton found n that group The use of two group varablesshows the followng nformaton:

139 Example : The Cross Table table shows the sum of the products of Samplng Weght tmes Sze for those observatons belongng to the two groups smultaneously. The second table, Probablty, shows the estmated proporton of the populaton who belong to both of the groups.

140 Edtng of results The edtng, savng and prntng of results Generally, the wndows of results tac the followng form: The wndow contans the name of the applcaton and the results of the executon. We can dvde these results, dsplayed n the last fgure, n three blocs: - General nformaton: ths frst bloc s composed of: Sesson date Executon tme Indcates the tme at whch the results were computed. Indcates the computaton tme.
.")
141 - The bloc of nputs composed by: Fle name OBS Parameter used Varable of nterest Sze varable Group varable Group Number Parameter ndcates the name of the fle that s used. ndcates the number of observatons. ndcates the value of the parameter used for ths computaton (see also the llustratons for the computaton of nequalty ndces). Indcates the name of the varable used to compute the ndex of nequalty. ndcates the sze of varable. Indcates the vector that contans group ndces (n ths applcaton, the choce of such a vector s optonal) Indcates the selected group number (by default, ts value equals one). Indcates to the user the names and the values of the parameters. The parameter names typcally refer to the defnton of ndces and curves. Optons : Indcates the optons selected for ths executon. 3- The thrd and last bloc contans the results of the executon. Index value Indcates the value of the ndex or pont estmated. The value wthn parentheses ndcates the standard devaton for ths estmate. One can select a number of decmal values for the prntng of results. To do ths, choose the command "Edt --> Change Decmal Number". The followng wndow appears. Choose the desred number of decmals and confrm the choce by clcng on the button "OK"

142 When another executon s performed, a new wndow appears wth the nformaton concernng ths new executon. One can return to and edt the nformaton on the prevous executons by actvatng the wndow of the prevous results. For ths, clc on the button representng the result (loo on the bottom of the wndow for the buttons Result, Result. Savng and prntng results DAD easly saves results n the HTML format. Ths allows the edton of these results wth browsers le Explorer or Netscape. To save the results, from the wndow of results choose the command Fle -> Save (html format). The followng wndow appears. After mang your choce of name and drectory, clc on the button "Save" to save the results. To prnt these results, choose from the man wndow the command "Fle --> Prnt". The prntng wndow appears; just choose the name of your prnter and confrm by clcng on the button "OK". 3


143 Graphs n DAD4.3 Drawng graphs Most applcatons n DAD offer the possblty of plottng graphs to llustrate the results of those applcatons. For example, the FGT poverty ndex applcaton can plot a curve of ths ndex aganst the Y axs accordng to alternatve levels of the poverty lne shown on the X axs as n the followng fgure: Changng graph propertes We can change many propertes of a graph. For ths, select the tem: Tools Propertes. Ths can also be done by actvatng the Popup Menu. To actvate the Popup Menu, clc on the rght button of the mouse when you are wthn the quadrant of graph. The tems shows how to change graph propertes n DAD. The Popup Menu
 to be the bacground graph.")
144 General Bacground pant: to select the bacground colour of the graph. We can also select the opton Gradent for the bacground colour. Bacground pant: to browse and select a pcture (GIF or PNG) to be the bacground graph. Wdth and Heght: to ndcate the desred wdth and heght of the graph n pxels, nches or centmetres (clc on the button Set to confrm your selecton). Draw Horzontal Lne: to draw a horzontal lne at a gvng heght of the Y-axs. Indcate that heght and clc the opton. Draw Vertcal Lne: to draw a vertcal lne at a gvng value of the X-axs. Indcate that value and clc the opton. Draw 45º Lnes : to draw a 45º lne. Anta-alasng opton: One of the most mportant technques n mang graphcs and text easy to read and pleasng to the eye on-screen s ant-alasng. Ant-alasng gets around the low 7dp resoluton of the computer montor and maes objects appear smooth. Actvate X-Y grd: If ths opton s selected, a grd s plotted n the graph Draw Border: If ths opton s selected, a border s plotted around the graph.

145 Ttle Man Ttle: By default, the man ttle s the name of applcaton. You can change the man ttle n the feld Text. You can also change ts font and ts colour. To do ths, just clc on the button select and ndcate the desred font or colour. Second Ttle: By default, the second ttle s Chart. You can change or delete the second ttle n the feld Text. You can also change ts font and ts colour. To do ths, just clc on the button select and ndcate the desred font or colour.

146 Legend Bacground: to select the bacground colour of the legend quadrant. Text font : to select the font of the text legends. Text font : to select the colour of the text legends. Legend Marer: to select Marer legends. By default, the marers have square form, but you can select the lne form wth ths opton. Square Form Lne Form Name : By default, the names of the curves are curve#, curve#,etc. You can change these names n these felds. 3


147 Axs Remar: The optons for the horzontal axs are smlar to those for the vertcal axs. Name : By default, the name of the vertcal axs s Value Y. You can change ths name wth ths feld. Font: to select the font of the name of the vertcal axs. Pant: to select the colour of the name of the vertcal axs. Label nsets: to change the labels poston (Top, Left, Bottom, Rght) ndcated n pxels Tc Label Insets: to change the Tc label poston (Top, Left, Bottom, Rght) ndcated n pxels Other-Tc: to show or not to show the tc labels or the tc marers. You can also select the font of the tc labels. Other-Range: to select the mnmum and maxmum values for the range of the vertcal axs. To do ths, unselect the opton Auto-adjust range 4

148 Other-Grd: To plot the horzontal grd lnes, select the opton Show grd lnes. You can also select the stroe and the colour of these grd lnes. 5


149 Curve For every curve, a combnaton of the three flowng optons can be chosen: Curve Stroe: To choose the stroe of a gvng curve, clc on the button Set stroe. The followng wdows appear: Select the desred stroe and clc on the button OK to confrm your selecton. Curve Thcness: To choose the thcness of a gvng curve, clc on the button Set Thcness. The followng wdows appear: Select the desred thcness, and clc on the button OK to confrm your selecton. Curve Pant: To choose the colour of a gvng curve, clc on the button Set Pant and choose the new colour. 6

150 Savng graphs Wth the verson 4.3 of DAD we can save and load the DAD Graph Format (*.dgf). You can also save and use graphs n many others popular text processors (ncludng Word and Excell). The avalable formats are: Extenson *.png *.jpg *.pdf *.ps *.tf *.bmp Portable Networ Graphc JPEG Fle Interchange Format Portable Document Format Postscrpt Tag Image Fle Format Btmat Image Fle Descrpton To save a graph made n DAD, select: Fle Save and select the format by selectng the extenson of the fle. Savng coordnates of curves To save the graph coordnates n ASCII format, select Fle Save coordnates. The generated ASCII fle taes the followng format: Curve X Y Curve X Y etc

151 Prntng graphs To prnt a graph, select Fle Prnt. The followng wndows appears: Select the desred Prnter. To change orentaton or margns, select Page Setup. When the followng wndow appears, select the desred orentaton and margns.


152 Templates You can select one of DAD s several graphcal templates to change the propertes of a graph. These templates only use blac and whte colours. To select a template, select Edt Templates. The followng wndow appears: Template can be nserted wthn a thrd of a page of a Word document. Template can be nserted wthn half a page of a Word document. 3

153 Template 3 can be nserted wthn a page of a Word document, wth landscape orentaton. Edtng coordnates To edt coordnates of curves, select Edt Edt Coordnates. The followng wndow appears: You can change the decmal number by usng the tem Tools. To close ths wndow, clc on the button OK. 4
.")
154 Preparng DAD ASCII Fles n.daf Format wth Stat/Transfer A useful tool to produce DAD Asc Format ( DAF ) fles s Stat/Transfer: The followng steps explan how one can prepare DAF fles from any other format.. After openng Stat/Transfer, select from the man menu the tem Opton ()... In the feld ASCII Fle Wrter, select the Delmter: Spaces... Select the opton Wrte varable names n frst row. To do ths only once, clc on the button Save to save these preferences.. The usual next step s to select the tem Transfer... Frst, select the type of the nput fle (SPSS. EXCEL ).. By usng Browse, ndcate the locaton of the nput fle.

155 .3. Select ASCII Delmted as the type of output fle..4. By usng Browse, ndcate the locaton of the output fle and wrte name wth extenson.daf. For example; the name s: Data.daf.5. Clc on the Button Transfer to produce the new fle. If you wsh to save only some selected vectors n the DAF fle, after step., select the tem Varables and select those vectors you wsh to save n the new DAF fle. After ths, contnue to steps.3 to.5.
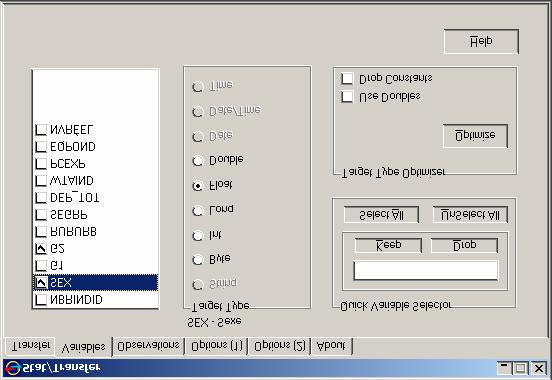
156 3
Life Tables (Times) Summary. Sample StatFolio: lifetable times.sgp
 Summary. Sample StatFolio: lifetable times.sgp") Lfe Tables (Tmes) Summary... 1 Data Input... 2 Analyss Summary... 3 Survval Functon... 5 Log Survval Functon... 6 Cumulatve Hazard Functon... 7 Percentles... 7 Group Comparsons... 8 Summary The Lfe Tables
Lfe Tables (Tmes) Summary... 1 Data Input... 2 Analyss Summary... 3 Survval Functon... 5 Log Survval Functon... 6 Cumulatve Hazard Functon... 7 Percentles... 7 Group Comparsons... 8 Summary The Lfe Tables
X- Chart Using ANOM Approach
 ISSN 1684-8403 Journal of Statstcs Volume 17, 010, pp. 3-3 Abstract X- Chart Usng ANOM Approach Gullapall Chakravarth 1 and Chaluvad Venkateswara Rao Control lmts for ndvdual measurements (X) chart are
y and the total sum of
 Lnear regresson Testng for non-lnearty In analytcal chemstry, lnear regresson s commonly used n the constructon of calbraton functons requred for analytcal technques such as gas chromatography, atomc absorpton
Wishing you all a Total Quality New Year!
 Total Qualty Management and Sx Sgma Post Graduate Program 214-15 Sesson 4 Vnay Kumar Kalakband Assstant Professor Operatons & Systems Area 1 Wshng you all a Total Qualty New Year! Hope you acheve Sx sgma
Variance estimation in EU-SILC survey
 Varance estmaton n EU-SILC survey Mārtņš Lberts* * Mathematcal Support Dvson, Central Statstcal Bureau of Latva (Martns.Lberts@csb.gov.lv) bstract: The mplementaton of varance estmaton methods resamplng
Synthesizer 1.0. User s Guide. A Varying Coefficient Meta. nalytic Tool. Z. Krizan Employing Microsoft Excel 2007
 Syntheszer 1.0 A Varyng Coeffcent Meta Meta-Analytc nalytc Tool Employng Mcrosoft Excel 007.38.17.5 User s Gude Z. Krzan 009 Table of Contents 1. Introducton and Acknowledgments 3. Operatonal Functons
Simulation: Solving Dynamic Models ABE 5646 Week 11 Chapter 2, Spring 2010
 Smulaton: Solvng Dynamc Models ABE 5646 Week Chapter 2, Sprng 200 Week Descrpton Readng Materal Mar 5- Mar 9 Evaluatng [Crop] Models Comparng a model wth data - Graphcal, errors - Measures of agreement
Some Advanced SPC Tools 1. Cumulative Sum Control (Cusum) Chart For the data shown in Table 9-1, the x chart can be generated.
 Chart For the data shown in Table 9-1, the x chart can be generated.") Some Advanced SP Tools 1. umulatve Sum ontrol (usum) hart For the data shown n Table 9-1, the x chart can be generated. However, the shft taken place at sample #21 s not apparent. 92 For ths set samples,
Some Advanced SP Tools 1. umulatve Sum ontrol (usum) hart For the data shown n Table 9-1, the x chart can be generated. However, the shft taken place at sample #21 s not apparent. 92 For ths set samples,
ECONOMICS 452* -- Stata 11 Tutorial 6. Stata 11 Tutorial 6. TOPIC: Representing Multi-Category Categorical Variables with Dummy Variable Regressors
 ECONOMICS * -- Stata 11 Tutoral Stata 11 Tutoral TOPIC: Representng Mult-Category Categorcal Varables wth Dummy Varable Regressors DATA: wage1_econ.dta (a Stata-format dataset) TASKS: Stata 11 Tutoral
Compiler Design. Spring Register Allocation. Sample Exercises and Solutions. Prof. Pedro C. Diniz
 Compler Desgn Sprng 2014 Regster Allocaton Sample Exercses and Solutons Prof. Pedro C. Dnz USC / Informaton Scences Insttute 4676 Admralty Way, Sute 1001 Marna del Rey, Calforna 90292 pedro@s.edu Regster
ECONOMICS 452* -- Stata 12 Tutorial 6. Stata 12 Tutorial 6. TOPIC: Representing Multi-Category Categorical Variables with Dummy Variable Regressors
 ECONOMICS 45* -- Stata 1 Tutoral 6 Stata 1 Tutoral 6 TOPIC: Representng Mult-Category Categorcal Varables wth Dummy Varable Regressors DATA: wage1_econ45.dta (a Stata-format dataset) TASKS: Stata 1 Tutoral
Steps for Computing the Dissimilarity, Entropy, Herfindahl-Hirschman and. Accessibility (Gravity with Competition) Indices
 Indices") Steps for Computng the Dssmlarty, Entropy, Herfndahl-Hrschman and Accessblty (Gravty wth Competton) Indces I. Dssmlarty Index Measurement: The followng formula can be used to measure the evenness between
Steps for Computng the Dssmlarty, Entropy, Herfndahl-Hrschman and Accessblty (Gravty wth Competton) Indces I. Dssmlarty Index Measurement: The followng formula can be used to measure the evenness between
C2 Training: June 8 9, Combining effect sizes across studies. Create a set of independent effect sizes. Introduction to meta-analysis
 C2 Tranng: June 8 9, 2010 Introducton to meta-analyss The Campbell Collaboraton www.campbellcollaboraton.org Combnng effect szes across studes Compute effect szes wthn each study Create a set of ndependent
Air Transport Demand. Ta-Hui Yang Associate Professor Department of Logistics Management National Kaohsiung First Univ. of Sci. & Tech.
 Ar Transport Demand Ta-Hu Yang Assocate Professor Department of Logstcs Management Natonal Kaohsung Frst Unv. of Sc. & Tech. 1 Ar Transport Demand Demand for ar transport between two ctes or two regons
SLAM Summer School 2006 Practical 2: SLAM using Monocular Vision
 SLAM Summer School 2006 Practcal 2: SLAM usng Monocular Vson Javer Cvera, Unversty of Zaragoza Andrew J. Davson, Imperal College London J.M.M Montel, Unversty of Zaragoza. josemar@unzar.es, jcvera@unzar.es,
TN348: Openlab Module - Colocalization
 TN348: Openlab Module - Colocalzaton Topc The Colocalzaton module provdes the faclty to vsualze and quantfy colocalzaton between pars of mages. The Colocalzaton wndow contans a prevew of the two mages
NAG Fortran Library Chapter Introduction. G10 Smoothing in Statistics
 Introducton G10 NAG Fortran Lbrary Chapter Introducton G10 Smoothng n Statstcs Contents 1 Scope of the Chapter... 2 2 Background to the Problems... 2 2.1 Smoothng Methods... 2 2.2 Smoothng Splnes and Regresson
Hermite Splines in Lie Groups as Products of Geodesics
 Hermte Splnes n Le Groups as Products of Geodescs Ethan Eade Updated May 28, 2017 1 Introducton 1.1 Goal Ths document defnes a curve n the Le group G parametrzed by tme and by structural parameters n the
S1 Note. Basis functions.
 S1 Note. Bass functons. Contents Types of bass functons...1 The Fourer bass...2 B-splne bass...3 Power and type I error rates wth dfferent numbers of bass functons...4 Table S1. Smulaton results of type
6.854 Advanced Algorithms Petar Maymounkov Problem Set 11 (November 23, 2005) With: Benjamin Rossman, Oren Weimann, and Pouya Kheradpour
 With: Benjamin Rossman, Oren Weimann, and Pouya Kheradpour") 6.854 Advanced Algorthms Petar Maymounkov Problem Set 11 (November 23, 2005) Wth: Benjamn Rossman, Oren Wemann, and Pouya Kheradpour Problem 1. We reduce vertex cover to MAX-SAT wth weghts, such that the
6.854 Advanced Algorthms Petar Maymounkov Problem Set 11 (November 23, 2005) Wth: Benjamn Rossman, Oren Wemann, and Pouya Kheradpour Problem 1. We reduce vertex cover to MAX-SAT wth weghts, such that the
R s s f. m y s. SPH3UW Unit 7.3 Spherical Concave Mirrors Page 1 of 12. Notes
 SPH3UW Unt 7.3 Sphercal Concave Mrrors Page 1 of 1 Notes Physcs Tool box Concave Mrror If the reflectng surface takes place on the nner surface of the sphercal shape so that the centre of the mrror bulges
Lobachevsky State University of Nizhni Novgorod. Polyhedron. Quick Start Guide
 Lobachevsky State Unversty of Nzhn Novgorod Polyhedron Quck Start Gude Nzhn Novgorod 2016 Contents Specfcaton of Polyhedron software... 3 Theoretcal background... 4 1. Interface of Polyhedron... 6 1.1.
Unsupervised Learning and Clustering
 Unsupervsed Learnng and Clusterng Why consder unlabeled samples?. Collectng and labelng large set of samples s costly Gettng recorded speech s free, labelng s tme consumng 2. Classfer could be desgned
Programming in Fortran 90 : 2017/2018
 Programmng n Fortran 90 : 2017/2018 Programmng n Fortran 90 : 2017/2018 Exercse 1 : Evaluaton of functon dependng on nput Wrte a program who evaluate the functon f (x,y) for any two user specfed values
CS 534: Computer Vision Model Fitting
 CS 534: Computer Vson Model Fttng Sprng 004 Ahmed Elgammal Dept of Computer Scence CS 534 Model Fttng - 1 Outlnes Model fttng s mportant Least-squares fttng Maxmum lkelhood estmaton MAP estmaton Robust
CMPS 10 Introduction to Computer Science Lecture Notes
 CPS 0 Introducton to Computer Scence Lecture Notes Chapter : Algorthm Desgn How should we present algorthms? Natural languages lke Englsh, Spansh, or French whch are rch n nterpretaton and meanng are not
A New Approach For the Ranking of Fuzzy Sets With Different Heights
 New pproach For the ankng of Fuzzy Sets Wth Dfferent Heghts Pushpnder Sngh School of Mathematcs Computer pplcatons Thapar Unversty, Patala-7 00 Inda pushpndersnl@gmalcom STCT ankng of fuzzy sets plays
Parallelism for Nested Loops with Non-uniform and Flow Dependences
 Parallelsm for Nested Loops wth Non-unform and Flow Dependences Sam-Jn Jeong Dept. of Informaton & Communcaton Engneerng, Cheonan Unversty, 5, Anseo-dong, Cheonan, Chungnam, 330-80, Korea. seong@cheonan.ac.kr
This module is part of the. Memobust Handbook. on Methodology of Modern Business Statistics
 Ths module s part of the Memobust Handbook on Methodology of Modern Busness Statstcs 26 March 2014 Theme: Donor Imputaton Contents General secton... 3 1. Summary... 3 2. General descrpton... 3 2.1 Introducton
Exercises (Part 4) Introduction to R UCLA/CCPR. John Fox, February 2005
 Introduction to R UCLA/CCPR. John Fox, February 2005") Exercses (Part 4) Introducton to R UCLA/CCPR John Fox, February 2005 1. A challengng problem: Iterated weghted least squares (IWLS) s a standard method of fttng generalzed lnear models to data. As descrbed
Exercses (Part 4) Introducton to R UCLA/CCPR John Fox, February 2005 1. A challengng problem: Iterated weghted least squares (IWLS) s a standard method of fttng generalzed lnear models to data. As descrbed
Analysis of Continuous Beams in General
 Analyss of Contnuous Beams n General Contnuous beams consdered here are prsmatc, rgdly connected to each beam segment and supported at varous ponts along the beam. onts are selected at ponts of support,
Subspace clustering. Clustering. Fundamental to all clustering techniques is the choice of distance measure between data points;
 Subspace clusterng Clusterng Fundamental to all clusterng technques s the choce of dstance measure between data ponts; D q ( ) ( ) 2 x x = x x, j k = 1 k jk Squared Eucldean dstance Assumpton: All features
Random Variables and Probability Distributions
 Random Varables and Probablty Dstrbutons Some Prelmnary Informaton Scales on Measurement IE231 - Lecture Notes 5 Mar 14, 2017 Nomnal scale: These are categorcal values that has no relatonshp of order or
Biostatistics 615/815
 The E-M Algorthm Bostatstcs 615/815 Lecture 17 Last Lecture: The Smplex Method General method for optmzaton Makes few assumptons about functon Crawls towards mnmum Some recommendatons Multple startng ponts
Helsinki University Of Technology, Systems Analysis Laboratory Mat Independent research projects in applied mathematics (3 cr)
") Helsnk Unversty Of Technology, Systems Analyss Laboratory Mat-2.08 Independent research projects n appled mathematcs (3 cr) "! #$&% Antt Laukkanen 506 R ajlaukka@cc.hut.f 2 Introducton...3 2 Multattrbute
Helsnk Unversty Of Technology, Systems Analyss Laboratory Mat-2.08 Independent research projects n appled mathematcs (3 cr) "! #$&% Antt Laukkanen 506 R ajlaukka@cc.hut.f 2 Introducton...3 2 Multattrbute
Determining the Optimal Bandwidth Based on Multi-criterion Fusion
 Proceedngs of 01 4th Internatonal Conference on Machne Learnng and Computng IPCSIT vol. 5 (01) (01) IACSIT Press, Sngapore Determnng the Optmal Bandwdth Based on Mult-crteron Fuson Ha-L Lang 1+, Xan-Mn
Problem Set 3 Solutions
 Introducton to Algorthms October 4, 2002 Massachusetts Insttute of Technology 6046J/18410J Professors Erk Demane and Shaf Goldwasser Handout 14 Problem Set 3 Solutons (Exercses were not to be turned n,
FEATURE EXTRACTION. Dr. K.Vijayarekha. Associate Dean School of Electrical and Electronics Engineering SASTRA University, Thanjavur
 FEATURE EXTRACTION Dr. K.Vjayarekha Assocate Dean School of Electrcal and Electroncs Engneerng SASTRA Unversty, Thanjavur613 41 Jont Intatve of IITs and IISc Funded by MHRD Page 1 of 8 Table of Contents
Feature Reduction and Selection
 Feature Reducton and Selecton Dr. Shuang LIANG School of Software Engneerng TongJ Unversty Fall, 2012 Today s Topcs Introducton Problems of Dmensonalty Feature Reducton Statstc methods Prncpal Components
Lecture #15 Lecture Notes
 Lecture #15 Lecture Notes The ocean water column s very much a 3-D spatal entt and we need to represent that structure n an economcal way to deal wth t n calculatons. We wll dscuss one way to do so, emprcal
The Codesign Challenge
 ECE 4530 Codesgn Challenge Fall 2007 Hardware/Software Codesgn The Codesgn Challenge Objectves In the codesgn challenge, your task s to accelerate a gven software reference mplementaton as fast as possble.
Parameter estimation for incomplete bivariate longitudinal data in clinical trials
 Parameter estmaton for ncomplete bvarate longtudnal data n clncal trals Naum M. Khutoryansky Novo Nordsk Pharmaceutcals, Inc., Prnceton, NJ ABSTRACT Bvarate models are useful when analyzng longtudnal data
Lecture 5: Multilayer Perceptrons
 Lecture 5: Multlayer Perceptrons Roger Grosse 1 Introducton So far, we ve only talked about lnear models: lnear regresson and lnear bnary classfers. We noted that there are functons that can t be represented
Course Introduction. Algorithm 8/31/2017. COSC 320 Advanced Data Structures and Algorithms. COSC 320 Advanced Data Structures and Algorithms
 Course Introducton Course Topcs Exams, abs, Proects A quc loo at a few algorthms 1 Advanced Data Structures and Algorthms Descrpton: We are gong to dscuss algorthm complexty analyss, algorthm desgn technques
The Man-hour Estimation Models & Its Comparison of Interim Products Assembly for Shipbuilding
 Internatonal Journal of Operatons Research Internatonal Journal of Operatons Research Vol., No., 9 4 (005) The Man-hour Estmaton Models & Its Comparson of Interm Products Assembly for Shpbuldng Bn Lu and
Cell Count Method on a Network with SANET
 CSIS Dscusson Paper No.59 Cell Count Method on a Network wth SANET Atsuyuk Okabe* and Shno Shode** Center for Spatal Informaton Scence, Unversty of Tokyo 7-3-1, Hongo, Bunkyo-ku, Tokyo 113-8656, Japan
TECHNIQUE OF FORMATION HOMOGENEOUS SAMPLE SAME OBJECTS. Muradaliyev A.Z.
 TECHNIQUE OF FORMATION HOMOGENEOUS SAMPLE SAME OBJECTS Muradalyev AZ Azerbajan Scentfc-Research and Desgn-Prospectng Insttute of Energetc AZ1012, Ave HZardab-94 E-mal:aydn_murad@yahoocom Importance of
Brave New World Pseudocode Reference
 Brave New World Pseudocode Reference Pseudocode s a way to descrbe how to accomplsh tasks usng basc steps lke those a computer mght perform. In ths week s lab, you'll see how a form of pseudocode can be
Mathematics 256 a course in differential equations for engineering students
 Mathematcs 56 a course n dfferental equatons for engneerng students Chapter 5. More effcent methods of numercal soluton Euler s method s qute neffcent. Because the error s essentally proportonal to the
Lecture 5: Probability Distributions. Random Variables
 Lecture 5: Probablty Dstrbutons Random Varables Probablty Dstrbutons Dscrete Random Varables Contnuous Random Varables and ther Dstrbutons Dscrete Jont Dstrbutons Contnuous Jont Dstrbutons Independent
NUMERICAL SOLVING OPTIMAL CONTROL PROBLEMS BY THE METHOD OF VARIATIONS
 ARPN Journal of Engneerng and Appled Scences 006-017 Asan Research Publshng Network (ARPN). All rghts reserved. NUMERICAL SOLVING OPTIMAL CONTROL PROBLEMS BY THE METHOD OF VARIATIONS Igor Grgoryev, Svetlana
USING GRAPHING SKILLS
 Name: BOLOGY: Date: _ Class: USNG GRAPHNG SKLLS NTRODUCTON: Recorded data can be plotted on a graph. A graph s a pctoral representaton of nformaton recorded n a data table. t s used to show a relatonshp
AP PHYSICS B 2008 SCORING GUIDELINES
 AP PHYSICS B 2008 SCORING GUIDELINES General Notes About 2008 AP Physcs Scorng Gudelnes 1. The solutons contan the most common method of solvng the free-response questons and the allocaton of ponts for
For instance, ; the five basic number-sets are increasingly more n A B & B A A = B (1)
") Secton 1.2 Subsets and the Boolean operatons on sets If every element of the set A s an element of the set B, we say that A s a subset of B, or that A s contaned n B, or that B contans A, and we wrte A
Secton 1.2 Subsets and the Boolean operatons on sets If every element of the set A s an element of the set B, we say that A s a subset of B, or that A s contaned n B, or that B contans A, and we wrte A
Support Vector Machines
 /9/207 MIST.6060 Busness Intellgence and Data Mnng What are Support Vector Machnes? Support Vector Machnes Support Vector Machnes (SVMs) are supervsed learnng technques that analyze data and recognze patterns.
Summarizing Data using Bottom-k Sketches
 Summarzng Data usng Bottom-k Sketches Edth Cohen AT&T Labs Research 8 Park Avenue Florham Park, NJ 7932, USA edth@research.att.com Ham Kaplan School of Computer Scence Tel Avv Unversty Tel Avv, Israel
Modeling Local Uncertainty accounting for Uncertainty in the Data
 Modelng Local Uncertanty accontng for Uncertanty n the Data Olena Babak and Clayton V Detsch Consder the problem of estmaton at an nsampled locaton sng srrondng samples The standard approach to ths problem
CHARUTAR VIDYA MANDAL S SEMCOM Vallabh Vidyanagar
 CHARUTAR VIDYA MANDAL S SEMCOM Vallabh Vdyanagar Faculty Name: Am D. Trved Class: SYBCA Subject: US03CBCA03 (Advanced Data & Fle Structure) *UNIT 1 (ARRAYS AND TREES) **INTRODUCTION TO ARRAYS If we want
Analysis of Malaysian Wind Direction Data Using ORIANA
 Modern Appled Scence March, 29 Analyss of Malaysan Wnd Drecton Data Usng ORIANA St Fatmah Hassan (Correspondng author) Centre for Foundaton Studes n Scence Unversty of Malaya, 63 Kuala Lumpur, Malaysa
Virtual Memory. Background. No. 10. Virtual Memory: concept. Logical Memory Space (review) Demand Paging(1) Virtual Memory
 Demand Paging(1) Virtual Memory") Background EECS. Operatng System Fundamentals No. Vrtual Memory Prof. Hu Jang Department of Electrcal Engneerng and Computer Scence, York Unversty Memory-management methods normally requres the entre process
Background EECS. Operatng System Fundamentals No. Vrtual Memory Prof. Hu Jang Department of Electrcal Engneerng and Computer Scence, York Unversty Memory-management methods normally requres the entre process
Solutions to Programming Assignment Five Interpolation and Numerical Differentiation
 College of Engneerng and Coputer Scence Mechancal Engneerng Departent Mechancal Engneerng 309 Nuercal Analyss of Engneerng Systes Sprng 04 Nuber: 537 Instructor: Larry Caretto Solutons to Prograng Assgnent
Machine Learning: Algorithms and Applications
 14/05/1 Machne Learnng: Algorthms and Applcatons Florano Zn Free Unversty of Bozen-Bolzano Faculty of Computer Scence Academc Year 011-01 Lecture 10: 14 May 01 Unsupervsed Learnng cont Sldes courtesy of
IP Camera Configuration Software Instruction Manual
 IP Camera 9483 - Confguraton Software Instructon Manual VBD 612-4 (10.14) Dear Customer, Wth your purchase of ths IP Camera, you have chosen a qualty product manufactured by RADEMACHER. Thank you for the
A MOVING MESH APPROACH FOR SIMULATION BUDGET ALLOCATION ON CONTINUOUS DOMAINS
 Proceedngs of the Wnter Smulaton Conference M E Kuhl, N M Steger, F B Armstrong, and J A Jones, eds A MOVING MESH APPROACH FOR SIMULATION BUDGET ALLOCATION ON CONTINUOUS DOMAINS Mark W Brantley Chun-Hung
A Semi-parametric Regression Model to Estimate Variability of NO 2
 Envronment and Polluton; Vol. 2, No. 1; 2013 ISSN 1927-0909 E-ISSN 1927-0917 Publshed by Canadan Center of Scence and Educaton A Sem-parametrc Regresson Model to Estmate Varablty of NO 2 Meczysław Szyszkowcz
Lecture 4: Principal components
 /3/6 Lecture 4: Prncpal components 3..6 Multvarate lnear regresson MLR s optmal for the estmaton data...but poor for handlng collnear data Covarance matrx s not nvertble (large condton number) Robustness
Parallel matrix-vector multiplication
 Appendx A Parallel matrx-vector multplcaton The reduced transton matrx of the three-dmensonal cage model for gel electrophoress, descrbed n secton 3.2, becomes excessvely large for polymer lengths more
3D vector computer graphics
 3D vector computer graphcs Paolo Varagnolo: freelance engneer Padova Aprl 2016 Prvate Practce ----------------------------------- 1. Introducton Vector 3D model representaton n computer graphcs requres
EECS 730 Introduction to Bioinformatics Sequence Alignment. Luke Huan Electrical Engineering and Computer Science
 EECS 730 Introducton to Bonformatcs Sequence Algnment Luke Huan Electrcal Engneerng and Computer Scence http://people.eecs.ku.edu/~huan/ HMM Π s a set of states Transton Probabltes a kl Pr( l 1 k Probablty
Cluster Analysis of Electrical Behavior
 Journal of Computer and Communcatons, 205, 3, 88-93 Publshed Onlne May 205 n ScRes. http://www.scrp.org/ournal/cc http://dx.do.org/0.4236/cc.205.350 Cluster Analyss of Electrcal Behavor Ln Lu Ln Lu, School
Content Based Image Retrieval Using 2-D Discrete Wavelet with Texture Feature with Different Classifiers
 IOSR Journal of Electroncs and Communcaton Engneerng (IOSR-JECE) e-issn: 78-834,p- ISSN: 78-8735.Volume 9, Issue, Ver. IV (Mar - Apr. 04), PP 0-07 Content Based Image Retreval Usng -D Dscrete Wavelet wth
Active Contours/Snakes
 Actve Contours/Snakes Erkut Erdem Acknowledgement: The sldes are adapted from the sldes prepared by K. Grauman of Unversty of Texas at Austn Fttng: Edges vs. boundares Edges useful sgnal to ndcate occludng
Empirical Distributions of Parameter Estimates. in Binary Logistic Regression Using Bootstrap
 Int. Journal of Math. Analyss, Vol. 8, 4, no. 5, 7-7 HIKARI Ltd, www.m-hkar.com http://dx.do.org/.988/jma.4.494 Emprcal Dstrbutons of Parameter Estmates n Bnary Logstc Regresson Usng Bootstrap Anwar Ftranto*
Electrical analysis of light-weight, triangular weave reflector antennas
 Electrcal analyss of lght-weght, trangular weave reflector antennas Knud Pontoppdan TICRA Laederstraede 34 DK-121 Copenhagen K Denmark Emal: kp@tcra.com INTRODUCTION The new lght-weght reflector antenna
A Statistical Model Selection Strategy Applied to Neural Networks
 A Statstcal Model Selecton Strategy Appled to Neural Networks Joaquín Pzarro Elsa Guerrero Pedro L. Galndo joaqun.pzarro@uca.es elsa.guerrero@uca.es pedro.galndo@uca.es Dpto Lenguajes y Sstemas Informátcos
A CLASS OF TRANSFORMED EFFICIENT RATIO ESTIMATORS OF FINITE POPULATION MEAN. Department of Statistics, Islamia College, Peshawar, Pakistan 2
 Pa. J. Statst. 5 Vol. 3(4), 353-36 A CLASS OF TRANSFORMED EFFICIENT RATIO ESTIMATORS OF FINITE POPULATION MEAN Sajjad Ahmad Khan, Hameed Al, Sadaf Manzoor and Alamgr Department of Statstcs, Islama College,
Complex Numbers. Now we also saw that if a and b were both positive then ab = a b. For a second let s forget that restriction and do the following.
 Complex Numbers The last topc n ths secton s not really related to most of what we ve done n ths chapter, although t s somewhat related to the radcals secton as we wll see. We also won t need the materal
VRT012 User s guide V0.1. Address: Žirmūnų g. 27, Vilnius LT-09105, Phone: (370-5) , Fax: (370-5) ,
 , Fax: (370-5) ,") VRT012 User s gude V0.1 Thank you for purchasng our product. We hope ths user-frendly devce wll be helpful n realsng your deas and brngng comfort to your lfe. Please take few mnutes to read ths manual
VRT012 User s gude V0.1 Thank you for purchasng our product. We hope ths user-frendly devce wll be helpful n realsng your deas and brngng comfort to your lfe. Please take few mnutes to read ths manual
An Entropy-Based Approach to Integrated Information Needs Assessment
 Dstrbuton Statement A: Approved for publc release; dstrbuton s unlmted. An Entropy-Based Approach to ntegrated nformaton Needs Assessment June 8, 2004 Wllam J. Farrell Lockheed Martn Advanced Technology
2x x l. Module 3: Element Properties Lecture 4: Lagrange and Serendipity Elements
 Module 3: Element Propertes Lecture : Lagrange and Serendpty Elements 5 In last lecture note, the nterpolaton functons are derved on the bass of assumed polynomal from Pascal s trangle for the fled varable.
Assembler. Building a Modern Computer From First Principles.
 Assembler Buldng a Modern Computer From Frst Prncples www.nand2tetrs.org Elements of Computng Systems, Nsan & Schocken, MIT Press, www.nand2tetrs.org, Chapter 6: Assembler slde Where we are at: Human Thought
ELEC 377 Operating Systems. Week 6 Class 3
 ELEC 377 Operatng Systems Week 6 Class 3 Last Class Memory Management Memory Pagng Pagng Structure ELEC 377 Operatng Systems Today Pagng Szes Vrtual Memory Concept Demand Pagng ELEC 377 Operatng Systems
A mathematical programming approach to the analysis, design and scheduling of offshore oilfields
 17 th European Symposum on Computer Aded Process Engneerng ESCAPE17 V. Plesu and P.S. Agach (Edtors) 2007 Elsever B.V. All rghts reserved. 1 A mathematcal programmng approach to the analyss, desgn and
Security. Workplace Manager
 User Gude Manageablty and Securty Workplace Manager Congratulatons on your purchase of an nnovatve product from Fujtsu. The latest nformaton about our products, tps, updates etc. can be found on the Internet
NGPM -- A NSGA-II Program in Matlab
 Verson 1.4 LIN Song Aerospace Structural Dynamcs Research Laboratory College of Astronautcs, Northwestern Polytechncal Unversty, Chna Emal: lsssswc@163.com 2011-07-26 Contents Contents... 1. Introducton...
Improvement of Spatial Resolution Using BlockMatching Based Motion Estimation and Frame. Integration
 Improvement of Spatal Resoluton Usng BlockMatchng Based Moton Estmaton and Frame Integraton Danya Suga and Takayuk Hamamoto Graduate School of Engneerng, Tokyo Unversty of Scence, 6-3-1, Nuku, Katsuska-ku,
Estimating Regression Coefficients using Weighted Bootstrap with Probability
 Norazan M R, Habshah Md, A H M R Imon Estmatng Regresson Coeffcents usng Weghted Bootstrap wth Probablty NORAZAN M R, HABSHAH MIDI AND A H M R IMON Faculty of Computer and Mathematcal Scences, Unversty
Performance Evaluation of Information Retrieval Systems
 Why System Evaluaton? Performance Evaluaton of Informaton Retreval Systems Many sldes n ths secton are adapted from Prof. Joydeep Ghosh (UT ECE) who n turn adapted them from Prof. Dk Lee (Unv. of Scence
A Simple and Efficient Goal Programming Model for Computing of Fuzzy Linear Regression Parameters with Considering Outliers
 62626262621 Journal of Uncertan Systems Vol.5, No.1, pp.62-71, 211 Onlne at: www.us.org.u A Smple and Effcent Goal Programmng Model for Computng of Fuzzy Lnear Regresson Parameters wth Consderng Outlers
Problem Definitions and Evaluation Criteria for Computational Expensive Optimization
 Problem efntons and Evaluaton Crtera for Computatonal Expensve Optmzaton B. Lu 1, Q. Chen and Q. Zhang 3, J. J. Lang 4, P. N. Suganthan, B. Y. Qu 6 1 epartment of Computng, Glyndwr Unversty, UK Faclty
A Binarization Algorithm specialized on Document Images and Photos
 A Bnarzaton Algorthm specalzed on Document mages and Photos Ergna Kavalleratou Dept. of nformaton and Communcaton Systems Engneerng Unversty of the Aegean kavalleratou@aegean.gr Abstract n ths paper, a
BITPLANE AG IMARISCOLOC. Operating Instructions. Manual Version 1.0 January the image revolution starts here.
 BITPLANE AG IMARISCOLOC Operatng Instructons Manual Verson 1.0 January 2003 the mage revoluton starts here. Operatng Instructons BITPLANE AG Copyrght Ths document contans propretary nformaton protected
Data Mining: Model Evaluation
 Data Mnng: Model Evaluaton Aprl 16, 2013 1 Issues: Evaluatng Classfcaton Methods Accurac classfer accurac: predctng class label predctor accurac: guessng value of predcted attrbutes Speed tme to construct
Proper Choice of Data Used for the Estimation of Datum Transformation Parameters
 Proper Choce of Data Used for the Estmaton of Datum Transformaton Parameters Hakan S. KUTOGLU, Turkey Key words: Coordnate systems; transformaton; estmaton, relablty. SUMMARY Advances n technologes and
A Fast Content-Based Multimedia Retrieval Technique Using Compressed Data
 A Fast Content-Based Multmeda Retreval Technque Usng Compressed Data Borko Furht and Pornvt Saksobhavvat NSF Multmeda Laboratory Florda Atlantc Unversty, Boca Raton, Florda 3343 ABSTRACT In ths paper,
A Similarity-Based Prognostics Approach for Remaining Useful Life Estimation of Engineered Systems
 2008 INTERNATIONAL CONFERENCE ON PROGNOSTICS AND HEALTH MANAGEMENT A Smlarty-Based Prognostcs Approach for Remanng Useful Lfe Estmaton of Engneered Systems Tany Wang, Janbo Yu, Davd Segel, and Jay Lee
Smoothing Spline ANOVA for variable screening
 Smoothng Splne ANOVA for varable screenng a useful tool for metamodels tranng and mult-objectve optmzaton L. Rcco, E. Rgon, A. Turco Outlne RSM Introducton Possble couplng Test case MOO MOO wth Game Theory
Anonymisation of Public Use Data Sets
 Anonymsaton of Publc Use Data Sets Methods for Reducng Dsclosure Rsk and the Analyss of Perturbed Data Harvey Goldsten Unversty of Brstol and Unversty College London and Natale Shlomo Unversty of Manchester
Assignment # 2. Farrukh Jabeen Algorithms 510 Assignment #2 Due Date: June 15, 2009.
 Farrukh Jabeen Algorthms 51 Assgnment #2 Due Date: June 15, 29. Assgnment # 2 Chapter 3 Dscrete Fourer Transforms Implement the FFT for the DFT. Descrbed n sectons 3.1 and 3.2. Delverables: 1. Concse descrpton
Help for Time-Resolved Analysis TRI2 version 2.4 P Barber,
 Help for Tme-Resolved Analyss TRI2 verson 2.4 P Barber, 22.01.10 Introducton Tme-resolved Analyss (TRA) becomes avalable under the processng menu once you have loaded and selected an mage that contans