BIOS-870 Multivariate Statistics (McCarthy)
|
|
|
- Osborn Jenkins
- 6 years ago
- Views:
Transcription

1 Cluster Analysis Introduction & definitions The basic model: single linkage clustering Cophenetic matrix and ultrametric property A diversity of clustering methods Hierarchical agglomerative clustering Single linkage Complete linkage Intermediate linkage UPGMA & WPGMA UPGMC & UPGMC Ward s minimum variance General agglomerative model Flexible clustering Information analysis Hierarchical divisive clustering Monothetic methods Polythetic methods TWINSPAN Partitioning by K-means Cluster validation & choice of method Exploratory data analysis via graphics Cluster Analysis The collection and organization of objects is almost an innately human trait. It requires the recognition of discontinuous subsets. Cluster analysis is a process of identification and categorization of subsets of objects that are, more often than not, continuously distributed. Measures of similarity between objects (Q-mode) or descriptors (R-mode) is the first step of this process. Cluster Analysis Usually the result of clustering in EEB is a typology (i.e., a system of types). The primary purpose being to describe the structure of a continuum and identify various object types. The nature of the types is often immaterial. Most multivariate statistical software offers some form of cluster analysis. The result of these procedures is usually some form of dendrogram (tree) or skyline plot. Spring
2 Cluster Analysis BEFORE embarking upon a cluster analysis, you should clearly state what your goals are. Moreover, it is important to justify why you believe discontinuities exist in the data and what you hope to gain by identifying and evaluating those discontinuities. Alternatively, ordination stresses the continuous nature of data and is used to emphasize gradients in the environment or community traits. Cluster analysis and ordination are not mutually exclusive, but one may be more preferable than the other for certain questions. Introduction Clustering is an operation of multidimensional analysis which consists of partitioning a set of objects into subsets, such that each object or descriptor belongs to one and only one subset for that partition. Thus, subsets of any level, by definition, must consist of mutually exclusive cells. The Polish ecologist Kulczynski (1928) may have been the first EEB to use cluster analysis to group observations. Thus, the method has been used since the early years of EEB. Most clustering methods proceed from an association matrix. Introduction The choice of clustering methods is just as critical as is the choice of an association measure. It is important to fully understand the whole range of clustering methods and options in order to correctly evaluate and interpret the structure in your data under different circumstances. There are two major types of clustering: descriptive and synoptic. In descriptive clustering one attempts to avoid misclassification at all costs; whereas, in synoptic clustering, the goal is more of a structured conceptual model. Spring
3 Introduction - R - A special note regarding R is in order R is particularly strong at clustering. There are so many packages that address it that CRAN has set up a jump site for cluster analysis: The packages cluster, ksmeans, and the base stats are about the most we can cover b/c of time constraints. Explore the above jump site as needed. Single Linkage Clustering - The Basic Model - There is an entire classification of clustering methods. For most natural scientists, the simplest and most straightforward clustering method to understand is single linkage (also referred to in the literature as nearest neighbor). We will assume at this point that you have carefully chosen a similarity measure and applied it to a primary data matrix to obtain a similarity hemi-matrix. We will also focus on the classification of objects, but recognize that all of the method can just as easily be applied to descriptors. Single Linkage Clustering - The Basic Model - The method proceeds in two steps: First, the association hemi-matrix is rewritten in order of decreasing similarities (or increasing distances, as appropriate), heading the list with the two most similar objects, and proceeding until all pairs are accounted for. Second, the clusters are formed hierarchically, starting with the most similar objects, and then letting the objects clump in to groups, and then the groups aggregate in to one another, as the similarity criterion is relaxed. Spring
4 Single Linkage Clustering - Example - Let s return to an earlier example where 38 species of plankton were studied in 5 ponds. The data were recorded on a relative abundance scale from 0 = absent to 5 = abundant. After computing the similarity coefficient S 20 with parameter k = 2, the symmetric similarity hemi-matrix is used to derive a single linkage clustering. Single Linkage Clustering - Example, Step 1 - Ponds Ponds S 20 Pairs Single Linkage Clustering A dendrogram is the most commonly used method of summarizing the hierarchical clustering results (although skyline plots are prevalent in SAS [not recommended for classification procedures]). Dendrograms only display the clustering topology and object labels, not the links between objects. Dendrograms are made of branches that meet at nodes which are drawn at the similarity value where fusion of the branches takes place. Note that the branches furcating from any node can be switched (swiveled) without ever affecting the information content. Spring
5 Single Linkage Clustering - Example, Step 2 - Now, arrange ordered similarity data in to a dendrogram: Similarity Single Linkage Rule From the previous example, it should be clear that the rule for assigning an object to a cluster, in single linkage clustering, requires an object to display a similarity at least equal to the level of partition with at least one object already a member of the cluster. The assignment rules differ among clustering procedures. SL clustering forms a chaining rule whereby at each level of partition, two objects must be allocated to the same subset if their degree of similarity is equal to or higher than that of the partitioning level considered. Single Linkage Clustering Single linkage clustering provides a fairly accurate picture of the relationships between pairs of objects. But, because of the propensity to exhibit chaining, it may be undesirable in many ecological analyses. The chaining phenomenon is an issue because this means that the presence of an object midway between two compact clusters, or a few intermediates connecting the two clusters, is enough to turn them in to a single cluster. Clusters only chain if intermediates are present, so the chaining of the data sometimes provides some useful insight in to the data. Spring
6 Cophenetic Matrix Any classification or partition can be fully described by a cophenetic matrix. This matrix is used for comparing different classifications of the same subjects. The cophenetic similarity (or distance) of two objects x 1 and x 2 is defined as the similarity level at which objects x 1 and x 2 become members of the same cluster during the course of clustering. Cophenetic Matrix Consider the single linkage cluster analysis we just performed. the cophenetic similarity matrix (derived from the dendrogram itself) for that data set is: S Ultrametric Property If there are no reversals in the clustering, a classification has the following ultrametric property and the cophenetic matrix is called ultrametric: [ ] D( x, x ) max D( x, x ), D( x, x ) for every triplet of objects (x 1, x 2, x 3 ) in the study. The ultrametric property may also be expressed in terms of similarities: [ ] S( x, x ) max S( x, x ), S( x, x ) Spring

7 A Cornucopia of Clustering Methods Clustering algorithms have been developed using a wide range of conceptual models for studying all sorts of problems. There are 5 major dichotomies among methods: 1. Sequential vs. Simultaneous algorithms 2. Agglomerative vs. Divisive methods 3. Monothetic vs. Polythetic methods 4. Hierarchical vs. Non-hierarchical methods 5. Probabilistic vs. Non-probabilistic methods Sequential vs. Simultaneous Algorithms Most clustering methods are sequential in that they proceed by applying a recurrent sequence of operations to a group of objects (e.g., single linkage clustering). In simultaneous algorithms, which are infrequent, the solution is obtained in a single step. Ordination procedures tend to be more of the latter type. Agglomerative vs. Divisive Methods Among the sequential algorithms, Agglomerative procedures begin with the discontinuous partition of all objects, i.e., the objects are considered as being separate from one another. They are successively grouped into larger and larger clusters. If the single group of all objects is used as the starting point of the procedure, and smaller and smaller groups are derived by partitioning, the algorithm is divisive. Spring
8 Monothetic vs. Polythetic Methods Divisive clustering methods may be monothetic or polythetic. Monothetic models use a single descriptor as a basis for the partitioning (at each partition, one descriptor is chosen). Polythetic models use several descriptors which, in most cases, are combined in to an association matrix prior to clustering. Hierarchical vs. Non-hierarchical Methods In hierarchical methods, the members of inferior-ranking clusters become members of larger, higher-ranking clusters. Most of the time, hierarchical methods produce non-overlapping clusters. (Single linkage clustering is of this type.) Non-hierarchical methods are very useful in EEB. They produce a single partition which optimizes within-group homogeneity, instead of a hierarchical series of partitions. This method should be used when the aim is to obtain a direct representation of the relationships among objects instead of a summary of their hierarchy. Probabilistic vs. Non-probabilistic Methods Probabilistic methods include the clustering model of Clifford & Goodall (1967) and the parametric and nonparametric methods for estimating density functions in multivariate space. The method of C&G is recommended when employing Goodall s similarity coefficient (S 23 ), for the clustering of species in to biological associations. Spring
9 Hierarchical Agglomerative Clustering 1. Single linkage agglomerative clustering 2. Complete linkage agglomerative clustering 3. Intermediate linkage clustering 4. Unweighted arithmetic average clustering (UPGMA) 5. Weighted arithmetic average clustering (WPGMA) 6. Unweighted centroid clustering (UPGMC) 7. Weighted centroid clustering (WPGMC) 8. Ward s minimum variance method 9. General agglomerative clustering model 10. Flexible clustering 11. Information analysis Single Linkage Agglomerative Clustering In single linkage agglomerative clustering (already covered), two clusters fuse when the two objects closest to each other (one in each cluster) reach the similarity of the considered partition. As a consequence of chaining, results of SL clustering are fairly sensitive to noise in the data, because noise changes the similarity values and may thus easily modify the order in which objects cluster. Single Linkage Clustering Example: Cockroaches Let s return to an example we investigated previously (when looking at the simple matching similarity coefficient): presence/absence data are available for 5 species of cockroaches in 6 localities. BCI LC FORT BOQ MIR CORG CESP COCU CODE BUAR LADO Spring

10 Single Linkage Clustering Example, Cockroach Data After generating a similarity hemi-matrix of Jaccard s coefficients, we conduct a SLC or (nearest neighbor analysis) using MVSP software: Nearest neighbor Jaccard's Coefficient BUAR LADO CODE COCU CESP Single Linkage Clustering Example, Cockroach Data, R Single Linkage Clustering Example, Cockroach Data, R Spring
11 Complete Linkage Agglomerative Clustering Complete linkage agglomeration (also known as farthest neighbor analysis) is essentially opposite in approach to the single linkage analysis. In this method, the fusion of two clusters relies on the most distant pair of objects instead of the closest. Thus, an object joins a cluster only when it is linked to all the objects already in the cluster. Two clusters can fuse only when all objects of the first cluster are linked to all objects of the second cluster. Complete Linkage Agglomerative Clustering PROS: CL clustering produces maximally linked and spherical clusters (instead of the chained clusters of SL). This feature is often desirable in EEB when wishing to emphasize discontinuities. CONS: CL clustering relies on a virtually arbitrary rule known as the right-hand rule in choosing to include objects in a cluster. An example is when two objects or two clusters could be included in a third cluster, while these two objects or clusters have not completed the linkage with each other. Complete Linkage Agglomerative Clustering Example, Cockroach Data, MVSP Farthest neighbor Jaccard's Coefficient BUAR LADO CODE COCU CESP Spring
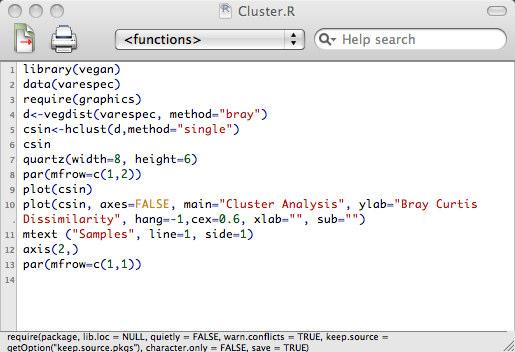
12 Complete Linkage Agglomerative Clustering Example, Cockroach Data, R Change the method= in the R-code from single to complete. Note that R and MVSP are agreeing in all cases (always a good thing). Single vs. Complete Linkage Comparison Cockroach Data, MVSP Nearest neighbor BUAR LADO CODE COCU CESP Jaccard's Coefficient Farthest neighbor BUAR LADO CODE COCU CESP Running cluster analyses in R is rather straightforward. Producing publication grade dendrograms is less than clear. Need working knowledge of graphics functions. The process is a bit hinky in as much as various manipulations may need to be performed. Plots from hclust are controlled by defaults in the hclust.plot function. You may need to override these to get the plot you want. Let s look at an example using a dataset from vegan Spring

13 Spring
14 Intermediate Linkage Clustering Methods Between the chaining problem of SL and the extreme space dilation of CL, the most interesting solution in EEB may be a type of clustering that approximately conserves the metric space A. If the interest lies in the clusters shown in the dendrogram, and not the actual similarity links between clusters shown by the subgraphs, the average clustering methods of the next four (4) sections may be the most useful since they conserve the metric properties of the reference space. Intermediate Linkage Clustering Methods In intermediate linkage clustering, the fusion criterion of an object or a cluster with another cluster is considered satisfied when a given proportion of the total possible number of similarity links is reached. For example, if the criterion of connectedness is C = 0.5, two clusters are only required to share 50% of the possible links to fuse. This criterion has been referred to in the literature as proportional link linkage. When C = 1, the method is called average linkage clustering (next 4 methods). Average Clustering There are four methods of average clustering that conserve the metric properties of reference space. Since they do not tally the links between clusters, they are not object-linkage methods in the sense of the previous three methodologies. They rely instead on average similarities among: objects (UPGMA, WPGMA), or centroids (UPGMC, WPGMC) of clusters. Spring
15 Unweighted Arithmetic Average Clustering (UPGMA) Unweighted arithmetic average clustering, or unweighted pair-group method using arithmetic averages (as originally defined by Sneath and Sokal 1973), or average linkage by SAS and SYSTAT are all the same UPGMA procedure. The highest similarity identifies the next cluster to be formed. Following this event, the method computes the arithmetic average of the similarities between a candidate object and each of the cluster members. All objects receive equal weights in the computation. The similarity matrix is updated and reduced in size at each clustering step. Clustering proceeds by agglomeration. Average Clustering Example: Plankton Data Let s return to the plankton data set to develop the 4 methods of average clustering. Recall there are 38 species of plankton 5 ponds, 0/1 data were collected, S 20 coefficient was derived with k = 2: Ponds Ponds Unweighted Arithmetic Average Clustering UPGMA Example, Plankton Data Set At step 1, the highest similarity value is identified S(212,214) = 0.600; hence the first two objects fuse at The similarity of these two objects with each of the remaining objects in the study must be averaged (values in the inner box of step 1); this results in a reduction of the size of the similarity matrix, and produces the matrix shown in step 2. Spring
16 Step-1 Step-2 UPGMA Example, Plankton Data Set Objects Objects Unweighted Arithmetic Average Clustering UPGMA Example, Plankton Data Set At step 2, the highest similarity value remaining is identified (S = 0.500); it indicates that 431 and 432 fuse at Again, this similarity value is obtained by averaging the boxed values; this produces a new reduced similarity matrix for the next step. At step 3, the largest similarity is 0.250; it leads to the fusion of the already-formed group (431, 432) with object 233 at a level of Because there is 1 object in group 233 and two in group (431,432), the fused similarity is calculated as [(0.0355*1) + ( * 2)]/3. Step-2 Step-3 Step-4 UPGMA Example, Plankton Data Set Objects Objects Objects Spring
. The resulting dendrogram: 0.058 0.250 UPGMA 0.500 0.600 0.")
17 Unweighted Arithmetic Average Clustering UPGMA Example, Plankton Data Set > MVSP First, calculate similarity coefficients in Excel, then build a symmetrical data matrix... Unweighted Arithmetic Average Clustering UPGMA Example, Plankton Data Set > MVSP Select UPGMA (S will be indicated as pre-calculated ). The resulting dendrogram: UPGMA Unknown measure Weighted Arithmetic Average Clustering (WPGMA) It often occurs in EEB that groups of objects, representing different regions or groups, are of unequal sample size. Eliminating objects to equalize the clusters would mean discarding valuable information. Unfortunately, the presence of a large group of objects, which are more similar a priori because of their common origin, may greatly distort a UPGMA. WPGMA down-weights the largest group by giving equal weights to the two branches of the dendrogram that are about to fuse. Spring
18 Weighted Arithmetic Average Clustering (WPGMA) In the specific case of the plankton example, the only step that changes is step-4 where the the last fusion value is calculated. It is calculated as: ( )/2 = Objects Weighted Arithmetic Average Clustering WPGMA Example, Plankton Data Set > MVSP WPGMA Unknown measure Unweighted Centroid Clustering (UPGMC) Unweighted centroid clustering, or unweighted pair-group centroid method (UPGMC; Sneath & Sokal 1973) is based on a simple geometric approach. The centroid of a cluster of objects may be imagined as the type-object of the cluster, whether that object actually exists or is only a mathematical construct. In A-space, the co-ordinates of the centroid of a cluster are computed by averaging the coordinates of the objects in the group. Spring
19 Unweighted Centroid Clustering (UPGMC) UPGMC proceeds to the fusion of objects or clusters presenting the highest similarity, as in the previous methods. At each step, the members of a cluster are replaced by their common centroid (i.e., mean point ). The centroid is considered to represent a new object for the remainder of the clustering procedure; in the next step, one looks again for the pair of objects with the greatest similarity, on which the procedure of fusion is repeated. Unweighted Centroid Clustering (UPGMC) Gower (1967) proposed the following formula for centroid clustering, where the similarity of the centroid (hi) of the objects of clusters h and i with a third object or cluster g is computed from the similarities S(h,g), S(i,g), S(h,i): wh wi wh wi S( hi,g) = S ( h,g) + S ( i,g) + [1 S ( h,i)] w ( ) 2 h + wi wh + wi wh + wi where the w s are weights given to the clusters. g, h, & i can represent points or clusters. The number of objects n h and n i are often used as weights w h and w i. Unweighted Centroid Clustering (UPGMC) Objects Step Objects Step Spring
20 Unweighted Centroid Clustering (UPGMC) Objects Step Objects Step Objects Step Unweighted Centroid Clustering (UPGMC) Example, Plankton Data Set NB: Reversal UPGMC Unknown measure Unweighted Centroid Clustering (UPGMC) Final Comments As seen in the previous dendrogram, UPGMC may lead to reversals. Many authors feel uncomfortable about reversals since they violate the ultrametric property. Unweighted centroid clustering may be used with any similarity coefficient, but the Gower s formula presented here is the only one that retains its geometric properties for similarities corresponding to metric distances (cf. S 19 ) Spring
21 Weighted Centroid Clustering (WPGMC) Weighted centroid clustering was first proposed by Gower (1967) and referred to as the weighted pair-group centroid method (WPGMC) by Sneath and Sokal (1973). It plays the same role with respect to UPGMC as WPGMA plays with respect to UPGMA. Certain centroids may be biased because they are overrepresented in the data and WPGMC adjusts for this. The problem is corrected by giving equal weights to two clusters on the verge of fusing, independently of the number of objects in each cluster. Weighted Centroid Clustering (WPGMC) To achieve the weighting, we re-write the previous UPGMC equation to a WPGMC form: 1 1 S( hi, g) = S( h, g) + S( i, g) + 1 S( h, i) 2 4 [ ] [ ] In the pond example, the last fusion is calculated as: 1 1 S [(233, ),( ) ] = [ ] + ( ) = Weighted Centroid Clustering (WPGMC) Example, Plankton Data Set Note that no reversal took place at final node WPGMC Unknown measure Spring
22 Weighted Centroid Clustering (WPGMC) Final Comments Note that WPGMC did not produce a reversal at the last node, although, WPGMC is capable of producing reversals (in general). Note also that in R-mode, weighted centroid clustering does not make sense if the measure of association is Pearson s r. Correlations are cosine transformations of the angles between descriptors and these cannot be combined using the WPGMC equation. Ward s Minimum Variance Method (Ward s) Ward s (1963) minimum variance method is related to the centroid methods in that it too leads to a geometric representation in which cluster centroids play an important role. To form clusters, the method minimizes an objective function which is, in this case, the same squared error criterion as that used in the MANOVA. At the beginning of the procedure, each object is in a cluster of its own, so that the distance of an object to its cluster centroid is 0; hence, the sum of all these distances is also 0. As clusters form, the centroids move away from actual object coordinates and the sums of the squared distances from the objects to centroids increases. Ward s Minimum Variance Method (Ward s) Ward s method finds the pair of objects or clusters whose fusion increases as little as possible the sum, of the squared distances between objects and cluster centroids. The distance of object xi to the centroid m of its cluster is computed using the Euclidean distance formula: p 2 yij m j j= 1 The sum of squared distances of all objects in cluster k to their 2 common centroid is called error in ANOVA, hence : nk p = 2 ( k ) ( k ) k ij j i j = 1 = 1 2 e y m where y ij (k) is the value of the descriptor y j for an object i member of group (k) and m j (k) is the mean value of the descriptor j over all members of group k. e k Spring
23 Ward s Minimum Variance Method (Ward s) Alternatively, the within-cluster sums of squared errors e k2 can be computed as the mean of the squared distances among cluster members: n k 2 2 ek = Dhi / nk h, i= 1 where the D hi 2 are the squared distances among objects in cluster k and nk is the number of objects in that cluster. Ward s Minimum Variance Method (Ward s) The sum of squared errors E 2 k, for all K clusters corresponding to a given partition, is the criterion to be minimized at each step: E = K 2 2 K ek k = 1 At each clustering step, two objects or clusters h and i are merged into a new cluster hi, as in previous sections. Since changes occurred only in the groups h, i, and hi, the change in the overall sum of squared errors, E 2 hi, may be computed from the changes as: E = e e e hi hi h i Ward s Minimum Variance Method (Ward s) It can be shown that this change depends only on the distance between the centroids of clusters h and i and on their numbers of objects n h and n i : p 2 n ( ) ( ) 2 h ni E = m j m j n + n h i hi = h i j 1 Another way is to calculate the fusion distances between hi and g for an agglomeration table: n 2 h + ng n 2 i + ng n 2 g 2 D ( hi, g) = D ( h, g) + D ( i, g) D ( h, i) n + n + n n + n + n n + n + n h i g h i g h i g Spring
24 Ward s Clustering Example, Plankton Data Set Step-1 ID lowest squared distance at each step, groups fuse by prev. D 2 (hi,g) eq. Step-2 Objects Objects NB: squared distances used and computed as D = (1 - S) Step-2 Step-3 Step-4 Ward s Clustering Objects Objects Objects General Agglomerative Clustering Lance & Williams (1967) proposed a general model that encompasses all the agglomerative clustering methods previously presented, except using an intermediate linkage. The general model allows one to select an agglomerative clustering model by choosing the values of four parameters called α h, α i, β, and γ, which determine the clustering strategy. Spring
25 General Agglomerative Clustering For similarities, the general model is: S( hi, g) = (1 α α β ) + α S( h, g) + α S( i, g) + β S( h, i) γ S( h, g) S( i, g) h i h i When using distances, the equation becomes: D( hi, g) = α D( h, g) + α D( i, g) + β D( h, i) γ D( h, g) D( i, g) h i Clustering proceeds in the same way for all combinatorial agglomerative methods. As the similarity decreases, a new cluster is obtained by the fusion of the two most similar objects and/or clusters. The matrix is thus reduced by one row and one column at a time. Flexible Clustering Lance & Williams (1967) proposed to vary the parameter β between -1 and +1 to obtain a series of intermediate solutions between single linkage chaining and the space dilation of complete linkage. This method is also referred to in the literature as Beta-flexible Clustering. Lance & Williams have shown that, if the other parameters are constrained as follows: α = α = (1 β ) / 2 and γ = 0 h i then the resulting clustering will be ultrametric. Flexible Clustering When β is close to 1, strong chaining is obtained. When β is close to -1, strong space dilation is observed. The space properties are conserved for small values of β around 0 (± 0.25). Like weighted centroid clustering, flexible clustering is compatible with all association measures except Pearson s r. The following figure shows the effect of varying β in the clustering of 20 objects: Spring
26 Flexible Clustering Notes: Identical data set! Considerable divergence Best resolution obtained at: β=0 ± 0.25 β > 0.25 = poor performance Information Analysis The Q-mode clustering method called information analysis was developed for EEB purposes by Lance & Williams (1966). It does NOT proceed by the normal steps of similarity calculation followed by clustering. It is a direct method of clustering based on information measures. Information analysis is a type of unweighted centroid clustering, specifically adapted to species data. Shannon s Formula Despite it s widespread use as a measure of species diversity, Shannon s formula was originally designed to measure the diversity of information in a frequency or probability distribution: H p = j j = 1 p log p In practice, this formula is usually applied to presenceabsence data. The information measure is NOT applicable to raw abundance data here because too many different states would be created among species. j Spring
27 Information Analysis Example, Pond Data Ponds Sp. j p j (1-p j ) Information Analysis Example, Pond Data The entropy of each species presence-absence descriptor j is calculated on the basis of the probabilities of presence p j and absence (1-p j ) of species j, which appear in the right-hand side of the table. The probability of presence is estimated as the number of ponds where species j is present, divided by the total number of ponds in the cluster under consideration. The probability of absence is estimated likewise. The entropy of species j is therefore: H ( j) = p j log p j + (1 p j ) log(1 p j ) for 0 < p j < 1 Information Analysis Example, Pond Data The base of the logarithms is unimportant as long as it is consistent throughout the calculations. We will use natural logs for the present example. Thus, for the first species, H(1) would be: H(1) = -[0.4 ln (0.4) ln (0.6)] = The information of the conditional probability table can be calculated by summing the entropies per species (considering all species have the same weight). Spring
28 Information Analysis Example, Pond Data Since the measure of the total information in the group must also take in to account the number of objects in the cluster, the formula is defined as: p I = n p j logp j + (1 p j )log(1 p j ) for 0 < p j < 1 j= 1 Where p is the number of species represented in the group of n objects (ponds). For the group of 5 ponds, I = -5 [8 (-0.673)] = I is zero when all ponds in a group contain the same species. Information Analysis Example, Pond Data At each clustering step, three series of values are considered: (a) the total information I in each group; 0 at beginning, (b) the value of I for all possible combinations of groups taken two at a time, and (c) the increase of information I resulting from each possible fusion. All of these values can be placed in a matrix, initially of dimension n n which decreases as clustering proceeds. For the data set here, values of information in each group (a) are placed on the diagonal, values (b) in the lower hemi-matrix, and values (c) in the upper hemi-matrix. Information Analysis Example, Pond Data Ponds Ponds The I for two groups is found by subtracting the corresponding values I, on the diagonal, from the value I of their combination in the lower hemi-matrix. Values on the diagonal are all 0 in the first matrix only, thus values in the upper & lower hemi-matrices are identical (not the case in subsequent matrices). Spring
29 Information Analysis Example, Pond Data The first fusion is identified by the lowest I value found in the upper hemi-matrix. This value is for pairs (212,214) and (431,432), which therefore fuse. A new matrix of I values is computed: Groups Groups Groups Groups Information Analysis Example, Pond Data The I values in the upper triangle now differ from the I s in the lower triangle since there are I values on the diagonal. The I corresponding to the group (212, 214, 431, 432), for example, is calculated as = The lowest value of I for (233, 431, 432) fuses at the next step (7.638). The matrix is reduce to 2 2 and the last fusion occurs at I = Information Analysis Example, Pond Data Cluster Analysis Information Spring
30 Hierarchical Divisive Clustering Contrary to agglomerative methods, hierarchical divisive techniques use the whole set of objects as the starting point. They divide it into two or several subgroups, after which they consider each subgroup and divide it again, until the criterion chosen to end the divisive procedure is met. Options include: Monothetic methods Polythetic methods Twinspan Monothetic Methods The clustering methods that use one descriptor at a time are less than ideal. The best known of these analyses is association analysis (Williams & Lambert 1959). Association analysis may actually be applied to any binary data table, not just species. The problem is to identify, at each step of the procedure, which descriptor is the most strongly associated with all of the others. In other words, individual species are used as divisors. Association Analysis Chi-square values are computed for all pairs of descriptors using the usual formula: 2 2 n( ad bc) Χ = [( a + b)( c + d)( a + c)( b + d )] The formula may include Yates correction for small sample sizes, as in similarity coefficient S 25. The X 2 values relative to each descriptor k are summed: p 2 Χ jk for j j= 1 k Spring
31 Association Analysis The largest sum identified the descriptor that is most closely related to all of the others. The first partition is made along the states of this descriptor (present/absent). The original association analysis is an excellent tool for understanding the essence of how cluster analysis works, and while not widely used anymore, still has some useful applications and is prevalent in the older literature. There is an excellent discussion and worked example of the methodology in Causton (1988). The only available computer version that I am aware of is by Ludwig and Reynolds (1988) which is a DOS application running from a BASIC compiler. Association Analysis Association analysis results from Ludwig and Reynolds. Note the similarity of overall result with WRT previous algorithms. 5 0 Chi-Square Polythetic Methods There is no satisfactory algorithm for the hierarchical division of objects based upon the entire set of descriptors. One form is the dissimilarity analysis of Mcnaughton-Smith (1964) that firsts looks for the object that is the most different from everything else and then removes it. One by one, each object is removed. Objects are removed up to the point where the distance between clusters can no longer be increased. Unfortunately, dissimilarity is known to produce some very odd results, particularly when many small clusters are present. Spring
32 TWINSPAN Two Way INdicator SPecies ANalysis Despite the name, TWINSPAN is not just designed to identify indicator species (name came from its original development in vegetation science). This is a very popular procedure that classifies the objects by hierarchical division and constructs an ordered two-way table. TWINSPAN produces a tabular matrix arrangement that approximates a Braun-Blanquet phytosociological analysis table. TWINSPAN The technique is based on the concept that a group of samples which constitute a community type will have a corresponding group of species that characterize that type (indicator species). Since reciprocal averaging (RA ordination procedure to be covered soon) arranges species and samples in a way that best expresses that relationship, RA is the basis of TWINSPAN. TWINSPAN is largely based on presence-absence data, but quantitative data are incorporated by considering different abundance levels of the same species to be different species. This results in what is commonly referred to as pseudo-species, and, depending on how you set it up, a single species may "become" 5 pseudo-species. TWINSPAN This technique is computationally pretty complex & we can not easily do a worked example here. However, it relies on basic principles that we have already discussed. An excellent treatment of the method can be found in Kent and Coker (1992). Basically, TWINSPAN begins with an RA ordination, which is then divided at its centroid. Each sample is then classified into one of two groups, and a discriminant function analysis is used to refine the classification; some samples will switch groups, depending on the maximum likelihood determined by the DFA. This new dichotomy is used to look for preferential (indicator) species. Spring
33 TWINSPAN Species are then scored according to their degree of preference for one side or the other, highly preferential species are those that are at least 3 times more common on one side. These species scores are once again applied back to the samples, using a weighting algorithm, and borderline cases may once again switch position. This is now the first division. The process is hierarchical, and so each of the new groups then undergoes the same process, until either a certain number of divisions have been reached or a group is too small to subdivide further. Once all the samples have thus been classified, the species are classified according to their overall fidelity to the groups, and a sorted table is produced. TWINSPAN While this is the most popular of the hierarchical divisive clustering techniques, there are some problems. The original TWINSPAN code was buggy and produced poor results. There is a new version contained within PC-ORD (v.4) which is very reliable and produces excellent results. One computational problem that has considerable biological consequence has to to do with the way early cuts are defined these make all the difference, and can be affected too strongly by only a few species. Nonetheless, this procedure has good utility in your repertoire of multivariate methods. TWINSPAN -Example- Consider a data set that comes from Gauch (1982) that contains 14 spp. of forest trees sampled in 10 forests. The data are octave transforms (0-10 scale) based upon relative abundances. QUMA QUVE CAOV PRSE QUAL JUNI QURU JUCI ULAM TIAM ULRU CACO OSVI ACSA Spring


34 TWINSPAN TWINSPAN PC-ORD TWINSPAN PC-ORD Note that a dendrogram can be drawn by hand using the columns of numbers at the right. In the first column, the 0/1s reflect the first bifurcation. Each additional column reflects subsequent bifurcations. Spring
35 Partitioning by K-means Partitioning consists in finding a single partition of a set of objects. In other words, given n objects in a p-dimensional space, determine a partition of objects into K groups, or clusters, such that the objects within each cluster are more similar to each other than to objects in other clusters. The number of K groups is determined by the user. Partitioning by K-means The difficulty here is in deciding what more similar means. In other words, what criterion determines the level of similarity? A global criterion would be, for instance, to represent each cluster by a type-object on a priori grounds and assign each object to the nearest type. A local criterion uses the local structure of the data to delineate clusters; groups are identified by identifying high density regions in the data (most common approach). Partitioning by K-means This algorithm was originally proposed by MacQueen (1967) and popularized by Lance and Williams (1967). The objective function that the partition to discover should minimize is the same as in Ward s classification method: the total sum of squares (E 2 k, or TESS). A problem encountered by the algorithm is that the solution depends, to some extent, on the initial position of the centroids. Generically, this issue of the final answer depending upon initial conditions is referred to the as the local minimum problem in algorithms. Spring

36 Partitioning by K-means This is an excellent method, particularly for very large data sets, but has some limitations: First, it can only be used with Euclidean distances. Many types of EEB data (e.g., species data in particular) are not amenable to analysis with Euclidean distance. Second, it requires continuous data with no outliers. Some categorical data can be included, but this usually creates problems. Spring

37 Spring
38 Cluster Validation At this point you should be thinking, after all of these algorithms, which one is producing real clusters? Alternatively, which clusters of a given technique are largely artifacts of that particular algorithm? It is important to validate cluster analyses. One needs to show that the clustering structure is unique; i.e., that it departs from what might be expected from unstructured data. BAD NEWS: validation procedures are generally not available in most stats software packages. Spring
39 Cluster Validation Validation can be carried out in non-statistical ways, as well as statistical ways. The latter certainly provides stronger inference (several nice review papers have been written on how to do this; e.g., Milligan 1996). Commonly used nonstatistical methods include: (1) Plot the clusters onto an ordination plot and look for separation of clusters. (2) Compare the results of several clustering algorithms. Summary of Clustering Methods Pros & Cons Hierarchical agglomeration: linkage clustering Single Linkage Computation simple; contraction of space (chaining); combinatorial method. Good complement to ordination. Complete Linkage Dense nuclei of objects; space expansion; many objects cluster at low similarity; arbitrary rules to resolve conflicts; combinatorial method; Increases contrast among clusters. Intermediate Linkage Preservation of reference space A; non-combinatorial not included in the L&W general model. Preferable to SL & CL in most cases. Summary of Clustering Methods Pros & Cons Hierarchical agglomeration: average clustering UPGMA: Fusion of clusters when the similarity reaches the mean cluster similarity. For objects obtained by simple or random sampling. WPGMA: Same, but adjustment for group sizes. Preferable when sampling was other than simple or random. UPGMC: Fusion of clusters with closest centroids; may produce reversals. For objects obtained by simple or random sampling. WPGMC: Same, with adjustment for group sizes; may produce reversals; Preferable when sampling was other than simple or random. Spring
40 Summary of Clustering Methods Pros & Cons Hierarchical agglomeration: flexible clustering & information analysis Flexible clustering: algorithm permits contraction, conservation, or dilation of A-space; pairwise relationships between objects are lost; combinatorial method. All are implemented with the same simple straightforward algorithm. Information analysis: minimal chaining; only for Q-mode clustering with presence-absence data. Use is unclear, similarities reflect double absences as well as double presences; not recommended. Summary of Clustering Methods Pros & Cons Hierarchical division Monothetic: division of the objects following the states of the best descriptor; useful only to split data sets in to large clusters. Polythetic: computationally intense, small data sets only (except if super-computer available). TWINSPAN: dichotomized ordination analysis; gives clear ordered table classifying sites and species; ecological justification of some steps questionable (e.g., pseudospecies). Summary of Clustering Methods Pros & Cons K-means clustering K-means clustering: minimizes within-group sum of squares; different rules may suggest different optimal numbers of clusters; danger of incorrect separation of members of minor clusters near the beginning of clustering; produces a partition of K groups as determined by the user. Spring
41 Clustering Methods Final Comments Most clustering methods remain very sensitive to outliers. These should be removed prior to any analysis. The question of which similarity or distance measure to use remains largely unanswered, but there are useful guidelines. Comparative studies seem to favor the use of average linkage in terms of its ability to recover known clusters. With most of the clustering techniques, there are a large number of parameters to be set by the user and care must be exercised. Exploratory Data Analysis Another approach to the search for classification or typologies of objects is through the use of graphical methods. Graphical methods provide an extremely flexible medium for explaining, interpreting, and analyzing data by means of points, lines, areas, faces, or other geometric forms. Collectively, these methods are often referred to as icon plots. They permit the graphical representation of p-dimensions in alternative forms. Exploratory Data Analysis Graphical Methods, Example Let s return to the forest soils example (n = 10, p = 6) that we used to develop the previous K-means procedure and explore some of the graphical EDA procedures. Both R and Systat offers a variety of options in this realm. We will look at 5 graphical options for the exploration of multivariate data: Star, Fourier Blob, Chernoff Faces, Weather Vane, and Sun plots. Spring
42 Star icons are profile icons in polar coordinates; the distance of each point from the center of the icon shows the value of the corresponding variable. Separate icons are drawn for each case (n = 10). Star Plots - Systat - Polar coordinate Fourier waveforms. Each case in the data set is shown by a blob, and cases with similar values across all variables will have similar shapes. Fourier Blobs - Systat - Chernoff faces represent many variables by assigning each variable to a distinct facial feature (head, nose, mouth, eyes, eyebrows, and ears). Cases with similar values for particular variables will have similar corresponding facial features. Max p = 20. Chernoff Faces - Systat - Spring

43 Weather Vane Plots - Systat - Sun Plots - Systat - Chernoff Faces - R - Icons represent three variables. The first determines the radius of the central circle, the second determines the length of the vane, and the third determines its direction. Sun plots are similar to star plots. However, the order of the variables is determined by the first principal component, which makes them easier to interpret. Spring

44 Call to faces results in automatic assignment of variables found in dataframe to different facial characteristics. Essentially this becomes the legend used to interpret corresponding figure. Spring


45 Spring
46 Spring
3. Cluster analysis Overview
 Université Laval Multivariate analysis - February 2006 1 3.1. Overview 3. Cluster analysis Clustering requires the recognition of discontinuous subsets in an environment that is sometimes discrete (as
3. Cluster analysis Overview
 Université Laval Analyse multivariable - mars-avril 2008 1 3.1. Overview 3. Cluster analysis Clustering requires the recognition of discontinuous subsets in an environment that is sometimes discrete (as
Cluster Analysis. Angela Montanari and Laura Anderlucci
 Cluster Analysis Angela Montanari and Laura Anderlucci 1 Introduction Clustering a set of n objects into k groups is usually moved by the aim of identifying internally homogenous groups according to a
Lesson 3. Prof. Enza Messina
 Lesson 3 Prof. Enza Messina Clustering techniques are generally classified into these classes: PARTITIONING ALGORITHMS Directly divides data points into some prespecified number of clusters without a hierarchical
Hierarchical Clustering / Dendrograms
 Chapter 445 Hierarchical Clustering / Dendrograms Introduction The agglomerative hierarchical clustering algorithms available in this program module build a cluster hierarchy that is commonly displayed
Cluster Analysis. Mu-Chun Su. Department of Computer Science and Information Engineering National Central University 2003/3/11 1
 Cluster Analysis Mu-Chun Su Department of Computer Science and Information Engineering National Central University 2003/3/11 1 Introduction Cluster analysis is the formal study of algorithms and methods
Multivariate analyses in ecology. Cluster (part 2) Ordination (part 1 & 2)
 Ordination (part 1 & 2)") Multivariate analyses in ecology Cluster (part 2) Ordination (part 1 & 2) 1 Exercise 9B - solut 2 Exercise 9B - solut 3 Exercise 9B - solut 4 Exercise 9B - solut 5 Multivariate analyses in ecology Cluster
Multivariate analyses in ecology Cluster (part 2) Ordination (part 1 & 2) 1 Exercise 9B - solut 2 Exercise 9B - solut 3 Exercise 9B - solut 4 Exercise 9B - solut 5 Multivariate analyses in ecology Cluster
Clustering CS 550: Machine Learning
 Clustering CS 550: Machine Learning This slide set mainly uses the slides given in the following links: http://www-users.cs.umn.edu/~kumar/dmbook/ch8.pdf http://www-users.cs.umn.edu/~kumar/dmbook/dmslides/chap8_basic_cluster_analysis.pdf
CHAPTER 4: CLUSTER ANALYSIS
 CHAPTER 4: CLUSTER ANALYSIS WHAT IS CLUSTER ANALYSIS? A cluster is a collection of data-objects similar to one another within the same group & dissimilar to the objects in other groups. Cluster analysis
Hierarchical Clustering
 What is clustering Partitioning of a data set into subsets. A cluster is a group of relatively homogeneous cases or observations Hierarchical Clustering Mikhail Dozmorov Fall 2016 2/61 What is clustering
CSE 5243 INTRO. TO DATA MINING
 CSE 5243 INTRO. TO DATA MINING Cluster Analysis: Basic Concepts and Methods Huan Sun, CSE@The Ohio State University 09/25/2017 Slides adapted from UIUC CS412, Fall 2017, by Prof. Jiawei Han 2 Chapter 10.
Unsupervised Learning and Clustering
 Unsupervised Learning and Clustering Selim Aksoy Department of Computer Engineering Bilkent University saksoy@cs.bilkent.edu.tr CS 551, Spring 2008 CS 551, Spring 2008 c 2008, Selim Aksoy (Bilkent University)
CSE 5243 INTRO. TO DATA MINING
 CSE 5243 INTRO. TO DATA MINING Cluster Analysis: Basic Concepts and Methods Huan Sun, CSE@The Ohio State University Slides adapted from UIUC CS412, Fall 2017, by Prof. Jiawei Han 2 Chapter 10. Cluster
Unsupervised Learning and Clustering
 Unsupervised Learning and Clustering Selim Aksoy Department of Computer Engineering Bilkent University saksoy@cs.bilkent.edu.tr CS 551, Spring 2009 CS 551, Spring 2009 c 2009, Selim Aksoy (Bilkent University)
Multivariate Analysis
 Multivariate Analysis Cluster Analysis Prof. Dr. Anselmo E de Oliveira anselmo.quimica.ufg.br anselmo.disciplinas@gmail.com Unsupervised Learning Cluster Analysis Natural grouping Patterns in the data
Forestry Applied Multivariate Statistics. Cluster Analysis
 1 Forestry 531 -- Applied Multivariate Statistics Cluster Analysis Purpose: To group similar entities together based on their attributes. Entities can be variables or observations. [illustration in Class]
Chapter 6: Cluster Analysis
 Chapter 6: Cluster Analysis The major goal of cluster analysis is to separate individual observations, or items, into groups, or clusters, on the basis of the values for the q variables measured on each
MultiDimensional Signal Processing Master Degree in Ingegneria delle Telecomunicazioni A.A
 MultiDimensional Signal Processing Master Degree in Ingegneria delle Telecomunicazioni A.A. 205-206 Pietro Guccione, PhD DEI - DIPARTIMENTO DI INGEGNERIA ELETTRICA E DELL INFORMAZIONE POLITECNICO DI BARI
Cluster Analysis. Ying Shen, SSE, Tongji University
 Cluster Analysis Ying Shen, SSE, Tongji University Cluster analysis Cluster analysis groups data objects based only on the attributes in the data. The main objective is that The objects within a group
MSA220 - Statistical Learning for Big Data
 MSA220 - Statistical Learning for Big Data Lecture 13 Rebecka Jörnsten Mathematical Sciences University of Gothenburg and Chalmers University of Technology Clustering Explorative analysis - finding groups
Clustering part II 1
 Clustering part II 1 Clustering What is Cluster Analysis? Types of Data in Cluster Analysis A Categorization of Major Clustering Methods Partitioning Methods Hierarchical Methods 2 Partitioning Algorithms:
Tree Models of Similarity and Association. Clustering and Classification Lecture 5
 Tree Models of Similarity and Association Clustering and Lecture 5 Today s Class Tree models. Hierarchical clustering methods. Fun with ultrametrics. 2 Preliminaries Today s lecture is based on the monograph
Cluster Analysis. Prof. Thomas B. Fomby Department of Economics Southern Methodist University Dallas, TX April 2008 April 2010
 Cluster Analysis Prof. Thomas B. Fomby Department of Economics Southern Methodist University Dallas, TX 7575 April 008 April 010 Cluster Analysis, sometimes called data segmentation or customer segmentation,
Classification. Vladimir Curic. Centre for Image Analysis Swedish University of Agricultural Sciences Uppsala University
 Classification Vladimir Curic Centre for Image Analysis Swedish University of Agricultural Sciences Uppsala University Outline An overview on classification Basics of classification How to choose appropriate
Clustering and Visualisation of Data
 Clustering and Visualisation of Data Hiroshi Shimodaira January-March 28 Cluster analysis aims to partition a data set into meaningful or useful groups, based on distances between data points. In some
CLUSTER ANALYSIS. V. K. Bhatia I.A.S.R.I., Library Avenue, New Delhi
 CLUSTER ANALYSIS V. K. Bhatia I.A.S.R.I., Library Avenue, New Delhi-110 012 In multivariate situation, the primary interest of the experimenter is to examine and understand the relationship amongst the
BBS654 Data Mining. Pinar Duygulu. Slides are adapted from Nazli Ikizler
 BBS654 Data Mining Pinar Duygulu Slides are adapted from Nazli Ikizler 1 Classification Classification systems: Supervised learning Make a rational prediction given evidence There are several methods for
Unsupervised Learning
 Outline Unsupervised Learning Basic concepts K-means algorithm Representation of clusters Hierarchical clustering Distance functions Which clustering algorithm to use? NN Supervised learning vs. unsupervised
Finding Clusters 1 / 60
 Finding Clusters Types of Clustering Approaches: Linkage Based, e.g. Hierarchical Clustering Clustering by Partitioning, e.g. k-means Density Based Clustering, e.g. DBScan Grid Based Clustering 1 / 60
Clustering. Sandrien van Ommen
 Clustering Sandrien van Ommen Overview Why clustering When clustering Types of clustering Dialects Distances Dutch towns Buldialect Conclusion Why clustering To find similarity in your data T-test & Anova
Clustering. CE-717: Machine Learning Sharif University of Technology Spring Soleymani
 Clustering CE-717: Machine Learning Sharif University of Technology Spring 2016 Soleymani Outline Clustering Definition Clustering main approaches Partitional (flat) Hierarchical Clustering validation
Data Clustering Hierarchical Clustering, Density based clustering Grid based clustering
 Data Clustering Hierarchical Clustering, Density based clustering Grid based clustering Team 2 Prof. Anita Wasilewska CSE 634 Data Mining All Sources Used for the Presentation Olson CF. Parallel algorithms
Sequence clustering. Introduction. Clustering basics. Hierarchical clustering
 Sequence clustering Introduction Data clustering is one of the key tools used in various incarnations of data-mining - trying to make sense of large datasets. It is, thus, natural to ask whether clustering
Understanding Clustering Supervising the unsupervised
 Understanding Clustering Supervising the unsupervised Janu Verma IBM T.J. Watson Research Center, New York http://jverma.github.io/ jverma@us.ibm.com @januverma Clustering Grouping together similar data
PAM algorithm. Types of Data in Cluster Analysis. A Categorization of Major Clustering Methods. Partitioning i Methods. Hierarchical Methods
 Whatis Cluster Analysis? Clustering Types of Data in Cluster Analysis Clustering part II A Categorization of Major Clustering Methods Partitioning i Methods Hierarchical Methods Partitioning i i Algorithms:
Data Mining Chapter 9: Descriptive Modeling Fall 2011 Ming Li Department of Computer Science and Technology Nanjing University
 Data Mining Chapter 9: Descriptive Modeling Fall 2011 Ming Li Department of Computer Science and Technology Nanjing University Descriptive model A descriptive model presents the main features of the data
Supervised vs. Unsupervised Learning
 Clustering Supervised vs. Unsupervised Learning So far we have assumed that the training samples used to design the classifier were labeled by their class membership (supervised learning) We assume now
SYDE Winter 2011 Introduction to Pattern Recognition. Clustering
 SYDE 372 - Winter 2011 Introduction to Pattern Recognition Clustering Alexander Wong Department of Systems Design Engineering University of Waterloo Outline 1 2 3 4 5 All the approaches we have learned
Chapter 6 Continued: Partitioning Methods
 Chapter 6 Continued: Partitioning Methods Partitioning methods fix the number of clusters k and seek the best possible partition for that k. The goal is to choose the partition which gives the optimal
Statistics 202: Data Mining. c Jonathan Taylor. Week 8 Based in part on slides from textbook, slides of Susan Holmes. December 2, / 1
 Week 8 Based in part on slides from textbook, slides of Susan Holmes December 2, 2012 1 / 1 Part I Clustering 2 / 1 Clustering Clustering Goal: Finding groups of objects such that the objects in a group
Fast, Easy, and Publication-Quality Ecological Analyses with PC-ORD
 Emerging Technologies Fast, Easy, and Publication-Quality Ecological Analyses with PC-ORD JeriLynn E. Peck School of Forest Resources, Pennsylvania State University, University Park, Pennsylvania 16802
Dimension reduction : PCA and Clustering
 Dimension reduction : PCA and Clustering By Hanne Jarmer Slides by Christopher Workman Center for Biological Sequence Analysis DTU The DNA Array Analysis Pipeline Array design Probe design Question Experimental
Hierarchical Clustering
 Hierarchical Clustering Produces a set of nested clusters organized as a hierarchical tree Can be visualized as a dendrogram A tree like diagram that records the sequences of merges or splits 0 0 0 00
CLUSTERING IN BIOINFORMATICS
 CLUSTERING IN BIOINFORMATICS CSE/BIMM/BENG 8 MAY 4, 0 OVERVIEW Define the clustering problem Motivation: gene expression and microarrays Types of clustering Clustering algorithms Other applications of
Stat 321: Transposable Data Clustering
 Stat 321: Transposable Data Clustering Art B. Owen Stanford Statistics Art B. Owen (Stanford Statistics) Clustering 1 / 27 Clustering Given n objects with d attributes, place them (the objects) into groups.
INF4820. Clustering. Erik Velldal. Nov. 17, University of Oslo. Erik Velldal INF / 22
 INF4820 Clustering Erik Velldal University of Oslo Nov. 17, 2009 Erik Velldal INF4820 1 / 22 Topics for Today More on unsupervised machine learning for data-driven categorization: clustering. The task
Chapter VIII.3: Hierarchical Clustering
 Chapter VIII.3: Hierarchical Clustering 1. Basic idea 1.1. Dendrograms 1.2. Agglomerative and divisive 2. Cluster distances 2.1. Single link 2.2. Complete link 2.3. Group average and Mean distance 2.4.
University of Florida CISE department Gator Engineering. Clustering Part 5
 Clustering Part 5 Dr. Sanjay Ranka Professor Computer and Information Science and Engineering University of Florida, Gainesville SNN Approach to Clustering Ordinary distance measures have problems Euclidean
10701 Machine Learning. Clustering
 171 Machine Learning Clustering What is Clustering? Organizing data into clusters such that there is high intra-cluster similarity low inter-cluster similarity Informally, finding natural groupings among
TELCOM2125: Network Science and Analysis
 School of Information Sciences University of Pittsburgh TELCOM2125: Network Science and Analysis Konstantinos Pelechrinis Spring 2015 2 Part 4: Dividing Networks into Clusters The problem l Graph partitioning
Stats fest Multivariate analysis. Multivariate analyses. Aims. Multivariate analyses. Objects. Variables
 Stats fest 7 Multivariate analysis murray.logan@sci.monash.edu.au Multivariate analyses ims Data reduction Reduce large numbers of variables into a smaller number that adequately summarize the patterns
Clustering Part 3. Hierarchical Clustering
 Clustering Part Dr Sanjay Ranka Professor Computer and Information Science and Engineering University of Florida, Gainesville Hierarchical Clustering Two main types: Agglomerative Start with the points
CSE 5243 INTRO. TO DATA MINING
 CSE 5243 INTRO. TO DATA MINING Cluster Analysis: Basic Concepts and Methods Huan Sun, CSE@The Ohio State University 09/28/2017 Slides adapted from UIUC CS412, Fall 2017, by Prof. Jiawei Han 2 Chapter 10.
Data Mining Cluster Analysis: Basic Concepts and Algorithms. Slides From Lecture Notes for Chapter 8. Introduction to Data Mining
 Data Mining Cluster Analysis: Basic Concepts and Algorithms Slides From Lecture Notes for Chapter 8 Introduction to Data Mining by Tan, Steinbach, Kumar Tan,Steinbach, Kumar Introduction to Data Mining
An Unsupervised Technique for Statistical Data Analysis Using Data Mining
 International Journal of Information Sciences and Application. ISSN 0974-2255 Volume 5, Number 1 (2013), pp. 11-20 International Research Publication House http://www.irphouse.com An Unsupervised Technique
9/29/13. Outline Data mining tasks. Clustering algorithms. Applications of clustering in biology
 9/9/ I9 Introduction to Bioinformatics, Clustering algorithms Yuzhen Ye (yye@indiana.edu) School of Informatics & Computing, IUB Outline Data mining tasks Predictive tasks vs descriptive tasks Example
Chemometrics. Description of Pirouette Algorithms. Technical Note. Abstract
 19-1214 Chemometrics Technical Note Description of Pirouette Algorithms Abstract This discussion introduces the three analysis realms available in Pirouette and briefly describes each of the algorithms
Summer School in Statistics for Astronomers & Physicists June 15-17, Cluster Analysis
 Summer School in Statistics for Astronomers & Physicists June 15-17, 2005 Session on Computational Algorithms for Astrostatistics Cluster Analysis Max Buot Department of Statistics Carnegie-Mellon University
Hierarchical Clustering
 Hierarchical Clustering Hierarchical Clustering Produces a set of nested clusters organized as a hierarchical tree Can be visualized as a dendrogram A tree-like diagram that records the sequences of merges
DATA CLASSIFICATORY TECHNIQUES
 DATA CLASSIFICATORY TECHNIQUES AMRENDER KUMAR AND V.K.BHATIA Indian Agricultural Statistics Research Institute Library Avenue, New Delhi-110 012 akjha@iasri.res.in 1. Introduction Rudimentary, exploratory
Hard clustering. Each object is assigned to one and only one cluster. Hierarchical clustering is usually hard. Soft (fuzzy) clustering
 clustering") An unsupervised machine learning problem Grouping a set of objects in such a way that objects in the same group (a cluster) are more similar (in some sense or another) to each other than to those in other
An unsupervised machine learning problem Grouping a set of objects in such a way that objects in the same group (a cluster) are more similar (in some sense or another) to each other than to those in other
COSC160: Detection and Classification. Jeremy Bolton, PhD Assistant Teaching Professor
 COSC160: Detection and Classification Jeremy Bolton, PhD Assistant Teaching Professor Outline I. Problem I. Strategies II. Features for training III. Using spatial information? IV. Reducing dimensionality
Working with Unlabeled Data Clustering Analysis. Hsiao-Lung Chan Dept Electrical Engineering Chang Gung University, Taiwan
 Working with Unlabeled Data Clustering Analysis Hsiao-Lung Chan Dept Electrical Engineering Chang Gung University, Taiwan chanhl@mail.cgu.edu.tw Unsupervised learning Finding centers of similarity using
Olmo S. Zavala Romero. Clustering Hierarchical Distance Group Dist. K-means. Center of Atmospheric Sciences, UNAM.
 Center of Atmospheric Sciences, UNAM November 16, 2016 Cluster Analisis Cluster analysis or clustering is the task of grouping a set of objects in such a way that objects in the same group (called a cluster)
Unsupervised Learning
 Harvard-MIT Division of Health Sciences and Technology HST.951J: Medical Decision Support, Fall 2005 Instructors: Professor Lucila Ohno-Machado and Professor Staal Vinterbo 6.873/HST.951 Medical Decision
AN IMPROVED K-MEANS CLUSTERING ALGORITHM FOR IMAGE SEGMENTATION
 AN IMPROVED K-MEANS CLUSTERING ALGORITHM FOR IMAGE SEGMENTATION WILLIAM ROBSON SCHWARTZ University of Maryland, Department of Computer Science College Park, MD, USA, 20742-327, schwartz@cs.umd.edu RICARDO
Lecture-17: Clustering with K-Means (Contd: DT + Random Forest)
") Lecture-17: Clustering with K-Means (Contd: DT + Random Forest) Medha Vidyotma April 24, 2018 1 Contd. Random Forest For Example, if there are 50 scholars who take the measurement of the length of the
Lecture-17: Clustering with K-Means (Contd: DT + Random Forest) Medha Vidyotma April 24, 2018 1 Contd. Random Forest For Example, if there are 50 scholars who take the measurement of the length of the
Gene Clustering & Classification
 BINF, Introduction to Computational Biology Gene Clustering & Classification Young-Rae Cho Associate Professor Department of Computer Science Baylor University Overview Introduction to Gene Clustering
Cluster analysis. Agnieszka Nowak - Brzezinska
 Cluster analysis Agnieszka Nowak - Brzezinska Outline of lecture What is cluster analysis? Clustering algorithms Measures of Cluster Validity What is Cluster Analysis? Finding groups of objects such that
Clustering in Data Mining
 Clustering in Data Mining Classification Vs Clustering When the distribution is based on a single parameter and that parameter is known for each object, it is called classification. E.g. Children, young,
DATA MINING LECTURE 7. Hierarchical Clustering, DBSCAN The EM Algorithm
 DATA MINING LECTURE 7 Hierarchical Clustering, DBSCAN The EM Algorithm CLUSTERING What is a Clustering? In general a grouping of objects such that the objects in a group (cluster) are similar (or related)
ECLT 5810 Clustering
 ECLT 5810 Clustering What is Cluster Analysis? Cluster: a collection of data objects Similar to one another within the same cluster Dissimilar to the objects in other clusters Cluster analysis Grouping
Notes. Reminder: HW2 Due Today by 11:59PM. Review session on Thursday. Midterm next Tuesday (10/09/2018)
") 1 Notes Reminder: HW2 Due Today by 11:59PM TA s note: Please provide a detailed ReadMe.txt file on how to run the program on the STDLINUX. If you installed/upgraded any package on STDLINUX, you should
1 Notes Reminder: HW2 Due Today by 11:59PM TA s note: Please provide a detailed ReadMe.txt file on how to run the program on the STDLINUX. If you installed/upgraded any package on STDLINUX, you should
Machine Learning (BSMC-GA 4439) Wenke Liu
 Wenke Liu") Machine Learning (BSMC-GA 4439) Wenke Liu 01-31-017 Outline Background Defining proximity Clustering methods Determining number of clusters Comparing two solutions Cluster analysis as unsupervised Learning
Machine Learning (BSMC-GA 4439) Wenke Liu 01-31-017 Outline Background Defining proximity Clustering methods Determining number of clusters Comparing two solutions Cluster analysis as unsupervised Learning
Cluster Analysis for Microarray Data
 Cluster Analysis for Microarray Data Seventh International Long Oligonucleotide Microarray Workshop Tucson, Arizona January 7-12, 2007 Dan Nettleton IOWA STATE UNIVERSITY 1 Clustering Group objects that
Unsupervised learning in Vision
 Chapter 7 Unsupervised learning in Vision The fields of Computer Vision and Machine Learning complement each other in a very natural way: the aim of the former is to extract useful information from visual
Workload Characterization Techniques
 Workload Characterization Techniques Raj Jain Washington University in Saint Louis Saint Louis, MO 63130 Jain@cse.wustl.edu These slides are available on-line at: http://www.cse.wustl.edu/~jain/cse567-08/
Exploratory data analysis for microarrays
 Exploratory data analysis for microarrays Jörg Rahnenführer Computational Biology and Applied Algorithmics Max Planck Institute for Informatics D-66123 Saarbrücken Germany NGFN - Courses in Practical DNA
Unsupervised Learning. Presenter: Anil Sharma, PhD Scholar, IIIT-Delhi
 Unsupervised Learning Presenter: Anil Sharma, PhD Scholar, IIIT-Delhi Content Motivation Introduction Applications Types of clustering Clustering criterion functions Distance functions Normalization Which
Information Retrieval and Web Search Engines
 Information Retrieval and Web Search Engines Lecture 7: Document Clustering May 25, 2011 Wolf-Tilo Balke and Joachim Selke Institut für Informationssysteme Technische Universität Braunschweig Homework
Week 7 Picturing Network. Vahe and Bethany
 Week 7 Picturing Network Vahe and Bethany Freeman (2005) - Graphic Techniques for Exploring Social Network Data The two main goals of analyzing social network data are identification of cohesive groups
Clustering and Dissimilarity Measures. Clustering. Dissimilarity Measures. Cluster Analysis. Perceptually-Inspired Measures
 Clustering and Dissimilarity Measures Clustering APR Course, Delft, The Netherlands Marco Loog May 19, 2008 1 What salient structures exist in the data? How many clusters? May 19, 2008 2 Cluster Analysis
Part I. Hierarchical clustering. Hierarchical Clustering. Hierarchical clustering. Produces a set of nested clusters organized as a
 Week 9 Based in part on slides from textbook, slides of Susan Holmes Part I December 2, 2012 Hierarchical Clustering 1 / 1 Produces a set of nested clusters organized as a Hierarchical hierarchical clustering
Lecture 6: Unsupervised Machine Learning Dagmar Gromann International Center For Computational Logic
 SEMANTIC COMPUTING Lecture 6: Unsupervised Machine Learning Dagmar Gromann International Center For Computational Logic TU Dresden, 23 November 2018 Overview Unsupervised Machine Learning overview Association
Unsupervised Learning : Clustering
 Unsupervised Learning : Clustering Things to be Addressed Traditional Learning Models. Cluster Analysis K-means Clustering Algorithm Drawbacks of traditional clustering algorithms. Clustering as a complex
9.1. K-means Clustering
 424 9. MIXTURE MODELS AND EM Section 9.2 Section 9.3 Section 9.4 view of mixture distributions in which the discrete latent variables can be interpreted as defining assignments of data points to specific
Clustering. Supervised vs. Unsupervised Learning
 Clustering Supervised vs. Unsupervised Learning So far we have assumed that the training samples used to design the classifier were labeled by their class membership (supervised learning) We assume now
1 Homophily and assortative mixing
 1 Homophily and assortative mixing Networks, and particularly social networks, often exhibit a property called homophily or assortative mixing, which simply means that the attributes of vertices correlate
CHAPTER 3. Preprocessing and Feature Extraction. Techniques
 CHAPTER 3 Preprocessing and Feature Extraction Techniques CHAPTER 3 Preprocessing and Feature Extraction Techniques 3.1 Need for Preprocessing and Feature Extraction schemes for Pattern Recognition and
INF4820 Algorithms for AI and NLP. Evaluating Classifiers Clustering
 INF4820 Algorithms for AI and NLP Evaluating Classifiers Clustering Erik Velldal & Stephan Oepen Language Technology Group (LTG) September 23, 2015 Agenda Last week Supervised vs unsupervised learning.
Clustering. CS294 Practical Machine Learning Junming Yin 10/09/06
 Clustering CS294 Practical Machine Learning Junming Yin 10/09/06 Outline Introduction Unsupervised learning What is clustering? Application Dissimilarity (similarity) of objects Clustering algorithm K-means,
Data Preprocessing. Why Data Preprocessing? MIT-652 Data Mining Applications. Chapter 3: Data Preprocessing. Multi-Dimensional Measure of Data Quality
 Why Data Preprocessing? Data in the real world is dirty incomplete: lacking attribute values, lacking certain attributes of interest, or containing only aggregate data e.g., occupation = noisy: containing
Based on Raymond J. Mooney s slides
 Instance Based Learning Based on Raymond J. Mooney s slides University of Texas at Austin 1 Example 2 Instance-Based Learning Unlike other learning algorithms, does not involve construction of an explicit
A Keypoint Descriptor Inspired by Retinal Computation
 A Keypoint Descriptor Inspired by Retinal Computation Bongsoo Suh, Sungjoon Choi, Han Lee Stanford University {bssuh,sungjoonchoi,hanlee}@stanford.edu Abstract. The main goal of our project is to implement
SELECTION OF A MULTIVARIATE CALIBRATION METHOD
 SELECTION OF A MULTIVARIATE CALIBRATION METHOD 0. Aim of this document Different types of multivariate calibration methods are available. The aim of this document is to help the user select the proper
Information Retrieval and Web Search Engines
 Information Retrieval and Web Search Engines Lecture 7: Document Clustering December 4th, 2014 Wolf-Tilo Balke and José Pinto Institut für Informationssysteme Technische Universität Braunschweig The Cluster
Facial Expression Detection Using Implemented (PCA) Algorithm
 Algorithm") Facial Expression Detection Using Implemented (PCA) Algorithm Dileep Gautam (M.Tech Cse) Iftm University Moradabad Up India Abstract: Facial expression plays very important role in the communication with
Facial Expression Detection Using Implemented (PCA) Algorithm Dileep Gautam (M.Tech Cse) Iftm University Moradabad Up India Abstract: Facial expression plays very important role in the communication with
CS7267 MACHINE LEARNING
 S7267 MAHINE LEARNING HIERARHIAL LUSTERING Ref: hengkai Li, Department of omputer Science and Engineering, University of Texas at Arlington (Slides courtesy of Vipin Kumar) Mingon Kang, Ph.D. omputer Science,
Machine Learning (BSMC-GA 4439) Wenke Liu
 Wenke Liu") Machine Learning (BSMC-GA 4439) Wenke Liu 01-25-2018 Outline Background Defining proximity Clustering methods Determining number of clusters Other approaches Cluster analysis as unsupervised Learning Unsupervised
Machine Learning (BSMC-GA 4439) Wenke Liu 01-25-2018 Outline Background Defining proximity Clustering methods Determining number of clusters Other approaches Cluster analysis as unsupervised Learning Unsupervised
Motivation. Technical Background
 Handling Outliers through Agglomerative Clustering with Full Model Maximum Likelihood Estimation, with Application to Flow Cytometry Mark Gordon, Justin Li, Kevin Matzen, Bryce Wiedenbeck Motivation Clustering