A comparison of AMoN measurements with localized, arrayed passive NH 3 samplers in Northern Utah Dr. Randal S. Martin
|
|
|
- Paul Freeman
- 5 years ago
- Views:
Transcription


 797-1585 Dr.")


1 A comparison of AMoN measurements with localized, arrayed passive NH 3 samplers in Northern Utah Dr. Randal S. Martin Dept. of Civil and Env. Eng. Utah Water Research Laboratory Utah State University Utah Climate Center 8200 Canyon Road Logan, UT randy.martin@usu.edu (435) Dr. Munkh Baasandorj Utah Division of Air Quality Utah Dept. of Env. Quality and, Dept.of Atmospheric Sciences University of Utah Salt Lake City, UT mbaasandorj@utah.gov (801)
2 Why the concern with gasphase ammonia in Northern Utah (and SE Idaho)
")
3 Utah (and SE Idaho) PM 2.5 Non-Attainment Areas
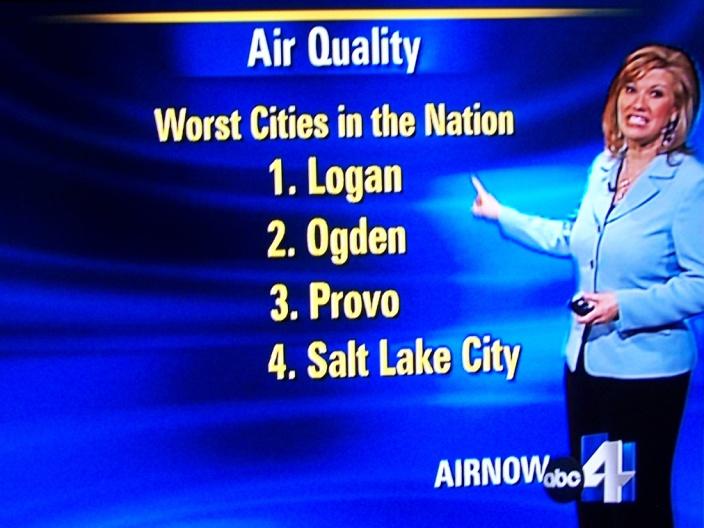
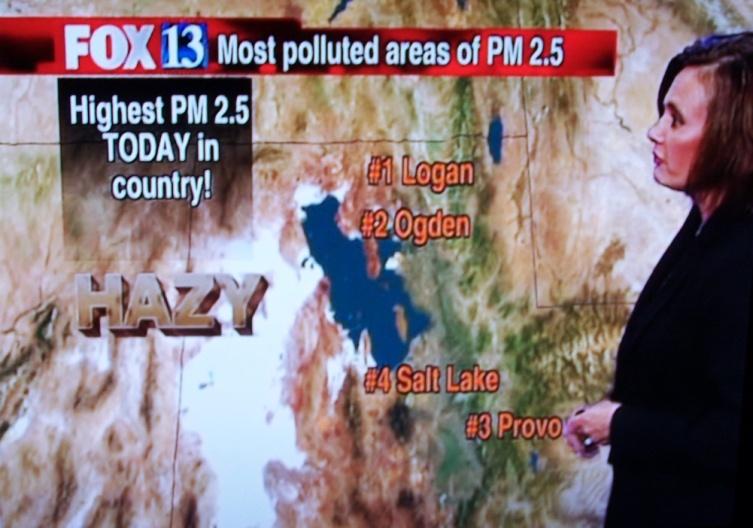
4 State of the Air American Lung Association Top Polluted U.S. Cities (24-hr PM 2.5 ) 2013 ( data) - April 2014 report - (1) Fresno-Madera, CA (2) Visalia-Porterville-Hanford, CA (3) Bakersfield, CA (4) LA-Long Beach, CA (5) Modesto-Merced, CA (6) Pittsburgh, PA-OH-WV (7) Fairbanks, AK (8) SLC-Orem-Provo, UT (9) El Paso, Las Cruces, TX-NM (10) San Jose-SF-Oakland, CA (11) Logan, UT-ID 2014 ( data) - April 2015 report - (1) Fresno-Madera, CA (2) Bakersfield-Delano, CA (3) Visalia-Porterville, CA (4) Modesto-Merced, CA (5) LA-Long Beach-Riverside, CA (6) San Jose-SF-Oakland, CA (7) SLC-Ogden-Clearfield, UT (8) Logan, UT-ID (9) Fairbanks, AK (10) Pittsburgh, PA-OH-WV 2015 ( data) - April 2016 report - (1) Bakersfield-Delano, CA (2) Fresno-Madera, CA (3) Visalia-Porterville, CA (4) Modesto-Merced, CA (5) Fairbanks, AK (6) SLC-Orem-Provo, UT (7) Logan, UT-ID (8) San Jose-SF-Oakland, CA (9) LA-Long Beach-Riverside, CA (10) Missoula, MT
 averages > 50% of")

5 Salt Lake and Cache Valley PM 2.5 Composition For both SLC and CV airsheds, ammonium nitrate (NH 4 NO 3 ) averages > 50% of wintertime PM 2.5 mass modeled & measured During elevated PM 2.5 episodes in CV, NH 4 NO 3 accounts for 80-95% PM 2.5 mass UDAQ SIP observed PM 2.5 speciation for SLC s Hawthorne site (Dec. 2014) UDAQ SIP modeled PM 2.5 speciation for Cache Valley (Dec. 2014)

6 Cache Valley SIP NH 3 Emissions Inventory Idaho DEQ, Cache Valley Idaho PM 2.5 Nonattainment Area SIP, Dec. 2012
")
7 Salt Lake Valley NH 3 Emissions Inventory US EPA 2011 National Emissions Inventory (EI) Data
8 So how much ammonia is available in the region s airsheds?
 Ammonium Ions")
9 NADP s Nation Trends Network (NTN) Ammonium Ions (1988)
10 NADP s Nation Trends Network (NTN) Ammonium Ions (1989)
 Ammonium Ion Wet")
11 NADP s Nation Trends Network (NTN) Ammonium Ion Wet Deposition
12 Utah Sites in NADP s Ammonia Monitoring Network (AMoN) Established under NADP in Oct Passive (Radiello), 2-wk duration gas-phase ammonia (NH 3 ) samplers 3 AMoN cites currently in Utah NADP NTN UT01 (Cache Valley ) est d AMoN Nov NADP AMoN UT97 (Salt Lake City) also est d Nov NADP AMoN UT09 (CNP Island in the Sky) est d May 2014 Class I area, collocated with a long-established IMPROVE site
13 NADP s Ammonia Monitoring Network (AMoN)

14 The Super Volcano (gaseous NH 3 ; AMoN 2012 data, µg/m 3 )
15
16 But are the seemingly high AMoN sites representative for the local airsheds?
17 Northern Utah Ambient NH 3 Dec March 2004 (CV) week-long denuder & filter samples at Logan city sampling site Nov. Mar. 2004/2005 (CV) hourly chemilumenescent measurements at Logan (urban) and Amalga (rural) Winter (Jan.-Mar.) and Summer (Jun.-Jul.) 2006 (CV) valley-wide network of 17 arrayed passive Ogawa NH 3 samplers three, 5-7 day sample periods during each season UT01 AMoN site initiated in Oct (CV) 2-week duration passive sampling Winter 2016 (CV & Wasatch Front [SLC]) valley-wide networks of arrayed passive Ogawa NH 3 samplers five, 7 day sample periods during each season
18 Northern Utah Ambient NH 3 Dec March 2004 (CV) week-long denuder & filter samples at Logan city sampling site annual [NH 3 ] avg = 5.7 µg/m 3 ; winter [NH 3 ] avg = 9.2 µg/m 3 determined airshed NH 3 rich by around 2x more than 90% of the time Nov. Mar. 2004/2005 (CV) hourly chemilumenescent measurements at Logan (urban) and Amalga (rural) Winter (Jan.-Mar.) and Summer (Jun.-Jul.) 2006 (CV) valley-wide network of 17 arrayed passive Ogawa NH 3 samplers three, 5-7 day sample periods during each season UT01 AMoN site initiated in Oct (CV) 2-week duration passive sampling Winter 2016 (CV & Wasatch Front [SLC]) valley-wide networks of arrayed passive Ogawa NH 3 samplers five, 7 day sample periods during each season
19 Northern Utah Ambient NH 3 Dec March 2004 (CV) week-long denuder & filter samples at Logan city sampling site annual [NH 3 ] avg = 5.7 µg/m 3 ; winter [NH 3 ] avg = 9.2 µg/m 3 determined airshed NH 3 rich by around 2x more than 90% of the time Nov. Mar. 2004/2005 (CV) hourly chemilumenescent measurements at Logan (urban) and Amalga (rural) urban [NH 3 ] avg = 13.2 µg/m 3 ; rural [NH 3 ] avg = 38.2 µg/m 3 wind direction had little affect on rural NH 3 concentrations Winter (Jan.-Mar.) and Summer (Jun.-Jul.) 2006 (CV) valley-wide network of 17 arrayed passive Ogawa NH 3 samplers three, 5-7 day sample periods during each season UT01 AMoN site initiated in Oct (CV) 2-week duration passive sampling Winter 2016 (CV & Wasatch Front [SLC]) valley-wide networks of arrayed passive Ogawa NH 3 samplers five, 7 day sample periods during each season
20 Northern Utah Ambient NH 3 Dec March 2004 (CV) week-long denuder & filter samples at Logan city sampling site annual [NH 3 ] avg = 5.7 µg/m 3 ; winter [NH 3 ] avg = 9.2 µg/m 3 determined airshed NH 3 rich by around 2x more than 90% of the time Nov. Mar. 2004/2005 (CV) hourly chemilumenescent measurements at Logan (urban) and Amalga (rural) urban [NH 3 ] avg = 13.2 µg/m 3 ; rural [NH 3 ] avg = 38.2 µg/m 3 wind direction had little affect on rural NH 3 concentrations Winter (Jan.-Mar.) and Summer (Jun.-Jul.) 2006 (CV) valley-wide network of 17 arrayed passive Ogawa NH 3 samplers three, 5-7 day sample periods during each season winter [NH 3 ] avg = 29.1 µg/m 3 ; summer [NH 3 ] avg = 24.7 µg/m 3 spatial trends mimicked known/suspected sources and strengths UT01 AMoN site initiated in Oct (CV) 2-week duration passive sampling Winter 2016 (CV & Wasatch Front [SLC]) valley-wide networks of arrayed passive Ogawa NH 3 samplers five, 7 day sample periods during each season

")
 NH3")
21 2006 Passive Ambient NH3 Winter (29.1 µg/m3) Summer (24.7 µg/m3) NH3 Source Density
22 Northern Utah Ambient NH 3 Dec March 2004 (CV) week-long denuder & filter samples at Logan city sampling site annual [NH 3 ] avg = 5.7 µg/m 3 ; winter [NH 3 ] avg = 9.2 µg/m 3 determined airshed NH 3 rich by around 2x more than 90% of the time Nov. Mar. 2004/2005 (CV) hourly chemilumenescent measurements at Logan (urban) and Amalga (rural) urban [NH 3 ] avg = 13.2 µg/m 3 ; rural [NH 3 ] avg = 38.2 µg/m 3 wind direction had little affect on rural NH 3 concentrations Winter (Jan.-Mar.) and Summer (Jun.-Jul.) 2006 (CV) valley-wide network of 17 arrayed passive Ogawa NH 3 samplers three, 5-7 day sample periods during each season winter [NH 3 ] avg = 29.1 µg/m 3 ; summer [NH 3 ] avg = 24.7 µg/m 3 spatial trends mimicked known/suspected sources and strengths UT01 AMoN site initiated in Oct (CV) 2-week duration passive sampling (CV) annual [NH 3 ] avg = 15.9 µg/m 3 ; Jan.-Feb 2016 [NH 3 ] avg = 23.3 µg/m 3 (SLC) annual [NH 3 ] avg = 4.2 µg/m 3 ; Jan.-Feb 2016 [NH 3 ] avg = 3.9 µg/m 3 Winter 2016 (CV & Wasatch Front [SLC]) valley-wide networks of arrayed passive Ogawa NH 3 samplers five, 7 day sample periods during each season
23 AMoN Annual Utah NH 3 ( ) UT01 Annual Average = 15.9 µg/m 3 UT01 Jan-Feb 2016 Avg 23.3 µg/m 3 UT97 Annual Average = 4.2 µg/m 3 UT97 Jan-Feb 2016 Avg 3.9 µg/m 3
24 Northern Utah Ambient NH 3 Dec March 2004 (CV) week-long denuder & filter samples at Logan city sampling site annual [NH 3 ] avg = 5.7 µg/m 3 ; winter [NH 3 ] avg = 9.2 µg/m 3 determined airshed NH 3 rich by around 2x more than 90% of the time Nov. Mar. 2004/2005 (CV) hourly chemilumenescent measurements at Logan (urban) and Amalga (rural) urban [NH 3 ] avg = 13.2 µg/m 3 ; rural [NH 3 ] avg = 38.2 µg/m 3 wind direction had little affect on rural NH 3 concentrations Winter (Jan.-Mar.) and Summer (Jun.-Jul.) 2006 (CV) valley-wide network of 17 arrayed passive Ogawa NH 3 samplers three, 5-7 day sample periods during each season winter [NH 3 ] avg = 29.1 µg/m 3 ; summer [NH 3 ] avg = 24.7 µg/m 3 spatial trends mimicked known/suspected sources and strengths UT01 AMoN site initiated in Oct (CV) 2-week duration passive sampling (CV) annual [NH 3 ] avg = 15.9 µg/m 3 ; Jan.-Feb 2016 [NH 3 ] avg = 23.3 µg/m 3 (SLC) annual [NH 3 ] avg = 4.2 µg/m 3 ; Jan.-Feb 2016 [NH 3 ] avg = 3.9 µg/m 3 Winter 2016 (CV & Wasatch Front [SLC]) valley-wide networks (10 each) of arrayed passive Ogawa NH 3 samplers five, 7 day sample periods during each season


25 Jan/Feb 2016 Passive Ambient NH 3 USU Animal Science Farm (UT01) Salt Lake City (U of U campus)


26 Jan/Feb 2016 Passive Ambient NH 3 Cache Valley 2016 NH 3 Network (roughly 55 km x 20 km) Wasatch Front 2016 NH 3 Network (roughly 90 km x 25 km)
27 Jan/Feb 2016 Passive Ambient NH 3 Wasatch Front 2016 NH 3 : 14.2 µg/m 3

28 2016 Passive Ambient NH 3 Avg 2016 NH 3 : µg/m winter NH 3 : 29.1 µg/m 3 UT01: 23.3 µg/m 3 UT97: 3.9 µg/m 3 Wasatch Front 2016 NH 3 : 14.2 µg/m 3
29 Northern Utah Ambient NH 3 Dec March 2004 (CV) week-long denuder & filter samples at Logan city sampling site annual [NH 3 ] avg = 5.7 µg/m 3 ; winter [NH 3 ] avg = 9.2 µg/m 3 determined airshed NH 3 rich by around 2x more than 90% of the time Nov. Mar. 2004/2005 (CV) hourly chemilumenescent measurements at Logan (urban) and Amalga (rural) urban [NH 3 ] avg = 13.2 µg/m 3 ; rural [NH 3 ] avg = 38.2 µg/m 3 wind direction had little affect on rural NH 3 concentrations Winter (Jan.-Mar.) and Summer (Jun.-Jul.) 2006 (CV) valley-wide network of 17 arrayed passive Ogawa NH 3 samplers three, 5-7 day sample periods during each season winter [NH 3 ] avg = 29.1 µg/m 3 ; summer [NH 3 ] avg = 24.7 µg/m 3 spatial trends mimicked known/suspected sources and strengths UT01 AMoN site initiated in Oct (CV) 2-week duration passive sampling (CV) annual [NH 3 ] avg = 15.9 µg/m 3 ; Jan.-Feb 2016 [NH 3 ] avg = 23.3 µg/m 3 (SLC) annual [NH 3 ] avg = 4.2 µg/m 3 ; Jan.-Feb 2016 [NH 3 ] avg = 3.9 µg/m 3 Winter 2016 (CV & Wasatch Front [SLC]) valley-wide networks of arrayed passive Ogawa NH 3 samplers five, 7 day sample periods during each season CV [NH 3 ] avg = µg/m 3 ; Animal Science Farm [NH 3 ] avg = µg/m 3 SLC [NH 3 ] avg = 14.2 µg/m 3 ; AMC 2016 [NH 3 ] avg = 16.2 µg/m 3
 among next tier of highest concentration areas NADP s AMoN location s(ut01 and UT97) seem representative for the Cache")
30 Summary Cache Valley (UT01) Ammonia Super Volcano is not a myth! 3-4x higher at UT01 than other continental AMoN sites the Cache Valley NH 3 Super Volcano is real! local hotspots exist, but abundant gas-phase NH 3 is ubiquitous SLC (UT97) among next tier of highest concentration areas NADP s AMoN location s(ut01 and UT97) seem representative for the Cache Valley and Wasatch Front separate 2016 network study showed approx 4x times higher at each location even though UT01 within a few hundred yards of livestock (NADP footnote B ) Relatively consistent ambient measurements across several different measurement campaigns/protocols
31 Acknowledgements Utah Division of Air Quality (UDAQ) and the Utah Air Monitoring Center (UAMC) Utah State University (USU) and the Utah Water Research Laboratory (UWRL) Utah Climate Center (UCC) Bear River Health Department (BRHD) Idaho Division of Environmental Quality (IDEQ) National Atmospheric Deposition Program (NADP) and the Ammonia Monitoring Network (AMoN) And way too many colleagues, students, and friends to mention

 CV Highest 24-hr PM 2.5 : 137.5 µg/m 3 (Feb.")
 A really, really bad day (PM 2.")
32 PM 2.5 in Northern Utah A not-so-good very A bad day day (PM 2.5 (PM= 9 µg/m = 45 µg/m ; Nov = 82 µg/m 3 ; Jan. ; 29, Dec. 7, 2010) 2011) 2, 2010) Dry Canyon ridge (approx ft asl) CV Highest 24-hr PM 2.5 : µg/m 3 (Feb. 7, 2002) Highest 98 th percentile 24-hr PM 2.5 : µg/m 3 (Jan. 6, 2004) A really, really bad day (PM 2.5 = 102 µg/m 3 ; Feb. 16, 2004)

33 04-05 Amalga (rural) NH 3 compared to Wind Direction

34 Modeled Ambient NH 3 Box Model: Overall NH 3 average = 4.5 µg/m 3 summer: 7.5 µg/m 3 winter: 1.7 µg/m 3 ISCST3 Model: Overall NH 3 average = 19.6 µg/m 3 summer: 12.0 µg/m 3 winter: 27.2 µg/m 3


35 Passive Indoor NH 3 24 hr sample 2 adults 2 children 2 dogs >50 cats 75 hr sample 2 adults 4 children 75 hr sample 2 adults 3 children 1 dog 2 cats December 2005

36 UT01 NH3 and Cache Valley PM2.5
Undergraduate Admission File
 Undergraduate Admission File June 13, 2007 Information Resources and Communications Office of the President University of California Overview Population The Undergraduate Admission File contains data on
SANS Vendor Events. SANS offers a variety of events which bring you in touch with the highly qualified SANS community.
 SANS Vendor Events SANS offers a variety of events which bring you in touch with the highly qualified SANS community. SANS National Events over 1200 profession IT Security attendees and over 45 SANS classes
Is Las Vegas the Next Silicon Valley? A First Look at Brookings Top 100 Metro Data on Advanced Industries
 Is Las Vegas the Next Silicon Valley? A First Look at Brookings Top 100 Metro Data on Advanced Industries ROBERT LANG, PH.D. PROFESSOR AND DIRECTOR THE LINCY INSTITUTE BROOKINGS MOUNTAIN WEST UNIVERSITY
Supporting Material for
 Supporting Material for Seasonal Changes in Gaseous Elemental Mercury in Relation to Monsoon Cycling over the Northern South China Sea C.M. Tseng *, C.S. Liu, and C. Lamborg Institute of Oceanography,
NCC Cable System Order
 Syscode 0081 Agency Beacon Media System Name Spectrum/Park Cities, TX Advertiser Ed Meier for Congress $2,421.00 Commission $363.15 Net $2,057.85 198 1 AEN VARIOUS 2/26/18 3/4/18 19:00 24:00 X X X X X
NMOSE GPCD CALCULATOR
 NMOSE CALCULATOR It should be noted that all the recorded data should be from actual metered results and should not include any estimates. Gallons per Capita - v2.4 Beta Release Date: Mar, 16, 29 This
Troop calendar
 Troop 546 2013-2014 calendar For questions and information please visit www.troop546peoriaaz.com or email troop546info@googlegroups.com August Court of honor Tue Aug 27, 2013 6pm - 7:30pm Award scouts
STAT:5400 Computing in Statistics. Data Preparation Using SAS
 1 2 STAT:5400 Computing in Statistics Data Preparation Using SAS Lecture 19 Oct 19, 2016 Kate Cowles 374 SH, 335-0727 katecowles@uiowaedu Example: Acid rain deposition in Colorado The National Atmospheric
For personal use only. Update Event & nearmap Solar
 Update Event & nearmap Solar Update Event and nearmap Solar Paul Peterson Senior VP Product & Engineering 2 Current Clear Change Current What s on the ground now Clear Unrivalled clarity Change Monitor
An Introduction to DEUTZ Training. Enrollment
 An Introduction to DEUTZ Training With over 150 years of engine experience to draw from, DEUTZ offers effective training to meet your needs. Whether you are an end user, equipment manufacturer, or service
UC DAVIS THERMAL ENERGY STORAGE (TES) TANK OPTIMIZATION INVESTIGATION MATTHEW KALLERUD, DANNY NIP, MIANFENG ZHANG TTP289A JUNE 2012
 TANK OPTIMIZATION INVESTIGATION MATTHEW KALLERUD, DANNY NIP, MIANFENG ZHANG TTP289A JUNE 2012") UC DAVIS THERMAL ENERGY STORAGE (TES) TANK OPTIMIZATION INVESTIGATION MATTHEW KALLERUD, DANNY NIP, MIANFENG ZHANG TTP289A 004 11 JUNE 2012 TABLE OF CONTENTS Abstract...3 Introduction...3 Methodology...4
UC DAVIS THERMAL ENERGY STORAGE (TES) TANK OPTIMIZATION INVESTIGATION MATTHEW KALLERUD, DANNY NIP, MIANFENG ZHANG TTP289A 004 11 JUNE 2012 TABLE OF CONTENTS Abstract...3 Introduction...3 Methodology...4
Interested in learning more? Global Information Assurance Certification Paper. Copyright SANS Institute Author Retains Full Rights
 Global Information Assurance Certification Paper Copyright SANS Institute Author Retains Full Rights This paper is taken from the GIAC directory of certified professionals. Reposting is not permited without
Aswani K. Volety, Michael Savarese, Greg Tolley, Lesli Haynes, Amanda Booth; Coastal Watershed Institute,
 Aswani K. Volety, Michael Savarese, Greg Tolley, Lesli Haynes, Amanda Booth; Coastal Watershed Institute, Florida Gulf Coast University William Arnold; Florida Wildlife Research Institute Patricia Goodman,
All King County Summary Report
 September, 2016 MTD MARKET UPDATE Data Current Through: September, 2016 18,000 16,000 14,000 12,000 10,000 8,000 6,000 4,000 2,000 0 Active, Pending, & Months Supply of Inventory 15,438 14,537 6.6 6.7
Interested in learning more? Global Information Assurance Certification Paper. Copyright SANS Institute Author Retains Full Rights
 Global Information Assurance Certification Paper Copyright SANS Institute Author Retains Full Rights This paper is taken from the GIAC directory of certified professionals. Reposting is not permited without
Seattle (NWMLS Areas: 140, 380, 385, 390, 700, 701, 705, 710) Summary
 Summary") October, 2016 MTD MARKET UPDATE Data Current Through: October, 2016 (NWMLS Areas: 140, 380, 385, 390,, 701, 705, 710) Summary Active, Pending, & Months Supply of Inventory 4,500 4,000 3,500 4,197 4,128
October, 2016 MTD MARKET UPDATE Data Current Through: October, 2016 (NWMLS Areas: 140, 380, 385, 390,, 701, 705, 710) Summary Active, Pending, & Months Supply of Inventory 4,500 4,000 3,500 4,197 4,128
Seattle (NWMLS Areas: 140, 380, 385, 390, 700, 701, 705, 710) Summary
 Summary") September, 2016 MTD MARKET UPDATE Data Current Through: September, 2016 (NWMLS Areas: 140, 380, 385, 390,, 701, 705, 710) Summary Active, Pending, & Months Supply of Inventory 5,000 4,500 4,000 3,500 4,091
September, 2016 MTD MARKET UPDATE Data Current Through: September, 2016 (NWMLS Areas: 140, 380, 385, 390,, 701, 705, 710) Summary Active, Pending, & Months Supply of Inventory 5,000 4,500 4,000 3,500 4,091
City Of London Environmental & Engineering Services Department Wastewater Treatment Operations
 City Of London Environmental & Engineering Services Department Wastewater Treatment Operations Greenway Pollution Control Centre 2014 Annual Report February 2015 Page 1 of 87 Summary This annual report
The City of Seattle s Mandatory Benchmarking and Disclosure Program
 The City of Seattle s Mandatory Benchmarking and Disclosure Program IFMA Seattle Annual Education Symposium March 10, 2011 City of Seattle Department of Planning and Development Agenda Background Overview
Seattle (NWMLS Areas: 140, 380, 385, 390, 700, 701, 705, 710) Summary
 Summary") November, 2016 MTD MARKET UPDATE Data Current Through: November, 2016 (NWMLS Areas: 140, 380, 385, 390,, 701, 705, 710) Summary 4,000 3,500 3,000 2,500 2,000 1,500 1,000 500 0 Active, Pending, & Months
November, 2016 MTD MARKET UPDATE Data Current Through: November, 2016 (NWMLS Areas: 140, 380, 385, 390,, 701, 705, 710) Summary 4,000 3,500 3,000 2,500 2,000 1,500 1,000 500 0 Active, Pending, & Months
6.0 WILDLIFE ACCIDENTS BY REGION
 6. WILDLIFE ACCIDENTS BY REGION 6.1 Regional Comparisons Regional Overviews The British Columbia Ministry of Transportation divides its operational administration into three Regions, South Coast, Southern
Airside Congestion. Airside Congestion
 Airside Congestion Amedeo R. Odoni T. Wilson Professor Aeronautics and Astronautics Civil and Environmental Engineering Massachusetts Institute of Technology Objectives Airside Congestion _ Introduce fundamental
Project Briefing. Community Consultative Committee
 Project Briefing Community Consultative Committee 8 th Nov 2018 Contents Modification Application Update General Project Update Community Update 2 Modification Application Proponent prepares Environmental
Temperature Patterns: Functions and Line Graphs
 activity 3.1 Temperature Patterns: Functions and Line Graphs In this activity, you will work with examples in which curves obtained by joining known points of the graph of a function can help you understand
Silicosis Prevalence Among Medicare Beneficiaries,
 Silicosis Prevalence Among Medicare Beneficiaries, 1999 2014 Megan Casey, RN, BSN, MPH Nurse Epidemiologist Expanding Research Partnerships: State of the Science June 21, 2017 National Institute for Occupational
Free or Reduced Air from Select Gateways for 1st & 2nd guest on reservation
 UPDATED AS OF OCTOBER 9, 2018 Free or Reduced Air from Select Gateways for 1st & 2nd guest on reservation Booking Window: 10/3/18-10/31/18 11:59pm EST Offer Valid on Select Sailings & Categories See Terms
Interested in learning more? Global Information Assurance Certification Paper. Copyright SANS Institute Author Retains Full Rights
 Global Information Assurance Certification Paper Copyright SANS Institute Author Retains Full Rights This paper is taken from the GIAC directory of certified professionals. Reposting is not permited without
Contents:
 Contents: Conventional/REO/Short Sale Single Family Sold Sold Properties by Cities - Properties Sold Supply Inventory Median Price Comparison by Year www.swflrealtors.com Page #. Single Family & Condo
B.2 Measures of Central Tendency and Dispersion
 Appendix B. Measures of Central Tendency and Dispersion B B. Measures of Central Tendency and Dispersion What you should learn Find and interpret the mean, median, and mode of a set of data. Determine
Supplement of Modeling reactive ammonia uptake by secondary organic aerosol in CMAQ: application to the continental US
 Supplement of Atmos. Chem. Phys., 18, 3641 3657, 2018 https://doi.org/10.5194/acp-18-3641-2018-supplement Author(s) 2018. This work is distributed under the Creative Commons Attribution 4.0 License. Supplement
Streamlining Utility Billing Analysis and Reporting. Dagoberto Rodriguez, Energy Manager Marlene Z Rosenboom, Utility Analyst
 Streamlining Utility Billing Analysis and Reporting Dagoberto Rodriguez, Energy Manager Marlene Z Rosenboom, Utility Analyst Who We Are Founded by the Texas Legislature in 1969 The University of Texas
Telecommunications and Internet Access By Schools & School Districts
 Universal Service Funding for Schools and Libraries FY2014 E-rate Funding Requests Telecommunications and Internet Access By Schools & School Districts Submitted to the Federal Communications Commission,
Energy Engineering: Tools and Trends
 Energy Engineering: Tools and Trends AEE Northeast Ohio Chapter Meeting March 27, 2008 1 Introduction Background and Experience Energy Engineer for Trane 20 years in HVAC Industry Equipment design and
where we are, where we could be, how we can get there. 12/14/2011
 Central Plant Optimization ASHRAE National Capitol Chapter - PES Wednesday, Nov 7, 2011 Dave Klee, LEED AP Director, Optimized Building Solutions Johnson Controls, Inc. 1 1 J o http://www.johnsoncontrols.com/cpo
Indirect Outside Air-cooling Unit
 Indirect Air-cooling Unit G1--21b is an air-cooling system that cools in introduce outside air directly into indoor areas. By taking advantage of outside air energy all throughout the year, F-COOL O operations
San Joaquin County Emergency Medical Services Agency
 San Joaquin County Emergency Medical Services Agency http://www.sjgov.org/ems Memorandum TO: All Interested Parties FROM: Rick Jones, EMS Analyst DATE: January, 19 Mailing Address PO Box French Camp, CA
Appendices Charts & Tables
 Financial Crisis Inquiry Commission Hearing September 8, 2010 Las Vegas, NV Appendices Charts & Tables Financial Crisis Inquiry Commission 1 Selected National Comparisons Financial Crisis Inquiry Commission
Tina Ladabouche. GenCyber Program Manager
 Tina Ladabouche GenCyber Program Manager GenCyber Help all students understand correct and safe on-line behavior Increase interest in cybersecurity and diversity in cybersecurity workforce of the Nation
1.2 Characteristics of Function Graphs
 1.2 Characteristics of Function Graphs Essential Question: What are some of the attributes of a function, and how are they related to the function s graph? Resource Locker Explore Identifying Attributes
GoNevadaCounty.com JUNE 2013 & FINAL REPORT
 GoNevadaCounty.com JUNE 2013 & FINAL REPORT HIGHLIGHTS: Visits to GNC.com continue to increase (up 105 percent from last November) because of posting fresh content that exceeds the stated goals (blog posts,
Gaussian Plume Air Dispersion Model - AERMOD. Release Notes. Versions 8.5, 8.6, 8.7, 8.8, and 8.8.9
 Gaussian Plume Air Dispersion Model - AERMOD Versions 8.5, 8.6, 8.7, 8.8, and 8.8.9 Tel: (519) 746-5995 - Fax: (519) 746-0793 Web Site: www.weblakes.com 1996-2014 AERMOD Version 8.8.9 November 20, 2014
I I. I I Wed 28-Jan-I WW1 - External Data I. EPF 29.5 Water Results. Consent of copyright owner required for any other use.
 ~ EPF 29.5 Water Results 2. WW1 - External Data Frequency Parameter Week Day Date 2Mon 05-Jan-5. 1 06-Jan-5 [Wed ] 07-Jan-5 [Thu 1 08-Jan-5 Fri 09-Jan-5 O-Jan- 5 1 -Jan- 5 3 Mon 12-Jan- 5 ]Tue 13-Jan-5
Andrew Lee BEng (Hons) CEng MIStructE FGS FPWS
 CEng MIStructE FGS FPWS") Jim Twaddle BSc (Hons) FGS Andrew Lee BEng (Hons) CEng MIStructE FGS FPWS 11 June 2010 ME50252/RE001 !! " # $ $ % # & " '(! ) # $ $ % * $ ( & " # $ $ % $ # $ $ % +, $ # $ $ % #! " $ # $ $ % -! $ # $ $
Jim Twaddle BSc (Hons) FGS Andrew Lee BEng (Hons) CEng MIStructE FGS FPWS 11 June 2010 ME50252/RE001 !! " # $ $ % # & " '(! ) # $ $ % * $ ( & " # $ $ % $ # $ $ % +, $ # $ $ % #! " $ # $ $ % -! $ # $ $
Transmission Planning Attachment K Public Input Meeting
 Transmission Planning Attachment K Public Input Meeting FERC Order 1000, 2018-19 Biennial Planning Cycle Quarter 2 Meeting June 14, 2018 PAGE 2 Agenda Pacific Time Topic Presenter 9:00 9:05 Greetings and
CALINE4, CAL3QHC, CAL3QHCR
 CALRoads View CALRoads View is an Air Dispersion Modeling Package for predicting air quality impacts of pollutants near roadways. CALRoads View features three mobile source dispersion models: CALINE4,
RLMYPRINT.COM 30-DAY FREE NO-OBLIGATION TRIAL OF RANDOM LENGTHS MY PRINT.
 My Print ON-DEMAND GRAPHS AND PRICE REPORTS TRY IT FREE FOR 30 DAYS! RLMYPRINT.COM 30-DAY FREE NO-OBLIGATION TRIAL OF RANDOM LENGTHS MY PRINT. Register and immediately begin using the new Web site to create
HYSPLIT model description and operational set up for benchmark case study
 HYSPLIT model description and operational set up for benchmark case study Barbara Stunder and Roland Draxler NOAA Air Resources Laboratory Silver Spring, MD, USA Workshop on Ash Dispersal Forecast and
Adobe Creative Cloud Mike Riley and Jim Babbage, Adobe Adobe Systems Incorporated. All Rights Reserved.
 Adobe Creative Cloud Mike Riley and Jim Babbage, Adobe Changing the world through digital experiences April 3, 2010? April 3, 2010 New platforms mean new challenges Introducing the Creative Cloud Everything
Brackets & Pairings /10/2018
 Brackets & Pairings 2017-2019 1/10/2018 Volleyball Football Track & Field North #1 vs. South #4 South #1 vs. North #4 Ind. Events Relays Region 19 #1 vs. 21#4 or 20#6 Region 21 #1 vs. Region 20 #4 South
This report is based on sampled data. Jun 1 Jul 6 Aug 10 Sep 14 Oct 19 Nov 23 Dec 28 Feb 1 Mar 8 Apr 12 May 17 Ju
 0 - Total Traffic Content View Query This report is based on sampled data. Jun 1, 2009 - Jun 25, 2010 Comparing to: Site 300 Unique Pageviews 300 150 150 0 0 Jun 1 Jul 6 Aug 10 Sep 14 Oct 19 Nov 23 Dec
Hematology Program (BC90A/BC90B/BC90C/BC90D/CS90A/CS90B/CS90C/CS90D) Cycle 11: March 2016 February Sample No: 1 Sample Date: 14 Apr 16
 Cycle 11: March 2016 February Sample No: 1 Sample Date: 14 Apr 16") Exceptions (BC90A/BC90B/BC90C/BC90D/CS90A/CS90B/CS90C/CS90D) : March 206 February 207 None at this time. Legend: No Warnings Missing Result Late Results < < > * Amended Result (per participant s request)
Exceptions (BC90A/BC90B/BC90C/BC90D/CS90A/CS90B/CS90C/CS90D) : March 206 February 207 None at this time. Legend: No Warnings Missing Result Late Results < < > * Amended Result (per participant s request)
Single Family Months of Inventory. Condo Months of Inventory. May calgary regional housing market statistics
 May 211 calgary regional housing market statistics INNER CITY HOUSING MARKET LEADS IN SALES Buyers find value in inner city communities Total Single Family Months of Inventory Calgary, June 1, 211 According
IT Specialist, Associate of Applied Science Outcomes Assessment Implementation Summary. Academic Year
 UNIVERSITY OF ALASKA FAIRBANKS Outcomes Assessment Implementation Summary Information Technology Specialist, A.A.S. College of Rural and Community Development IT Specialist, Associate of Applied Science
Energy Step Code Implementation Strategy. March 26, 2018
 Energy Step Code Implementation Strategy March 26, 2018 About the BC Energy Step Code Climate Leadership Plan call for: Net zero energy ready buildings by 2032; Development of the Energy Step Code to get
User Guide for the WegenerNet Data Portal
 User Guide for the WegenerNet Data Portal (v9/18feb2010) The WegenerNet Data Portal provides access to measurement data from the climate stations as well as detailed information about the project. Quality-checked
Library. Summary Report
 Library Summary Report 217-218 Prepared by: Library Staff December 218 Table of Contents Introduction..1 New Books.2 Print Circulation.3 Interlibrary Loan 4 Information Literacy 5 Reference Statistics.6
Caton Town Constable's
 Monthly Report for: Jan 2013 1/10/2013 9am-2pm 5 Vehicle maintenance Total Hr's 5 1/3/2013 1:30pm-5:30 4 Office - patrol 1 1 1/7/2013 4:30pm- 11:30 7 Court - traffic control ( Caton Center 1 1 1/7/2013
Multiple Listing Service of Southern Arizona Monthly Statistics November 2017
 For Immediate Release: December 6, 7 CONTACT: Henry Zipf MLSSAZ President (5) 4-567 Sean Murphy Executive Vice President (5) 8-879 Randy Rogers CEO, MLSSAZ (5) 7-48 Multiple Listing Service of Southern
Study of Water Quality of Utah Lake Tributaries and the Jordan River Outlet for the Calibration of the Utah Lake Water Salinity Model (LKSIM)
") Brigham Young University BYU ScholarsArchive All Theses and Dissertations 2012-03-13 Study of Water Quality of Utah Lake Tributaries and the Jordan River Outlet for the Calibration of the Utah Lake Water
Brigham Young University BYU ScholarsArchive All Theses and Dissertations 2012-03-13 Study of Water Quality of Utah Lake Tributaries and the Jordan River Outlet for the Calibration of the Utah Lake Water
What Did You Learn? Key Terms. Key Concepts. 68 Chapter P Prerequisites
 7_0P0R.qp /7/06 9:9 AM Page 68 68 Chapter P Prerequisites What Did You Learn? Key Terms real numbers, p. rational and irrational numbers, p. absolute value, p. variables, p. 6 algebraic epressions, p.
CS Programming I: Arrays
 CS 200 - Programming I: Arrays Marc Renault Department of Computer Sciences University of Wisconsin Madison Fall 2017 TopHat Sec 3 (PM) Join Code: 719946 TopHat Sec 4 (AM) Join Code: 891624 Array Basics
NCC Cable System Order
 Order # 62467657 Flight s 1/23/17-11/5/17 Syscode 858 Agency Buying System Name Spectrum/RSN Full Footprint Feed Advertiser Tom Steyer PAC Sales Coordinator Molly Casca Est Code Phone (31) 951-262 Credit
Welcome. Liberty Utilities Reliability Reporting Workshop. March 15, 2017
 Welcome Liberty Utilities Reliability Reporting Workshop March 15, 2017 1 Agenda Winter storms of 2017 System Overview Reliability Performance Plans for Reliability Improvements Questions 2 Winter Storms
Calendar PPF Production Cycles Non-Production Activities and Events
 20-207 Calendar PPF Production Cycles Non-Production Activities and Events Four Productions For non-holiday productions 7 Week Stage Cycles 36 Uses plus strike (as in prior years and per agreement with
AQS (Air Quality System) General Overview
 General Overview") AQS (Air Quality System) General Overview CARB PQAO Training January 25, 2017 Jennifer Williams EPA Region 9 1 AQS (Air Quality System) Overview What is AQS? Database that contains: Ambient air pollution
AQS (Air Quality System) General Overview CARB PQAO Training January 25, 2017 Jennifer Williams EPA Region 9 1 AQS (Air Quality System) Overview What is AQS? Database that contains: Ambient air pollution
EMFAC2011-SG RTP Conformity Analysis and SB-375 Analysis Instructions. for the San Joaquin Valley MPOs. October, 2013
 EMFAC2011-SG 2014 RTP Conformity Analysis and SB-375 Analysis Instructions for the San Joaquin Valley MPOs October, 2013 Prepared by Cari Anderson, Cari Anderson Consulting and Alexandra Marcucci, Sierra
NORTH CENTRAL REGION HUMAN RESOURCES DEVELOPMENT DIVISION (HRDD) Training Schedule FY Updated: 17 September 2008
 Training Schedule FY Updated: 17 September 2008") NORTH CENTRAL REGION HUMAN RESOURCES DEVELOPMENT DIVISION (HRDD) Training Schedule FY - 2009 Updated: 17 September 2008 Date Class Title CHRTAS Registration Information Class Location Course Manager 6-10
NORTH CENTRAL REGION HUMAN RESOURCES DEVELOPMENT DIVISION (HRDD) Training Schedule FY - 2009 Updated: 17 September 2008 Date Class Title CHRTAS Registration Information Class Location Course Manager 6-10
Shanti Pless, LEED AP NREL, Commercial Buildings Research Group. Tom Hootman, AIA, LEED AP BD+C RNL, Director of Sustainability
 Shanti Pless, LEED AP NREL, Commercial Buildings Research Group Tom Hootman, AIA, LEED AP BD+C RNL, Director of Sustainability WHO IS PURSUING NET ZERO ENERGY? 1 1 1 2 1 6 1 1 1 1 1 1 1 2 New Buildings
Welcome! Visioning Workshop. 24 March 2015
 Welcome! Visioning Workshop 24 March 2015 5:30p.m. Open House and Check-in 6:00 p.m. Opening Remarks 6:10 p.m. Overview Presentation 6:25 p.m. Discussion 7:00 p.m. Report back 7:10 p.m. Wrap-up Overview
TABULATION OF BIDS RECEIVED - APRIL 1, :00 PM (LOCAL TIME)
") SUBSTANTIAL COMPLETION DATE: FINAL COMPLETION DATE: AUGUST 14, 2016 (90 DAYS) AUGUST 28, 2016 Bidder No. 1 L.C. United Painting Co., Inc. Amount of Bond: 100% 3525 Barbara Drive Surety: Westfield Insurance
SUBSTANTIAL COMPLETION DATE: FINAL COMPLETION DATE: AUGUST 14, 2016 (90 DAYS) AUGUST 28, 2016 Bidder No. 1 L.C. United Painting Co., Inc. Amount of Bond: 100% 3525 Barbara Drive Surety: Westfield Insurance
Screen3 View. Contents. Page 1
 Screen3 View Contents Introduction What is EPA's SCREEN3 Model? What is the Screen3 View Interface? Toollbar Buttons Preliminary Considerations Source Inputs Screen3 Options Running SCREEN3 Model Graphic
Brackets & Pairings /18/2018
 Brackets & Pairings 2017-2019 Volleyball Football Track & Field North #1 vs. South #4 South #1 vs. North #4 Ind. Events Relays Region 19 #1 vs. 21#4 or 20#6 Region 21 #1 vs. Region 20 #4 South #2 vs. North
South Platte Summary January Compiled by Lee Cunning, P.E.
 South Platte Summary January 218 Compiled by Lee Cunning, P.E. COLORADO DIVISION OF WATER RESOURCES, DIVISION 1 MONTH OF January 218 RESERVOIR FULL ALLOWABLE CAPACITY FIRST OF MONTH (ACRE (ACRE FEET) FEET)
DEPARTMENT OF HOUSING AND URBAN DEVELOPMENT. [Docket No. FR-6090-N-01]
![DEPARTMENT OF HOUSING AND URBAN DEVELOPMENT. [Docket No. FR-6090-N-01]](/thumbs/83/87513687.jpg "DEPARTMENT OF HOUSING AND URBAN DEVELOPMENT. [Docket No. FR-6090-N-01]") Billing Code 4210-67 This document is scheduled to be published in the Federal Register on 04/05/2018 and available online at https://federalregister.gov/d/2018-06984, and on FDsys.gov DEPARTMENT OF HOUSING
Billing Code 4210-67 This document is scheduled to be published in the Federal Register on 04/05/2018 and available online at https://federalregister.gov/d/2018-06984, and on FDsys.gov DEPARTMENT OF HOUSING
Calibration of HY-2A Satellite Scatterometer with Ocean and Considerations of Calibration of CFOSAT Scatterometer
 Calibration of HY-2A Satellite Scatterometer with Ocean and Considerations of Calibration of CFOSAT Scatterometer Xiaolong Dong, Jintai Zhu, Risheng Yun and Di Zhu CAS Key Laboratory of Microwave Remote
City of Portsmouth Department of Public Works
 City of Portsmouth Department of Public Works October 3, 2017 PEASE TRADEPORT WATER SUPPLY UPDATE The activated carbon demonstration filters for the Harrison and Smith wells have been on line for over
Energy Benchmarking Commercial Buildings. Cities that support or require energy benchmarking of commercial buildings
 Energy Benchmarking Commercial Buildings Cities that support or require energy benchmarking of commercial buildings Large Cities (250,000+ people) Madison WI 250,000 We are working on a voluntary program.
IU Alumni Association Membership Statistics
 IU Alumni Association Membership Statistics Paid Members Membership Type Jun-2017 Mar-2018 Annual 11,213 9,517 Auto-Renewal 733 1,466 Life 44,597 45,145 Total 56,543 56,128 70,000 65,000 60,000 55,000
CIMA Asia. Interactive Timetable Live Online
 CIMA Asia Interactive Timetable 2017 2018 Live Online Version 1 Information last updated 09 October 2017 Please note: Information and dates in this timetable are subject to change. CIMA Cert BA Course
SANS Vendor Offerings Detail
 SANS Vendor Offerings Detail» About SANS» Conference Events» Media Products SANS Vendor Programs Conference Events Booths and Tabletops events Speaking Opportunities Sponsorship Programs Media Products
2018 NSP Student Leader Contact Form
 2018 NSP Student Leader Contact Form Welcome to the Office of New Student Programs! We are extremely excited to have you on our team. Please complete the below form to confirm your acceptance. Student
Regional Group Nordic GRID DISTURBANCE AND FAULT STATISTICS
 Regional Group Nordic GRID DISTURBANCE AND FAULT STATISTICS Table contents Table contents Page 1 INTRODUCTION... 4 1.1 Contact persons... 5 1.2 Guidelines the statistics... 5 1.3 Voltage levels in the
Freedom of Information Act 2000 reference number RFI
 P. Norris By email to: xxxxxxxxxxxxxxxxxxxxxx@xxxxxxxxxxxxxx.xxm 02 November 2011 Dear P. Norris Freedom of Information Act 2000 reference number RFI20111218 Thank you for your request under the Freedom
Continuous Monitoring Of Lakes Bloomington and Evergreen Using Buoys
 Lakes After Hours: Continuous Monitoring Of Lakes Bloomington and Evergreen Using Buoys JILL MAYES, TONY ALWOOD AND RICK TWAIT, CITY OF BLOOMINGTON WATER TREATMENT PLANT Why Perform Continuous Monitoring?
Global Forum 2007 Venice
 Global Forum 2007 Venice Broadband Infrastructure for Innovative Applications In Established & Emerging Markets November 5, 2007 Jacquelynn Ruff VP, International Public Policy Verizon Verizon Corporate
Partnering with Pacific Rim Ports on Clean Air Strategies
 Partnering with Pacific Rim Ports on Clean Air Strategies Ralph G. Appy,, Ph.D. Environmental Management Division Port of Los Angeles American Association of Port Authorities Harbors, Navigation and Environment
2018 CERTIFICATION TRAINING SCHEDULE COURSE TARGET AUDIENCE FEE JAN FEB MAR APR MAY JUN JUL AUG SEP OCT NOV DEC
 CERTIFICATION TRAINING SCHEDULE COURSE TARGET AUDIENCE FEE JAN FEB MAR APR MAY JUN JUL AUG SEP OCT NOV DEC PECB ISO 90: Quality PECB ISO 140: Environmental PECB OHSA 180: Occupational Health and Safety
Top 10 Established Communities
 october 211 calgary regional housing market statistics Calgary s Housing Market Set to Outpace 21 Several Calgary Communities Get a Boost in Sales and Price Calgary, November 1, 211 According to figures
2018 CERTIFICATION TRAINING SCHEDULE COURSE TARGET AUDIENCE FEE JAN FEB MAR APR MAY JUN JUL AUG SEP OCT NOV DEC
 CERTIFICATION TRAINING SCHEDULE COURSE TARGET AUDIENCE FEE JAN FEB MAR APR MAY JUN JUL AUG SEP OCT NOV DEC PECB ISO 9001: Quality PECB ISO 14001: Environmental PECB OHSA 18001: Occupational Health and
Demand Estimation Sub Committee Ad-hoc Work Plan
 Demand Estimation Sub Committee Ad-hoc Work Plan Background The DESC Ad-hoc Work Plan was established in 2012 to capture any issues and ideas which arise during the year that DESC decide they may like
Multiple Listing Service of Southern Arizona Monthly Statistics December 2018
 For Immediate Release: January, 9 CONTACT: Cheryl Terpening MLSSAZ President (5) 97-7 Sean Murphy Executive Vice President (5) -79 Randy Rogers CEO, MLSSAZ (5) 7- Multiple Listing Service of Southern Arizona
Figure 1 Map of US Coast Guard Districts... 2 Figure 2 CGD Zip File Size... 3 Figure 3 NOAA Zip File Size By State...
 Table of Contents NOAA RNC Charts (By Coast Guard District, NOAA Regions & States) Overview... 1 NOAA RNC Chart File Locations... 2 NOAA RNC by Coast Guard Districts(CGD)... 2 NOAA RNC By States... 3 NOAA
CARRIER, CARRIER BASED SQUADRONS AND NON-CARRIER BASED SQUADRON DEPLOYMENTS DURING THE KOREAN WAR
 CARRIER, CARRIER BASED SQUADRONS AND NON-CARRIER BASED SQUADRON DEPLOYMENTS DURING THE KOREAN WAR Carrier, Air Group and Carrier Based Squadron Deployments Essex (CV 9) with CVG -5 (26 Jun 1951-25 Mar
ISC-AERMOD View Package
 ISC-AERMOD View Package Interface for the US EPA ISC and AERMOD Models Release Notes Release Notes Version 5.3 Lakes Environmental Software Tel: (519) 746-5995 Fax: (519) 746-0793 e-mail: support@weblakes.com
CBERS-2. Attitude Control and its Effects on Image Geometric Correction. Follow up to TCM-06 INPE CBERS TEAM
 CBERS-2 Attitude Control and its Effects on Image Geometric Correction Follow up to TCM-06 INPE CBERS TEAM Topics for discussion Known issues about CBERS-2 attitude data Transmitted attitude angles are
Nutrient loads and trends for several Florida Rivers
 Nutrient loads and trends for several Florida Rivers Chris Sedlacek Jay Silvanima and Gail Sloane Florida Department of Environmental Protection Division of Water Resource Management 1 Introduction Nutrients
Ted C. Jones, PhD Chief Economist
 Ted C. Jones, PhD Chief Economist Hurricanes U.S. Jobs Jobs (Millions) Seasonally Adjusted 150 145 140 135 130 1.41% Prior 12 Months 2.05 Million Net New Jobs in Past 12-Months 125 '07 '08 '09 '10 '11
Capital Rail Constructors: Quarterly Update to MWAA Board of Directors
 Dulles Corridor Metrorail Project Phase 2, Package A Capital Rail Constructors: Quarterly Update to MWAA Board of Directors Keith Couch Capital Rail Constructors January 2016 Agenda 1. Safety 2. Schedule
October 2001 (June 2002 revision) Greenpoint Tittabawassee River Dioxin Study Area Phase I Sampling Study Report
 Greenpoint Tittabawassee River Dioxin Study Area Phase I Sampling Study Report") October 2001 (June 2002 revision) Greenpoint Tittabawassee River Dioxin Study Area Phase I Sampling Study Report Summary Soil samples collected as part of a wetland mitigation project identified elevated
October 2001 (June 2002 revision) Greenpoint Tittabawassee River Dioxin Study Area Phase I Sampling Study Report Summary Soil samples collected as part of a wetland mitigation project identified elevated
OCT NOV DEC JAN FEB MAR APR MAY JUN JUL AUG SEP JAPAN MS YTD TOTAL
 ~ FISCAL YEAR ~ 2015 2016 % change ~ CALENDAR YEAR ~ 2015 2016 % change YTD OCT NOV DEC JAN FEB MAR APR MAY JUN JUL AUG SEP TOTAL 369,552 35,587 39,137 44,910 45,688 42,921 42,539 40,473 39,955 r 38,342