Aswani K. Volety, Michael Savarese, Greg Tolley, Lesli Haynes, Amanda Booth; Coastal Watershed Institute,
|
|
|
- Ethelbert York
- 6 years ago
- Views:
Transcription

1 Aswani K. Volety, Michael Savarese, Greg Tolley, Lesli Haynes, Amanda Booth; Coastal Watershed Institute, Florida Gulf Coast University William Arnold; Florida Wildlife Research Institute Patricia Goodman, Patricia Sime, Peter Doering; South Florida Water Management District


2 Historic Current Flow Flow


3 Getting The Water Right Quantity Quality Timing Distribution

4 Northern Estuaries
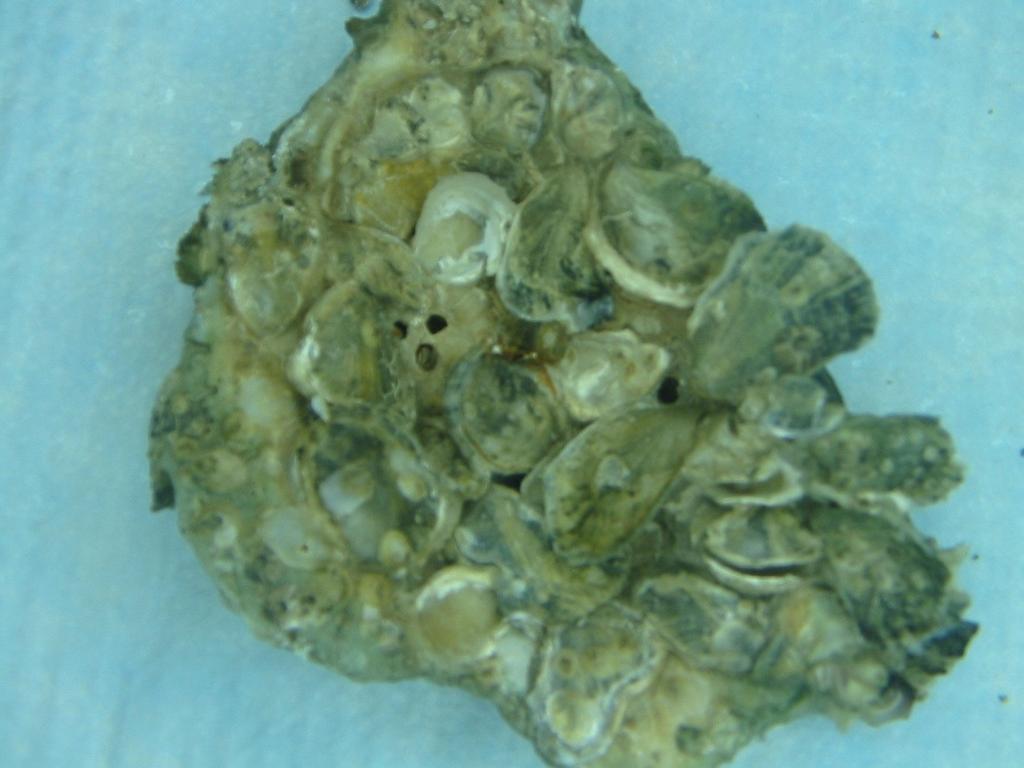
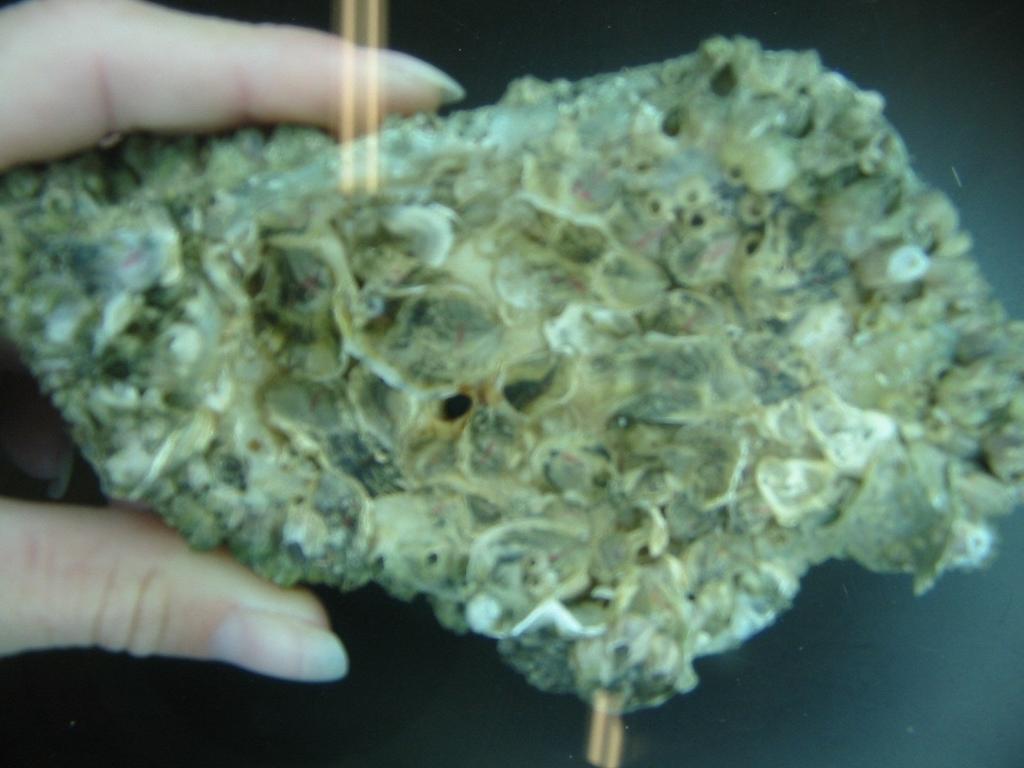
5 Applicability of the oyster indicator species to CERP Oyster life cycle is typical of other estuarine species. Oyster reefs provide habitat, shelter, and food for over 300 species. Oyster reefs contribute to benthic-pelagic coupling. Oysters are primary consumers. Productivity and community structure are directly linked to hydrology. Secondary habitat and food source for 2 and 3 carnivores. Oyster-reef survival, distribution, and aerial extent are key indicators (performance measures) in most RECOVER Conceptual Ecological Models and in CERP Interim Goals;
6 Advantages of the oyster indicator The indicator is feasible to implement and is scientifically defensible The indicator is sensitive to System Drivers (Stressors) The indicator is integrative Goals and Performance measures are established in the RECOVER MAP for the indicator and the following metrics are being monitored
7 Conceptual model Eastern oyster Water Management Adult Density Salinity Sedimentation (muck and rate) Hydrodynamics Temperature Reproduction Predation Substrate Food Larval Recruitment Disease DO Oyster Abundance and Health
8 Performance measures Number of live oysters per square meter; Number of acres of oyster reefs; Condition index of live oysters; Disease prevalence and intensity of Perkinsus marinus in oysters; Larval / spat recruitment Reproduction. Growth and survival
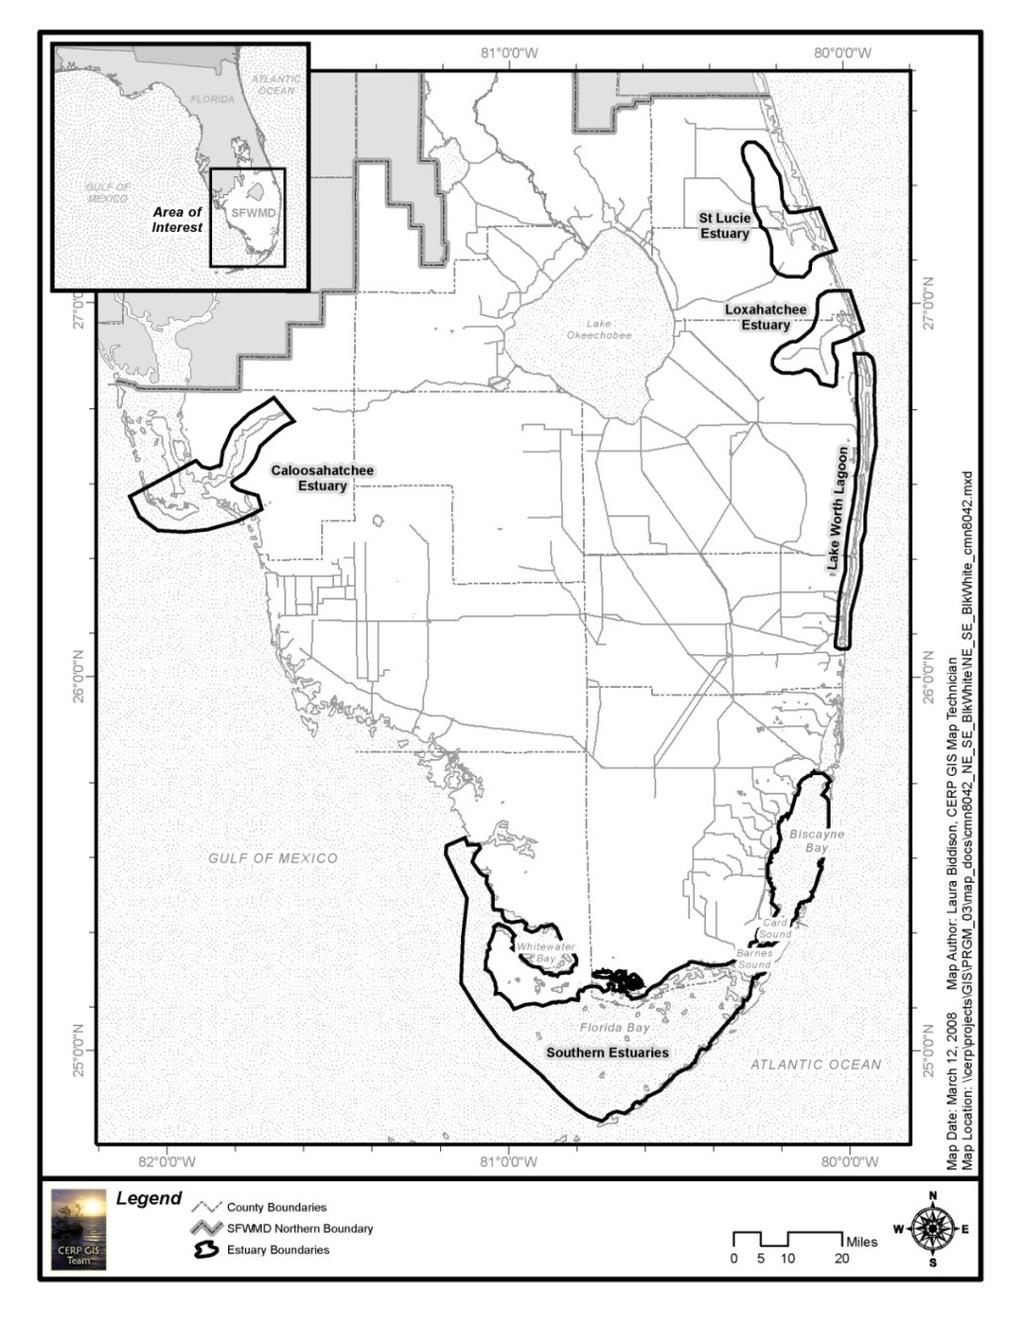
9 STUDY SITES Caloosahatchee River San Carlos Bay Piney Point 2. Cattle Dock 3. Bird Island 4. Kitchel Key 5. Tarpon Bay 5 Gulf of Mexico Sanibel Island
10 Parameters measured Temperature, salinity, D. O. Flow (CFS; SFWMD) Condition Index Perkinsus marinus intensity and prevalence Gonadal Index Spat Recruitment Growth Survival (including predation) Living density
11 Salinity vs. Flow ( data)
12 Condition Index Growth and Survival Quantify the ability of an area to support oyster growth (i.e., suitable water quality, food availability). CI quantifies the overall health. Juvenile survival and growth analyses yield results related to short-term survival and long term potential to support oyster reefs
13 Condition Index CI Piney Point Cattle Dock Bird Island Kitchel Key Tarpon Bay
14 Juvenile Growth closed bag Length (mm) Iona Cove Cattle Dock Bird Island Kitchel Key Tarpon Bay PepperTree Dec '07 Jan '08 Feb '08 Mar '08 Apr '08 May '08 Jun '08 Jul '08 Aug '08 Sep '08 Oct '08 Nov '08 Month
15 Juvenile growth -closed Size (mm) Iona Cove Cattle Dock Bird Island Kitchel Key Tarpon Bay PepperTree 5 0 Dec '07 Jan '08 Feb '08 Mar '08 Apr '08 May '08 Jun '08 Jul '08 Aug '08 Sep '08 Oct '08 Nov '08 Dec '08 Sampling month
16 Juvenile survival closed bag Iona Cove # Living oysters Cattle Dock Bird Island Kitchel Key Tarpon Bay 50 PepperTree 0 Dec '07 Jan '08 Feb '08 Mar '08 Apr '08 May '08 Jun '08 Jul '08 Aug '08 Sep '08 Oct '08 Nov '08 Month
17 Juvenile survival open bag Size (mm) Iona Cove Cattle Dock Bird Island Kitchel Key Tarpon Bay PepperTree 0 Dec '07 Jan '08 Feb '08 Mar '08 Apr '08 May '08 Jun '08 Jul '08 Aug '08 Sep '08 Oct '08 Nov '08 Dec '08 Sampling Time
18 Survival: Disease Juvenile survival and disease analyses yield results related to short-term survival P. marinus intensity IC CD BI KK TB Sampling Location
19 P. marinus intensity Infection intensity Piney Point Cattle Dock Bird Island Kitchel Key Tarpon Bay Sampling time
20 Figure1: P erkinsusmarinusinfec tionprevalence(%inf ectedoysters)inoyste rsfrom Calosaha Lo FL. tcheestuary, cationspineypoint, C atledock, BirdIsland, Kitchel Key, andt arponbayarefromup streamtodownstream. Tenoystersperloca tionare P. marinus prevalence % of oysters infec cted Piney Point Cattle Dock Bird Island Kitchel Key Tarpon Bay
21 Reproduction Effects of water quality and substrate on long-term viability of reef Gonadal index: reproductive stage and qualitative estimate of fecundity Recruitment: estimates for next year class Management implications: timing of freshwater inflows
22 Spat Recruitment Spat/shelll Oct '00 Feb '01 Jun '01 Oct '01 Mar '02 Jul '02 Nov '02 Mar '03 July '03 Nov '03 Mar '04 Jul '04 Nov '04 Mar '05 Jul '05 Nov '05 Mar '06 Jul '06 Nov '06 Mar '07 Jul '07 Nov '07 Sampling Month Piney Point Cattle Dock Bird Island Kitchel Key Tarpon Bay PepperTree Point
23 Spat Recruitment Caloosahatchee River Oysters spawn between May October. Large freshwater releases flush larvae downstream or create unfavorable salinity conditions. Spat / she ell Jan Feb Mar Apr May Jun Jul Aug Sep Oct Nov Dec Sampling Month IC CD BI KK TB PTP


24 Spat Recruitment
25 Reproduction Effects of water quality and substrate on long-term viability of reef Gonadal index: reproductive stage and qualitative estimate of fecundity Recruitment: estimates for next year class Management implications: timing of freshwater inflows
26 Gonadal Index Gonadal Index Sampling month PP CD BI KK TB
27 Living Density Dry Season Wet Season Dry '06 Dry ' Wet '06 Wet ' Iona Cove Cattle dock Bird Island Kitchel Key Tarpon Bay 0 Iona Cove Cattle dock Bird Island Kitchel Key Tarpon Bay
28 Living Density (2008) Living oysters / sq. m Caloosa 2008 Density Data (Average # oysters per square meter) Dry Iona Cove Cattle dock Bird Island Kitchel Key Tarpon Bay Sampling location
29 Approach What do we do with the data? The measurements we make will answer why and not just what is happening. Enables us to engage in adaptive management. In addition to scientific evaluation of the cause and effect relationship, we need to communicate the results with resource managers and public Stoplight Indicator (Success (Green), Caution (Yellow) and Failure (Red). Caloosahatchee Estuary as an example
30 Stoplight Indicator A communication tool that uses MAP performance measures to grade an estuary s response to anthropogenic or restoration inputs (Average of component score + trend score). Questions or decision rules are developed for each performance measure and translated as suitability curves. Suitability curve address: (1) Have we reached the restoration target, and (2) are we making progress toward targets? Finally, results are translated into a stoplight display (red, yellow, green)
31 Component Scores Decision rules 1. What is the current living density, in individuals per meter square, of oysters in the Caloosahatchee estuary. a Score: 0 Red b. > Score: 0.5 Yellow c. > Score: 1.0 Green 2. What is the current condition index of the oysters in the Caloosahatchee estuary? Use the yearly average. a Score: 0 Red b. > Score: 0.5 Yellow c. > Score: 1.0 Green 3. What is the current gonadal condition of oysters in the Caloosahatchee estuary? Use the yearly average. a. 0 1 Score: 0 Red b. >1-2 Score: 0.5 Yellow c. >2-4 Score: 1 Green
32 Component Scores decision rules 4. What is the current spat recruitment of oysters (spat / shell) in the Caloosahatchee estuary? a. 0-5 Score: 0 Red b. > 5-20 Score: 0.5 Yellow c. > Score: 1.0 Green 5. What is the current growth of juvenile oysters in mm/month? a. 0 1 Score: 0 Red b. > Score: 0.5 Yellow c. > Score: 1.0 Green 6. What is the prevalence of Perkinsus marinus (% of infected oysters) in oysters from the Caloosahatchee estuary? Use the yearly average. a Score: 1 Green b. > Score: 0.5 Yellow c. > Score: 0 Red 7. What is the intensity of Perkinsus marinus (scale 0-5) in oysters from the Caloosahatchee estuary? Use the yearly average. a. 0-1 Score: 1 Green b. > 1-3 Score: 0.5 Yellow c. > 3 5 Score: 0 Red
33 Trend score
34 Trend score decision rule Trend question a. - slope Score: 0 Red b. no slope Score: 0.5 Yellow c. + slope Score: 1.0 Green Translation of component score and trend score into an index score Index Stoplight Color Score Red > Yellow > Green
35 Caloosahatchee estuary Component Parameter Value Parameter Value Stoplight Index Score Trend Trend Stop light Trend score Average Component Score Component Stoplight Oysters Living Density (per sq. m.) (1+0.5)/2=0.75 Condition Index ( )/2=0.5 Spat Recruitment per shell ± 0.5 (0+0.5)/2=0.5 Juvenile growth (mm/month) ± 0.5 ( )/2=0.5 Perkinsus marinus prevalence Perkinsus marinus intensity (0.5+0)/2= (1+0)/2=0.5 Geometric mean of oyster component scores (0.75 x 0.5 x 0.5 x 0.5 x 0.25 x 0.5) 1/6 = Final Eastern Oyster Index score = 0.5
36 St. Lucie Estuary Component Living Density (per sq. m.) Condition Index Spat Recruitment per shell Juvenile growth (mm/month) Perkinsus marinus prevalence Perkinsus marinus intensity Parameter Value Parameter Value Stoplight Index Score Trend Trend Stop Light Trend Score Average Component Score (1+0)/2= ( )/2= (0+0)/2= (1+0.5)/2= (1+0)/2= (1+0.5)/2=0.75 Compon ent Stoplight Geometric mean of oyser component scores (0.5*0.5*0*1*0.5*1) 1/6 =0 Final Eastern Oyster Index Score = 0
37 Loxahatchee Estuary Component Living Density (per sq. m.) Condition Index Spat Recruitment per shell Juvenile growth (mm/month) Perkinsus marinus prevalence Perkinsus marinus intensity Parameter Value Parameter Value Stoplight Index Score Trend Trend Stop Light Trend Score Average Component Score (1+0)/2= (1+0.5)/2= (0+1)/2= (1+0.5)/2= (0.5+0)/2= (1+0)/2=0.5 Compon ent Stoplight Geometric mean of oyster component scores (0.5*0.75*0.5*0.75*0.25*0.5) 1/6 =0.03 Final Eastern Oyster Index Score = 0.03
38 Lake Worth Lagoon Component Living Density (per sq. m.) Condition Index Spat Recruitment per shell Juvenile growth (mm/month) Perkinsus marinus prevalence Perkinsus marinus intensity Parameter Value Parameter Value Stoplight Index Score Trend Trend Stop Light Trend Score Average Component Score (0+0)/2= (1+1)/2= (0+0.5)/2= ( )/2= (0.5+0)/2= (1+0)/2=0.5 Component Stoplight Geometric mean of oyster component scores (0*1*0.25*0.5*0.25*0.5) 1/6 =0.0 Final Eastern Oyster Index Score = 0.0
39 Summary Freshwater releases from Lake Okeechobee decrease salinities at the samples sites by 3-6 ppt. Juvenile oysters at upstream locations with intermediate salinities showed higher growth, with the exception of Cattle Dock, a location that receives output from Cape Coral (water quality?)
40 Summary Oysters in the Caloosahatchee Estuary spawn continuously between April October. High levels of freshwater flows during summer (spawning) months may flush out oyster larvae or reduce salinities to unfavorable levels. High salinities in 2007 resulted in poor spat recruitment and higher disease levels (as well as low survival due to predation?)
41 Summary Flows between CFS from Lake Okeechobee will result in optimum salinities at sampling locations (15 25 ppt). Stoplight indicator communication toll was developed. Can be adapted for other estuaries Caloosahatchee estuary is at Caution
42 Future directions Integration of the data with HSI Inclusion of other factors influencing oyster responses Newer techniques that will enhance the sample size and power of analyses Addition / changing sampling locations Looking at why the indicator species is responding and not what it is doing. Adaptive management
43 Acknowledgements Funding: South Florida Water Management District; FGCU; USDOE; EPA. Technical / Field Help: Lesli Haynes, Amanda Bridges, Erin Dykes and numerous graduate and undergraduate students.
Canada s Fish Habitat Law. Fish - Water Quantity Interactions Okanagan Water Stewardship Council Meeting Oct 12, Kelowna, B.C.
 Canada s Fish Habitat Law Fish - Water Quantity Interactions Okanagan Water Stewardship Council Meeting Oct 12, 2006 - Kelowna, B.C. Disclaimer This presentation was developed at the specific request of
Federal Water Rights Training: Reservations of Water in Alaska
 Federal Water Rights Training: Reservations of Water in Alaska David W. Schade, MPA Water Resources Section Chief Kim Sager, MS Reservation of Water Specialist (NRSIII) Facts: 586,412 Square Miles of Land
Undergraduate Admission File
 Undergraduate Admission File June 13, 2007 Information Resources and Communications Office of the President University of California Overview Population The Undergraduate Admission File contains data on
RLMYPRINT.COM 30-DAY FREE NO-OBLIGATION TRIAL OF RANDOM LENGTHS MY PRINT.
 My Print ON-DEMAND GRAPHS AND PRICE REPORTS TRY IT FREE FOR 30 DAYS! RLMYPRINT.COM 30-DAY FREE NO-OBLIGATION TRIAL OF RANDOM LENGTHS MY PRINT. Register and immediately begin using the new Web site to create
South Platte Summary January Compiled by Lee Cunning, P.E.
 South Platte Summary January 218 Compiled by Lee Cunning, P.E. COLORADO DIVISION OF WATER RESOURCES, DIVISION 1 MONTH OF January 218 RESERVOIR FULL ALLOWABLE CAPACITY FIRST OF MONTH (ACRE (ACRE FEET) FEET)
Industrial Machinery. Search Marketing Case Study
 Industrial Machinery Search Marketing Case Study 2015-2016 A performance digital marketing consultancy & training academy. Our team comprises of digital researchers, strategists, consultants, usability
NMOSE GPCD CALCULATOR
 NMOSE CALCULATOR It should be noted that all the recorded data should be from actual metered results and should not include any estimates. Gallons per Capita - v2.4 Beta Release Date: Mar, 16, 29 This
Seattle (NWMLS Areas: 140, 380, 385, 390, 700, 701, 705, 710) Summary
 Summary") October, 2016 MTD MARKET UPDATE Data Current Through: October, 2016 (NWMLS Areas: 140, 380, 385, 390,, 701, 705, 710) Summary Active, Pending, & Months Supply of Inventory 4,500 4,000 3,500 4,197 4,128
October, 2016 MTD MARKET UPDATE Data Current Through: October, 2016 (NWMLS Areas: 140, 380, 385, 390,, 701, 705, 710) Summary Active, Pending, & Months Supply of Inventory 4,500 4,000 3,500 4,197 4,128
software.sci.utah.edu (Select Visitors)
") software.sci.utah.edu (Select Visitors) Web Log Analysis Yearly Report 2002 Report Range: 02/01/2002 00:00:0-12/31/2002 23:59:59 www.webtrends.com Table of Contents Top Visitors...3 Top Visitors Over Time...5
software.sci.utah.edu (Select Visitors) Web Log Analysis Yearly Report 2002 Report Range: 02/01/2002 00:00:0-12/31/2002 23:59:59 www.webtrends.com Table of Contents Top Visitors...3 Top Visitors Over Time...5
SANS Vendor Events. SANS offers a variety of events which bring you in touch with the highly qualified SANS community.
 SANS Vendor Events SANS offers a variety of events which bring you in touch with the highly qualified SANS community. SANS National Events over 1200 profession IT Security attendees and over 45 SANS classes
Excel Functions & Tables
 Excel Functions & Tables SPRING 2016 Spring 2016 CS130 - EXCEL FUNCTIONS & TABLES 1 Review of Functions Quick Mathematics Review As it turns out, some of the most important mathematics for this course
Section 1.2: What is a Function? y = 4x
 Section 1.2: What is a Function? y = 4x y is the dependent variable because it depends on what x is. x is the independent variable because any value can be chosen to replace x. Domain: a set of values
All King County Summary Report
 September, 2016 MTD MARKET UPDATE Data Current Through: September, 2016 18,000 16,000 14,000 12,000 10,000 8,000 6,000 4,000 2,000 0 Active, Pending, & Months Supply of Inventory 15,438 14,537 6.6 6.7
Troop calendar
 Troop 546 2013-2014 calendar For questions and information please visit www.troop546peoriaaz.com or email troop546info@googlegroups.com August Court of honor Tue Aug 27, 2013 6pm - 7:30pm Award scouts
2016 Market Update. Gary Keller and Jay Papasan Keller Williams Realty, Inc.
 2016 Market Update Gary Keller and Jay Papasan Housing Market Cycles 1. Home Sales The Numbers That Drive U.S. 2. Home Price 3. Months Supply of Inventory 4. Mortgage Rates Real Estate 1. Home Sales Nationally
This report is based on sampled data. Jun 1 Jul 6 Aug 10 Sep 14 Oct 19 Nov 23 Dec 28 Feb 1 Mar 8 Apr 12 May 17 Ju
 0 - Total Traffic Content View Query This report is based on sampled data. Jun 1, 2009 - Jun 25, 2010 Comparing to: Site 300 Unique Pageviews 300 150 150 0 0 Jun 1 Jul 6 Aug 10 Sep 14 Oct 19 Nov 23 Dec
Study on Fish Productivity in Bichhiya River and Govindgarh Lake of district Rewa, Madhya Pradesh
 International Journal of Scientific and Research Publications, Volume 7, Issue 7, July 2017 522 Study on Fish Productivity in Bichhiya River and Govindgarh Lake of district Rewa, Madhya Pradesh Dr. Ajay
Seattle (NWMLS Areas: 140, 380, 385, 390, 700, 701, 705, 710) Summary
 Summary") September, 2016 MTD MARKET UPDATE Data Current Through: September, 2016 (NWMLS Areas: 140, 380, 385, 390,, 701, 705, 710) Summary Active, Pending, & Months Supply of Inventory 5,000 4,500 4,000 3,500 4,091
September, 2016 MTD MARKET UPDATE Data Current Through: September, 2016 (NWMLS Areas: 140, 380, 385, 390,, 701, 705, 710) Summary Active, Pending, & Months Supply of Inventory 5,000 4,500 4,000 3,500 4,091
Seattle (NWMLS Areas: 140, 380, 385, 390, 700, 701, 705, 710) Summary
 Summary") November, 2016 MTD MARKET UPDATE Data Current Through: November, 2016 (NWMLS Areas: 140, 380, 385, 390,, 701, 705, 710) Summary 4,000 3,500 3,000 2,500 2,000 1,500 1,000 500 0 Active, Pending, & Months
November, 2016 MTD MARKET UPDATE Data Current Through: November, 2016 (NWMLS Areas: 140, 380, 385, 390,, 701, 705, 710) Summary 4,000 3,500 3,000 2,500 2,000 1,500 1,000 500 0 Active, Pending, & Months
MIKE 21 & MIKE 3 Flow Model FM. ABM Lab Module. Short Description
 MIKE 21 & MIKE 3 Flow Model FM ABM Lab Module Short Description DHI headquarters Agern Allé 5 DK-2970 Hørsholm Denmark +45 4516 9200 Telephone +45 4516 9333 Support +45 4516 9292 Telefax mike@dhigroup.com
Sand Pit Utilization
 Sand Pit Utilization A construction company obtains sand, fine gravel, and coarse gravel from three different sand pits. The pits have different average compositions for the three types of raw materials
Development of a two-dimensional fish model to simulate biomass of Pacific saury using Eulerian method
 Development of a two-dimensional fish model to simulate biomass of Pacific saury using Eulerian method Fumitake Shido, Yasuhiro Yamanaka, Shin-ichi Ito, Taketo Hashioka, Daiki Mukai, and Michio J. Kishi
Automated Data Quality Assurance for Marine Observations
 Automated Data Quality Assurance for Marine Observations James V. Koziana Science Applications International Corporation (SAIC) Hampton, VA 23666 USA Third Meeting of GCOOS DMAC Renaissance Orlando Hotel
Nutrient loads and trends for several Florida Rivers
 Nutrient loads and trends for several Florida Rivers Chris Sedlacek Jay Silvanima and Gail Sloane Florida Department of Environmental Protection Division of Water Resource Management 1 Introduction Nutrients
Grade 4 Mathematics Pacing Guide
 Jul 2014 ~ August 2014 ~ Sep 2014 1 2 3 4 5 6 7 8 9 10 11 12 14 15 16 17 Routines 19 Routines 20 Routines BOY 22 BOY 23 24 11 12 14 29 15 30 31 Notes: Found Online @ wwweverydaymathonlinecom 1 More Calendars
Stream Depletion Factor Model SDF View
 Stream Depletion Factor Model SDF View User Manual - Version 1.2 Developed for the South Platte Advisory Committee by the Integrated Decision Support Group (IDS) at Colorado State University User Manual
Best Practices in CIS Implementation. TECO s CRB Implementation
 Best Practices in CIS Implementation TECO s CRB Implementation Katie Guice, Director, Customer Solutions & Strategic Projects Tampa Electric & Peoples Gas System 1 TECO Energy: An Emera Company Energy-related
Asks for clarification of whether a GOP must communicate to a TOP that a generator is in manual mode (no AVR) during start up or shut down.
 during start up or shut down.") # Name Duration 1 Project 2011-INT-02 Interpretation of VAR-002 for Constellation Power Gen 185 days Jan Feb Mar Apr May Jun Jul Aug Sep O 2012 2 Start Date for this Plan 0 days 3 A - ASSEMBLE SDT 6 days
# Name Duration 1 Project 2011-INT-02 Interpretation of VAR-002 for Constellation Power Gen 185 days Jan Feb Mar Apr May Jun Jul Aug Sep O 2012 2 Start Date for this Plan 0 days 3 A - ASSEMBLE SDT 6 days
Is Something Wrong with Texas Home Prices?
 Is Something Wrong with Texas Home Prices? Finding Shelter: Affordability Squeeze in a Tight Texas Housing Market Dallas Federal Reserve February 23, 2018 Constrained supply plus strong demand = accelerated
Quarterly Sales (in millions) FY 16 FY 15 FY 14 Q1 $706.8 $731.1 $678.5 Q Q Q
 FY 16 FY 15 FY 14 Q1 $706.8 $731.1 $678.5 Q Q Q") The following represents historical unaudited financial and statistical information regarding MSC s operations. MSC does not undertake any obligation to update any of the information presented below to
The following represents historical unaudited financial and statistical information regarding MSC s operations. MSC does not undertake any obligation to update any of the information presented below to
Google Analytics: A Worm's-Eye View & DigitalCommons Usage Reports
 University of Nebraska - Lincoln DigitalCommons@University of Nebraska - Lincoln Library Conference Presentations and Speeches Libraries at University of Nebraska-Lincoln 4-1-2010 Google Analytics: A Worm's-Eye
CIMA Asia. Interactive Timetable Live Online
 CIMA Asia Interactive Timetable 2017 2018 Live Online Version 1 Information last updated 09 October 2017 Please note: Information and dates in this timetable are subject to change. CIMA Cert BA Course
Contents:
 Contents: Conventional/REO/Short Sale Single Family Sold Sold Properties by Cities - Properties Sold Supply Inventory Median Price Comparison by Year www.swflrealtors.com Page #. Single Family & Condo
Your Future with Worldpay. Shane Happach Managing Director, Worldpay ecom
 Your Future with Worldpay Shane Happach Managing Director, Worldpay ecom Leaders in modern money 2 Worldpay 2016. All rights reserved. In 2015 Transactions a day Processed 3 Worldpay 2016. All rights reserved.
Monthly SEO Report. Example Client 16 November 2012 Scott Lawson. Date. Prepared by
 Date Monthly SEO Report Prepared by Example Client 16 November 212 Scott Lawson Contents Thanks for using TrackPal s automated SEO and Analytics reporting template. Below is a brief explanation of the
New Concept for Article 36 Networking and Management of the List
 New Concept for Article 36 Networking and Management of the List Kerstin Gross-Helmert, AFSCO 28 th Meeting of the Focal Point Network EFSA, MTG SEAT 00/M08-09 THE PRESENTATION Why a new concept? What
REPORT ON TELECOMMUNICATIONS SERVICE QUALITY WINDSTREAM FLORIDA, INC.
 REPORT ON TELECOMMUNICATIONS SERVICE QUALITY For WINDSTREAM FLORIDA, INC. Alachua, Brooker, High Springs, Melrose, and Waldo s February 4 March 14, 2008 Division of Service, Safety & Consumer Assistance
HPE Security Data Security. HPE SecureData. Product Lifecycle Status. End of Support Dates. Date: April 20, 2017 Version:
 HPE Security Data Security HPE SecureData Product Lifecycle Status End of Support Dates Date: April 20, 2017 Version: 1704-1 Table of Contents Table of Contents... 2 Introduction... 3 HPE SecureData Appliance...
CBERS-2. Attitude Control and its Effects on Image Geometric Correction. Follow up to TCM-06 INPE CBERS TEAM
 CBERS-2 Attitude Control and its Effects on Image Geometric Correction Follow up to TCM-06 INPE CBERS TEAM Topics for discussion Known issues about CBERS-2 attitude data Transmitted attitude angles are
Diversity of Aquatic macrophytes of Aligarh, U.P. India
 ISSN: 2319-7706 Volume 4 Number 4 (2015) pp. 494-505 http://www.ijcmas.com Original Research Article Diversity of Aquatic macrophytes of Aligarh, U.P. India Uzma Ahmad*, Saltanat Parveen, Taskeena Hasan
For personal use only. Update Event & nearmap Solar
 Update Event & nearmap Solar Update Event and nearmap Solar Paul Peterson Senior VP Product & Engineering 2 Current Clear Change Current What s on the ground now Clear Unrivalled clarity Change Monitor
AIMMS Function Reference - Date Time Related Identifiers
 AIMMS Function Reference - Date Time Related Identifiers This file contains only one chapter of the book. For a free download of the complete book in pdf format, please visit www.aimms.com Aimms 3.13 Date-Time
Maximizing Asset ROI for Self & Clients in a Public Sector Setting. July 16 th San Diego
 Maximizing Asset ROI for Self & Clients in a Public Sector Setting July 16 th San Diego State of Washington Population: 7.53 M Area: 71,303 Sq. Miles Population density: 107 population/mi² Puget Sound
Dataset Information Form (DIF) Guide
 Guide") Dataset Information Form (DIF) Guide Contents Section 1: What is a Dataset Information Form?...1 Section 2: User Account...1 Section 3: Tasks and Dataset List...2 Section 4: Creating a New Dataset Information
Dataset Information Form (DIF) Guide Contents Section 1: What is a Dataset Information Form?...1 Section 2: User Account...1 Section 3: Tasks and Dataset List...2 Section 4: Creating a New Dataset Information
October Real Sector Statistics Division. Methodology
 October 2013 Methodology The Consumer Survey has been conducted monthly since October 1999. Moreover, since January 2007 the Survey has involved 4,600 households as respondents (stratified random sampling)
Proposed Increase In Rates In Water, Sewer and Reclaimed. June 9, 2009
 Proposed Increase In Rates In Water, Sewer and Reclaimed June 9, 2009 1 WATER 2 3 Reclaimed Water Accounts 27,500 25,000 22,500 20,000 17,500 15,000 12,500 10,000 7,500 5,000 2,500 387-24,863 4 FY 96 FY
6.0 WILDLIFE ACCIDENTS BY REGION
 6. WILDLIFE ACCIDENTS BY REGION 6.1 Regional Comparisons Regional Overviews The British Columbia Ministry of Transportation divides its operational administration into three Regions, South Coast, Southern
Freedom of Information Act 2000 reference number RFI
 P. Norris By email to: xxxxxxxxxxxxxxxxxxxxxx@xxxxxxxxxxxxxx.xxm 02 November 2011 Dear P. Norris Freedom of Information Act 2000 reference number RFI20111218 Thank you for your request under the Freedom
McLean BASIS plus TM. Sample Hospital. Report for April thru June 2012 BASIS-24 APR-JUN. McLean Hospital
 APR-JUN 212 McLean BASIS plus TM Sample Hospital Report for April thru June 212 BASIS-24 McLean Hospital 115 Mill Street Belmont, MA 2478 Department of Mental Health Services Evaluation Tel: 617-855-2424
Nigerian Telecommunications Sector
 Nigerian Telecommunications Sector SUMMARY REPORT: Q4 and full year 2015 NATIONAL BUREAU OF STATISTICS 26th April 2016 Telecommunications Data The telecommunications data used in this report were obtained
A comparison of AMoN measurements with localized, arrayed passive NH 3 samplers in Northern Utah Dr. Randal S. Martin
 A comparison of AMoN measurements with localized, arrayed passive NH 3 samplers in Northern Utah Dr. Randal S. Martin Dept. of Civil and Env. Eng. Utah Water Research Laboratory Utah State University Utah
ICT PROFESSIONAL MICROSOFT OFFICE SCHEDULE MIDRAND
 ICT PROFESSIONAL MICROSOFT OFFICE SCHEDULE MIDRAND BYTES PEOPLE SOLUTIONS Bytes Business Park 241 3rd Road Halfway Gardens Midrand Tel: +27 (11) 205-7000 Fax: +27 (11) 205-7110 Email: gauteng.sales@bytes.co.za
FATHOM Model for Florida Bay: Overview and Calibration/Verification Exercise
 FATHOM Model for Florida : Overview and Calibration/Verification Exercise October 2-3, 13 Frank Marshall, Bill Nuttle, Jack Cosby Flux Accounting and Tidal Hydrology at the Ocean Margin The FATHOM Model
20 April Re: South Florida Coastal Water Quality Monitoring Network Oct. Dec Quarterly Report for SFWMD Contract #
 Southeast Environmental Research Center OE-148 Florida International University, Miami, FL 33199 305-348-3095, 305-348-4096 fax, http://serc.fiu.edu Michael Wright SFWMD Water Quality Analysis Division
San Francisco Housing Authority (SFHA) Leased Housing Programs October 2015
 Leased Housing Programs October 2015") San Francisco Housing Authority (SFHA) Leased Housing Programs October 2015 Table of Contents Program Utilization Summary 3 PIC Reporting Rate 4-5 Operational Updates Recertifications and Inspections 6-7
San Francisco Housing Authority (SFHA) Leased Housing Programs October 2015 Table of Contents Program Utilization Summary 3 PIC Reporting Rate 4-5 Operational Updates Recertifications and Inspections 6-7
SME License Order Working Group Update - Webinar #3 Call in number:
 SME License Order Working Group Update - Webinar #3 Call in number: Canada Local: +1-416-915-8942 Canada Toll Free: +1-855-244-8680 Event Number: 662 298 966 Attendee ID: check your WebEx session under
INTERTANKO Vetting seminar 24 th October 2017
 INTERTANKO Vetting seminar 24 th October 2017 SIRE Developments VIQ 7 New VIQ being developed Structure will remain the same with 13 chapters. Reduction in the number of questions, net approx. 70 decrease.
SCI - software.sci.utah.edu (Select Visitors)
") SCI - software.sci.utah.edu (Select Visitors) Web Log Analysis Yearly Report 2004 Report Range: 01/01/2004 00:00:00-12/31/2004 23:59:59 www.webtrends.com Table of Contents Top Visitors...3 Top Visitors
SCI - software.sci.utah.edu (Select Visitors) Web Log Analysis Yearly Report 2004 Report Range: 01/01/2004 00:00:00-12/31/2004 23:59:59 www.webtrends.com Table of Contents Top Visitors...3 Top Visitors
Oxford Scientific Software Ltd
 Oxford Scientific Software Ltd 14 Quarry Road, Oxford, OX3 8NU Tel: +44 (0) 1865 766094 Fax: +44 (0) 1865 766091 Email: support@oxscisoft.com Aquator Version 4.3 This version of Aquator adds a significant
Polycom Advantage Service Endpoint Utilization Report
 Polycom Advantage Service Endpoint Utilization Report ABC Company 9/1/2018-9/30/2018 Polycom, Inc. All rights reserved. SAMPLE REPORT d This report is for demonstration purposes only. Any resemblance to
September Real Sector Statistics Division. Methodology
 September 2014 Methodology The Consumer Survey has been conducted monthly since October 1999. Moreover, since January 2007 the Survey has involved 4,600 households as respondents (stratified random sampling)
Polycom Advantage Service Endpoint Utilization Report
 Polycom Advantage Service Endpoint Utilization Report ABC Company 3/1/2016-3/31/2016 Polycom, Inc. All rights reserved. SAMPLE REPORT d This report is for demonstration purposes only. Any resemblance to
Coaching emerit Certified Event Find out what level you are ready for and what you need to JHB
 For more information on these courses, please visit www.exsaacademy.co.za/courses or contact 011 467 6771 or e-mail: info@exsaacademy.co.za DATE NAME OF COURSE COURSE OUTLINE WHERE DURATION MARCH 07-Mar
San Joaquin County Emergency Medical Services Agency
 San Joaquin County Emergency Medical Services Agency http://www.sjgov.org/ems Memorandum TO: All Interested Parties FROM: Rick Jones, EMS Analyst DATE: January, 19 Mailing Address PO Box French Camp, CA
Essentials. Week by. Week. All About Data. Algebra Alley
 > Week by Week MATHEMATICS Essentials Algebra Alley Jack has 0 nickels and some quarters. If the value of the coins is $.00, how many quarters does he have? (.0) What s The Problem? Pebble Pebble! A pebble
TOWN MANAGER S WEEKLY REPORT
 TOWN MANAGER S WEEKLY REPORT UPCOMING MEETINGS & EVENTS Town Council Meeting: Wednesday, May 10, 7:00 PM, Regular Meeting, Town Hall Planning Commission: Wednesday, May 17, 6:00 PM, Town Hall 1. Public
CIMA Asia. Interactive Timetable Live Online
 CIMA Asia Interactive Timetable 2018 Live Online Information version 8 last updated 04/05/18 Please note information and dates are subject to change. Premium Learning Partner 2018 CIMA Cert BA Course Overview
Integrated Water Resources Science and Services (IWRSS)
") TOO MUCH POOR QUALITY TOO LITTLE Integrated Water Resources Science and Services (IWRSS) Collaborative Science, Services and Tools to Support Integrated and Adaptive Water Resources Management April, 2011
TOO MUCH POOR QUALITY TOO LITTLE Integrated Water Resources Science and Services (IWRSS) Collaborative Science, Services and Tools to Support Integrated and Adaptive Water Resources Management April, 2011
CMR India Monthly Mobile Handset Market Report. June 2017
 CMR India Monthly Mobile Handset Market Report June 2017 Cyber Media Research Ltd. www.cmrindia.com Submitted by: Copyright 1 Copyright 2017 Cyber 2017 Cyber Media Media Research Research Ltd. Reproduction
Metro Transit Police Update
 Metro Transit Police Update John Harrington Chief of Metro Transit Police 1 Metro Transit Police Mission Protecting our community through innovation and problem solving Vision A department that is reflective
Inter-Domain Routing Trends
 Inter-Domain Routing Trends Geoff Huston gih@apnic.net APNIC March 2007 Agenda 1. Some data about the network and BGP over 2006 2. Some observations about the distribution patterns of BGP updates 3. Pointers
Routing the Internet in Geoff Huston APNIC March 2007
 Routing the Internet in 2006 Geoff Huston APNIC March 2007 IPv4 in 2006 Total Advertised BGP Prefixes BGP Table Growth 210000 200000 190000 BGP FIB Entries 180000 2006 170000 2005 160000 150000 Jan Feb
MicroMVL Release History. Note: Changes in black mean new features or capabilities and red changes mean corrections from previous versions.
 MicroMVL Release History Note: Changes in black mean new features or capabilities and red changes mean corrections from previous versions. Version Release Date Changes 2.23 18-May-2018 Fixed Audit Trail
Aon Hewitt. Facts & Figures. March 2016 Update. Risk. Reinsurance. Human Resources. Empower Results
 Aon Hewitt Facts & Figures Risk. Reinsurance. Human Resources. Empower Results Facts & Figures Contents In this document... This button normally prints the whole document. If you want to print just the
Houston Economic Overview Presented by Patrick Jankowski, SVP Research Greater Houston Partnership
 Houston Economic Overview Presented by Patrick Jankowski, SVP Research Greater Houston Partnership Order of the Day Order of the Day Rig count fell 80% Oil prices dropped 75% Energy layoffs spiked Office
Statistical Charts and Graphs. June 1, 2012
 Statistical Charts and Graphs June 1, 212 Part 1 The Collections Titles Held by Helen Hall Library Titles Held Music, 84 Serials, 1462 MRDFs, 5 Maps, 6 eaudiobooks, 3623 Audiobooks, 361 ebooks, 1118 CDs,
INFORMATION TECHNOLOGY SPREADSHEETS. Part 1
 INFORMATION TECHNOLOGY SPREADSHEETS Part 1 Page: 1 Created by John Martin Exercise Built-In Lists 1. Start Excel Spreadsheet 2. In cell B1 enter Mon 3. In cell C1 enter Tue 4. Select cell C1 5. At the
Adding Three Fractions. Choosing the Best Graph
 Adding Three Fractions Problem Solving: Choosing the Best Graph Adding Three Fractions How do we use good number sense with fractions? Let s review least common multiples. Look at the following set of
Invincea Endpoint Protection Test
 Invincea Endpoint Protection Test A test commissioned by Invincea and performed by AV-TEST GmbH. Date of the report: May 2 nd, 2016 Executive Summary In April 2016, AV-TEST performed a review of the Invincea
2
 May 2016 1 2 3 4 5 A. Consumer Confidence Index (CCI) - Consumer Confidence Index (CCI) - Current Economic Condition Index (CECI) - Consumer Expectation Index (CEI) Current Economic Condition Index - Current
1.2 Characteristics of Function Graphs
 1.2 Characteristics of Function Graphs Essential Question: What are some of the attributes of a function, and how are they related to the function s graph? Resource Locker Explore Identifying Attributes
Ted C. Jones, PhD Chief Economist
 Ted C. Jones, PhD Chief Economist Hurricanes U.S. Jobs Jobs (Millions) Seasonally Adjusted 150 145 140 135 130 1.41% Prior 12 Months 2.05 Million Net New Jobs in Past 12-Months 125 '07 '08 '09 '10 '11
Quantitative Vulnerability Assessment of Systems Software
 Quantitative Vulnerability Assessment of Systems Software Omar H. Alhazmi Yashwant K. Malaiya Colorado State University Motivation Vulnerabilities: defect which enables an attacker to bypass security measures
where we are, where we could be, how we can get there. 12/14/2011
 Central Plant Optimization ASHRAE National Capitol Chapter - PES Wednesday, Nov 7, 2011 Dave Klee, LEED AP Director, Optimized Building Solutions Johnson Controls, Inc. 1 1 J o http://www.johnsoncontrols.com/cpo
ERS IT Portfolio Report
 Administration and Operations Committee ERS IT Portfolio Report January 21 st, 2014 1 Agenda Information Technology Projects Summary 2013 End of Year Metrics Project Management Office CMERS Website Applications
2
 March 2016 1 2 3 4 5 A. Consumer Confidence Index (CCI) - Consumer Confidence Index (CCI) - Current Economic Condition Index (CECI) - Consumer Expectation Index (CEI) Current Economic Condition Index -
2
 February 2015 1 2 3 4 5 A. Consumer Confidence Index (CCI) - Consumer Confidence Index (CCI) - Current Economic Condition Index (CECI) - Consumer Expectation Index (CEI) Current Economic Condition Index
Pushing the Limits. ADSM Symposium Sheelagh Treweek September 1999 Oxford University Computing Services 1
 Pushing the Limits ADSM Symposium Sheelagh Treweek sheelagh.treweek@oucs.ox.ac.uk September 1999 Oxford University Computing Services 1 Overview History of ADSM services at Oxford October 1995 - started
LOADS, CUSTOMERS AND REVENUE
 EB04-06 Corrected: 0 Jan Page of LOADS, CUSTOMERS AND REVENUE 4 Toronto Hydro s total load, customer and distribution revenue forecast is summarized in Table. The revenue forecast is calculated based on
COURSE LISTING. Courses Listed. with SAP Hybris Marketing Cloud. 24 January 2018 (23:53 GMT) HY760 - SAP Hybris Marketing Cloud
 HY760 - SAP Hybris Marketing Cloud") with SAP Hybris Marketing Cloud Courses Listed HY760 - SAP Hybris Marketing Cloud C_HYMC_1702 - SAP Certified Technology Associate - SAP Hybris Marketing Cloud (1702) Implementation Page 1 of 12 All available
with SAP Hybris Marketing Cloud Courses Listed HY760 - SAP Hybris Marketing Cloud C_HYMC_1702 - SAP Certified Technology Associate - SAP Hybris Marketing Cloud (1702) Implementation Page 1 of 12 All available
DATE OF BIRTH SORTING (DBSORT)
") DATE OF BIRTH SORTING (DBSORT) Release 3.1 December 1997 - ii - DBSORT Table of Contents 1 Changes Since Last Release... 1 2 Purpose... 3 3 Limitations... 5 3.1 Command Line Parameters... 5 4 Input...
DATE OF BIRTH SORTING (DBSORT) Release 3.1 December 1997 - ii - DBSORT Table of Contents 1 Changes Since Last Release... 1 2 Purpose... 3 3 Limitations... 5 3.1 Command Line Parameters... 5 4 Input...
Continuous Monitoring Of Lakes Bloomington and Evergreen Using Buoys
 Lakes After Hours: Continuous Monitoring Of Lakes Bloomington and Evergreen Using Buoys JILL MAYES, TONY ALWOOD AND RICK TWAIT, CITY OF BLOOMINGTON WATER TREATMENT PLANT Why Perform Continuous Monitoring?
Supporting Material for
 Supporting Material for Seasonal Changes in Gaseous Elemental Mercury in Relation to Monsoon Cycling over the Northern South China Sea C.M. Tseng *, C.S. Liu, and C. Lamborg Institute of Oceanography,
Data Transfers in the Grid: Workload Analysis of Globus GridFTP
 Data Transfers in the Grid: Workload Analysis of Globus GridFTP Nicolas Kourtellis, Lydia Prieto, Gustavo Zarrate, Adriana Iamnitchi University of South Florida Dan Fraser Argonne National Laboratory Objective
Data Types. 9. Types. a collection of values and the definition of one or more operations that can be performed on those values
 Data Types 1 data type: a collection of values and the definition of one or more operations that can be performed on those values C++ includes a variety of built-in or base data types: short, int, long,
COURSE LISTING. Courses Listed. Training for Database & Technology with Modeling in SAP HANA. 20 November 2017 (12:10 GMT) Beginner.
 Beginner.") Training for Database & Technology with Modeling in SAP HANA Courses Listed Beginner HA100 - SAP HANA Introduction Advanced HA300 - SAP HANA Certification Exam C_HANAIMP_13 - SAP Certified Application
Training for Database & Technology with Modeling in SAP HANA Courses Listed Beginner HA100 - SAP HANA Introduction Advanced HA300 - SAP HANA Certification Exam C_HANAIMP_13 - SAP Certified Application
AdMob Mobile Metrics. Metrics Highlights. May 2010
 AdMob Mobile Metrics Metrics Highlights May 2010 Metrics Highlights Summary While mobile Internet requests are growing rapidly worldwide, there are regional differences in the devices used 92 countries
Economic Outlook. William Strauss Senior Economist and Economic Advisor Federal Reserve Bank of Chicago
 Economic Outlook Illinois Public Pension Fund Association Hoffman Estates, IL February 16, 217 William Strauss Senior Economist and Economic Advisor Federal Reserve Bank of Chicago GDP expanded by 1.9%
AdMob Mobile Metrics Report
 AdMob Mobile Metrics Report AdMob serves ads for more than 15,000 mobile Web sites and applications around the world. AdMob stores and analyzes the data from every ad request, impression, and click and
Imputation for missing observation through Artificial Intelligence. A Heuristic & Machine Learning approach
 Imputation for missing observation through Artificial Intelligence A Heuristic & Machine Learning approach (Test case with macroeconomic time series from the BIS Data Bank) Byeungchun Kwon Bank for International