Visualization Tools. Interaction. How do people create visualizations? Jeffrey Heer Stanford University
|
|
|
- Nickolas Gilbert
- 5 years ago
- Views:
Transcription

![Today's first task is not to invent wholly new [graphical] techniques,](/docs-images/86/93222266/images/1-1.jpg "though these are needed.")


1 CS448B :: 20 Oct 2011 Interaction Visualization Tools Jeffrey Heer Stanford University How do people create visualizations? Today's first task is not to invent wholly new [graphical] techniques, though these are needed. Rather we need most vitally to recognize and reorganize the essential of old techniques, to make easy their assembly in new ways, and to modify their external appearances to fit the new opportunities. J. W. Tukey, The Future of Data Analysis, Chart Typology Pick from a stock of templates Easy-to-use but limited expressiveness Prohibits novel designs, new data types Component Architecture Permits more combinatorial possibilities Novel views require new operators, which requires software engineering. 1

2 Chart Typologies Excel, Many Eyes, Google Charts Visual Analysis Languages Tableau VizQL, ggplot2, HiVE? Expressiveness Chart Typologies Excel, Many Eyes, Google Charts Visual Analysis Languages Tableau VizQL, ggplot2, HiVE Declarative Encoding Languages Protovis, D3 Expressiveness Efficiency Component Model Architectures Improvise, Prefuse, Flare Graphics APIs OpenGL, Java2D, GDI+, Processing Efficiency Component Model Architectures Improvise, Prefuse, Flare Graphics APIs OpenGL, Java2D, GDI+, Processing Chart Typologies Excel, Many Eyes, Google Charts Visual Analysis Languages Tableau VizQL, ggplot2, HiVE Exploratory Data Analysis Designing Custom Tools and Graphics Declarative Encoding Languages Protovis, D3 Component Model Architectures Improvise, Prefuse, Flare Graphics APIs OpenGL, Java2D, GDI+, Processing Protovis - A Graphical Toolkit for Visualization 2
 - Harder to debug - Self-contained model Specify a scene (nouns) + Quick for static vis -")
3 d3.js Data-Driven Documents Protovis Specialized mark types + Streamlined design - Limits expressiveness - More overhead (slower) - Harder to debug - Self-contained model Specify a scene (nouns) + Quick for static vis - Animation, interaction are more cumbersome D3 Bind data to DOM - Exposes SVG/CSS/ + Exposes SVG/CSS/ + Less overhead (faster) + Debug in browser + Use with other tools Transform a scene (verbs) - More complex model + Dynamic data, animation, and interaction natural Interaction [There is an] apparent challenge that computational artifacts pose to the longstanding distinction between the physical and the social, in the special sense of those things that one designs, builds, and uses, on the one hand, and those things with which one communicates, on the other. Interaction in a sense previously reserved for describing a uniquely interpersonal activity seems appropriately to characterize what goes on between people and certain machines as well. Lucy Suchman, Plans and Situated Actions 3
4 Gulfs of Execution & Evaluation Interaction between people and machines requires mutual intelligibility or shared understanding. Conceptual model Gulfs Evaluation Real world Execution [Norman 1986] Gulf of Execution The difference between the user s intentions and the allowable actions. Gulf of Evaluation The amount of effort that the person must exert to interpret the state of the system and to determine how well the expectations and intentions have been met. Gulf of Evaluation Conceptual model: x,y correlated? Gulf Evaluation Real world: X Y [Norman 1986] 4

5 Gulf of Evaluation Gulf Gulf of Evaluation Gulf Real world: Evaluation 1 Evaluation Real world: Conceptual model: x,y correlated? Y Conceptual model: x,y correlated? ρ = X Gulf of Execution Gulf Gulf of Execution Gulf 1 1 Conceptual model: Draw a scatterplot Y 0.5 Conceptual model: Draw a scatterplot Y X X Real world Real world Execution Move Rotate 35 Pen down Execution 5
 Navigation (pan, zoom, scale, rotate) Selection / Highlighting")

6 Interaction Techniques Are there essential interactive operations for supporting exploratory data visualization? Interaction Techniques Are there essential interactive operations for supporting exploratory data visualization? View Specification (map data to visual vars) Navigation (pan, zoom, scale, rotate) Selection / Highlighting Filtering Sorting Extract Data Interactive Visualization [Graphics and Graphic Information Processing, Bertin 81] 6


![81] 7](/docs-images/86/93222266/images/7-2.jpg)


7 [Graphics and Graphic Information Processing, Bertin 81] [Graphics and Graphic Information Processing, Bertin 81] [Graphics and Graphic Information Processing, Bertin 81] [Graphics and Graphic Information Processing, Bertin 81] 7


8 [Graphics and Graphic Information Processing, Bertin 81] PRIM-9, Tukey, Fisherkeller, Friedman
9 Basic Pointing Methods Pointing Point Selection Mouse Hover / Click Touch / Tap Select Nearby Element (e.g., Bubble Cursor) 9

 Highlighting / Brushing Brushing and Linking Direct attention")
10 Basic Pointing Methods Point Selection Mouse Hover / Click Touch / Tap Select Nearby Element (e.g., Bubble Cursor) Region Selection Rubber-band or Lasso Area Cursors ( Brushes ) Highlighting / Brushing Brushing and Linking Direct attention to a data subset within a graph [Wills 95] 10

 Brushing Scatterplots, Becker &")
![Cleveland 1982 Baseball Statistics [from Wills 95] Linking](/docs-images/86/93222266/images/11-2.jpg "Assists to Positions how long in majors select high salaries")
 distribution of positions")
11 Brushing and Linking Brushing Scatterplots Select ( brush ) a subset of data See selected data in other views The components must be linked by tuple (matching data points), or by query (matching range or values) Brushing Scatterplots, Becker & Cleveland 1982 Baseball Statistics [from Wills 95] Linking Assists to Positions how long in majors select high salaries avg assists vs avg putouts (fielding ability) avg career HRs vs avg career hits (batting ability) distribution of positions played 11


12 GGobi: Brushing Dynamic Queries Query and Results SELECT house FROM palo_alto_homes WHERE price < 1,000,000 AND bedrooms > 2 ORDER BY price Issues 1. For programmers 2. Rigid syntax 3. Only shows exact matches 4. Too few or too many hits 5. No hint on how to reformulate the query 6. Slow question-answer loop 7. Results returned as table 12

 4.")

13 HomeFinder Direct Manipulation 1. Visual representation of objects and actions 2. Rapid, incremental and reversible actions 3. Selection by pointing (not typing) 4. Immediate and continuous display of results [Williamson and Shneiderman 92] FilmFinder FilmFinder [Ahlberg and Shneiderman 94] [Ahlberg and Shneiderman 94] 13

![Attribute Explorer [Spence and Tweedie 98]](/docs-images/86/93222266/images/14-1.jpg "Zipdecode [Fry 04] Video Clip http://benfry.")
14 Alphaslider FilmFinder [Ahlberg and Shneiderman 94] [Ahlberg and Shneiderman 94] Attribute Explorer [Spence and Tweedie 98] Zipdecode [Fry 04] Video Clip 14


15 NameVoyager TimeSearcher [Hochheiser & Shneiderman 02] Based on Wattenberg s [2001] idea for sketch-based queries of time-series data. 3D dynamic queries [Akers et al. 04] 3D dynamic queries [Akers et al. 04] 15
16 Pros and Cons Pros Controls useful for both novices and experts Quick way to explore data Cons Simple queries Lots of controls Amount of data shown limited by screen space Who would use these kinds of tools? Sorting Condition variables location, year Panel variables type, yield Trellis Display [Becker, Cleveland, and Shyu 96] Trellis Display [Becker, Cleveland, and Shyu 96] 16


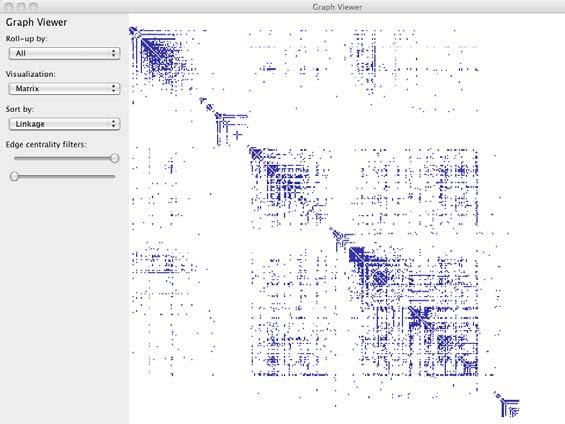
17 Alphabetical ordering Main-effects ordering Node-link Matrix 17


18 Matrix Administrivia Assignment 2: Visual Data Analysis Use visualization software (Tableau) to form & answer questions First steps: Step 1: Pick a domain Step 2: Pose questions Step 3: Find Data Iterate Create visualizations Interact with data Refine your questions Make wiki notebook Keep record of your analysis Prepare a final graphic and caption Due by end of day on Tuesday, October 18 Assign 3: Interactive Visualization Create an interactive visualization application. Choose a data domain and select an appropriate visualization technique. 1. Choose a data set and storyboard your interface 2. Implement the interface using tools of your choice 3. Submit your application and produce a final write-up You may work individually or in groups of 2. Due by end of day on Tuesday, November 2 18

19 Lectures Next Week Tu 10/25 Identifying Design Principles Guest Lecture by Maneesh Agrawala, UCB Th 10/27 Color Lecture by Jason Chuang Generalized Selection Visual Queries Model selections as declarative queries. Visual Queries Model selections as declarative queries over the domain of visualized data. Applicable to dynamic, time-varying data Retarget selection across visual encodings Perform operations on query structure ( lon AND lon )AND( lat AND lat ) 19

20 Generalized Selection Select items like this one. Point to an example and define an abstraction based on one or more properties [Clark, Brennan] Blue like this The same shape as that Abstraction may occur over multiple levels Generalized Selection Provide generalization mechanisms that enable users to expand a selection query along chosen dimensions of interest Expand selections via query relaxation 20
21 Query Builder Click: Select Items (id = China ) Interactor Query Builder Drag: Select Range (2000 < gni AND gni < 10000) AND (.1 < internet AND internet <.2) Legend: Select Attributes (region = The Americas ) Query Visualizer Interactor Query Builder (id = China ) Query Visualizer Interactor Query Builder (id = China ) 21
22 Query Visualizer Interactor Query Builder Query Visualizer Interactor Query Builder (region = Asia ) region IN SELECT region FROM data WHERE (id = China ) (id = China ) Query Relaxer (id = China ) region Query Relaxer Query Relaxation Time Relaxation Generalize an input query to create an expanded selection, according to: 1. A semantic structure describing the data 2. A traversal policy for that structure 22


23 Relaxation using Hierarchies Relax using abstraction hierarchies of the data Traverse in direction of increasing generality Examples A Priori: Calendar, Categories, Geography Data-Driven: Nearest-Neighbor, Clustering Relaxation using Attributes If no explicit semantic structure is available, treat data itself as a flat hierarchy Select all items with matching values along the attributes chosen for relaxation Relaxation of Networks Lesson Consider how the structure and/or semantics of the data might be leveraged to aid analysis. One extension: look beyond data features to incorporate perceptual features of the display. Peaks, valleys, & slopes 23
24 Perceptual Annotation [Kong & Agrawala 09] NHL Goals per Year Summary Most visualizations are interactive Even passive media elicit interactions Good visualizations are task dependent Pick the right interaction technique Consider the semantics of the data domain Fundamental interaction techniques Selection / Annotation, Sorting, Navigation, Brushing & Linking, Dynamic Queries 24
Visualization Tools. Interaction. How do people create visualizations? Jeffrey Heer Stanford University
 CS448B :: 23 Oct 2012 Interaction Visualization Tools Jeffrey Heer Stanford University How do people create visualizations? Today's first task is not to invent wholly new [graphical] techniques, though
Interaction II Maneesh Agrawala Jessica Hullman CS : Visualization Fall 2014 Announcements
 Interaction II Maneesh Agrawala Jessica Hullman CS 294-10: Visualization Fall 2014 Announcements 1 Assignment 3: Visualization Software Create a small interactive visualization application you choose data
INTERACTION IN VISUALIZATION. Petra Isenberg
 INTERACTION IN VISUALIZATION Petra Isenberg RECAP Interaction is fundamental to the definition of visual exploration You have already seen examples for graphs for time series for multi-dimensional data
Potential issues: * Difficulty in coding and/or finding the. * Should I provide more source code? * Others
 Assignment III Potential issues: * Division of the work within the team? * Difficulty in coding and/or finding the network data? * Should I provide more source code? * Others 1 InfoVis Software Toolkit
CSE512 :: 28 Jan Visualization Tools. Jeffrey Heer University of Washington
 CSE512 :: 28 Jan 2014 Visualization Tools Jeffrey Heer University of Washington 1 How do people create visualizations? Chart Typology Pick from a stock of templates Easy-to-use but limited expressiveness
Facet: Multiple View Methods
 Facet: Multiple View Methods Large Data Visualization Torsten Möller Overview Combining views Partitioning Coordinating Multiple Side-by-Side Views Encoding Channels Shared Data Shared Navigation Synchronized
Interactive Data Analysis
 domain specific languages for Interactive Data Analysis Jeffrey Heer Stanford University 1 HTML / CSS Table SELECT customer_id, customer_name, COUNT(order_id) as total FROM customers INNER JOIN orders
Visual Encoding Design
 CSE 442 - Data Visualization Visual Encoding Design Jeffrey Heer University of Washington Review: Expressiveness & Effectiveness / APT Choosing Visual Encodings Assume k visual encodings and n data attributes.
Nobody uploads till yesterday, difficult?
 Survey Result 1 Assignment II! Nobody uploads till yesterday, difficult? 2 Last Week: Text Visualization 3 Interaction IV Course Spring 14 Graduate Course of UCAS April 4th, 2014 4 InfoVis Pipeline Visualization
CSE Data Visualization. Multidimensional Vis. Jeffrey Heer University of Washington
 CSE 512 - Data Visualization Multidimensional Vis Jeffrey Heer University of Washington Last Time: Exploratory Data Analysis Exposure, the effective laying open of the data to display the unanticipated,
Lecture 6: Statistical Graphics
 Lecture 6: Statistical Graphics Information Visualization CPSC 533C, Fall 2009 Tamara Munzner UBC Computer Science Mon, 28 September 2009 1 / 34 Readings Covered Multi-Scale Banking to 45 Degrees. Jeffrey
Visual Encoding Design
 CSE 442 - Data Visualization Visual Encoding Design Jeffrey Heer University of Washington Last Time: Data & Image Models The Big Picture task questions, goals assumptions data physical data type conceptual
CSE Data Visualization. Multidimensional Vis. Jeffrey Heer University of Washington
 CSE 512 - Data Visualization Multidimensional Vis Jeffrey Heer University of Washington Last Time: Exploratory Data Analysis Exposure, the effective laying open of the data to display the unanticipated,
Multi-Dimensional Vis
 CSE512 :: 21 Jan 2014 Multi-Dimensional Vis Jeffrey Heer University of Washington 1 Last Time: Exploratory Data Analysis 2 Exposure, the effective laying open of the data to display the unanticipated,
5. Interaction with Visualizations Dynamic linking, brushing and filtering in Information Visualization displays
 5. Interaction with Visualizations Dynamic linking, brushing and filtering in Information Visualization displays Vorlesung Informationsvisualisierung Prof. Dr. Andreas Butz, WS 20011/12 Konzept und Basis
Interaction. CS Information Visualization. Chris Plaue Some Content from John Stasko s CS7450 Spring 2006
 Interaction CS 7450 - Information Visualization Chris Plaue Some Content from John Stasko s CS7450 Spring 2006 Hello. What is this?! Hand back HW! InfoVis Music Video! Interaction Lecture remindme.mov
Interactive Visualization for Computational Linguistics
 Interactive Visualization for Computational Linguistics ESSLII 2009 2 Interaction and animation References 3 Slides in this section are based on: Yi et al., Toward a Deeper Understanding of the Role of
Perception Maneesh Agrawala CS : Visualization Fall 2013 Multidimensional Visualization
 Perception Maneesh Agrawala CS 294-10: Visualization Fall 2013 Multidimensional Visualization 1 Visual Encoding Variables Position Length Area Volume Value Texture Color Orientation Shape ~8 dimensions?
InfoVis Systems & Toolkits
 Topic Notes InfoVis Systems & Toolkits CS 7450 - Information Visualization February 15, 2011 John Stasko Background In previous classes, we have examined different techniques for presenting multivariate
Interaction 1. Interaction? What do you mean by interaction? CS Information Visualization October 1, 2012 John Stasko
 Interaction 1 CS 7450 - Information Visualization October 1, 2012 John Stasko Interaction? What do you mean by interaction? 2 1 Background Interaction (HCI) = The communication between user and the system
Visualization of EU Funding Programmes
 Visualization of EU Funding Programmes 186.834 Praktikum aus Visual Computing WS 2016/17 Daniel Steinböck January 28, 2017 Abstract To fund research and technological development, not only in Europe but
CS 4460 Intro. to Information Visualization October 18, 2017 John Stasko
 Interaction CS 4460 Intro. to Information Visualization October 18, 2017 John Stasko Learning Objectives Understand how interaction can be used to address fundamental challenges in infovis that cannot
Interaction. Interaction? What do you mean by interaction? CS 4460 Intro. to Information Visualization November 4, 2014 John Stasko
 Interaction CS 4460 Intro. to Information Visualization November 4, 2014 John Stasko Interaction? What do you mean by interaction? 2 1 Background Interaction (HCI) = The communication between user and
Interaction. Interaction? What do you mean by interaction? CS Information Visualization September 21, 2015 John Stasko
 Interaction CS 7450 - Information Visualization September 21, 2015 John Stasko Interaction? What do you mean by interaction? 2 1 Background Interaction (HCI) = The communication between user and the system
InfoVis Systems & Toolkits
 Topic Notes InfoVis Systems & Toolkits CS 7450 - Information Visualization September 24, 2012 John Stasko Background In previous classes, we have examined different techniques for presenting multivariate
Telerik Corp. Test Studio Standalone & Visual Studio Plug-In Quick-Start Guide
 Test Studio Standalone & Visual Studio Plug-In Quick-Start Guide Contents Create your First Test... 3 Standalone Web Test... 3 Standalone WPF Test... 6 Standalone Silverlight Test... 8 Visual Studio Plug-In
Project II. argument/reasoning based on the dataset)
") Project II Hive: Simple queries (join, aggregation, group by) Hive: Advanced queries (text extraction, link prediction and graph analysis) Tableau: Visualizations (mutidimensional, interactive, support
Project II Hive: Simple queries (join, aggregation, group by) Hive: Advanced queries (text extraction, link prediction and graph analysis) Tableau: Visualizations (mutidimensional, interactive, support
CS Information Visualization September 26, 2016 John Stasko
 Interaction CS 7450 - Information Visualization September 26, 2016 John Stasko Learning Objectives Understand how interaction can be used to address fundamental challenges in infovis that cannot be handled
Visualization Re-Design
 CS448B :: 28 Sep 2010 Visualization Re-Design Last Time: Data and Image Models Jeffrey Heer Stanford University The Big Picture Taxonomy task data physical type int, float, etc. abstract type nominal,
Interaction. Interaction? What do you mean by interaction? CS Information Visualization November 4, 2013 John Stasko
 Interaction CS 7450 - Information Visualization November 4, 2013 John Stasko Interaction? What do you mean by interaction? 2 1 Background Interaction (HCI) = The communication between user and the system
Information Visualization
 Information Visualization Text: Information visualization, Robert Spence, Addison-Wesley, 2001 What Visualization? Process of making a computer image or graph for giving an insight on data/information
stanford hci group / cs376 UI Software Tools Scott Klemmer 14 October research topics in human-computer interaction
 stanford hci group / cs376 UI Software Tools Scott Klemmer 14 October 2004 research topics in human-computer interaction http://cs376.stanford.edu cs547 tomorrow: Scott Snibbe Body, Space, and Cinema 2
Data and Image Models
 CSE 442 - Data Visualization Data and Image Models Jeffrey Heer University of Washington Last Week: Value of Visualization The Value of Visualization Record information Blueprints, photographs, seismographs,
Napkin Sketch Visualizations Sketch-Based Authoring of Improvisational Visualizations
 Napkin Sketch Visualizations Sketch-Based Authoring of Improvisational Visualizations William O. Chao wochao@gmail.com Description of Domain Can you think of a time when you wished you could quickly sketch
iplots extreme Next-generation interactive graphics for analysis of large data Simon Urbanek AT&T Labs Statistics Research
 iplots extreme Next-generation interactive graphics for analysis of large data Simon Urbanek AT&T Labs Statistics Research Overview About interactive graphics iplots: next generation - why and how? New
ArtOfTest Inc. Automation Design Canvas 2.0 Beta Quick-Start Guide
 Automation Design Canvas 2.0 Beta Quick-Start Guide Contents Creating and Running Your First Test... 3 Adding Quick Verification Steps... 10 Creating Advanced Test Verifications... 13 Creating a Data Driven
CSE512 :: 4 Feb Animation. Jeffrey Heer University of Washington
 CSE512 :: 4 Feb 2014 Animation Jeffrey Heer University of Washington 1 Why use motion? Visual variable to encode data Direct attention Understand system dynamics Understand state transition Increase engagement
Last Time: Value of Visualization
 CS448B :: 29 Sep 2011 Data and Image Models Last Time: Value of Visualization Jeffrey Heer Stanford University The Value of Visualization Record information Blueprints, photographs, seismographs, Analyze
Input part 3: Interaction Techniques
 Input part 3: Interaction Techniques Interaction techniques A method for carrying out a specific interactive task Example: enter a number in a range could use (simulated) slider (simulated) knob type in
InfoVis Systems & Toolkits
 InfoVis Systems & Toolkits CS 7450 - Information Visualization September 21, 2016 John Stasko Learning Objectives Gain familiarity with history of visualization toolkits Describe what each's new contribution
Interaction. Interaction? What do you mean by interaction? CS 4460/ Information Visualization Feb. 24, 2009 John Stasko
 Interaction CS 4460/7450 - Information Visualization Feb. 24, 2009 John Stasko Interaction? What do you mean by interaction? 2 1 Background Interaction = The communication between user and the system [Dix
Interaction Techniques. SWE 432, Fall 2016 Design and Implementation of Software for the Web
 Interaction Techniques SWE 432, Fall 2016 Design and Implementation of Software for the Web Today What principles guide the design of usable interaction techniques? How can interaction designs help support
Interaction Techniques. SWE 432, Fall 2017 Design and Implementation of Software for the Web
 Interaction Techniques SWE 432, Fall 2017 Design and Implementation of Software for the Web Today What principles guide the design of usable interaction techniques? How can interaction designs help support
Data Analyst Nanodegree Syllabus
 Data Analyst Nanodegree Syllabus Discover Insights from Data with Python, R, SQL, and Tableau Before You Start Prerequisites : In order to succeed in this program, we recommend having experience working
Data Explorer: User Guide 1. Data Explorer User Guide
 Data Explorer: User Guide 1 Data Explorer User Guide Data Explorer: User Guide 2 Contents About this User Guide.. 4 System Requirements. 4 Browser Requirements... 4 Important Terminology.. 5 Getting Started
Data Analyst Nanodegree Syllabus
 Data Analyst Nanodegree Syllabus Discover Insights from Data with Python, R, SQL, and Tableau Before You Start Prerequisites : In order to succeed in this program, we recommend having experience working
Interactive Graphics for Statistics
 Interactive Graphics for Statistics Principles & Examples martin.theus@math.uni-augsburg.de 2 Graphics in Statistics: Diagnostics vs. Analysis Continuous Data 2 Graphics in Statistics: Diagnostics vs.
CSE Data Visualization. Animation. Jeffrey Heer University of Washington
 CSE 512 - Data Visualization Animation Jeffrey Heer University of Washington Why Use Motion? Visual variable to encode data Direct attention Understand system dynamics Understand state transition Increase
We will start at 2:05 pm! Thanks for coming early!
 We will start at 2:05 pm! Thanks for coming early! Yesterday Fundamental 1. Value of visualization 2. Design principles 3. Graphical perception Record Information Support Analytical Reasoning Communicate
Toward a Deeper Understanding of the Role of Interaction in Information Visualization
 Toward a Deeper Understanding of the Role of Interaction in Information Visualization Ji Soo Yi Youn ah Kang John Stasko Julie A. Jacko Georgia Institute of Technology, USA Motivation Infovis = representation
Full Search Map Tab. This map is the result of selecting the Map tab within Full Search.
 Full Search Map Tab This map is the result of selecting the Map tab within Full Search. This map can be used when defining your parameters starting from a Full Search. Once you have entered your desired
Geometric Techniques. Part 1. Example: Scatter Plot. Basic Idea: Scatterplots. Basic Idea. House data: Price and Number of bedrooms
 Part 1 Geometric Techniques Scatterplots, Parallel Coordinates,... Geometric Techniques Basic Idea Visualization of Geometric Transformations and Projections of the Data Scatterplots [Cleveland 1993] Parallel
Interactive Dynamics for Visual Analysis
 Interactive Dynamics for Visual Analysis A taxonomy of tools that support the fluent and flexible use of visualizations Jeffrey Heer, Stanford University Ben Shneiderman, University of Maryland, College
Data Visualization (CIS 468)
") Data Visualization (CIS 468) D3 + Marks & Channels Dr. David Koop Tasks Actions Targets Analyze All Data Consume Trends Outliers Features Discover Present Enjoy Produce Annotate Record Derive tag Attributes
Data Visualization (CIS 468) D3 + Marks & Channels Dr. David Koop Tasks Actions Targets Analyze All Data Consume Trends Outliers Features Discover Present Enjoy Produce Annotate Record Derive tag Attributes
Full Search Map Tab Overview
 FlexMLS Map Server Full Search Map Tab Overview The Full Search Map tab is a need to know module. It is accessible when you use Full Search under Search in the Main Menu tree of FlexMLS. This map can
21. Search Models and UIs for IR
 21. Search Models and UIs for IR INFO 202-10 November 2008 Bob Glushko Plan for Today's Lecture The "Classical" Model of Search and the "Classical" UI for IR Web-based Search Best practices for UIs in
Graph and Tree Layout
 CS8B :: Nov Graph and Tree Layout Topics Graph and Tree Visualization Tree Layout Graph Layout Goals Overview of layout approaches and their strengths and weaknesses Insight into implementation techniques
OnPoint s Guide to MimioStudio 9
 1 OnPoint s Guide to MimioStudio 9 Getting started with MimioStudio 9 Mimio Studio 9 Notebook Overview.... 2 MimioStudio 9 Notebook...... 3 MimioStudio 9 ActivityWizard.. 4 MimioStudio 9 Tools Overview......
Input: Interaction Techniques
 Input: Interaction Techniques Administration Questions about homework? 2 Interaction techniques A method for carrying out a specific interactive task Example: enter a number in a range could use (simulated)
What is a good pen based application? HCI For Pen Based Computing. What is a good UI? Keystroke level model. Targeting
 What is a good pen based application? HCI For Pen Based Computing The windows desktop and browser are NOT good pen based apps! Richard Anderson CSE 481 B Winter 2007 What is a good UI? How do you measure
Human-Computer Interaction. Chapter 2. What is HCI?
 Human-Computer Interaction Chapter 2 What is HCI? Overview 2.1 The Human 2.2 The Computer 2.3 The Interaction Models of Interaction Interaction Styles Elements of the WIMP Interface HCI 2.3.1 Models of
Omeka Collection Viewer. Configuration. Version 3 3/16/2016 Shaun Marsh
 Omeka Collection Viewer Version 3 3/16/2016 Shaun Marsh shaun@ideum.com Configuration 1. Installation Directory The installation directory is located at C:\Program Files (x86)\ideum\omekacollectionviewer.
Data and Image Models
 CSE 442 - Data Visualization Data and Image Models Jeffrey Heer University of Washington Last Time: Value of Visualization The Value of Visualization Record information Blueprints, photographs, seismographs,
INFO216: Advanced Modelling
 INFO216: Advanced Modelling Theme, spring 2017: Modelling and Programming the Web of Data Andreas L. Opdahl Session 6: Visualisation Themes: visualisation data/visualisation types
Panning and Zooming. CS 4460/ Information Visualization April 8, 2010 John Stasko
 Panning and Zooming CS 4460/7450 - Information Visualization April 8, 2010 John Stasko Fundamental Problem Scale - Many data sets are too large to visualize on one screen May simply be too many cases May
Information Visualization In Practice
 Information Visualization In Practice How the principles of information visualization can be used in research and commercial systems Putting Information Visualization Into Practice A Common Problem There
Animation. Why use motion? Volume rendering [Lacroute 95] Cone Trees [Robertson 91]
![Animation. Why use motion? Volume rendering [Lacroute 95] Cone Trees [Robertson 91]](/thumbs/79/80418208.jpg "Animation. Why use motion? Volume rendering [Lacroute 95] Cone Trees [Robertson 91]") CS448B :: 1 Nov 2011 Animation Why use motion? Visual variable to encode data Direct attention Understand system dynamics (?) Understand state transition Increase engagement Jeffrey Heer Stanford University
CS448B :: 1 Nov 2011 Animation Why use motion? Visual variable to encode data Direct attention Understand system dynamics (?) Understand state transition Increase engagement Jeffrey Heer Stanford University
The Semiology of Graphics Pat Hanrahan Stanford University Representations
 The Semiology of Graphics 2 Pat Hanrahan Stanford University Representations Page 1 Number Scrabble [Simon] Given: The numbers 1 through 9 Goal: Pick three numbers that sum to 15 Number Scrabble [Simon]
The Preparing for Success Online Mapping Tool
 The Preparing for Success Online Mapping Tool Baker Polito Administration The Executive Office of Housing and Economic Development and MassGIS Questions & Comments? Please contact MassWorks@state.ma.us
Graph and Tree Layout
 CS8B :: Nov Graph and Tree Layout Topics Graph and Tree Visualization Tree Layout Graph Layout Jeffrey Heer Stanford University Goals Overview of layout approaches and their strengths and weaknesses Insight
Last Time: Data and Image Models
 CS448B :: 2 Oct 2012 Visualization Design Last Time: Data and Image Models Jeffrey Heer Stanford University The Big Picture Nominal, Ordinal and Quantitative task questions & hypotheses intended audience
Week 4: Facet. Tamara Munzner Department of Computer Science University of British Columbia
 Week 4: Facet Tamara Munzner Department of Computer Science University of British Columbia JRNL 520M, Special Topics in Contemporary Journalism: Visualization for Journalists Week 4: 6 October 2015 http://www.cs.ubc.ca/~tmm/courses/journ15
Maple Quick Start. Maplesoft, a division of Waterloo Maple Inc.
 Maple Quick Start Maplesoft, a division of Waterloo Maple Inc. This tutorial is designed to help you become familiar with the Maple environment and teach you the few fundamental concepts and tools you
A Web Application to Visualize Trends in Diabetes across the United States
 A Web Application to Visualize Trends in Diabetes across the United States Final Project Report Team: New Bee Team Members: Samyuktha Sridharan, Xuanyi Qi, Hanshu Lin Introduction This project develops
RITIS Training Module 9 Script
 RITIS Training Module 9 Script Welcome to the Regional Integrated Information System or RITIS Module 09 CBT. To begin, select the start button or press Shift+N on your keyboard. This training module will
CSE 341: Programming Languages
 CSE 341: Programming Languages Winter 2005 Lecture 17 varargs and apply, implementing higher-order functions CSE341 Winter 2005, Lecture 17 1 Today: Some easy Scheme odds and ends Implementing higher-order
The Interaction. Using Norman s model. Donald Norman s model of interaction. Human error - slips and mistakes. Seven stages
 The Interaction Interaction models Ergonomics Interaction styles Donald Norman s model of interaction Seven stages execution user establishes the goal formulates intention specifies actions at interface
AGENDA: Using Gizmos to Modify 3D Models. AutoCAD 3 LECTURE NOTES: CLASS 08. Using Gizmos to Modify 3D Models
 AGENDA: Using Gizmos to Modify 3D Models Using Gizmos to Modify 3D Sub-Objects and Faces 3DArray, Mirror3D, and Align Using Gizmos to Modify 3D Models Gizmos allow us to move, rotate, and scale a set of
QueryLines: Approximate Query for Visual Browsing
 MITSUBISHI ELECTRIC RESEARCH LABORATORIES http://www.merl.com QueryLines: Approximate Query for Visual Browsing Kathy Ryall, Neal Lesh, Tom Lanning, Darren Leigh, Hiroaki Miyashita and Shigeru Makino TR2005-015
CSE Data Visualization. Design Critiques. Jeffrey Heer University of Washington
 CSE 512 - Data Visualization Design Critiques Jeffrey Heer University of Washington Final Project Final Project Design a new visualization system or technique. Many options New system for a chosen domain
This research aims to present a new way of visualizing multi-dimensional data using generalized scatterplots by sensitivity coefficients to highlight
 This research aims to present a new way of visualizing multi-dimensional data using generalized scatterplots by sensitivity coefficients to highlight local variation of one variable with respect to another.
InfoVis Systems & Toolkits. Outline. CS 795/895 Information Visualization Fall Dr. Michele C. Weigle.
 CS 795/895 Information Visualization Fall 2012 InfoVis Systems & Toolkits Dr. Michele C. Weigle http://www.cs.odu.edu/~mweigle/cs795-f12/ Outline! Graphing tools! Visualization systems! built-in visualizations!
Developing a Power Point Presentation
 Load Power Point 1 Select Blank Presentation (figure 1) 2 Select New Slide (figure 2) First slide is the title page. Select First Box as shown in figure 2. Figure 1 Figure 2 3 Add Title and Subtitle (figure
Designed by Jason Wagner, Course Web Programmer, Office of e-learning NOTE ABOUT CELL REFERENCES IN THIS DOCUMENT... 1
 Excel Essentials Designed by Jason Wagner, Course Web Programmer, Office of e-learning NOTE ABOUT CELL REFERENCES IN THIS DOCUMENT... 1 FREQUENTLY USED KEYBOARD SHORTCUTS... 1 FORMATTING CELLS WITH PRESET
TableLens: A Clear Window for Viewing Multivariate Data Ramana Rao July 11, 2006
 TableLens: A Clear Window for Viewing Multivariate Data Ramana Rao July 11, 2006 Can a few simple operators on a familiar and minimal representation provide much of the power of exploratory data analysis?
Lesson for levels K-5 Time to complete: min
 Lesson Plan: Lesson for levels K-5 Time to complete: 45-90 min Lesson Plan: Level: Grades K-5 (ages 5-10) Time to complete: ~45-90 minutes Learn how to build basic geometry, apply materials, and import
Data and Image Models
 CSE 512 - Data Visualization Data and Image Models Jeffrey Heer University of Washington Last Time: Value of Visualization The Value of Visualization Record information Blueprints, photographs, seismographs,
LECTURE 3 ADMINISTRATION SECTION -A
 LECTURE 3 SYSTEM PROGRAMMING & SYSTEM ADMINISTRATION SECTION -A INTRODUCTION Interpreters Compilers Text editors Debug monitors Programming environment INTERPRETERS An interpreter may be a program that
COS 116 The Computational Universe Laboratory 10: Computer Graphics
 COS 116 The Computational Universe Laboratory 10: Computer Graphics As mentioned in lecture, computer graphics has four major parts: imaging, rendering, modeling, and animation. In this lab you will learn
Interactive Visualization of the Stock Market Graph
 Interactive Visualization of the Stock Market Graph Presented by Camilo Rostoker rostokec@cs.ubc.ca Department of Computer Science University of British Columbia Overview 1. Introduction 2. The Market
Data Driven Guides: Supporting expressive design for Information graphics
 Data Driven Guides: Supporting expressive design for Information graphics Nam Wook Kim Eston Schweickart Zhicheng Leo Liu Harvard Cornell Adobe Mira Dontcheva Wilmot Li Jovan Popović Hanspeter Pfister
Mobile: OneNote. Microsoft Quick Start ITS (2017)
") Mobile: OneNote Microsoft Quick Start ITS (2017) Quick Start Guide We ve created a mobile version of OneNote for your Windows 10 tablet. Use this guide to learn the basics. Explore commands on the ribbon
Mobile: OneNote Microsoft Quick Start ITS (2017) Quick Start Guide We ve created a mobile version of OneNote for your Windows 10 tablet. Use this guide to learn the basics. Explore commands on the ribbon
To create a notebook on desktop version 1. Open One Note 2. File > New. o FILE. Options
 OneNote Training When you open OneNote for the first time there will be notebooks already started and you can see them on the left hand side. There is an introduction section that you can go through, if
1. AUTO CORRECT. To auto correct a text in MS Word the text manipulation includes following step.
 1. AUTO CORRECT - To auto correct a text in MS Word the text manipulation includes following step. - STEP 1: Click on office button STEP 2:- Select the word option button in the list. STEP 3:- In the word
A Top-Down Visual Approach to GUI development
 A Top-Down Visual Approach to GUI development ROSANNA CASSINO, GENNY TORTORA, MAURIZIO TUCCI, GIULIANA VITIELLO Dipartimento di Matematica e Informatica Università di Salerno Via Ponte don Melillo 84084
cs6964 February TABULAR DATA Miriah Meyer University of Utah
 cs6964 February 23 2012 TABULAR DATA Miriah Meyer University of Utah cs6964 February 23 2012 TABULAR DATA Miriah Meyer University of Utah slide acknowledgements: John Stasko, Georgia Tech Tamara Munzner,
Search Results Tabs. List Tab Options
 Search Results Tabs The Search Results screen is sectioned by tabs. These tabs contain information and tools that are vital in how you configure listing information to package and sell to your clients.
Windows Movie Maker lets you edit videos from video and photo files. It is free from Microsoft.
 Getting Started with Windows Movie Maker Windows Movie Maker lets you edit videos from video and photo files. It is free from Microsoft. Start a project To start, you will need to import photos or video
UI Toolkits. HCID 520 User Interface Software & Technology
 UI Toolkits HCID 520 User Interface Software & Technology http://www.cryptonomicon.com/beginning.html Xerox Alto 1973 Evolution of User Interfaces Command Line (UNIX shell, DOS prompt) Interaction driven
Interactive Dynamics for Visual Analysis
 doi:10.1145/2133806.2133821 Article development led by queue.acm.org A taxonomy of tools that support the fluent and flexible use of visualizations. By Jeffrey Heer and Ben Shneiderman Interactive Dynamics