<Insert Picture Here> BI Design Best Practices Nicolas Barasz - Oracle BI EPM Product Assurance April 2012
|
|
|
- Kelley Hamilton
- 5 years ago
- Views:
Transcription


1 <Insert Picture Here> BI Design Best Practices Nicolas Barasz - Oracle BI EPM Product Assurance April 2012
2 Agenda Oracle BI Principles Repository design best practices Dashboards and reports design best practices 10g Upgrade considerations
3 Oracle BI Principles Oracle BI Server is a SQL generator!! To see if an OBI implementation is good, first look at the physical SQL queries executed: is it right (provide good results)? Is it as simple as possible, is it optimized? End-users do not see physical SQLs, so they do not care about it. Very often, developers do not really look at them because it is just something "automatically generated" (until they have big problems). DBAs do not really look at their structure because developers say that it cannot be modified. This is how the product works, we cannot change it
4 Oracle BI Principles The quality of physical SQL queries is the most important part of Oracle BI. Everything depend on it.
5 Oracle BI Principles What are the three main objectives of any Oracle BI application?
6 Oracle BI Principles Ordered by priority: 1. Get Correct Results. 2. Get Results Fast. 3. Get Results Easily.
7 Oracle BI Principles Get Correct Results This looks obvious but very often this objective is not achieved due to errors in RPD configurations. End-users can get wrong results for years without noticing anything. Look at physical SQL queries to identify potential issues (missing or additional filter, an additional table that should not be included )
8 Oracle BI Principles Get Results Fast Often business users do not have clear expectations. They want acceptable performance. Most of the time performance is not the main focus of developers when a project is started. They only pay attention to this objective at the end of the implementation, or when they are in front of a big problem. It is useless to have a great presentation if each click takes 2 minutes. Performance must be a permanent concern from the beginning of the design of the project until the production roll-out.
9 Oracle BI Principles Get Results Easily Navigation, graphs, hierarchies, report format... Everybody (end-users and developers) focus on that part. That's the main cause of failure/big troubles for many projects. Developers should always keep the performance impact in mind when discussing the presentation with business users.
10 Oracle BI Principles Performance should always be before presentation in term of priority. It is possible to accept sacrifices on presentation during the design of the project. But when the implementation is over, it is extremly difficult to explain to users that they have to give up the presentation because of performance issues. Focus on performance from day 1
11 Agenda Oracle BI Principles Repository design best practices Dashboards and reports design best practices 10g Upgrade considerations
12 Agenda Oracle BI Principles Repository design best practices Physical Layer Business Model Presentation Layer Dashboards and reports design best practices 10g Upgrade considerations

13 Opaque Views Push the SQL statement as a sub select to the main SQL generated from the query All tables used in opaque view definition are always queried together, even if some of them are not really necessary. Should be used as a last resort only. For instance when variables must be included in SQL with multiple levels of aggregation.
14 Opaque Views When possible, replace the view by aliases of the corresponding physical tables. Filters may be applied in logical table sources or in physical joins. Or create a physical table instead, loaded in the ETL process Or create a materialized view (in RPD, materialized views should be created as normal physical tables)


15 Create Aliases for all tables Create Aliases for all tables and prefix their names with text that reflects the type of table e.g. Dim_, Fact_ or Fact_Agg. Create joins between the Alias tables, not the master ones. Original tables VS Aliases

16 Avoid Circular Joins Circular joins may have a big impact on data integrity. They can always be avoided by creating aliases.

17 Connection Pool Configuration Use native database drivers instead of ODBC. Set the maximum number of connections high enough. Recommendation is to set it to 10-20% of concurrent users multiplied by number of queries executed on a dashboard page. Note that due to usage of expandable hierarchies, the number of queries executed in parallel in 11g is often greater than in 10g. Use a separate connection pool for initialization blocks.

18 Database Features Depending on your configuration, you may enable some parameters in database feature: PER_PREFER_MINIMAL_WITH_USAGE: Enable this parameter if your database optimizer cannot handle properly WITH clause, for instance on database Oracle 10g. PERF_PREFER_INTERNAL_STITCH_JOIN: This parameter may sometimes be enabled to work around database optimizer bugs. Note that it may increase significantly the workload on BI Server. It is usually not recommended.
19 Database Features PERF_PREFER_SUPPRESS_EMPTY_TUPLES: This is for Essbase only. If enabled, instead of applying non empty on the axis, which may contains a very sparse set. Each cross-join of two dimensions will have empty tuples suppressed before crossjoining another dimension.


20 Log Level In production environment, set BI Server log level to 0. When there is a lot of reports running in parallel, query logging may cause performance issues.

21 Query Limits A user who has access to Answer can significantly slow down the BI Server and the database with a bad report that extracts millions of records. To prevent that, enable query limits. If there is no specific users requirement, use rows and 1h as a starting point.
22 Agenda Oracle BI Principles Repository design best practices Physical Layer Business Model Presentation Layer Dashboards and reports design best practices 10g Upgrade considerations
23 Business Model Design OLAP OLTP Dimensions Facts ODBC CSV XML

24 Business Model Design Logical star-schemas only: No snow-flaking! Only one exception: BM for Siebel Marketing list formats.


25 Dimension Sources per Level Create a logical table source in the dimension at each level that matches the level of a fact LTS. It was recommended in 10g, but it is mandatory in 11g.
26 Logical Tables Use a separate dimension logical table for each dimension don t combine/merge them into one The same goes for facts, we don t want to end up with a single fact logical table called Facts Stuff! Have a separate logical table for Compound facts (which combine facts together from multiple LTS) Prefix logical table names with either: Dim Fact Fact Compound

27 Logical Table Columns Try assigning business columns as dimension primary keys. Rename logical columns to use presentation names Keep only required columns.
28 Logical Table Columns You should not assign logical primary keys on fact logical tables Create dummy measures to separate out facts into various groups if need be Make sure almost every fact logical column has an aggregation rule set.

29 Level Keys The primary key of each level must always be unique The primary key of the lowest level of the hierarchy must always be the primary of the logical table
 has a high cost on performance on the database.")
30 Count(distinct) Whenever it is possible, replace it by Count(). Count(distinct) has a high cost on performance on the database. If there are multiple LTS, the aggregation rule must be specified for each LTS.
31 Base Measure, Case when, Filter Using Users want to filter the values for a measure. For instance they want number of opened and closed service requests. There are multiple ways to do that. But each option has consequences

32 Base Measure, Case when, Filter Using First approach: use the base measure with filters in the report
33 Base Measure, Case when, Filter Using Second approach: use case when statement in the Logical Table Source
34 Base Measure, Case when, Filter Using Third approach: use Filter Using statement in the logical column
35 Base Measure, Case when, Filter Using Solution Benefits Downside Rank Base Measure -Flexible -Perfectly Optimized -Good for users education -Cannot be always used, depending on report configuration 1 Should be used most of the time Case When -Simple physical query -Always works -No automatic where clause. -Need filters in reports for good performance 2 Should be used from time to time Filter Using -Where clause added automatically -Where clause quickly becomes HUGE 3 Should be used rarely
36 IndexCol Sometimes the formula or columns used vary depending on a session/presentation variable. If you use a «case when» statement then the entire formula is pushed to the physical query. But by using function IndexCol only the required column/expression is pushed to the database. Combined with the new 11g features in prompts (allow selection in a list of custom values), it allows users to modify very significantly reports structure without any increased cost on performance. This function can be used in the RPD or directly in reports. INDEXCOL( CASE VALUEOF(NQ_SESSION."PREFERRED_CURRENCY") WHEN 'USD' THEN 0 WHEN 'EUR' THEN 1 WHEN 'AUD' THEN 2 END, "01 - Sample App Data (ORCL)".""."BISAMPLE"."F19 Rev. (Converted)"."Revenue_Usd", "01 - Sample App Data (ORCL)".""."BISAMPLE"."F19 Rev. (Converted)"."Revenue_Eur", "01 - Sample App Data (ORCL)".""."BISAMPLE"."F19 Rev. (Converted)"."Revenue_Aud")
37 Missing Dimensional Hierarchies Always create a dimension hierarchy for all dimensions, even if there is only one level in the dimension. BI Server may need it to select the most optimized Logical Table Source. It may be useful when BI Server performs a join between two results sets, when two fact tables are used in a report. It is necessary for level-based measures.

38 Missing Dimensional Hierarchies Always configure drill-down, even if there is only one level in the dimension. It may be useful for instance to drill-down from contact type to contact name. Always specify the number of elements per level. BI Server will use it to identify aggregate tables and mini dimensions. It does not need to be accurate, a rough estimate is fine.

39 Content Level Always specify the content level in all logical table sources, both in facts an dimensions. It will allow BI Server to select the most optimized LTS in queries. It will help consistency checker finding the issues in RPD configuration, preventing runtime errors.


40 Implicit fact Set up an implicit fact column for each presentation folder. It prevents users from getting wrong results if they create a report without fact column. Use a constant as the implicit fact column to optimize performance

41 Canonical Time Dimension Each Business Model should include a main time dimension connected to almost all fact tables. This is necessary for reports that includes multiple facts. It is also much easier for end-users than having a time dimension per fact table.

42 Mini-Dimensions Mini-dimension tables include combinations of the most queried attributes of their parent dimensions. They must be small compared to the parent dimension, so they can include only columns that have a relatively small number of distinct values.
43 Mini-Dimensions Mini-dimensions are joined both to main fact table and to aggregate tables.
44 Mini-Dimensions They improve query performance because BI Server will often use this small table instead of the big parent dimension. They increase the usage of aggregate tables. Due to the level of aggregation, aggregate tables cannot be joined to the parent dimension. But they can be joined to the mini-dimension instead. It allows reports to use the aggregate table even if they use some columns from the corresponding dimension.

45 Consistency Check Manager Fix almost all errors, warnings, and best practices detected by consistency check manager. If there is a message, it means that there is something wrong in the configuration. It will have consequences, even if there is no problem on the first reports. When there are too many messages, it is difficult to see which ones are important.
46 Agenda Oracle BI Principles Repository design best practices Physical Layer Business Model Presentation Layer Dashboards and reports design best practices 10g Upgrade considerations

47 Simple Presentation Folders Small presentation folders are easier to understand and to manipulate. Try to limit the number of fact tables, keep the ones that have a lot of common dimensions and are linked from a business perspective. Configure presentation folders specific to each type of user.
48 Canonical Time Dimension The canonical time dimension should always be the very first presentation Table Secondary time dimensions can be given their own presentation tables further down
49 Homogeneous Presentation Folders List the dimension presentation tables first, starting with the canonical time dimension. Place the measures/facts at the bottom. Do not mix dimension and fact columns in the same presentation Table Naming of presentation tables/columns should be consistent across all folders. This is very important, otherwise prompts values cannot be retrieved when you navigate from one report to another report based on another presentation folders. Make it easy to distinguish between dimensions and facts.
50 Object Descriptions Add descriptions to presentation folders to explain the purpose of each folder within Answers Add descriptions to presentation tables and columns so that they appear in Answers when users roll-over them with the mouse. For each column, explain the data content with for instance calculation formula...
51 Global Recommendations To satisfy all your drill-down requirements, you don t need to have all your reporting objects in a single Subject Area / Presentation Folder For example, if you want to drill from a summary Orders report down to Order Item level, you don t need to create a single Subject Area that contains both Order and Order Item objects You can start by creating a report against the Orders Subject Area and then you can drill-down to another report defined against Order Items Subject Area You just need to ensure the Presentation Table/Column names that are being prompted have the same names in both Subject Areas If the Presentation Table/Column names aren t the same then use Aliases to make them the same!
52 Agenda Oracle BI Principles Repository design best practices Dashboards and reports design best practices 10g Upgrade considerations
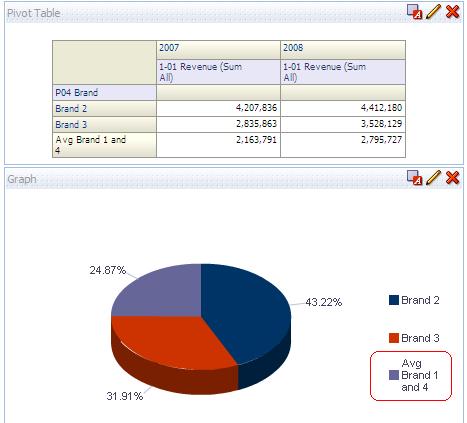
53 Override Default Aggregation Rule It is possible to improve performance by overriding the default aggregation rule for a column in reports when: The aggregation rule for all metrics used in this column s formula is SUM AND although a formula is applied on this/these metric(s), it is still possible to aggregate the global formula using a SUM AND there are multiple levels of aggregation in the report, like multiple views or totals/sub-totals In this case, overriding the default aggregation rule will reduce the number of physical queries executed.
. There is a pivot table with a total.")
54 Override Default Aggregation Rule In the following example, the formula used for the metric is ifnull(revenue,0). There is a pivot table with a total. Note that the aggregation used in the logical sql is REPORT_AGGREGATE
55 Override Default Aggregation Rule Note the two sub-queries included in the physical SQL:


56 Override Default Aggregation Rule Next, let s override the aggregation rule:

57 Override Default Aggregation Rule The logical SQL now shows REPORT_SUM:
58 Override Default Aggregation Rule The physical SQL now includes only one query:


59 Delete Unused Views Each view may have a cost on performance, upgrade, and maintenance, even if it is not included in compound layout. Delete all unused views, including table views.

60 Excluded columns Delete columns that are excluded from all views They increase the volume of data retrieved They make BI Server computing results at multiple levels of aggregation, impacting resources needed both on database and BI Server They may have an impact on results when using complex aggregations.
61 Default values in Dashboard prompts Put a default value in dashboard prompts. If you know what users will select most often, use it as the default value. If you do not know, then put a dummy value so that the report does not return anything. If necessary customize the «no result» view to tell users to select a value in prompt. There is nothing worse than executing a useless long query that returns all data from the database because there is no default filter. It costs a lot of resources both on the database and on BI Server.
62 Hierarchies and attribute columns Never mix hierarchies and attribute columns of the same dimension in a report. This leads to misunderstandings and unexpected behaviors, in particular when hierarchical prompts are used. Note that selection steps generated by hierarchical prompts apply on hierarchies only, not on attribute columns. Adding filters on attribute columns works fine though, even if you use the hierarchy in the report. But do not include the attribute column in the columns selected.

63 Hierarchies and attribute columns
64 Groups and Calculated Items It is important to understand the differences between two types of selection steps: groups and calculated items. Performance considerations Calculated items are computed on presentation server. They are executed on the (normally small) result set retrieved from BI Server. Usually they do not have any impact on performance. Groups are computed on the database. They generate additional logical and physical queries. They have a significant impact on resources required on the database, and therefore on global performance.

65 Groups and Calculated Items Functionality perspective Calculated items formula are exactly applied on result set as they are. Aggregation rules used to compute the metrics on BI Server are not considered. Groups generate a query with a filter based on members selected. Aggregation rules are applied on BI Server as usual.

66 Filter or Selection Step? Applying filters in reports may seem similar to selection steps. But is it really the same? Let s study an example:


67 Filter or Selection Step? Looking at a simple table, it seems identical:

68 Filter or Selection Step? But see what happens when columns are removed from tables:
69 Filter or Selection Step?
70 Filter or Selection Step? Filters: Are always applied on all views. Selection Steps: Are applied only if the corresponding column is included in the view. May generate additional logical and physical queries.
71 General reports best practices Avoid using a filter based on another report. Use sub-totals and grand-totals only if necessary. Each total means an additional level of aggregation and has an impact on performance. Do not show more than 6 reports per page (depending on the performance of the reports). Do not put too many pages per dashboard, all pages should be visibles.
72 General reports best practices Do not overuse dashboard conditions, it has a cost on performance. Dashboard should be as interactive as possible: column selectors, drill-down, guided navigation Interactivity is one of the best assets of Oracle BI. Use it. Do not overuse the new expandables hierarchies as they tend to generate many physical queries. At least one query is necessary for each level shown, more if multiple fact LTS are used.
73 Agenda Oracle BI Principles Repository design best practices Dashboards and reports design best practices 10g Upgrade considerations
74 10g Upgrade considerations There are many modifications on existing functionalities and algorithms between 10g and 11g. Depending on the configuration, these modifications may change significantly the results in reports. They may impact both data and format of the report. The list of examples mentioned here is NOT exhaustive.

75 Calculated Items In 10g, calculated items were created in one pivot table only. In 11g, all calculated items are shown in all views. The format of the report is modified: columns that were in one pivot table only before the upgrade now appear in all views. If a calculated item had the option Hide details selected, showing this column in other views changes completely the results.

76 Calculated Items

77 Calculated Items To replicate 10g behavior in 11g, you must: Add a new column identical to the one used to compute the calculated item. In all views except in the one that includes the calculated item, replace the old column by the new one.
78 Calculated Items To identify 10g reports with Calculated Items and option «hide details» selected, you can run a basic search in all 10g catalog files (*. To select reports files only). To identify all reports with calculated items, search for string: calcitem To identify reports with calculated items and option hide details selected, search for: hidedetails="true

79 Report-Based Totals This option did not work in 10g and is fixed in 11g. It is selected by default. It may change significantly the values. 11g values are often better than 10g, but not always Depending on the report, it may be hard to explain the results to users. It may be removed from tables and pivot tables, but not from charts.

80 Report-Based Totals What really does Report-Based Total option?
81 Sort Orders Sort orders in 11g are very often different from 10g. In 11g, sort defined in criteria tab is not necessarily applied to pivot tables, especially if the column sorted in criteria tab is excluded from the pivot table. The sort order has to be defined in the pivot table itself. Note that when the column that you want to use to sort is not in the pivot table, you have to add it, apply the sort, and then hide the column.
82 Sort Orders A 10g bug is fixed when a sort key is created in RPD configuration (example: month name, sorted by month number). In 10g, this sort is applied only if the sort column is included in the report. But the sort order is defined on the RPD, so it should not be required to add an additional column in your report to apply the sort order. In 11g, even if the sort column is not included in your report, the sort key defined in RPD is still applied.
83 Sort Orders In some circumstances, the sort order defined in 10g was not applied properly. For instance you select the sort order Ascending, and instead result is sorted in descending order. Users in 10g automatically adapted their sort orders in reports often without even noticing the issue, just by looking at results. This is fixed in 11g. So sometimes, in the report definition the sort order is Descending, in 10g the results are sorted Ascending, in 11g the results are sorted Descending.
84 Sort Orders Sort in Graph: In 11g it is not possible to sort data in a graph using a column that is not included in the view. You have to add the column in the view (it can be hidden) to apply the sort order defined on this column.
85 Total with Union/Running Aggregates When a result set is computed with multiple queries (UNION) or with running aggregates (MAVG, MSUM, RSUM, RCOUNT, RMAX, RMIN), 11g does not apply any default aggregation rule for totals. The aggregation rule must be specified manually in tables/pivot tables. This is necessary for totals, sub-totals, or when some columns are excluded from the view.

86 Generated SQL The SQL generation in 11g is different from 10g. The objective is to get more optimized SQL in 11g. However this may lead to differences in results if the RPD configuration or tables content is not consistent. 10g 11g
87 Analyzing Catalog Upgrade Logs The main log for catalog upgrade is $MW_HOME/instances/instance1/diagnostics/logs/OracleBIPresentationS ervicescomponent/coreapplication_obips1/webcatupgrade0.log In this log file, search for keyword «error». Do not pay attention to other messages. For each error/warning there is a global error message with the path of the object (report, ibot ). Next there is the XML of the object before/after upgrade. The «after upgrade» XML is available only for warnings. After that, there is a detail error message describing the issue.
88 Analyzing Catalog Upgrade Logs Datatype error: Type:InvalidDatatypeValueException, Message:Value ' ' must be greater than or equal to MinInclusive '0 The segment count has an invalid value. Required attribute guid was not provided: The ibot has been upgraded, but some of the recipients are not found in the list of users available in the authentication source. Check if the user is still able to authenticate, and if not, delete him from the webcat.
89 Analyzing Catalog Upgrade Logs No character data is allowed by content model: Report XML is invalid and should be fixed. Remove the unwanted characters. There are many different error messages about invalid XML. Note that very often, it is faster to delete/recreate the report in 10g or in 11g than to spend a lot of time trying to fix the XML error.
90 Graph Engine The software used for the graph engine in 11g is not the same as the one in 10g. Although the upgrade process tries to match as much as possible the graph properties selected in 10g with the ones available in 11g, a number of differences have to be expected. 11g graph engine has some new options that were not available in 10g, and some options that existed in 10g are not available anymore.
91 Zoom to Data Range There are new zoom options available in 11g. But the option zoom to data range that was available in 10g does not exist anymore in 11g. It is possible however to get a similar behavior by modifying global parameters. But then the option will be applied to all graphs. It is not possible in to select this option for one report only. To apply this global option, modify the following file in the current style path. For instance: $MW_HOME/Oracle_BI1/bifoundation/web/msgdb/s_blafp/viewui/chart/dvtgraph-skin.xml
92 Zoom to Data Range 10g 11g
93 Zoom to Data Range <Graph> <SliceLabel> <!-- decimaldigitused is false here so that non-percentage pie slices do not pick up this value The DVTChartProcessor sets decimaldigitused to true if this is a percentage pie slice --> <ViewFormat decimaldigit="2" decimaldigitused="false"/> </SliceLabel> <Y1Axis axisautoscaledfromzero="false"/> <Y2Axis axisautoscaledfromzero="false"/> </Graph>
94 Graph Engine, Miscellaneous The ranges for the numeric axis labels in graphs have changed from 10g to 11g due to a different automatic axis range calculation engine. Hidden columns used for labels in 10g are not displayed in 11g. If you have a column that is used as the label for a graph, but the column is hidden from the graph, then in 11g, the labels are not displayed. Some axis labels might be skipped as a result of the automatic label layout algorithm in use for 11g. The option that prevented skipping labels in 10g does not exist in 11g. It is possible to see all labels by modifying the size of the graph and labels.


95 Graph Engine, Miscellaneous 10g 11g
96 Graph Engine, Miscellaneous You cannot rotate graph labels for the y-axis other than 0-90 or -90. You cannot perform 45-degree rotations. In 10g, graphs do not always honor criteria-level formats or other global data formats for columns. Data labels and numeric axis labels do not consistently follow this formatting. This issue has been addressed in 11g. In 10g, pie graphs display absolute values, including negative values. Negative values are interpreted as positive values and those slices are displayed. In 11g, slices are not displayed for negative values. When all the values are negative, the graph is not displayed. In 11g, the legend is displayed for negative values.
97 Graph Engine, Miscellaneous When a stacked bar graph is upgraded from 10g to 11g, the order or position of the series might change. However, the legend view is upgraded without any change. This might cause a mismatch between the legend that is displayed in the legend view and the color that is displayed in the graph. To resolve this, either change the color in the graph or update the legend to match the color in the graph. In addition, the stacking order in the bar graph changes when you include a column in Vary Color By. For other cases, the order and coloring is maintained. The legend is incorrect or mismatched when you specify conditional formatting on the column in Vary Color By.
98 Default number of rows In 10g the number of rows displayed was limited only in table view. In 11g this number of rows is limited in all views. Some parameters in instanceconfig.xml allow you to change this limit. Number of records that can be exported is limited as well. There is a parameter available in EM to set the maximum number of rows exported. But this does not override the maximum number of rows per view. So both parameters (MaxVisibleRows per view and global export limit) have to be modified.
99 Default number of rows
100 Font weight and alignment If the font is not explicitly set, then it relies on the setting of the nearest ancestor element in HTML that has font size specified. Then the behavior of the font is nondeterministic and since if the parent element changed between 10g and 11g, this is impacted. For instance, the following text is in a dashboard page: <span style="font-weight: bold;">multi-segments choice</span> In 10g, its closest ancestor element is (8pt) but now in 11g, it is 9pt. Thus you see the fonts in 9pt size. The solution is to add : font-size:8pt in the span so that it won't be affected by changes made to the framework.
101 Hidden but included data is not displayed In 10g, if a column is hidden but included in a pivot table, the data is displayed in the pivot table. In 11g, if the column is hidden at the criteria level, then the data is not displayed
102 ibots => Agents Options available in 11g agents are significantly different from 10g ibots, in particular for script management. So scripts options on 10g ibots are not available after the upgrade. They can still be executed, be cannot be modified. A new agent must be created in 11g if you need to modify these options.
103 Multiple column selectors In 10g, column selectors included just a list of columns selected. In 11g however, column selectors also include the properties of each column available. If multiple column selectors include the same column they may be in conflict with each other after the upgrade. Whenever possible, merge all column selectors to keep only one per report before the upgrade. If not possible, make sure at least that the same column is not included in two column selectors.
104 Upgrading one report only Note that it is possible to upgrade just one single report. This can be very useful for testing or to maintain consistency between 10g and 11g environments. To upgrade one report, copy/paste the XML from Advanced tab in Answer from one environment to the other. When the XML is applied in 11g environment, it is upgraded automatically.
105 Spaces in Column Names In 10g, when a column had leading or trailing spaces it created a warning in consistency checker. In 11g, this is considered as an error. So it is mandatory to remove all leading and trailing spaces from columns. The main impact is that all reports using these columns have to be modified. The easiest solution is to use a simple text Search&Replace tool that can search and replace in multiple files at the same time. Just identify the column s previous name in a report XML and replace it by the new one.
106 Clean 10g Catalog A number of issues during catalog upgrade are caused by obsolete elements that should be deleted Unused Views: pivot tables may include calculated items. Even if the views are obsolete and are not included in compund layout, calculated item will be propagated to all other views during the upgrade. Delete all unused pivot table views before the upgrade. Obsolete Reports: old catalogs usually include many reports that are not used anymore. These reports may include errors that will have to be analyzed and fixed during the upgrade. The number of reports also impact the duration of the upgrade. Delete obsolete reports.
107 Clean 10g Catalog Old Users: error messages will appear during catalog upgrade for each user in the catalog who cannot be authenticated anymore. These users folders cannot be upgraded. They also increase upgrade duration significantly. Delete old accounts before the upgrade. As described in other slides, a number of reports have to be modified so that their behavior will not change in 11g. To reduce the duration of the freezing period (time between the last catalog extract from 10g and the 11g production roll-out), do as many modification as possible in 10g before the upgrade.
108 UA or Manual Catalog Upgrade The upgrade assistant copies the catalog first before starting the upgrade process. For big catalogs, a number of problem may happen during this phase (not enough space, network issue ). Even if the copy fails, the upgrade will start. It is possible to copy the catalog and start the upgrade process manually instead.
109 UA or Manual Catalog Upgrade Copy 10g catalog to a new location on 11g Server Stop 11g Presentation Server Update 11g catalog location using Enterprise Manager Add/Modify these flags to instanceconfig.xml: <Catalog> <UpgradeAndExit>true</UpgradeAndExit> </Catalog> Start Presentation Server This will upgrade the catalog and shutdown automatically Remove the flag true from the instanceconfig.xml Start Presentation Server again
Copyright 2010, Oracle. All rights reserved.
 Agenda Interactive Dashboards Master-Detail Linking New Prompt Controls Pivot Table Interactions Enhanced Dashboard Builder Analysis Editor Overview Working with the analysis editor step by step Praxisteil
Oracle 1Z0-620 Exam Questions & Answers
 Oracle 1Z0-620 Exam Questions & Answers Number: 1Z0-620 Passing Score: 800 Time Limit: 120 min File Version: 35.7 http://www.gratisexam.com/ Oracle 1Z0-620 Exam Questions & Answers Exam Name: Siebel7.7
Oracle Business Intelligence Icon Definitions
 Oracle Business Intelligence Icon Definitions Version 1.0 JANUARY 14, 2015 OHIO UNIVERSITY Table of Contents Icon Definitions...2 1.1 Catalog Definitions for Report Consumers (ability to run reports)...2
OBIEE. Oracle Business Intelligence Enterprise Edition. Rensselaer Business Intelligence Finance Author Training
 OBIEE Oracle Business Intelligence Enterprise Edition Rensselaer Business Intelligence Finance Author Training TABLE OF CONTENTS INTRODUCTION... 1 USER INTERFACE... 1 HOW TO LAUNCH OBIEE... 1 TERMINOLOGY...
1Z0-526
 1Z0-526 Passing Score: 800 Time Limit: 4 min Exam A QUESTION 1 ABC's Database administrator has divided its region table into several tables so that the west region is in one table and all the other regions
Introducing V3 Analytics A U G U S T
 Introducing V3 Analytics A U G U S T 2 0 1 7 Table of Contents Document Versioning 2 Introduction 3 Terminology 3 Analytics Platforms: V1 Analytics versus V2 Analytics versus V3 Analytics 3 Schedule 3
1Z Oracle Business Intelligence Foundation Suite 11g Essentials
 1Z0-591 - Oracle Business Intelligence Foundation Suite 11g Essentials 1.When a customer wants to get sales numbers by day, how is data stored in the Star Schema, if the data is loaded nightly? A. The
Hyperion Interactive Reporting Reports & Dashboards Essentials
 Oracle University Contact Us: +27 (0)11 319-4111 Hyperion Interactive Reporting 11.1.1 Reports & Dashboards Essentials Duration: 5 Days What you will learn The first part of this course focuses on two
Module 1.Introduction to Business Objects. Vasundhara Sector 14-A, Plot No , Near Vaishali Metro Station,Ghaziabad
 Module 1.Introduction to Business Objects New features in SAP BO BI 4.0. Data Warehousing Architecture. Business Objects Architecture. SAP BO Data Modelling SAP BO ER Modelling SAP BO Dimensional Modelling
CHAPTER 4: MICROSOFT OFFICE: EXCEL 2010
 CHAPTER 4: MICROSOFT OFFICE: EXCEL 2010 Quick Summary A workbook an Excel document that stores data contains one or more pages called a worksheet. A worksheet or spreadsheet is stored in a workbook, and
Oracle BI 11g R1: Build Repositories Course OR102; 5 Days, Instructor-led
 Oracle BI 11g R1: Build Repositories Course OR102; 5 Days, Instructor-led Course Description This Oracle BI 11g R1: Build Repositories training is based on OBI EE release 11.1.1.7. Expert Oracle Instructors
Interactive Reporting & Essbase. interrel Consulting
 Interactive Reporting & Essbase interrel Consulting interrel - Founded in 1997 2008 Oracle Titan Award winner for EPM Solution of the year 2008 Oracle Excellence Award winner with Pearson Education One
Oracle BI 11g R1: Build Repositories
 Oracle University Contact Us: + 36 1224 1760 Oracle BI 11g R1: Build Repositories Duration: 5 Days What you will learn This Oracle BI 11g R1: Build Repositories training is based on OBI EE release 11.1.1.7.
Intellicus Enterprise Reporting and BI Platform
 Designing Adhoc Reports Intellicus Enterprise Reporting and BI Platform Intellicus Technologies info@intellicus.com www.intellicus.com Designing Adhoc Reports i Copyright 2012 Intellicus Technologies This
Desktop Studio: Charts
 Desktop Studio: Charts Intellicus Enterprise Reporting and BI Platform Intellicus Technologies info@intellicus.com www.intellicus.com Working with Charts i Copyright 2011 Intellicus Technologies This document
Oracle BI 12c: Build Repositories
 Oracle University Contact Us: Local: 1800 103 4775 Intl: +91 80 67863102 Oracle BI 12c: Build Repositories Duration: 5 Days What you will learn This Oracle BI 12c: Build Repositories training teaches you
Alma Analytics Beyond out-of-the-box reports: Tips for formatting and customization
 Alma Analytics Beyond out-of-the-box reports: Tips for formatting and customization Tricia Clayton tclayton3@gsu.edu Collection Services Librarian Georgia State University GIL User Group Meeting, 2018
OBIEE Performance Improvement Tips and Techniques
 OBIEE Performance Improvement Tips and Techniques Vivek Jain, Manager Deloitte Speaker Bio Manager with Deloitte Consulting, Information Management (BI/DW) Skills in OBIEE, OLAP, RTD, Spatial / MapViewer,
XTRACTION NEW FEATURES
 XTRACTION NEW FEATURES The new release of Xtraction provides a wide range of dynamic new features to enhance its already robust reporting and dashboard capabilities. INTERFACE The interface has been redesigned
Top 24 Obiee Interview Questions & Answers
 Top 24 Obiee Interview Questions & Answers 1) Mention what is Obiee? Obiee stands for Oracle Business Intelligence Enterprise Edition (OBIEE). It is a business intelligence system for the enterprise that
Enterprise Reporting -- APEX
 Quick Reference Enterprise Reporting -- APEX This Quick Reference Guide documents Oracle Application Express (APEX) as it relates to Enterprise Reporting (ER). This is not an exhaustive APEX documentation
Quality Gates User guide
 Quality Gates 3.3.5 User guide 06/2013 1 Table of Content 1 - Introduction... 4 2 - Navigation... 5 2.1 Navigation tool bar... 5 2.2 Navigation tree... 5 2.3 Folder Tree... 6 2.4 Test history... 7 3 -
Advanced Web Intelligence Techniques for Aspiring Jedi Knights
 September 9 11, 2013 Anaheim, California Advanced Web Intelligence Techniques for Aspiring Jedi Knights Alan Mayer Solid Ground Technologies Agenda Introduction Query Techniques Report Techniques Performance
Product Documentation SAP Business ByDesign August Analytics
 Product Documentation PUBLIC Analytics Table Of Contents 1 Analytics.... 5 2 Business Background... 6 2.1 Overview of Analytics... 6 2.2 Overview of Reports in SAP Business ByDesign... 12 2.3 Reports
COGNOS (R) 8 GUIDELINES FOR MODELING METADATA FRAMEWORK MANAGER. Cognos(R) 8 Business Intelligence Readme Guidelines for Modeling Metadata
 8 GUIDELINES FOR MODELING METADATA FRAMEWORK MANAGER. Cognos(R) 8 Business Intelligence Readme Guidelines for Modeling Metadata") COGNOS (R) 8 FRAMEWORK MANAGER GUIDELINES FOR MODELING METADATA Cognos(R) 8 Business Intelligence Readme Guidelines for Modeling Metadata GUIDELINES FOR MODELING METADATA THE NEXT LEVEL OF PERFORMANCE
COGNOS (R) 8 FRAMEWORK MANAGER GUIDELINES FOR MODELING METADATA Cognos(R) 8 Business Intelligence Readme Guidelines for Modeling Metadata GUIDELINES FOR MODELING METADATA THE NEXT LEVEL OF PERFORMANCE
Desktop Studio: Charts. Version: 7.3
 Desktop Studio: Charts Version: 7.3 Copyright 2015 Intellicus Technologies This document and its content is copyrighted material of Intellicus Technologies. The content may not be copied or derived from,
1. Attempt any two of the following: 10 a. State and justify the characteristics of a Data Warehouse with suitable examples.
 Instructions to the Examiners: 1. May the Examiners not look for exact words from the text book in the Answers. 2. May any valid example be accepted - example may or may not be from the text book 1. Attempt
Spreadsheet definition: Starting a New Excel Worksheet: Navigating Through an Excel Worksheet
 Copyright 1 99 Spreadsheet definition: A spreadsheet stores and manipulates data that lends itself to being stored in a table type format (e.g. Accounts, Science Experiments, Mathematical Trends, Statistics,
Intellicus Enterprise Reporting and BI Platform
 Working with Query Objects Intellicus Enterprise Reporting and BI Platform ` Intellicus Technologies info@intellicus.com www.intellicus.com Working with Query Objects i Copyright 2012 Intellicus Technologies
Table of Contents: Microsoft Power Tools for Data Analysis #15 Comprehensive Introduction to Power Pivot & DAX. Notes from Video:
 Microsoft Power Tools for Data Analysis #15 Comprehensive Introduction to Power Pivot & DAX Table of Contents: Notes from Video: 1) Standard PivotTable or Data Model PivotTable?... 3 2) Excel Power Pivot
GOBENCH IQ Release v
 GOBENCH IQ Release v1.2.3.3 2018-06-11 New Add-Ons / Features / Enhancements in GOBENCH IQ v1.2.3.3 GOBENCH IQ v1.2.3.3 contains several new features and enhancements ** New version of the comparison Excel
Day 1 Agenda. Brio 101 Training. Course Presentation and Reference Material
 Data Warehouse www.rpi.edu/datawarehouse Brio 101 Training Course Presentation and Reference Material Day 1 Agenda Training Overview Data Warehouse and Business Intelligence Basics The Brio Environment
Braindumps.1z QA
 Braindumps.1z0-591.120.QA Number: 1z0-591 Passing Score: 800 Time Limit: 120 min File Version: 4.4 http://www.gratisexam.com/ 1z0-591 Oracle Business Intelligence Foundation Suite 11g Essentials I found
OBIEE Course Details
 OBIEE Course Details By Besant Technologies Course Name Category Venue OBIEE (Oracle Business Intelligence Enterprise Edition) BI Besant Technologies No.24, Nagendra Nagar, Velachery Main Road, Address
1z0-591.exam.70q.
 1z0-591.exam.70q Number: 1z0-591 Passing Score: 800 Time Limit: 120 min 1z0-591 Oracle Business Intelligence Foundation Suite 11g Essentials Exam A QUESTION 1 Query limits tab can be accessed through.
Business Insight Authoring
 Business Insight Authoring Getting Started Guide ImageNow Version: 6.7.x Written by: Product Documentation, R&D Date: August 2016 2014 Perceptive Software. All rights reserved CaptureNow, ImageNow, Interact,
Working with Charts Stratum.Viewer 6
 Working with Charts Stratum.Viewer 6 Getting Started Tasks Additional Information Access to Charts Introduction to Charts Overview of Chart Types Quick Start - Adding a Chart to a View Create a Chart with
Index COPYRIGHTED MATERIAL. Symbols and Numerics
 Symbols and Numerics ( ) (parentheses), in functions, 173... (double quotes), enclosing character strings, 183 #...# (pound signs), enclosing datetime literals, 184... (single quotes), enclosing character
CHAPTER 8: ONLINE ANALYTICAL PROCESSING(OLAP)
") CHAPTER 8: ONLINE ANALYTICAL PROCESSING(OLAP) INTRODUCTION A dimension is an attribute within a multidimensional model consisting of a list of values (called members). A fact is defined by a combination
CHAPTER 8: ONLINE ANALYTICAL PROCESSING(OLAP) INTRODUCTION A dimension is an attribute within a multidimensional model consisting of a list of values (called members). A fact is defined by a combination
Intelligence. Peachtree Business Intelligence Report Writing Best Practices
 Intelligence Peachtree Business Intelligence Report Writing Best Practices 1. GETTING STARTED... 3 1.1. PRE-REQUISITES... 3 2. CONNECTOR TOOL... 4 2.1. CONTAINERS:... 4 2.2. JOINS:... 4 2.3. EXPRESSIONS:...
XLCubed Version 9 QuickStart
 XLCubed Version 9 QuickStart 1 P a g e Contents Welcome... 3 Connecting to your data... 3 XLCubed for Pivot Table users... 3 Adding a Grid, and the Report Designer... 5 Working with Grids... 7 Grid Components...
Applying Best Practices, QA, and Tips and Tricks to Our Reports
 Applying Best Practices, QA, and Tips and Tricks to Our Reports If we had to summarize all we have learned so far, put it into a nutshell, and squeeze in just the very best of everything, this is how that
Scripting OBIEE Is UDML and XML all you need?
 Scripting OBIEE Is UDML and XML all you need? Andreas Nobbmann Consultant Business Intelligence Andreas.Nobbmann@trivadis.com Brighton, May 14th, 2009 Basel Baden Bern Lausanne Zürich Düsseldorf Frankfurt/M.
Sage Intelligence: Report Writing Methodology Agenda
 Sage Intelligence: Report Writing Methodology Agenda Report Structure Report Writing Methodology Report Writing Best Practices The purpose of this webinar is to provide the best possible guidelines on
Jim Brogden, Heather Sinkwitz, Dallas Marks, Gabriel Orthous. SAP BusinessObjects Web Intelligence. The Comprehensive Guide. S Galileo Press.
 Jim Brogden, Heather Sinkwitz, Dallas Marks, Gabriel Orthous SAP BusinessObjects Web Intelligence The Comprehensive Guide S Galileo Press Bonn Acknowledgments 21 Foreword 23 1.1 Features of Web Intelligence
COPYRIGHTED MATERIAL. Making Excel More Efficient
 Making Excel More Efficient If you find yourself spending a major part of your day working with Excel, you can make those chores go faster and so make your overall work life more productive by making Excel
QDA Miner. Addendum v2.0
 QDA Miner Addendum v2.0 QDA Miner is an easy-to-use qualitative analysis software for coding, annotating, retrieving and reviewing coded data and documents such as open-ended responses, customer comments,
CXO-Cockpit Hands-On Workshop
 CXO-Cockpit Hands-On Workshop Agenda - Day 1 o Introduction o Main tools and basic concepts o Architecture o Demo of CXO-Cockpit web application o Demo of CXO-Cockpit designer o Hands-on Exercises: create
Customizing and Administering Project Server Access
 WEB Customizing and Administering Project Server Access In this chapter Creating and Deleting Users from Project Server 2 Managing User Groups Project Server User Security 4 Using Categories to Control
A Case Study Building Financial Report and Dashboard Using OBIEE Part I
 A Case Study Building Financial Report and Dashboard Using OBIEE Part I This is a 1 st document in the series of building financial reports and dashboard taking Essbase as Data Source. This document briefs
USER MANUAL. Contents. Analytic Reporting Tool Basic for SUITECRM
 USER MANUAL Analytic Reporting Tool Basic for SUITECRM Contents ANALYTIC REPORTING TOOL FEATURE OVERVIEW... 2 PRE-DEFINED REPORT LIST AND FOLDERS... 3 REPORT AND CHART SETTING OVERVIEW... 5 Print Report,
eschoolplus+ Cognos Query Studio Training Guide Version 2.4
 + Training Guide Version 2.4 May 2015 Arkansas Public School Computer Network This page was intentionally left blank Page 2 of 68 Table of Contents... 5 Accessing... 5 Working in Query Studio... 8 Query
Table of Contents. Table of Contents
 Powered by 1 Table of Contents Table of Contents Dashboard for Windows... 4 Dashboard Designer... 5 Creating Dashboards... 5 Printing and Exporting... 5 Dashboard Items... 5 UI Elements... 5 Providing
Jet Data Manager 2014 SR2 Product Enhancements
 Jet Data Manager 2014 SR2 Product Enhancements Table of Contents Overview of New Features... 3 New Features in Jet Data Manager 2014 SR2... 3 Improved Features in Jet Data Manager 2014 SR2... 5 New Features
Oracle BI 11g R1: Build Repositories
 Oracle University Contact Us: 02 6968000 Oracle BI 11g R1: Build Repositories Duration: 5 Days What you will learn This course provides step-by-step procedures for building and verifying the three layers
What s New In Sawmill 8 Why Should I Upgrade To Sawmill 8?
 What s New In Sawmill 8 Why Should I Upgrade To Sawmill 8? Sawmill 8 is a major new version of Sawmill, the result of several years of development. Nearly every aspect of Sawmill has been enhanced, and
ScholarOne Manuscripts. COGNOS Reports User Guide
 ScholarOne Manuscripts COGNOS Reports User Guide 1-May-2018 Clarivate Analytics ScholarOne Manuscripts COGNOS Reports User Guide Page i TABLE OF CONTENTS USE GET HELP NOW & FAQS... 1 SYSTEM REQUIREMENTS...
REPORTING AND QUERY TOOLS AND APPLICATIONS
 Tool Categories: REPORTING AND QUERY TOOLS AND APPLICATIONS There are five categories of decision support tools Reporting Managed query Executive information system OLAP Data Mining Reporting Tools Production
for Q-CHECKER Text version 15-Feb-16 4:49 PM
 Q-MONITOR 5.4.X FOR V5 for Q-CHECKER USERS GUIDE Text version 15-Feb-16 4:49 PM Orientation Symbols used in the manual For better orientation in the manual the following symbols are used: Warning symbol
Information Design Tool User Guide SAP BusinessObjects Business Intelligence platform 4.0 Support Package 4
 Information Design Tool User Guide SAP BusinessObjects Business Intelligence platform 4.0 Support Package 4 Copyright 2012 SAP AG. All rights reserved.sap, R/3, SAP NetWeaver, Duet, PartnerEdge, ByDesign,
RiskyProject Enterprise 7
 RiskyProject Enterprise 7 Project Risk Management Software RiskyProject Enterprise User Guide Intaver Institute Inc. www.intaver.com email: info@intaver.com COPYRIGHT Copyright 2017 Intaver Institute.
To access BuckIQ, you must first be granted access. Send requests for permission to
 BuckIQ User s Guide Job Aid What is BuckIQ? Several years ago, Oracle took a look at the state of the Business Intelligence industry in terms of the different processes and applications that were required
1Z0-630 Questions & Answers
 1Z0-630 Questions & Answers Number: 1Z0-630 Passing Score: 800 Time Limit: 120 min File Version: 38.2 http://www.gratisexam.com/ 1Z0-630 Questions & Answers Exam Name: Siebel7.7 Analytics Server Architect
BIS 3.10 (update )
") RELEASE NOTES BIS 3.10 (update 17.01.2017) Index 3.10 Features... 1 3.9 Features... 1 3.8 Features... 1 3.7 Features... 2 3.6 Features... 2 3.5 Features... 2 3.0 Features... 2 Fixed in 3.10 releases...
RELEASE NOTES BIS 3.10 (update 17.01.2017) Index 3.10 Features... 1 3.9 Features... 1 3.8 Features... 1 3.7 Features... 2 3.6 Features... 2 3.5 Features... 2 3.0 Features... 2 Fixed in 3.10 releases...
2012 Microsoft Corporation. All rights reserved. Microsoft, Active Directory, Excel, Lync, Outlook, SharePoint, Silverlight, SQL Server, Windows,
 2012 Microsoft Corporation. All rights reserved. Microsoft, Active Directory, Excel, Lync, Outlook, SharePoint, Silverlight, SQL Server, Windows, Windows Server, and other product names are or may be registered
EXCEL Using Excel for Data Query & Management. Information Technology. MS Office Excel 2007 Users Guide. IT Training & Development
 Information Technology MS Office Excel 2007 Users Guide EXCEL 2007 Using Excel for Data Query & Management IT Training & Development (818) 677-1700 Training@csun.edu TABLE OF CONTENTS Introduction... 1
EVALUATION COPY. Unauthorized Reproduction or Distribution Prohibited EXCEL INTERMEDIATE
 EXCEL INTERMEDIATE Overview NOTES... 2 OVERVIEW... 3 VIEW THE PROJECT... 5 USING FORMULAS AND FUNCTIONS... 6 BASIC EXCEL REVIEW... 6 FORMULAS... 7 Typing formulas... 7 Clicking to insert cell references...
A Guide to Creating QuickReports
 A Guide to Creating QuickReports Use QuickReports to produce lists, summaries and charts from the data in SupportDesk. If in the Windows application Access QuickReports, from Reporting within the Explorer
DOING MORE WITH EXCEL: MICROSOFT OFFICE 2013
 DOING MORE WITH EXCEL: MICROSOFT OFFICE 2013 GETTING STARTED PAGE 02 Prerequisites What You Will Learn MORE TASKS IN MICROSOFT EXCEL PAGE 03 Cutting, Copying, and Pasting Data Basic Formulas Filling Data
The software shall provide the necessary tools to allow a user to create a Dashboard based on the queries created.
 IWS BI Dashboard Template User Guide Introduction This document describes the features of the Dashboard Template application, and contains a manual the user can follow to use the application, connecting
All Excel Topics Page 1 of 11
 All Excel Topics Page 1 of 11 All Excel Topics All of the Excel topics covered during training are listed below. Pick relevant topics and tailor a course to meet your needs. Select a topic to find out
UAccess ANALYTICS A New Look, New Features, and New Functions
 UAccess Analytics has been updated to a new version of software! Naturally, a software update means there are some new features and functions available to UAccess Analytics users. An Updated Look One thing
Sample Data. Sample Data APPENDIX A. Downloading the Sample Data. Images. Sample Databases
 APPENDIX A Sample Data Sample Data If you wish to follow the examples used in this book and I hope you will you will need some sample data to work with. All the files referenced in this book are available
Excel 2013 Intermediate
 Instructor s Excel 2013 Tutorial 2 - Charts Excel 2013 Intermediate 103-124 Unit 2 - Charts Quick Links Chart Concepts Page EX197 EX199 EX200 Selecting Source Data Pages EX198 EX234 EX237 Creating a Chart
Text version 15-Aug-12. for Q-CHECKER V4, V5 and V6
 Text version 15-Aug-12 Q-MONITOR V4 for Q-CHECKER V4, V5 and V6 USERS GUIDE Orientation Symbols used in the manual For better orientation in the manual the following symbols are used: Warning symbol Tip
Data Explorer: User Guide 1. Data Explorer User Guide
 Data Explorer: User Guide 1 Data Explorer User Guide Data Explorer: User Guide 2 Contents About this User Guide.. 4 System Requirements. 4 Browser Requirements... 4 Important Terminology.. 5 Getting Started
Query Studio Training Guide Cognos 8 February 2010 DRAFT. Arkansas Public School Computer Network 101 East Capitol, Suite 101 Little Rock, AR 72201
 Query Studio Training Guide Cognos 8 February 2010 DRAFT Arkansas Public School Computer Network 101 East Capitol, Suite 101 Little Rock, AR 72201 2 Table of Contents Accessing Cognos Query Studio... 5
Oracle Database: SQL and PL/SQL Fundamentals NEW
 Oracle University Contact Us: 001-855-844-3881 & 001-800-514-06-97 Oracle Database: SQL and PL/SQL Fundamentals NEW Duration: 5 Days What you will learn This Oracle Database: SQL and PL/SQL Fundamentals
Data Science. Data Analyst. Data Scientist. Data Architect
 Data Science Data Analyst Data Analysis in Excel Programming in R Introduction to Python/SQL/Tableau Data Visualization in R / Tableau Exploratory Data Analysis Data Scientist Inferential Statistics &
Key concepts through Excel Basic videos 01 to 25
 Key concepts through Excel Basic videos 01 to 25 1) Row and Colum make up Cell 2) All Cells = Worksheet = Sheet 3) Name of Sheet is in Sheet Tab 4) All Worksheets = Workbook File 5) Default Alignment In
Primo Analytics Workshop. BIBSYS Konferansen 20 March 2018
 Primo Analytics Workshop BIBSYS Konferansen 20 March 2018 Objectives By the end of this session, you will: Understand what is Primo Analytics and OBI. Have a high-level view of how Primo Analytics is working.
Sitecore Experience Platform 8.0 Rev: September 13, Sitecore Experience Platform 8.0
 Sitecore Experience Platform 8.0 Rev: September 13, 2018 Sitecore Experience Platform 8.0 All the official Sitecore documentation. Page 1 of 455 Experience Analytics glossary This topic contains a glossary
The following topics describe how to work with reports in the Firepower System:
 The following topics describe how to work with reports in the Firepower System: Introduction to Reports Introduction to Reports, on page 1 Risk Reports, on page 1 Standard Reports, on page 2 About Working
DiskSavvy Disk Space Analyzer. DiskSavvy DISK SPACE ANALYZER. User Manual. Version Dec Flexense Ltd.
 DiskSavvy DISK SPACE ANALYZER User Manual Version 10.3 Dec 2017 www.disksavvy.com info@flexense.com 1 1 Product Overview...3 2 Product Versions...7 3 Using Desktop Versions...8 3.1 Product Installation
ABOUT PIVOTTABLES TABLE OF CONTENTS
 University of Southern California Academic Information Services Excel 2007 - PivotTables ABOUT PIVOTTABLES PivotTables provide an excellent means of analyzing data stored in database format by rearranging
Advanced Multidimensional Reporting
 Guideline Advanced Multidimensional Reporting Product(s): IBM Cognos 8 Report Studio Area of Interest: Report Design Advanced Multidimensional Reporting 2 Copyright Copyright 2008 Cognos ULC (formerly
COGNOS DYNAMIC CUBES: SET TO RETIRE TRANSFORMER? Update: Pros & Cons
 COGNOS DYNAMIC CUBES: SET TO RETIRE TRANSFORMER? 10.2.2 Update: Pros & Cons GoToWebinar Control Panel Submit questions here Click arrow to restore full control panel Copyright 2015 Senturus, Inc. All Rights
QuickReports Guide. Creating a New Report
 QuickReports Guide Use QuickReports to produce lists, summaries and charts from the data in SupportDesk. Reports are accessed from the QuickReports option in the menu topbar. Clicking the QuickReports
Microsoft Office Excel 2013 Courses 24 Hours
 Microsoft Office Excel 2013 Courses 24 Hours COURSE OUTLINES FOUNDATION LEVEL COURSE OUTLINE Getting Started With Excel 2013 Starting Excel 2013 Selecting the Blank Worksheet Template The Excel 2013 Cell
Perceptive Matching Engine
 Perceptive Matching Engine Advanced Design and Setup Guide Version: 1.0.x Written by: Product Development, R&D Date: January 2018 2018 Hyland Software, Inc. and its affiliates. Table of Contents Overview...
Adding records Pasting records Deleting records Sorting records Filtering records Inserting and deleting columns Calculated columns Working with the
 Show All About spreadsheets You can use a spreadsheet to enter and calculate data. A spreadsheet consists of columns and rows of cells. You can enter data directly into the cells of the spreadsheet and
Simply Accounting Intelligence Tips and Tricks Booklet Vol. 1
 Simply Accounting Intelligence Tips and Tricks Booklet Vol. 1 1 Contents Accessing the SAI reports... 3 Copying, Pasting and Renaming Reports... 4 Creating and linking a report... 6 Auto e-mailing reports...
Basic Reports & Dashboards
 Basic Reports & Dashboards Arizona Board of Regents, 2012 updated 06.01.2012 v.1.10 For information and permission to use our PDF manuals, please contact uitsworkshopteam@list.arizona.edu PDFs available
User Guide. Visualizer
 User Guide Visualizer Copyright 2018 Upland Software. All rights reserved. Information in this document is subject to change without notice. The software described in this document is furnished under a
Using SQL with SQL Developer 18.2
 One Introduction to SQL 2 - Definition 3 - Usage of SQL 4 - What is SQL used for? 5 - Who uses SQL? 6 - Definition of a Database 7 - What is SQL Developer? 8 Two The SQL Developer Interface 9 - Introduction
ER/Studio Enterprise Portal User Guide
 ER/Studio Enterprise Portal 1.1.1 User Guide Copyright 1994-2009 Embarcadero Technologies, Inc. Embarcadero Technologies, Inc. 100 California Street, 12th Floor San Francisco, CA 94111 U.S.A. All rights
Hands-On Lab. Lab: Developing BI Applications. Lab version: Last updated: 2/23/2011
 Hands-On Lab Lab: Developing BI Applications Lab version: 1.0.0 Last updated: 2/23/2011 CONTENTS OVERVIEW... 3 EXERCISE 1: USING THE CHARTING WEB PARTS... 5 EXERCISE 2: PERFORMING ANALYSIS WITH EXCEL AND
Lesson 1: Creating and formatting an Answers analysis
 Lesson 1: Creating and formatting an Answers analysis Answers is the ad-hoc query environment in the OBIEE suite. It is in Answers that you create and format analyses to help analyze business results.
PeopleSoft Pivot Grids A through Z!
 PeopleSoft Pivot Grids A through Z! Session ID: 101480 Prepared by: Millie Babicz, SpearMC Consulting @SpearMC Agenda About Us Pivot Grid Overview Pivot Grid Wizard Use of Pivot Grid in Work Centers 2
CenterStone. Reports User Guide. Manhattan Software Inc. World Leading Real Estate, Asset & Facilities Management Software.
 CenterStone Reports User Guide Version 1 Manhattan Software Inc. World Leading Real Estate, Asset & Facilities Management Software The information contained herein is the property of Manhattan Software,