James L. Brown, Larry J. Buttler and William P. Ezzell
|
|
|
- Lucas Melton
- 5 years ago
- Views:
Transcription


1
2 ~.,_~w._'''... SURVEY OF STRUCTURAL FAILURES IN A CONTINUOUSLY REINFORCED CONCRETE PAVEMENT By James L. Brown, Larry J. Buttler and William P. Ezzell Special Study No.. Highway Design Division, Research Section TEXAS HIGHWAY DEPARTMENT October 969
3 PREFACE This report documents a survey made by Texas Highway Department personnel to locate and measure distressed areas in a Continuously Reinforced Concrete Pavement in Walker County, Texas. It is intended-that the application of procedures discussed herein will enable other THD field personnel to obtain similar data with a degree of statewide uniformity in operations and data presentation. A summary of the measurements obtained is indicated in the following table entitled "Summary of Percent Distress per Wheel Path Walker County", and is discussed further in the report.
4 Summary of Percent Distress per Wheel Path-Walker County (Rounded Values) Southbound Lane Northbound Lane *Wheel Path *Wheel Path Total Length of Failure, Feet 3,494',850' 432' 390' 2,278'.,78 ' 42' 344' Percent Failure *Wheel paths are numbered consecutively, increasing from the outer separation to the median
5 TO DALLAS END PROJECT Sta GENERAL SITE LOCATION Farm to Market Rd. Farm to Market Rd. BEG. PROJECT Sta TO HOUSTON-----I... L.OCATION AND LAYOUT OF WALKER COUNTY PROJECT
6 ct. Highway I 6'-a" 6-0" V4 in/ft, 24'-0" a" Continuously Reinforced Concrete Pavement WP#4 I WP#3 I WP#2,4, ': ':;' 4', ':': 4 '? f :-,' '::,::.0' " :.. ' 4 ',.,: : -: : ":', :, 0'- a" I" Asphaltic Concrete ~ i%t. Lime Stabilized Base 6" Lime Stabilized Soil 6" Flexible Base TYPICAL HALF SECTION FOR WALKER COUNTY PROJECT
7 TABLE OF CONTENTS Page No. Introduction. Definition of Failure and Data Collection Technique Discussion of Data Summary Tables and Figures Table Table 2 Summary of Percent Distress per Wheel Path-Walker County. Design Sections with Significantly Different Percentages of Distress in Wheel Path No. 2 3 Figure Profile Plot of Percent Failures Discussions and Conclusions References Appendices Appendix A Appendix B Sample Field Data Sheet and Definition of Coding Sample Photographs of Distressed Areas 8 Appendix C Location of Distressed Areas.. 9 Appendix D Tabulation of Percent Failures 39
8 SURVEY OF STRUCTURAL FAILURES IN A CONTINUOUSLY REINFORCED CONCRETE PAVEMENT Introduction A design procedure for determining the thickness of asphaltic concrete overlay to place on a deteriorating continuously reinforced concrete pavement has been developed (Ref. ). It became appar'ent during its development that the amount of structural failure or distressed areas now present in the CRCP would be required as a quantitative parameter to help define the pavement structure. Additionally, this measure of failure was to give the designer a "feel ll for the confidence level that should be used in the design procedure. Proper referencing of the failures observed was necessary so that future observations of the same failures could be made after the placement of an overlay. Definition of Areas of Distress and Data Collection Technique For this survey, areas of distress in the concrete pavement were defined by the following criteria (See Appendix B for example photographs).. Portland Cement Concrete Repairs (Patches) 2. Asphaltic Concrete Repairs (Patches) 3. Longitudinal cracks 4. Transverse cracks with spalling wider than ~" A previous field party measuring deflections with a Dynaflect instrument marked station numbers along the pavement edge every /0 of a mile (approximately) on both the southbound and northbound roadway. These Dynafect station numbers can be referenced to the center line station of the main lanes prior to the placement of an overlay as provided in Appendix C. A "Rolatype" measuring wheel four feet in circumference and calibrated to the nearest one-tenth of a foot was used to measure each failure occuring in the CRCP. The wheel was rolled along the outside shoulder parallel to the main lanes. The distance to the beginning and the ending of each distressed or failed area from the previous Dynafect station number was recorded; this distance was recorded on the prepared data sheet. (See Appendix A for explanation of the data sheet). The wheel path of each failure was also recorded as was the type of failure, i.e., concrete patch, asphalt patch, construction joint, etc. The original field data is in the files of the Research Section, Highway Design Division and is available upon request Discussion of Data Summary Tables and Figures Table depicts percent failure per wheel path for both the northbound and southbound roadway found by taking the total length of failure measured and dividing by the length of the roadway. The failure length for each isolated, spalled, transverse crack (See 4. above) was considered to be two feet.
9 Table. Summary of Percent Distress per Wheel Path-Walker County (Rounded Values) Southbound Lane Northbound Lane *Whee Path *Whee Path Total Length of Failure, Feet 3,494',850' 432' 390' 2,278',78' 42' 344' Percent Failure To satisfactorily accomplish the design of an overlay, the worst condition or the wheel path with the highest percentage of failure was taken as the governing criteria. This data was plotted by Dynafect station number as shown in Figure and this plot was used to divide the roadway into test sections of equal performance considering the failures as an indicator of performance. (See Appendix D for tabulation of data). Using the statistical analysis of variance tests (Ref. 2) the sections were compared and combined until the adjacent sections were sufficiently different at the 95% confidence level. The results of this study are presented in Table 2, in terms of the station limits, average failures for the outside wheel path of the outside lane, and the standard deviation of the failures for each section. *Whee paths are numbered consecutively, increasing from the outer separation to the median 2
10 Design Sections with Significantly Different Percentages Distress in Wheel Path No. (95% Confidence Level) Lane Limits (Dynaflect s) Average of Failure Linear Ft!Ft Wheel Path No. Standard Deviation North Bound South Bound Overlay 7.82 Overlay-l End.20 0-Overay 3.60 Overay-4l End Table 2 3
11 ~ , ,----- w 5 a: ::::>.J LL.I <i 0 A I o ~ OVERLAY 5.p- o I v v v tv". I "\ I o DYNAFLECT STATIONS (SBL) Iii ~ 38.0, 23.7 w Q: :::::> 5 ~.J 0 I I /\ ~ I I I:, /I OVERLAY ~ o 5 o DYNAFLECT STATIONS (NBU FIGURE I. PROFILE OF PERCENT FAILURES 55
12 :: ::::>...J 5 ~ I.L 0 ~ 0 5 VI ~OO 0 DYNAFLECT STATIONS (S8U :: ::J...J 0 'ff:. ~ , DYNAFLECT STATIONS (NBU FIGURE I CONTINUED
13 Discussion and Conclusions The percent failures per wheel path obtained from this survey quantified the results of a visual inspection of this section of IH 45. They indicate that the outside wheel paths of both the Southbound and Northbound Roadways which are traveled by the highest number of vehicles, including heavy trucks, are failing more rapidly than the adjacent wheel paths. With the percentages shown in Table, it is now possible to check the predicted failures obtained from the overlay design procedure. In future surveys of this type, if possible, one individual should estimate the failure areas throughout the entire survey. If more than one individual is used to survey a project then great care should be taken to insure that the different individuals are surveying with the same criteria for failure. For the location of failures the calibrated wheel was a convenient method used in this survey. The survey team consisted of a wheel operator, a data recorder, and vehicle operator who provided protection from traffic. With careful planning, the wheel operator could record data by use of a tape recorder. It is probable that more convenient methods of failure quantification could be devised for future projects. For future projects it is recommended that center line stations be established prior to the location of pavement failures. This will allow direct referencing of failures to center line stations and eliminate the conversion of stationing as shown in Appendix C 6
14 References. B. F. McCullough, A Pavement Overlay Design System Considering Wheel Loads. Temperature Changes. and Performance, University of California, Berkeley, July Alder, Henry L. and Roessler, Edward B., Introduction to Probability and Statistics, W. H. Freeman and Company, Third Edition, 964. Chapter 7,.Pp. 253 to 254 7
15 APPENDIX A Sample Field Data Sheet and Definition of Coding 8
16 direction I Asphalt Patch 2 Repair date PAVEMENT.DETERIORATION STUDY 3 Cracked highway 4 Construction Joint control,., Dynoflect Distance to Wheel Paths T Comments Stat. No. Deterioration Out- In- y side side Begin End Lane Lane P I E al9dll 2dl ld242d2d272829:J I35b6b7:i3I~d4l ~474.J -J~.J ,.
17 Definition of Coding Shown on Field Data Sheet Code Code 2 Code 3 Code represents an asphalt patch covering most of a failed area. (Photograph 0, Appendix B). Code 2 represents a previously failed area repaired with a concrete patch in good condition at present. (Photographs 3,,7, Appendix B). Code 3 represents a failed or distressed area. Examples and Photograph references for Appendix B are listed below. (a) (b) (c) Asphalt patch where concrete around this patch has failed. Photographs 5,8,0,9. Concrete patch where concrete around it has failed. Photograph 9. Concrete patch where patch itself has failed. Photograph 6. (d) Any longitudinal concrete crack. Photographs 6,4,5,9. (e) Spalled transverse crack greater than H;'. Photographs 6,3,8,9. Code 4 Code 4 represents a construction joint. Photographs 0,20. 0
18 APPENDIX B Sample Photographs of Distressed Areas


19 Photograph 4Fl A distressed area prepared for a concrete patch. Wheel Path {fl. Photograph 4n (Same comment as Photograph 4) Photograph 43 Concrete Patch in place approximately two days. Wheel Path 4. 2


20 Photograph #4 (Same eomment as Photograph #) Photograph 45 Asphalt Patch Wheel Path # Photograph 46 Median size longitudinal crack. Wheel Path #. 3


21 Photograph f7 Mixture of Concrete and Asphalt Patches. Wheel Path f. Photograph IF8 Failure where Concrete is breaking out under traffic adjacent to small asphalt patch. Wheel path Ifl. Photograph f9 Old Concrete Patch Wheel Path. 4


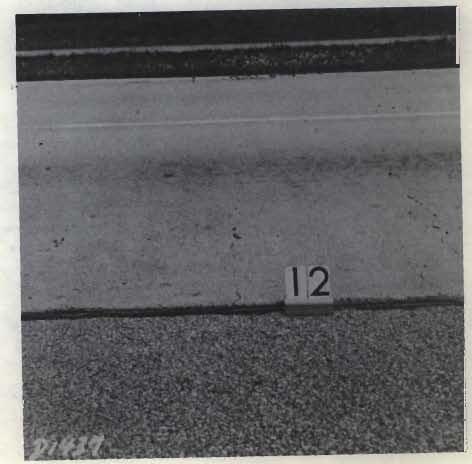


22 Photograph f0 Construction Joint with Asphalt Patch. Failure in Wheel Path # & 2. Photograph fill "New" and "Old" Concrete. Patches. Most Failures in Wheel Path #. Photograph f2 Typical Transverse Cracks with minor spaing not called failure in this survey. 5


23 Photograph ih3 Typical Spaing Wheel Path & 2. Photograph /fl4 Typical Longitudinal Failure with spaing. Wheel Path /fl. Photograph ihs Transverse and Longitudinal failures. 6


24 Photograph Ifl6a Concrete patch failures Wheel Path land 2. Photograph 6b View showing general area of 6a. Photograph 47 Largest Concrete patch old, but in good shape. 7


25 Photograph 48 Spalling failures Wheel Path # 3 & 4. Photograph 49 Failures - Wheel Paths & 2 Rocker failure Wheel Path #2. Photograph ino Good Construction Joint 8
26 APPENDIX C Location of Distressed Areas (Indicates wheel path and the failure length in feet is referenced to the preceeding Dynafect s) 9._._.I ~----
27 ; Dynaflect Sta. Center Line Location of Failure South Bound Lane Date: 4/28/69 Begin End Begin End Wheel Failure Failure Centerline Centerline Path atation * Represents a concrete patch. 20
28 Dynafleet ISb Center Line St.at.ion Location of Failure South Bound Lane Begin End Begin Failure Failure Centerline Date: 4/28/69 End Wheel Centerline Path 2
29 Dynaflect Sta Center Line Stat,; on Location of Failure South Bound Lane Begin End Begin Failure Failure Centerline Date: 4/29/69 End Wheel Centerline Path 22
30 Location of Failure Dynafect Center Line South Bound Lane Begin End Begin Failure Failure Centerline S tio Date: 4/29/69 End Wheel Centerline Path S 2 -~ J.',...,2,2,2.., L... _._.. 2.,2....,2 ~2,3,4 23
31 Dynaflect Sta. Oenter Line St.~Hnn Location of Failure South Bound Lane Begin End Begin Failure Failure Oenterline Date: 4/29/69 End Wheel Oenterline Path 24
32 Location of Failure Dynaflect St.::I Center Line St.at.ian South Bound Lane Begin End Begin Failure Failure Centerline Date: 4/29/69 End Wheel Centerline Path JQI.O '<)
33 Dynaflect St,A Center Line Stat.; on +-_._-.- Location of Failure South Bound Lane Begin End Begin Failure Failure Centerline... Date: 4/29/69 End Wheel Centerline Path.',. 3._ '.;L_.._..._...,2,3,4'=. --.._"' * :.'-..,2,2;3, , ~._,2._... ],,2,3 * * * * l~f- ~f- * ~f- 2?<" " *,2,3.,4 2 26
34 Location of Failure Dynaflect St.:! Center Line St.At.; ('In South Bound Lane Begin End Begin Failure Failure Centerline Date: 4/29/69 End Wheel Centerline Path 72_ 74 ''''.."... * *,2 *,_,~ " *2*,2,2,J,4 L L...,2...,.,2,...,_,2,2 *,2*,2,),4,2,2,2,2,2,2'),.4_ *,2,,2,2,2,2,2,2,2,2,2,Z,2' *,2:*,. 27,_. ~c~"
35 .. Center Line Dynafleet Sta. Location of Failure South Bound Lane Date: 4/29/69 Begin End Begin End Wheel Failure Failure Centerline Centerline Path 28
36 Dynafleet! Sta. Center Line Location of Failure South Bound Lane Begin End Begin Failure Failure Centerline Date: 4/29/69 End Centerline Wheel Path -- * f " --- * * * * 3,4 J.* ~ * ljlj.l,2,2,2,2,
37 Dynaflect ISt.~ Center Line St.a.t,; on Location of Failure South Bound Lane Begin End Begin Failure Failure Centerline Date: 4/29/69 End Wheel Centerline Path St,at"ion _ ~--'-'--'«"" 06 30
38 Dynaflect St.::I Center Line S+.J:l.tion Location of Failure South Bound Lane Begin End Begin Failure Failure Centerline Date: 4/29/69 End Wheel Centerline Path 2... _,--- J) End 3
39 Dynafleet St,,q Center Line St,at,; on Co. Lir e=o+qq 7 0. :rl ; Location of Failure North Bound Lane Begin End Begin Failure Failure Centerline ~Q ~"5i7.() ~ () _.. '.. Date: 4/29/69 End Wheel Centerline Path ,3,2 3,4,2 ---""!-,2,3,4 --,2,2 3,4,2,2,2,2,2 ~2,2.",J.". ;2,2 4 J,.,2,2,3 3,2,2,3,4 3, ,2,3,4 3,4,2,3,4 2 -:;-2~3-;Ii Ii- 2- ~;r,,_. 32
40 Location of Failure North Bound Lane Date: 4/29 & 30./69? Dyna- Center- Begin End Begin End Wheel flect Line Failure Failure Centerline Centerline Path Sta. Stat; on -- fts ,JL ~. -.~----~-~'~,",-~,. =~J~ ---.~ I f--_._ B "._ '-' r...'.,.2.,)., ~---~~ '......,..,... go. f ' ".~.--~ ~--.".. 2 ~ I _... _.0...l... -.=~:--':" ~- I , ~J l." , _ _~3_.. r- ' _-" -.., , , ,2 2J± ,,_...,'--".,," ~9 lll.j± \-----_ ~-.---~ "~'----' I--C : , _29_ f , _3.:....: t3.6 I--~ , ,2-l! _ ,2* ' :..,2,3, ,2'.. _~J9_ ,2,3, :,2 I " f ,2,3, , ,o._. I--.~_JQI~O~.,2 U2~,.. -,~.--.~--.--~ , 33
41 Dynaflect Center- Location of Failure North Bound Lane I tl Begin End Failure Failure Begin Centerline Date: 4/30/69 End Wheel Centerline Path 54,4,2,2 b2~. 2..,.2,2,3,4,2,3 3 ~,2,J ".. 2,2... ~...,2.,3,4,2,3 ----" , ".",,2 3,4. 3,4. 3,4 34
42 Dynaflect S Center Line S Location of Failure North Bound Lane Begin End Begin Failure Failure Centerline Date: 4/30/69 End Wheel Centerline Path Stat" on g5.g_ 32' _. 484.~L ~ '242.4' !~ ' Q_ 3,4 ::l".2. k~... }.,-_... L.hL_-,2,3,4. 3.,2,.3,2,2* 3,4,2,3,4 3,4,2,3,4 l,l.,2.,3,.....,2 J,,,2*,2..,2.,,3.,,4,2 L,2. 3~,.4_.. _,2".3,4,2,3,k.,2.,2.,2,,2,.3,._.,2..,2*,2 2*...,.2,.. :,2. l..t..,2,2.. 2 J..._ ,4. * 35
43 Dynafleet Sta. Center Line Location of Failure North Bound Lane Date: 4/30/69 Begin End Begin End Wheel Failure Failure Centerline Centerline Path I 36
44 Dynafect St..<'l. Center Line St,ati rm Location of Failure North Bound Lane ','j- Begin f End Begin Failure " Failure Centerline,, Date: 4/30/69 End Wheel Centerline Path St.R.tion , '-= =2~56~.~ =2::..::::6;-LO.!...:.5~-l--~ I f-----",,=-30-=-:8:.c::.., I *!---'--r- 37=-=6~.-=;i_+----",;j.=-86:::.c.:2=~:~~-----=--~~~~~-,~-~---~_-~--_-~.;.--~:,'- '::2_'--_,- -_--' ---I ,2 r----"'-<'-'-"-l-..--i---~~' ,---_+t~= l~ 95.5'20~O ':'f-7~~i--~=-=-=-- +_----+_~-'--- H~ ' '4.5' !---,-~~=--+_~~~~ '.5 ~~ ~~ ~:::-::-::-~-I I I+-~j:~- 5' ~~~ ~~ ~~~~-+--=~= ~-_--_~3~~ ,,_42--_ , , ' ' , ).6 c----!7~--!---,----""-'~= +_ ~, '".--~-I----, '-, I--~~=----_l_-~;.:.=--l---- I H- --,--, '8.0 65'..2 ~ * t-- 88:6 ::::..:::..::..;:---+-~~= ' =,.=---2_ , J------=,~-=--- +_-=:;.=-t t i-~.-~2=------i * ,2, , , )02. 5],
45 Dynafleet Sta 03 0L 0) 06 Center Line ' Location of Failure North Bound Lane Begin End Begin Failure Failure Centerline l: "2--" ~ Q.. f-._ ~~}L e_--lqls... ~..,_... "- I :: ,... _ _..M..<3)2.!'~_. _... -,~0:.,L ~_._ f-._...-'so. 2_ _ ~8.".. ::.Q9_ r End Date: 4/30/69 End Wheel Centerline Path,2,2 l,~_,2,2,2,2,2,2~._---_ _....,2, 'i~2'~j~ _-:... ~_8 ~~.Q~ t I
46 APPENDIX D Tabulation of Percent Failures 39
47 TABULATION OF PERCENT FAILURES SBL NBL DYNAFLECT % DYNAFLECT % STATION FAILURE STATION FAILURE L l Overlay Overlay " " ti " ti ti " ti II " " " " ,
48 SBL TABULATION OF PERCENT FAILURES NBL DYNAFLECT % DYNAFLECT % STATION FAILURE STATION FAILURE
49 SBL TABULATION OF PERCENT FAILURES NBL DYNAFLECT % DYNAFLECT % STATION FAILURE STATION FAILURE
New Technologies for Pavement Evaluation
 New Technologies for Pavement Evaluation TxDOT 3-D Pavement Survey Technology For 86 th Annual Transportation Short Course at Texas A&M University, 2012 Dr. Yaxiong (Robin) Huang, Robin.Huang@txdot.gov
Utilization of TSMO Practices in Highway Construction Work Zones: A Case Study
 Utilization of TSMO Practices in Highway Construction Work Zones: A Case Study James Webb, P.E., Iowa Department of Transportation Liz Finarty, P.E., Iowa Department of Transportation James Armstrong,
DARWIN-ME Pavement Analysis and Design Manual for NJDOT
 2012 DARWIN-ME Pavement Analysis and Design Manual for NJDOT Book 1 Pavement Overview, Traffic and Climatic Inputs Vitillo, Nicholas Rutgers - CAIT Pavement Resource Program 1 4/1/2012 Darwin ME Flexible
DEVELOPMENT OF A PROCEDURE FOR ROUTE SEGMENTATION USING PREDICTED LAYER THICKNESSES FROM RADAR MEASUREMENTS
 DEVELOPMENT OF A PROCEDURE FOR ROUTE SEGMENTATION USING PREDICTED LAYER THICKNESSES FROM RADAR MEASUREMENTS FLORIDA DOT STATE PROJECT 99700-7550, PHASE 2A FINAL REPORT PREPARED BY: EMMANUEL G. FERNANDO,
Technical Report Documentation Page 2. Government 3. Recipient s Catalog No.
 . Report No. FHWA/TX-08/0-5708- Technical Report Documentation Page 2. Government 3. Recipient s Catalog No. Accession No. 4. Title and Subtitle Design of CrackScope (VCrack) [Reprint] 7. Author(s) Bugao
Traffic Impact Study for the Girard Winery Project
 October 16, 2014 Ms. Heather McCollister 1512 D Street Napa, CA 94559 Traffic Impact Study for the Girard Winery Project Dear Ms. McCollister; Whitlock & Weinberger Transportation, Inc. (W-Trans) has completed
Data Mining of the Caltrans. Pavement Management System (PMS) Database
 Database") Data Mining of the Caltrans Pavement Management System (PMS) Database Draft report prepared for the California Department of Transportation by Jeremy Lea, Research Engineer Infrastructure Engineering Transportek,
Data Mining of the Caltrans Pavement Management System (PMS) Database Draft report prepared for the California Department of Transportation by Jeremy Lea, Research Engineer Infrastructure Engineering Transportek,
ENHANCED PARKWAY STUDY: PHASE 3 REFINED MLT INTERSECTION ANALYSIS
 ENHANCED PARKWAY STUDY: PHASE 3 REFINED MLT INTERSECTION ANALYSIS Final Report Prepared for Maricopa County Department of Transportation Prepared by TABLE OF CONTENTS Page EXECUTIVE SUMMARY ES-1 STUDY
Road Surface Texture Evaluation with 3-D Laser Data
 Road Surface Texture Evaluation with -D Laser Data Shuvo Islam 1, Mustaque Hossain, and Humaira Zahir ( 1 Kansas State University, Manhattan, KS, USA, sislam@ksu.edu) ( Kansas State University, Manhattan,
Hot-Mix Asphalt and Flexible Pavement Design: the MEPDG
 Hot-Mix Asphalt and Flexible Pavement Design: the MEPDG Kevin D. Hall, Ph.D., P.E. Professor and Head, Dept. of Civil Engineering University of Arkansas Flexible Pavement Research Symposium Denver, Colorado
PAVE-IR OPERATOR S MANUAL. Version 1.2
 PAVE-IR OPERATOR S MANUAL Version 1.2 A Thermal Imaging System for Evaluating Hot-Mix Asphalt Paving Operations by Stephen Sebesta, Tom Scullion, P.E., Wenting Liu, P.E., and Gerry Harrison Product 5-4577-01-P3
Calipatria Solar Farm TIA
 Calipatria Solar Farm TIA Prepared for: 7SM 8ME, LLC 71SM 8ME, LLC c/o 8minutenergy Renewables LLC Prepared by: Fehr & Peers March 25, 211 IE1-37 TABLE OF CONTENTS Executive Summary... i Project Trip Estimates...
FY International City/County Management Association (ICMA) Benchmarking Results
 Benchmarking Results") FY 2010-11 International City/County Management Association (ICMA) Benchmarking Results STREETS HIGHWAY & ROAD MAINTENANCE EQUIPMENT & BUILDING SERVICES FACILITIES & FLEET MAINTENANCE SANITATION SOLID
FY 2010-11 International City/County Management Association (ICMA) Benchmarking Results STREETS HIGHWAY & ROAD MAINTENANCE EQUIPMENT & BUILDING SERVICES FACILITIES & FLEET MAINTENANCE SANITATION SOLID
INPUT DATA PROCEDURES
 79 SECTION 7 INPUT DATA PROCEDURES This section describes the forms and message boxes used to enter input data for an RSRAP optimization problem. These forms and message boxes implement Steps 1 through
Smoothness of Pavement in Weighin-Motion
 Standard Specification for Smoothness of Pavement in Weighin-Motion (WIM) Systems AASHTO Designation: MP 14-05 American Association of State Highway and Transportation Officials 444 North Capitol Street
APPENDIX D. Traffic Impact Analysis
 APPENDIX D Traffic Impact Analysis TRAFFIC IMPACT ANALYSIS CALEXICO SOLAR FARM I County of Imperial, California July 8, 2011 LLG Ref. 3-11-2034 Prepared by: Cara Leone Transportation Planner II Under the
20. Security Classif. (of this page) Unclassified
 Unclassified") Technical Report Documentation Page 1. Report No. FHWA/TX-05/0-1778-3 2. Government Accession No. 3. Recipient s Catalog No. 4. Title and Subtitle ACCESSING THE RIGID PAVEMENT DATABASE THROUGH MICROSOFT
Technical Report Documentation Page 1. Report No. FHWA/TX-05/0-1778-3 2. Government Accession No. 3. Recipient s Catalog No. 4. Title and Subtitle ACCESSING THE RIGID PAVEMENT DATABASE THROUGH MICROSOFT
Data-Mining of State Transportation Agencies Projects Databases
 Data-Mining of State Transportation Agencies Projects Databases Khaled Nassar, PhD Department of Construction and Architectural Engineering, American University in Cairo Data mining is widely used in business
DEVELOPMENT AND IMPLEMENTATION OF PAVEMENT CONDITION INDICES FOR THE VIRGINIA DEPARTMENT OF TRANSPORTATION PHASE I FLEXIBLE PAVEMENTS
 DEVELOPMENT AND IMPLEMENTATION OF PAVEMENT CONDITION INDICES FOR THE VIRGINIA DEPARTMENT OF TRANSPORTATION PHASE I FLEXIBLE PAVEMENTS By K. H. McGhee Pavement Consultant September 2002 TABLE OF CONTENTS
I-96 Case Study: Jointed Concrete Pavement Curling and Warp Presented in the Context of Pavement Asset Management
 I-96 Case Study: Jointed Concrete Pavement Curling and Warp Presented in the Context of Pavement Asset Management Christopher R. Byrum, PhD, PE PAVEMENT ANALYSIS: Soil-Structure Interaction Engineering
P2 MANUAL FOR WEB-BASED TXDOT RIGID PAVEMENT DATABASE. Authors: Sureel Saraf Moon Won
 0-5445-P2 MANUAL FOR WEB-BASED TXDOT RIGID PAVEMENT DATABASE Authors: Sureel Saraf Moon Won TxDOT Project 0-5445: Project Level Performance Database for Rigid Pavements in Texas SEPTEMBER 2007, REV. JULY
SPEED SURVEY ANALYSIS SYSTEM
 SPEED SURVEY ANALYSIS SYSTEM user s manual CROSSROADS SOFTWARE 210 W. Birch Street, Suite 207 Brea, CA 92821 (714) 990-6433 Fax: (714) 990-5628 www.crossroadssoftware.com Chapter One: Introducing the Speed
HISTORIC AMERICAN ENGINEERING RECORD INDEX TO PHOTOGRAPHS. BLACK AND WHITE PHOTOGRAPHS OF HElM BRIDGE
 HISTORIC AMERICAN ENGINEERING RECORD Cerritos Channel Port oflong Beach Los Angeles County California BLACK AND WHITE PHOTOGRAPHS OF HElM BRIDGE Photographer: Stephen Schafer, September 2010 CA-HEIM-l
Detecting and Correcting Localized Roughness Features
 0 0 Detecting and Correcting Localized Features Gary J. Higgins Earth Engineering Consultants, LLC Greenfield Drive Windsor, Colorado 00 Tel: 0--0; Fax: 0--0; Email: garyh@earth-engineering.com Word count:,
Student Guide. Product P2. Validation of TxDOT Flexible Pavement Skid Prediction Model: Workshop
 Student Guide Product 0-6746-01-P2 Validation of TxDOT Flexible Pavement Skid Prediction Model: Workshop Published: May 2017 VALIDATION OF TXDOT FLEXIBLE PAVEMENT SKID PREDICTION MODEL: WORKSHOP by Arif
METROPOLITAN SEWERAGE DISTRICT of Buncombe County, N.C. PIPE RATING PROGRAM. Aqua Salubris
 METROPOLITAN SEWERAGE DISTRICT of Buncombe County, N.C. PIPE RATING PROGRAM Aqua Salubris Pipe Rating Program What is it? A new, proactive program used to define and develop rehabilitation projects. The
Technical Report Documentation Page 2. Government Accession No. 3. Recipient's Catalog No. 1. Report No. FHWA/TX-12/
 1. Report No. FHWA/TX-12/5-5597-01-1 4. Title and Subtitle LABORATORY AND FIELD PERFORMANCE MEASUREMENTS TO SUPPORT THE IMPLEMENTATION OF WARM MIX ASPHALT IN TEXAS Technical Report Documentation Page 2.
Traffic Impact Analysis Shotwell Road Residential Clayton, NC
 Shotwell Road Residential Clayton, NC TABLE O CONTENTS 1. INTROUCTION...1 1.1. Site Location and Study Area...1 1.2. Proposed Land Use and Site Access...2 1.3. Adjacent Land Uses...2 1.4. Existing Roadways...2
Instructions for Using the PMIS MapZapper. Version 3.400
 Instructions for Using the PMIS MapZapper Version 3.400 October 3, 2005 What s New in Version 3.400? Makes maps of one or more districts, one or more counties, one or more maintenance sections, one or
AISIBEAM User's Manual (Version 3.0)
") AISIBEAM User's Manual (Version 3.0) Shabin Taavoni, Ph.D., PE, title Structural Software Inc. location John C. Huang Ph.D., PE, Principal CHC Engineering, LLC Herndon, VA Scope of Software The software
AISIBEAM User's Manual (Version 3.0) Shabin Taavoni, Ph.D., PE, title Structural Software Inc. location John C. Huang Ph.D., PE, Principal CHC Engineering, LLC Herndon, VA Scope of Software The software
Multi-Speed Deflectometer. An innovative tool for local authority network asset management
 Multi-Speed Deflectometer An innovative tool for local authority network asset management What is the MSD? Falling Weight Deflectometer The Multi-Speed Deflectometer (MSD) is a new, innovative technique
Checking the values using backscatter data
 A Technique for using Backscatter Imagery to Calibrate your Multibeam sonar Harold Orlinsky Harold@Hypack.com Checking the values using backscatter data The collection of Backscatter is co located with
Located at Located in the Traffic Signing Category.
 Located at https://mdotjboss.state.mi.us/tssd/tssdhome.htm# Located in the Traffic Signing Category. August 29 th, 2018: The following updates were made to the web site. SIGN-100-G: Dated 05/24/18 - The
CASE 1 TWO LANE TO FOUR LANE DIVIDED TRANSITION GEO-610-C NOT TO SCALE GEOMETRIC DESIGN GUIDE FOR MATCH LINE LINE MATCH. 2 (0.6m) shoulder transition
 shoulder transition") CASE 1 2 (0.6m) Joint Line See sheet #5 for description of variables 4 (1.2m) Transition taper is tangent to Edge of Pavement curve at this point. 1:25 Paved shoulder transition 16 (4.m) Median width 16
CASE 1 2 (0.6m) Joint Line See sheet #5 for description of variables 4 (1.2m) Transition taper is tangent to Edge of Pavement curve at this point. 1:25 Paved shoulder transition 16 (4.m) Median width 16
AASHTOWare BrR - SIMPLE SPAN PRESTRESSED I BEAM EXAMPLE - BR 76015
 AASHTOWare BrR - SIMPLE SPAN PRESTRESSED I BEAM EXAMPLE - BR 76015 M N D O T B R I D G E S T A T E A I D Page 1 PS1 - Simple Span Prestressed I Beam Example (BrR 6.7.1) 1. From the Bridge Explorer create
Coke Drum Laser Profiling
 International Workshop on SMART MATERIALS, STRUCTURES NDT in Canada 2013Conference & NDT for the Energy Industry October 7-10, 2013 Calgary, Alberta, CANADA Coke Drum Laser Profiling Mike Bazzi 1, Gilbert
TUNNELINGS SYSTEM Inspection of brick tunnels and covered ways SSL (Circle, Hammersmith & City and District Lines) LONDON UNDERGROUND LIMITED
 LONDON UNDERGROUND LIMITED") TUNNELINGS SYSTEM Inspection of brick tunnels and covered ways SSL (Circle, Hammersmith & City and District Lines) LONDON UNDERGROUND LIMITED Inspection date: July 6 th 2014 Report date: September 22 nd
TUNNELINGS SYSTEM Inspection of brick tunnels and covered ways SSL (Circle, Hammersmith & City and District Lines) LONDON UNDERGROUND LIMITED Inspection date: July 6 th 2014 Report date: September 22 nd
GRID. Geospatial Roadway Inventory Database. Michael Chamberlain, TxDOT. TPP Planning Conference Houston, TX
 GRID Geospatial Roadway Inventory Database Michael Chamberlain, TxDOT TPP Planning Conference - 2016 Houston, TX Topics 1 2 3 4 5 6 7 8 History (pre GRID) 3-6 GIS Resources 7-8 The Project 9-11 Assets
Chapter 5. Track Geometry Data Analysis
 Chapter Track Geometry Data Analysis This chapter explains how and why the data collected for the track geometry was manipulated. The results of these studies in the time and frequency domain are addressed.
PE Exam Review - Surveying Demonstration Problem Solutions
 PE Exam Review - Surveying Demonstration Problem Solutions I. Demonstration Problem Solutions... 1. Circular Curves Part A.... Circular Curves Part B... 9 3. Vertical Curves Part A... 18 4. Vertical Curves
Coop!=R A "Tl\fF TRANSPORT P.\TIO~J TEXAS. INSTiTUTE
 Til-2-8-69-136-3 TEXAS TRANSPORT P.\TIO~J INSTiTUTE HIG,~\ I \'.\'I l.-r-. i..,i j DEP.~!\RT iv\er-.it Coop!=R A "Tl\fF ~... "'. j, a i _ A GRAPHICAL TECHNIQUE FOR DETERMINING THE ELASTIC MODULI~OF A TWO-LAYERED
20. Security Classification.(of this page) Unclassified
 Unclassified") Technical Report Documentation Page 1. Report No. FHWA/TX-09/0-6004-1 2. Government Accession No. 3. Recipient's Catalog No. 4. Title and Subtitle A PORTABLE PROFILER FOR PAVEMENT PROFILE MEASUREMENTS
Technical Report Documentation Page 1. Report No. FHWA/TX-09/0-6004-1 2. Government Accession No. 3. Recipient's Catalog No. 4. Title and Subtitle A PORTABLE PROFILER FOR PAVEMENT PROFILE MEASUREMENTS
A New Rutting Measurement Method Using Emerging 3D Line-Laser-Imaging System
 Technical Paper ISSN 1997-1400 Int. J. Pavement Res. Technol. 6(5):667-672 Copyright @ Chinese Society of Pavement Engineering A New Rutting Measurement Method Using Emerging 3D Line-Laser-Imaging System
Rutgers Interactive Lane Closure Application (RILCA) for Work Zone Planning User Manual. New Jersey Highway Authority. Garden State Parkway
 for Work Zone Planning User Manual. New Jersey Highway Authority. Garden State Parkway") Rutgers Interactive Lane Closure Application (RILCA) for Work Zone Planning User Manual Prepared for Garden State Parkway New Jersey Highway Authority April 2007 Developed by: Rutgers University Intelligent
Rutgers Interactive Lane Closure Application (RILCA) for Work Zone Planning User Manual Prepared for Garden State Parkway New Jersey Highway Authority April 2007 Developed by: Rutgers University Intelligent
Texas Transportation Institute The Texas A&M University System College Station, Texas
 1. Report No. FHWA/TX-06/0-5210-1 4. Title and Subtitle ANALYSIS OF THE IMPACT PERFORMANCE OF CONCRETE MEDIAN BARRIER PLACED ON OR ADJACENT TO SLOPES 2. Government Accession No. 3. Recipient's Catalog
T otal E nvironmental Management for P aving
 6 F 3 F 9 F 12 F 15 F 75% % 1% Remote Maturity Monitoring Using the Virginia Concrete Conference 11 March 25 Richmond, Virginia presented by: Dennis J. Turner, M.S.E. Project Manager, The Transtec Group,
Appendix B: Vehicle Dynamics Simulation Results
 Appendix B: Vehicle Dynamics Simulation Results B-1 Vehicle dynamic analyses were undertaken for the three barrier types under each of the curve, shoulder, and barrier placement factors identified. This
TECH FACTS WELDED WIRE REINFORCEMENT FOR CIRCULAR CONCRETE PIPE. Excellence Set in Concrete.
 TECH FACTS TF 306-R-10 Excellence Set in WIRE REINFORCEMENT INSTITUTE 942 Main Street Suite 300 Hartford, CT 06103 (800) 552-4WRI [4974] WELDED WIRE REINFORCEMENT FOR CIRCULAR CONCRETE PIPE pipe producers
Expediting Nevada DOT s Crash Analysis through a Multilevel Linear Referencing System Session 6.3 Crashes
 Expediting Nevada DOT s Crash Analysis through a Multilevel Linear Referencing System Session 6.3 Crashes Grahame Ross, Nevada Department of Transportation Wednesday, April 18, 2012 Insert Company Logo
Rural Expressway Intersection Characteristics that Contribute to Reduced Safety Performance
 Rural Expressway Intersection Characteristics that Contribute to Reduced Safety Performance Garrett D. Burchett Center for Transportation Research and Education Iowa State University 2901 South Loop Drive,
Roadway Alignments and Profiles
 NOTES Module 15 Roadway Alignments and Profiles In this module, you learn how to create horizontal alignments, surface profiles, layout (design) profiles, and profile views in AutoCAD Civil 3D. This module
2.3. Quality Assurance: The activities that have to do with making sure that the quality of a product is what it should be.
 5.2. QUALITY CONTROL /QUALITY ASSURANCE 5.2.1. STATISTICS 1. ACKNOWLEDGEMENT This paper has been copied directly from the HMA Manual with a few modifications from the original version. The original version
Statistical and Econometric Methods for Transportation Data Analysis
 Statistical and Econometric Methods for Transportation Data Analysis Chapter 14 Ordered Probability Models Example 14.2 Ordered Discrete Data Ordered Probit with Random Effects A survey of 56 subjects
Evaluation of a structural testing system
 Retrospective Theses and Dissertations Iowa State University Capstones, Theses and Dissertations 2007 Evaluation of a structural testing system Anthony Samuelson Iowa State University Follow this and additional
Form DOT F (8-72) Technical Report Documentation Page 2. Government Accession No. 3. Recipient's Catalog No.
 Technical Report Documentation Page 2. Government Accession No. 3. Recipient's Catalog No.") 1. Report No. FHWA/TX-09/5-4577-03-P1 4. Title and Subtitle PAVE-IR OPERATOR S MANUAL VERSION 1.3 Technical Report Documentation Page 2. Government Accession No. 3. Recipient's Catalog No. 5. Report Date
1. Report No. FHWA/TX-09/5-4577-03-P1 4. Title and Subtitle PAVE-IR OPERATOR S MANUAL VERSION 1.3 Technical Report Documentation Page 2. Government Accession No. 3. Recipient's Catalog No. 5. Report Date
Overview September 7, 2017
 Overview September 7, 2017 Purpose The purpose of this presentation is to provide an overview of the changes to the required deliverables and workflow for developing plans and models for Illinois DOT projects
3D TECHNOLOGY FOR PAVEMENT PRESERVATION
 3D TECHNOLOGY FOR PAVEMENT PRESERVATION Technical Discussion for WASHTO 2015 Magdy Mikhail, P.E. Robin Huang Todd Copenhaver Footer Text March 23, 2015 Date Capabilities of 3D Technology for Pavement Preservation
AED Design Requirements: Superelevation Road Design
 US Army Corps of Engineers Afghanistan Engineer District AED Design Requirements: Various Locations, Afghanistan MARCH 2009 TABLE OF CONTENTS AED DESIGN REQUIREMENTS FOR SUPERELEVATION ROAD DESIGN VARIOUS
DW-2016 C3D Template.dwt
 Section 10.1 DW-2016 C3D Template.dwt Overview - Section 10.1 This template is a Civil 3D template containing DW Engineering sections title blocks for Design Drafting, Distribution, and Survey. Each title
Polymer-Modified Asphalts Enhancing HMA Performance. New Orleans, Louisiana January 28, 2003
 Polymer-Modified Asphalts Enhancing HMA Performance New Orleans, Louisiana January 28, 2003 Presentation Overview 1. Introduction 2. Phase I Overview 3. Summary of Interim Results & Findings Study Objectives
1.4.3 OPERATING SPEED CONSISTENCY
 Geometric Design Guide for Canadian oads 1.4.3 OPEATING SPEED CONSISTENCY The safety of a road is closely linked to variations in the speed of vehicles travelling on it. These variations are of two kinds:
INTRODUCTION TO VOLUME MEASUREMENTS Volume measurements are needed for three different categories of pay items:
 INTRODUCTION TO VOLUME MEASUREMENTS Volume measurements are needed for three different categories of pay items: Earthwork --items such as borrow excavation, and subsoil excavation Concrete -- the various
Introduction Texture/Friction Measurement at Winnipeg International Airport Data Analysis Conclusions
 Texture/Friction Measurements and Analysis at Runway 13-31 of James Armstrong Richardson International Airport in Winnipeg Qingfan Liu, EIT, PhD candidate, University of Manitoba Ahmed Shalaby, PhD, P.
FIELD EXPERIMENT TO IDENTIFY POTENTIALS OF APPLYING BLUETOOTH TECHNOLOGY TO COLLECT PASSENGER VEHICLE CROSSING TIMES AT T H E U. S.
 FIELD EXPERIMENT TO IDENTIFY POTENTIALS OF APPLYING BLUETOOTH TECHNOLOGY TO COLLECT PASSENGER VEHICLE CROSSING TIMES AT T H E U. S. -MEXICO BORDER by Rajat Rajbhandari Texas Transportation Institute Project
Cross Slope Collection using Mobile Lidar
 Cross Slope Collection using Mobile Lidar ACEC/SCDOT Annual Meeting December 2, 2015 Introduction Adequate cross slopes on South Carolina Interstates result in: Proper drainage Enhance driver safety by
Evaluation of Caltrans Automated Warning System Caltrans District 10 Stockton, California. Status Report Winter 2002
 Evaluation of Caltrans Automated Warning System Caltrans District 10 Stockton, California Status Report Winter 2002 Loragen Corporation _ Advanced Transportation Research Characteristics of Fog-related
VLA Test Memorandum 102. Site Coordinate Systems and Conversions. C. M. Wade 20 February 1974
 VLA Test Memorandum 102 Site Coordinate Systems and Conversions C. M. Wade 20 February 1974 MAR 1 3 1974 Abstract The conversions between geodetic coordinates, the New Mexico State Plane Coordinate System,
JCE 4600 Fundamentals of Traffic Engineering. Horizontal and Vertical Curves
 JCE 4600 Fundamentals of Traffic Engineering Horizontal and Vertical Curves Agenda Horizontal Curves Vertical Curves Passing Sight Distance 1 Roadway Design Motivations Vehicle performance Acceleration
Performance Evaluation of Non-Intrusive Methods for Traffic Data Collection. Kamal Banger, Ministry of Transportation of Ontario
 Abstract Performance Evaluation of Non-Intrusive Methods for Traffic Data Collection Kamal Banger, Ministry of Transportation of Ontario Nancy Adriano, P.Eng., Ministry of Transportation of Ontario For
Use Math to Solve Problems and Communicate. Level 1 Level 2 Level 3 Level 4 Level 5 Level 6
 Number Sense M.1.1 Connect and count number words and numerals from 0-999 to the quantities they represent. M.2.1 Connect and count number words and numerals from 0-1,000,000 to the quantities they represent.
CONFIRMATION OF VERTICAL SURVEY CONTROL IN THE BIRDS POINT-NEW MADRID FLOODWAY Final Report 10/27/2015
 Reply to Attention of: DEPARTMENT OF THE ARMY MEMPHIS DISTRICT CORPS OF ENGINEERS 167 NORTH MAINSTREET B-202 MEMPHIS, TENNESSEE 38103-1894 CONFIRMATION OF VERTICAL SURVEY CONTROL IN THE BIRDS POINT-NEW
Speed Limit and Safety Nexus Studies for Automated Enforcement Locations in the District of Columbia Inside Southern part of 3rd Street Tunnel
 Speed Limit and Safety Nexus Studies for Automated Enforcement Locations in the District of Columbia Inside Southern part of 3rd Street Tunnel Study Area and Location District PSA Ward ANC Phase Description
Request for FTE Design Exceptions & Variations Checklist
 District: Project Name: Project Section BMP: EMP: Exemption BMP: EMP: Request for FTE Design Exceptions & Variations Checklist FPID: New Construction RRR Requested Control Element(s): Design Speed* Horizontal
Applied Research Associates. Release Notes. Build
 Applied Research Associates Release Notes Build 2.0.19 January 22 nd 2014 Contents 1 INTRODUCTION... 3 2 ENHANCEMENTS... 3 3 ISSUES RESOLVED... 4 4 OUTSTANDING ISSUES... 13 5 FAQ... 14 6 UPGRADING... 15
Development of Warm Mix Asphalt Policies and Specifications in Minnesota
 Development of Warm Mix Asphalt Policies and Specifications in Minnesota Tim Clyne, Greg Johnson, John Garrity MnDOT 2 nd International Warm Mix Conference October 13, 2011 Acknowledgements MnDOT Greg
1995 Metric CSJ 's & SPECIAL PROVISION ITEM 4. Scope of Work
 1995 Metric CSJ 's 0015-13-235 & 3136-01-098 SPECIAL PROVISION TO ITEM 4 Scope of Work For this project, Item 4, "Scope of Work", of the Standard Specifications, is hereby amended with respect to the clauses
Pavement Preservation and the Role of Bituminous Surface Treatments A Washington State View. Minnesota Pavement Conference February 14, 2008
 Pavement Preservation and the Role of Bituminous Surface Treatments A Washington State View Minnesota Pavement Conference February 14, 2008 1 The Situation 2 WSDOT policy, in essence, mandated use of BSTs
GEOGRAPHIC INFORMATION SYSTEMS Lecture 18: Spatial Modeling
 Spatial Analysis in GIS (cont d) GEOGRAPHIC INFORMATION SYSTEMS Lecture 18: Spatial Modeling - the basic types of analysis that can be accomplished with a GIS are outlined in The Esri Guide to GIS Analysis
DW-2016 Details_CPCS_EngStds.dwt
 Section 10.4 DW-2016 Details_CPCS_EngStds.dwt Overview - Section 10.4 This template shall be used to create detail drawings for DW Engineering Standards and the Capital Projects Construction Standards
Summary of Findings. Living Room with standard 1 filter. Initial Test in Living. 4 months later in Living Room with CirrusAir
 In March and July 2013, CirrusAir Technologies, Inc. contracted independent testing services, Cleanroom Consultants and Certifications of Houston, TX to test a home installed with a CirrusAir Strata Plus.
SIMULATION AND ANALYSIS OF ARTERIAL TRAFFIC OPERATIONS ALONG THE US 61 CORRIDOR IN BURLINGTON, IOWA FINAL REPORT
 SIMULATION AND ANALYSIS OF ARTERIAL TRAFFIC OPERATIONS ALONG THE US 61 CORRIDOR IN BURLINGTON, IOWA FINAL REPORT Principal Investigator Tom Maze Principal Contributor Ali Kamyab Sponsored by the Engineering
Economic Crash Analysis Tool. Release Notes
 Release Notes August 2017 Release: 1. Project Information Worksheet: a. Update: Removed the design exception report option b. Enhancement: The first question has been expanded to provide better clarity
A New Way to Control Mobile LiDAR Data
 A New Way to Control Mobile LiDAR Data Survey control has always been a critically important issue when conducting mobile LiDAR surveys. While the accuracies currently being achieved with the most capable
An Analysis of TDM Impacts on a Corridor Segment Research Findings
 An Analysis of TDM Impacts on a Corridor Segment Research Findings Phil Winters, CUTR TDM Program Director Liren Zhou, Graduate Research Assistant Sachin Rai, ITS Research Associate Nevine Georggi, TDM
Three-Dimensional Analysis of Sight Distance on Interchange Connectors
 TRANSPOR'IAT/ON RESEARCH RECORD 1445 101 Three-Dimensional Analysis of Sight Distance on Interchange Connectors EDDIE SANCHEZ The design of interchange ramps and connectors, especially in large freeway-to-freeway
Evaluating the Performance of a Vehicle Pose Measurement System
 Evaluating the Performance of a Vehicle Pose Measurement System Harry Scott Sandor Szabo National Institute of Standards and Technology Abstract A method is presented for evaluating the performance of
Future Federal Aviation Administration (FAA) Developments of Roughness Evaluation for In-Service Airport Pavement
 Developments of Roughness Evaluation for In-Service Airport Pavement") Future (FAA) Developments of Roughness Evaluation for In-Service Airport Pavement Presented to: 2018 European Road Profile Users Group Madrid, Spain By: Albert Larkin, FAA Airport Pavement R & D, Dr. B.
Future (FAA) Developments of Roughness Evaluation for In-Service Airport Pavement Presented to: 2018 European Road Profile Users Group Madrid, Spain By: Albert Larkin, FAA Airport Pavement R & D, Dr. B.
Patch Test & Stability Check Report
 Patch Test & Stability Check Report Storebælt, 2009 SB Cable Project CT Offshore Final Report November, 2009 SB Cable Project November 2009 8-10 Teglbaekvej DK-8361 Hasselager Aarhus, Denmark Tel: +45
OPTIMIZING 3D SURFACE CHARACTERISTICS DATA COLLECTION BY RE-USING THE DATA FOR PROJECT LEVEL ROAD DESIGN
 OPTIMIZING 3D SURFACE CHARACTERISTICS DATA COLLECTION BY RE-USING THE DATA FOR PROJECT LEVEL ROAD DESIGN Benoit Petitclerc, P.E. John Laurent, M. Sc Richard Habel, M. Sc., Pavemetrics Systems Inc., Canada
Todd V. Scholz, Ph.D., P.E. Roadworthy Research & Design 1580 Royal Drive Reno, NV and
 LIFE CYCLE COSTS FOR LIME IN HOT MIX ASPHALT VOLUME III - LCCA SOFTWARE USER S GUIDE by Todd V. Scholz, Ph.D., P.E. Roadworthy Research & Design 1580 Royal Drive Reno, NV 89503 and R.G. Hicks, P.E. Professor
Georeferencing West Virginia DOT s Roadside Assets: An Asset Inventory Case Study. Geoff Dew April 13,
 : An Asset Inventory Case Study Geoff Dew April 13, 2010 General Project Scope 17,817 miles collected across all systems. System Type Delivered Miles 1 Interstates 1100.820 2 US Routes 2184.538 3 WV Routes
10600 sq. feet. Left 33.8 left of CL at elev Right 33.4 right of CL at elev 871.1
 NAME Score CEEN 113-1 Engineering Measurements Final Exam Fall 1999 Open Book, Closed Note, Calculator Required 3 Hour Time Limit 1 point deduction for every two minutes over 1. (5 pts) Your boss has asked
Civil 3-D PROFILE CREATION
 Civil 3-D PROFILE CREATION 1 Alignment Overview: As in previous CAD versions, an alignment is a line that describes where you intend the centerline of your planned work to be. That s all. But, in Civil
COLLEGE OF ENGINEERING COURSE AND CURRICULUM CHANGES. October 19, Rathbone Hall. 3:30pm. Undergraduate/Graduate EXPEDITED
 COLLEGE OF ENGINEERING COURSE AND CURRICULUM CHANGES To be considered at the College Course and Curriculum Meeting October 19, 2012 2064 Rathbone Hall 3:30pm Undergraduate/Graduate EXPEDITED Contact Person:
Portable Work Zone Data Collection. Blaine Van Dyke ODOT ITS Designer
 Portable Work Zone Data Collection Blaine Van Dyke ODOT ITS Designer Year 1 Construction Zone Travel Time project. Provide work zone information to public. Test OSU Bluetooth travel time sensors in new
Use Veta to analyze the data for coverage uniformity and intelligent compaction measurement values.
 Replace section 30-6 with: 30-6.01 PAVEMENT RECYCLING WITH INTELLIGENT COMPACTION 30-6.01A GENERAL 30-6.01A(1) Summary Section 30-6 includes specifications for compaction of cold in-place recycling (CIR)
Interactive Highway Safety Design Model (IHSDM) Workshop Nevada DOT Las Vegas, NV February 13, 2014
 Workshop Nevada DOT Las Vegas, NV February 13, 2014") Interactive Highway Safety Design Model (IHSDM) Workshop Nevada DOT Las Vegas, NV February 13, 2014 Overview Hands-on Exercises: IHSDM Crash Prediction Module (CPM) The Crash Prediction Module estimates
Interactive Highway Safety Design Model (IHSDM) Workshop Nevada DOT Las Vegas, NV February 13, 2014 Overview Hands-on Exercises: IHSDM Crash Prediction Module (CPM) The Crash Prediction Module estimates
L. McGrath & K. Maser Infrasense, Inc., Arlington, Massachusetts, United States
 Determining Asphalt Thickness Using Ground Penetrating Radar - A Comparison of Automated and Manual Methods Using Falling Weight Deflectometer Back-calculation Error Correction L. McGrath & K. Maser Infrasense,
Addendum: Final Design Noise Analysis Study Noise Sensitive Area (NSA) 11 Post March 15, 2016 Open House Response to Comments
 11 Post March 15, 2016 Open House Response to Comments") Final Design Township of Lower Makefield, Bucks County, Pennsylvania Township of Ewing, Mercer County, New Jersey Addendum: Final Design Noise Analysis Study Noise Sensitive Area (NSA) 11 Post March 15,
Final Design Township of Lower Makefield, Bucks County, Pennsylvania Township of Ewing, Mercer County, New Jersey Addendum: Final Design Noise Analysis Study Noise Sensitive Area (NSA) 11 Post March 15,
Hands-on Exercise. All samples files are installed to the following folders depending on the OS:
 Hands-on Exercise All samples files are installed to the following folders depending on the OS: Windows XP - C:\Documents and Settings\All Users\Shared Documents\Veta 4 Samples Windows 7+ - C:\Users\Public\Public