Student Guide. Product P2. Validation of TxDOT Flexible Pavement Skid Prediction Model: Workshop
|
|
|
- Molly Fields
- 5 years ago
- Views:
Transcription


1 Student Guide Product P2 Validation of TxDOT Flexible Pavement Skid Prediction Model: Workshop Published: May 2017
2
3 VALIDATION OF TXDOT FLEXIBLE PAVEMENT SKID PREDICTION MODEL: WORKSHOP by Arif Chowdhury Assistant Research Engineer Texas A&M Transportation Institute Product P2 Project Project Title: Validation of TxDOT Flexible Pavement Skid Prediction Model Performed in cooperation with the Texas Department of Transportation and the Federal Highway Administration Published: May 2017 TEXAS A&M TRANSPORTATION INSTITUTE College Station, Texas
4
5 TxDOT Flexible Pavement Skid Prediction Model: Workshop Date: TBD Location: TxDOT Construction Division, Cedar Park, Texas Contacts: Arif Chowdhury, Agenda Time Module Instructor Course Materials: Background summary of Research Project Short presentation of research tasks and findings from Research Project Aggregate characterization with Aggregate Imaging Measurement System (AIMS) and Micro-Deval device. Demonstration of Skid Analysis of Asphalt Pavement (SAAP) software (installation, new features). Several examples that run the revised program, including hot-mix asphalt (HMA), seal coat, aggregate sources and properties, aggregate combinations, average annual daily traffic (AADT), and truck traffic. Limitations of SAAP. Future work. Open discussion. 1
6
7 Module 1: Background and Research Findings of TxDOT Research Project and TxDOT Research Project PowerPoint Presentation 3
8 4
9 5

10 6
11 7


12 8

13 9


14 10
15 11

16 12
17 13
18 14


19 15
20 16

21 17

22 18
23 19

24 20
25 21

26 22
27 23
28 24
29 25

30 26
31 27
32
33 Module 2: Aggregate Characterization Aggregate Polishing with Micro-Deval Aggregate Image Measurements System 29
34
35 Module 3: SAAP User Guide Research Report documents the research effort and the skid prediction models for asphalt mixtures and seal coat surfaces, respectively, under TxDOT Research Project Both of these models feature similar inputs and equations with only minor variations. In order to simplify the calculation of predicted skid numbers, a desktop computer application was developed based on the macro tool developed earlier under Research Project Under the follow-up study, Research Project , a computer application named SAAP was developed using Access-based Visual Basic Application (VBA) language to execute the steps needed to calculate the skid resistance of asphalt pavement as a function of traffic. This section describes the program and the steps needed to calculate the pavement skid resistance for both asphalt mixture surfaces and seal coat surfaces. In the folder named Application, the application has two Microsoft Access files an application file and a data file and another folder called Export. Once the user opens the application file by double clicking, he/she will notice the first page (Figure 1). This About page describes the function of the SAAP application. On the next page (Figure 2), the user needs to input a new project name or select one of the existing projects in order to proceed to the next window. Next, the user selects the type of pavement surface (Figure 3) asphalt mixture or surface treatment. Depending on the type of surface selected, the application uses the appropriate prediction model. The inputs for both asphalt mixtures and seal coat surfaces are similar. In the next step (Figure 4), the mixture gradation is inputted to the application. The user can either enter the gradation or select one of the standard mixture gradations used in the state of Texas. Similarly, if surface treatment is selected as the pavement surface, the user can either enter the gradation or select the standard aggregate grade. If the user elects to enter the gradation manually by selecting the Input Gradation radio button, a separate window pops up (Figure 5), where the amount of percent passing for selected sieves is entered. The user can select any number of sieves (minimum four) and enter the percent passing values for each selected sieve. This information is used to calculate the scale and shape factors (λ and κ) of the combined gradation. 31

36 Figure 1. Initial Window of the Program. Figure 2. Project Name Input. 32
37 Figure 3. Pavement Surface Type Input. Figure 4. Choice of Mixture Type. 33
38 Figure 5. Manual Aggregate Gradation Input. In the next few steps, the aggregate texture and angularity values measured using AIMS are entered. The window shown in Figure 6 provides the option to input either the texture/angularity measured at two points (before polishing and after polishing for 105 minutes in the Micro-Deval) or the texture/angularity measured at three points (before polishing, after polishing for 105 minutes in the Micro-Deval, and after polishing for 180 minutes). The use of three data points provides a more accurate estimation of aggregate resistance to polishing. This step will be followed by the appearance of windows to enter the texture data of aggregates from one or more sources. The user can select up to three aggregate sources used in the mixture. As shown in Figure 7, users can input the texture value of the component aggregate source(s). In the same window, the user needs to input the percentage ratio of each aggregate source relative to the combined gradation and the percent retained on the No. 4 sieve for each of the sources. This information is required to calculate the weighted average of texture and angularity of combined gradation when two or more aggregate sources are used. Figure 8 shows the window that pops up if the user opts for three data points (Figure 6). Similar to Figure 7, the user inputs the ratio of aggregate in combined 34

39 gradation and amount of percent retained on the No. 4 sieve for each source as well as the texture data measured by AIMS at three different polishing levels. For the next step, the user inputs aggregate angularity data similar to aggregate texture data. The screen shown in Figure 9 or Figure 10 pops up, depending on whether the user selected two data points or three data points for the texture/angularity measurement (Figure 6). Figure 6. Selection of AIMS Test Data Points. Figure 7. Aggregate Texture Input for Two Data Points. 35

40 Figure 8. Aggregate Texture Input for Three Data Points. Figure 9. Aggregate Angularity Input for Two Data Points. 36
 of the pavement. There are two options: the user can enter the MPD value or let SAAP estimate the MPD values.")
41 Figure 10. Aggregate Angularity Input for Three Data Points. Once the user enters the aggregate angularity data and clicks the Next button, a new window (Figure 11) appears. At this stage, the user enters the mean profile depth (MPD) of the pavement. There are two options: the user can enter the MPD value or let SAAP estimate the MPD values. The user can input the measure of MPD for that particular mixture or grade (seal coat). It is preferred to have the measurement done at the initial stage of the pavement s service life. The SAAP projects the reduction of the MPD throughout its service life based on the traffic count. Alternately, the user can select the SAAP estimation option. That way, SAAP estimates the MPD values based on the shape and scale factors calculated from combined aggregate gradation and traffic count. 37
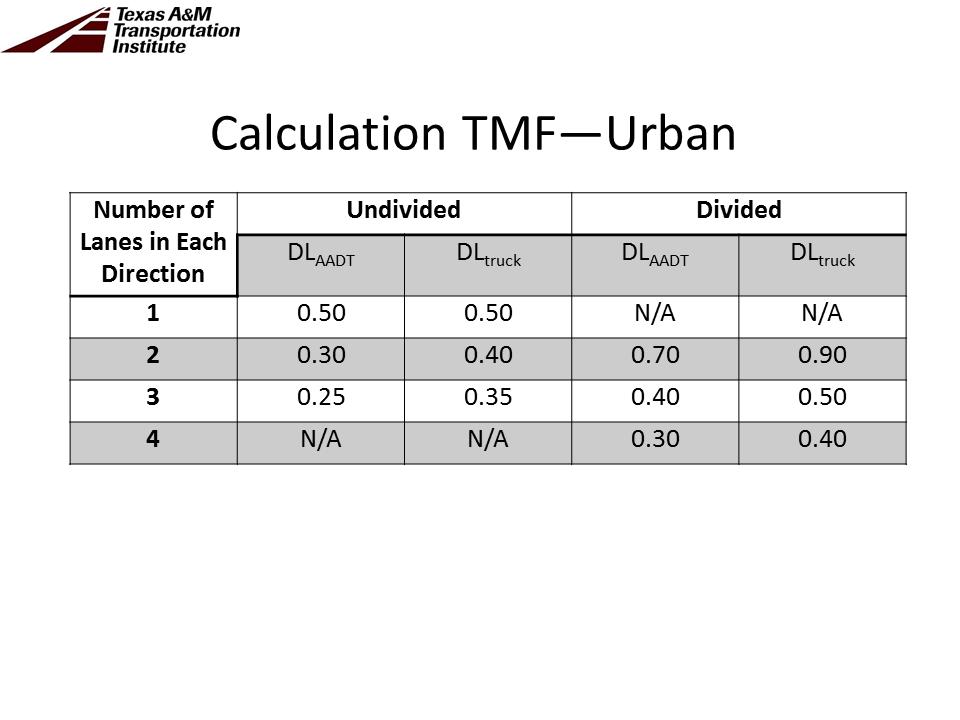
42 Figure 11. Mean Profile Depth Input. After entering the MPD information, the user inputs the highway configuration and traffic data (Figure 12). In this step, the user enters the information about the highway type (rural/urban or divided/undivided), the total number of through traffic lanes in each direction, the total AADT for both directions (for undivided highway, K roadbed) or the AADT for each direction (for divided highway, R or L roadbed), and the percent truck traffic (Figure 12). Using this information, the application calculates the adjusted AADT for the design lane. Again, the adjusted AADT is used to calculate the Traffic Multiplication Factor (TMF). Please note that the current application does not consider the traffic growth factor. When the user clicks the Next button, as shown in Figure 12, the software generates the skid number for 15 years at 1-year intervals starting from Year 1. 38
43 Figure 12. Highway Type and Traffic Data Input. The next step (Figure 13) in the software provides options on how the user wants to see the output. In this window, there are three options for the display of results. The first option is to obtain a prediction of skid resistance as a function of years in service (up to 15 years). This chart also contains the project and prediction (iteration) number in the top left corner. The user can also print the chart by clicking the Print tab (Figure 14). 39

44 Figure 13. Output Data Display Options. 40
45 Figure 14. Skid Prediction Chart for 15 Years. The second option is to get a classification of the pavement section based on its skid resistance after a specified number of years and corresponding threshold values. If the user selects Classify an Asphalt Pavement Section Based on Its Skid Resistance, a window (Figure 15) pops up in which the user needs to input some additional information required for pavement classification. These input parameters are: The length of service life in years for which a pavement section will be classified. The skid resistance threshold values based on how a pavement section will be classified (Figure 14). The first threshold value is the acceptable skid number above which the designer is not concerned. The second threshold value is the skid number above which (but below the acceptable value) one should monitor the surface condition more frequently and below which one should take corrective measure to restore surface friction. After clicking on the Set button, a window with the pavement classification will be presented (Figure 16). Depending on the predicted skid number at the end of 41

46 service life and designer-selected threshold values, the pavement skid performance is classified as high, medium, or low. For display purposes, the high, medium, and low skid performances are shown in a green, yellow, and red bar chart, respectively. Figure 15. Selection of Thresholds or Aggregate Classification. 42
47 Figure 16. Sample Aggregate Classification Based on Skid Performance. The third option for displaying the data is to export the input and output data into a Microsoft Excel spreadsheet. By clicking this button, the user can export the input and output file in a separate folder. Once the user selects this option, a new window (Figure 17. Saving Input and Output Spreadsheet Files. opens. The user has the option to change the input file name and the location folder. Once the input file is saved, the same window provides the option to save the output file, where the user can save the output file in a different name and location folder. Figure 18. Sample Input Spreadsheet. and Figure 19. Sample Output Spreadsheet. show sample input and output data in a spreadsheet. The Input file records all the data or preferences selected by the user, including the comments. The output file shows the projected skid number, IFI, MPD, and adjusted traffic count for each year starting from Year 1 to 15. The application can be terminated by clicking the Exit Application button. The application saves all the input data entered previously. The user can also navigate through the application by clicking the tabs located on top of the windows. Detailed information regarding the development of these models and software can be found in Research Report FHWA/TX-17/ , Validation of Asphalt Mixture Pavement Skid Prediction Model and Development of Skid Prediction Model for Surface Treatments at 43

48 Figure 17. Saving Input and Output Spreadsheet Files. Figure 18. Sample Input Spreadsheet. 44
49 Figure 19. Sample Output Spreadsheet. 45
50
51 Limitations of SAAP The limitations of SAAP include the following: Software cannot be used to predict the skid resistance of concrete pavement. Software can handle up to three aggregate sources but can be modified to include more sources. Software cannot handle mixture with Recycled Asphalt Pavement (RAP) or Lime Rock Asphalt (LRA). AIMS cannot characterize them. Prediction model is based on skid number measured at 50 mph and with smooth tires. Calibration of models is required for different conditions. AIMS characterization (texture especially) of multicolored rocks is challenging. Skid prediction does not work for pavements with excessive bleeding and flushing. Aggregates passing a No. 4 sieve have no effect. They can be modified down to a No. 8 sieve, though. The limiting factor is the ability of AIMS to characterize the texture of aggregate smaller sizes. Traffic growth factor was not included in the cumulative traffic calculation, but it can be modified in the future. Lane distribution factors for passenger vehicle and truck traffic are based on limited data. Future work should revisit this issue. Default shape and scale factors (λ & κ) for a given mixture gradation were calculated based on a gradation curve passing through the middle of the respective gradation band. Inputting the actual combined aggregate gradation provides the most accurate shape and scale factor. 47
52
Pavement Surface Microtexture: Testing, Characterization and Frictional Interpretation
 Pavement Surface Microtexture: Testing, Characterization and Frictional Interpretation S h u o L i, S a m y N o u r e l d i n, K a r e n Z h u a n d Y i J i a n g Acknowledgements This project was sponsored
New Technologies for Pavement Evaluation
 New Technologies for Pavement Evaluation TxDOT 3-D Pavement Survey Technology For 86 th Annual Transportation Short Course at Texas A&M University, 2012 Dr. Yaxiong (Robin) Huang, Robin.Huang@txdot.gov
INPUT DATA PROCEDURES
 79 SECTION 7 INPUT DATA PROCEDURES This section describes the forms and message boxes used to enter input data for an RSRAP optimization problem. These forms and message boxes implement Steps 1 through
3D TECHNOLOGY FOR PAVEMENT PRESERVATION
 3D TECHNOLOGY FOR PAVEMENT PRESERVATION Technical Discussion for WASHTO 2015 Magdy Mikhail, P.E. Robin Huang Todd Copenhaver Footer Text March 23, 2015 Date Capabilities of 3D Technology for Pavement Preservation
Aggregate Blending Model for Hot Mix Asphalt Using Linear Optimization. Khaled A. Kandil and Al-Sayed A. Al-Sobky
 Aggregate Blending Model for Hot Mix Asphalt Using Linear Optimization Khaled A. Kandil and Al-Sayed A. Al-Sobky Public Works Department, Faculty of Engineering, Ain Shams University, Cairo, Egypt k_kandil@hotmail.com
DARWIN-ME Pavement Analysis and Design Manual for NJDOT
 2012 DARWIN-ME Pavement Analysis and Design Manual for NJDOT Book 1 Pavement Overview, Traffic and Climatic Inputs Vitillo, Nicholas Rutgers - CAIT Pavement Resource Program 1 4/1/2012 Darwin ME Flexible
Aggregate particle wear and the tyre / surface interface
 Aggregate particle wear and the tyre / surface interface David Woodward, Phillip Millar and Chris Tierney Ulster University Owen Ardill Highways England Ramesh Perera AECOM ABSTRACT This paper considers
Instructions for Using the PMIS MapZapper. Version 3.400
 Instructions for Using the PMIS MapZapper Version 3.400 October 3, 2005 What s New in Version 3.400? Makes maps of one or more districts, one or more counties, one or more maintenance sections, one or
INDOT SEAL COAT DESIGN SOFTWARE MANUAL. Version 1.0.1
 INDOT SEAL COAT DESIGN SOFTWARE MANUAL Version 1.0.1 May 2011 DISCLAIMER The contents of this manual do not necessarily reflect the official views or policies of the Indiana Department of Transportation
Interactive Highway Safety Design Model (IHSDM) Workshop Nevada DOT Las Vegas, NV February 13, 2014
 Workshop Nevada DOT Las Vegas, NV February 13, 2014") Interactive Highway Safety Design Model (IHSDM) Workshop Nevada DOT Las Vegas, NV February 13, 2014 Overview Hands-on Exercises: IHSDM Crash Prediction Module (CPM) The Crash Prediction Module estimates
Interactive Highway Safety Design Model (IHSDM) Workshop Nevada DOT Las Vegas, NV February 13, 2014 Overview Hands-on Exercises: IHSDM Crash Prediction Module (CPM) The Crash Prediction Module estimates
Coastal Office of Online Learning
 Moodle Enhancements This resource guide highlights new features that are now available in the upgraded Moodle 3.1. It also addresses changes to existing features. Coastal Office of Online Learning Keep
Illinois Bituminous Paving Conference Imad L. Al-Qadi. ICT - Where Transportation and Excellence Meet
 Illinois Bituminous Paving Conference Imad L. Al-Qadi ICT - Where Transportation and Excellence Meet 1 ICT Vision, Since its inception in 2005 Serve the transportation needs of IDOT, the State of Illinois,
20. Security Classif. (of this page) Unclassified
 Unclassified") 1. Report No. FHWA/TX-13/0-6610-1 2. Government Accession No. 3. Recipient's Catalog No. 4. Title and Subtitle IMPACT OF CHANGES IN PROFILE MEASUREMENT TECHNOLOGY ON QA TESTING OF PAVEMENT SMOOTHNESS:
1. Report No. FHWA/TX-13/0-6610-1 2. Government Accession No. 3. Recipient's Catalog No. 4. Title and Subtitle IMPACT OF CHANGES IN PROFILE MEASUREMENT TECHNOLOGY ON QA TESTING OF PAVEMENT SMOOTHNESS:
Exploring Pavement Texture and Surface Friction Using Soft Computing Techniques
 Exploring Pavement Texture and Surface Friction Using Soft Computing Techniques Students: Guangwei Yang, You Zhan, Ace Fei, Allen Zhang PIs: Joshua Q. Li & Kelvin C.P. Wang School of Civil and Environmental
Todd V. Scholz, Ph.D., P.E. Roadworthy Research & Design 1580 Royal Drive Reno, NV and
 LIFE CYCLE COSTS FOR LIME IN HOT MIX ASPHALT VOLUME III - LCCA SOFTWARE USER S GUIDE by Todd V. Scholz, Ph.D., P.E. Roadworthy Research & Design 1580 Royal Drive Reno, NV 89503 and R.G. Hicks, P.E. Professor
Road Surface Texture Evaluation with 3-D Laser Data
 Road Surface Texture Evaluation with -D Laser Data Shuvo Islam 1, Mustaque Hossain, and Humaira Zahir ( 1 Kansas State University, Manhattan, KS, USA, sislam@ksu.edu) ( Kansas State University, Manhattan,
Rutgers Interactive Lane Closure Application (RILCA) for Work Zone Planning User Manual. New Jersey Highway Authority. Garden State Parkway
 for Work Zone Planning User Manual. New Jersey Highway Authority. Garden State Parkway") Rutgers Interactive Lane Closure Application (RILCA) for Work Zone Planning User Manual Prepared for Garden State Parkway New Jersey Highway Authority April 2007 Developed by: Rutgers University Intelligent
Rutgers Interactive Lane Closure Application (RILCA) for Work Zone Planning User Manual Prepared for Garden State Parkway New Jersey Highway Authority April 2007 Developed by: Rutgers University Intelligent
Lesson 6: Traffic Analysis Module (TAM)
") Go back to: Table of Contents Go to the next lesson Overview : Traffic Analysis Module (TAM) The Traffic Analysis Module (TAM) may be used to evaluate the operational effects of existing and projected
Go back to: Table of Contents Go to the next lesson Overview : Traffic Analysis Module (TAM) The Traffic Analysis Module (TAM) may be used to evaluate the operational effects of existing and projected
Aggregates Geometric Parameters
 Aggregates Geometric Parameters On-Line or Lab Measurement of Size and Shapes by 3D Image Analysis Terry Stauffer Application Note SL-AN-48 Revision A Provided By: Microtrac Particle Characterization Solutions
Hot-Mix Asphalt and Flexible Pavement Design: the MEPDG
 Hot-Mix Asphalt and Flexible Pavement Design: the MEPDG Kevin D. Hall, Ph.D., P.E. Professor and Head, Dept. of Civil Engineering University of Arkansas Flexible Pavement Research Symposium Denver, Colorado
User Guide for the Advance Planning Risk Analysis Tool for Transportation Projects
 0-5478-P1 User Guide for the Advance Planning Risk Analysis Tool for Transportation Projects Carlos H. Caldas G. Edward Gibson Tiendung Le Project 0-5478: Optimizing the Identification of Right-of-Way
September 1998 August 2001 P.O. Box 5080
 1. Report No. FHWA/TX-02/1869-3 4. Title and Subtitle MODULUS 6.0 FOR WINDOWS: USER S MANUAL 7. Author(s) Technical Report Documentation Page 2. Government Accession No. 3. Recipient's Catalog No. 5. Report
Ministry of Transportation Ministry of Transportation. Warm Mix Asphalt OHMPA Fall Seminar December 11, Seyed Tabib
 Warm Mix Asphalt 2013 OHMPA Fall Seminar December 11, 2013 Seyed Tabib Bituminous Section of Ontario Overview WMA Definition Benefits of WMA Challenges of WMA MTO WMA Contracts QA Results Energy Savings
2.3. Quality Assurance: The activities that have to do with making sure that the quality of a product is what it should be.
 5.2. QUALITY CONTROL /QUALITY ASSURANCE 5.2.1. STATISTICS 1. ACKNOWLEDGEMENT This paper has been copied directly from the HMA Manual with a few modifications from the original version. The original version
FINE AGGREGATE PRODUCTION WITH VSI CRUSHING & HIGH FREQUENCY SCREENING
 FINE AGGREGATE PRODUCTION WITH VSI CRUSHING & HIGH FREQUENCY SCREENING By Andy Bryan and Patrick Reaver 1 Original Operations Modern Material Processing 2 Processing Material Science or Art? 1/4 x 0 Stockpile
THE EFFECT OF ASPHALT PAVEMENT TEXTURE ON BRAKING DISTANCE
 THE EFFECT OF ASPHALT PAVEMENT TEXTURE ON BRAKING DISTANCE Weiguang Zhang Master Candidate, School of Transportation, Southeast University, P.R.China, E-mail:wgzhang6@gmail.com Jun Yang Professor of Road
SHRP2 Project L07 Analysis Tool for Design Treatments to Address Nonrecurrent Congestion
 SHRP2 Project L07 Analysis Tool for Design Treatments to Address Nonrecurrent Congestion Annotated Graphical User s Guide Version 2.0 March 14, 2014 1 INTRODUCTION The SHRP2 Project L07 Analysis Tool is
FRICTION TESTING KJ LAW (DYNATEST) SKID TRAILER
 SKID TRAILER") Version 3 November 2016 FRICTION TESTING KJ LAW (DYNATEST) SKID TRAILER General Description Pavement surface friction is regarded as an indicator of safety of vehicles on highways because it is a measure
Version 3 November 2016 FRICTION TESTING KJ LAW (DYNATEST) SKID TRAILER General Description Pavement surface friction is regarded as an indicator of safety of vehicles on highways because it is a measure
20. Security Classif. (of this page) Unclassified
 Unclassified") 1. Report No. FHWA/TX-18/5-6921-01-R1 2. Government Accession No. 3. Recipient's Catalog No. 4. Title and Subtitle APPLICATION OF A LASER SCANNING SYSTEM TO DYNAMIC FRICTION TEST SPECIMENS: CORRELATION
1. Report No. FHWA/TX-18/5-6921-01-R1 2. Government Accession No. 3. Recipient's Catalog No. 4. Title and Subtitle APPLICATION OF A LASER SCANNING SYSTEM TO DYNAMIC FRICTION TEST SPECIMENS: CORRELATION
LOA 5 D Thin Noise-Reducing Asphalt Technology and Performance DAV, Bergisch Gladbach, 18 June 2012
 LOA 5 D Thin Noise-Reducing Asphalt Technology and Performance DAV, Bergisch Gladbach, 18 June 2012 Dipl.-Ing. Miomir Miljković The Faculty of Civil and Environmental Engineering Introduction Environmental
To complete this activity, you will need the following files:
 CHAPTER 1 Windows XP More Skills 12 Move Data Between Windows You can open several application windows at the same time; they do not need to be files created by the same program. Having more than one window
AISIBEAM User's Manual (Version 3.0)
") AISIBEAM User's Manual (Version 3.0) Shabin Taavoni, Ph.D., PE, title Structural Software Inc. location John C. Huang Ph.D., PE, Principal CHC Engineering, LLC Herndon, VA Scope of Software The software
AISIBEAM User's Manual (Version 3.0) Shabin Taavoni, Ph.D., PE, title Structural Software Inc. location John C. Huang Ph.D., PE, Principal CHC Engineering, LLC Herndon, VA Scope of Software The software
May 1, 2003 LAB MANUAL
 May 1, 2003 LAB MANUAL 1214.0 1214 DETERMINATION PERCENTAGE OF CRUSHED PARTICLES IN AGGREGATES ASTM D 5821 Mn/DOT Modified 1214.1 SCOPE This test method covers the determination of percent of particles
SECTION 115 MATERIALS CERTIFICATION SCHOOLS PROGRAM
 SECTION 115 MATERIALS CERTIFICATION SCHOOLS PROGRAM The Materials Certification Schools (MCS) Program is offered by the Virginia Department of Transportation (VDOT) for individuals who wish to receive
North Central Superpave Center Update. Becky McDaniel NCAUPG Meeting January 28, 2004 Omaha, Nebraska
 North Central Superpave Center Update by Becky McDaniel NCAUPG Meeting January 28, 2004 Omaha, Nebraska What is the NCSC Up To? Research Equipment/Protocol Evaluations Training Communication and Technology
Texas Transportation Institute The Texas A&M University System College Station, Texas March 2004-October 2004
 1. Report No. FHWA/TX-05/5-1707-01-1 4. Title and Subtitle AGGREGATE IMAGING SYSTEM (AIMS): BASICS AND APPLICATIONS Technical Report Documentation Page 2. Government Accession No. 3. Recipient's Catalog
Lesson 5: Design Consistency Module (DCM)
") Go back to: Table of Contents Go to the next lesson Overview : Design Consistency Module (DCM) The Design Consistency Module evaluates operating speed consistency through a speed-profile model that estimates
Go back to: Table of Contents Go to the next lesson Overview : Design Consistency Module (DCM) The Design Consistency Module evaluates operating speed consistency through a speed-profile model that estimates
Accuracy of the Two Common Semi- Analytical Equations in Predicting Asphalt Permeability
 Accuracy of the Two Common Semi- Analytical Equations in Predicting Asphalt Permeability M. Emin Kutay * Ahmet H. Aydilek** * Research Engineer, Turner-Fairbank Highway Research Center (TFHRC) 6300 Georgetown
Characterization of Aggregate Texture and Correlation with Surface Skid Resistance
 TECHNICAL REPORT 0-6878-3 TxDOT PROJECT NUMBER 0-6878 Characterization of Aggregate Texture and Correlation with Surface Skid Resistance Sareh Kouchaki Hossein Roshani Joaquin Bernardo Hernandez Jorge
VARIATIONS IN CAPACITY AND DELAY ESTIMATES FROM MICROSCOPIC TRAFFIC SIMULATION MODELS
 VARIATIONS IN CAPACITY AND DELAY ESTIMATES FROM MICROSCOPIC TRAFFIC SIMULATION MODELS (Transportation Research Record 1802, pp. 23-31, 2002) Zong Z. Tian Associate Transportation Researcher Texas Transportation
FRICTION TESTING KJ LAW (DYNATEST) SKID TRAILER
 SKID TRAILER") Version 1 June 2009 FRICTION TESTING KJ LAW (DYNATEST) SKID TRAILER General Description Pavement surface friction is regarded as an indicator of safety of vehicles on highways because it is a measure of
Version 1 June 2009 FRICTION TESTING KJ LAW (DYNATEST) SKID TRAILER General Description Pavement surface friction is regarded as an indicator of safety of vehicles on highways because it is a measure of
Introduction Texture/Friction Measurement at Winnipeg International Airport Data Analysis Conclusions
 Texture/Friction Measurements and Analysis at Runway 13-31 of James Armstrong Richardson International Airport in Winnipeg Qingfan Liu, EIT, PhD candidate, University of Manitoba Ahmed Shalaby, PhD, P.
Texas Transportation Institute The Texas A&M University System College Station, Texas
 1. Report No. FHWA/TX-08/5-4495-01-P1 4. Title and Subtitle PAVECHECK: UPDATED USER S MANUAL 2. Government Accession No. 3. Recipient's Catalog No. 5. Report Date January 2008 6. Performing Organization
Grade Syncing. Follow these instructions for syncing Top Hat grades to your Canvas course.
 Grade Syncing Follow these instructions for syncing Top Hat grades to your Canvas course. Navigate to your name in the top right corner. Click on your name. Select Course Settings from the drop-down menu.
MATERIALS DIVISION MEMORANDUM SIGNATURE:
 MATERIALS DIVISION MEMORANDUM GENERAL SUBJECT: Revision of Materials MOI Chapter 1 General Instructions NUMBER: MD 359-13 SPECIFIC SUBJECT: Revision of Materials MOI Section 115 Materials Certification
My Courses: Displays courses the user has self-enrolled in as well as courses that have been assigned to the user when available.
 LOGGING IN To log in go to https://gbateam.redvector.com and enter your Login /Username and Password. If you have forgotten your password, click on the Forgot your password link. 1. Enter the primary email
Introduction to Working with Attribute Data
 Introduction to Working with Attribute Data As you arrive, please choose any computer station and make yourself comfortable! Open Microsoft Word and save a document on your desktop titled with the participant
Request for FTE Design Exceptions & Variations Checklist
 District: Project Name: Project Section BMP: EMP: Exemption BMP: EMP: Request for FTE Design Exceptions & Variations Checklist FPID: New Construction RRR Requested Control Element(s): Design Speed* Horizontal
ABOUT THE REPRODUCIBILITY OF TEXTURE PROFILES AND THE PROBLEM OF SPIKES
 ABOUT THE REPRODUCIBILITY OF TEXTURE PROFILES AND THE PROBLEM OF SPIKES ABSTRACT L. GOUBERT & A. BERGIERS Belgian Road Research Centre, Belgium L.GOUBERT@BRRC.BE The ISO working group ISO/TC43/SC1/WG39
MS2. Modern Traffic Analytics ms2soft.com
 MS2 Modern Traffic Analytics ms2soft.com Updated: October 31, 2014 The Traffic Count Database System (TCDS) module is a powerful tool for the traffic engineer or planner to organize an agency's traffic
Quick Reference Management Reports
 PerformanceIQ Quick Reference Management Reports Description Management Reports are dynamic reports, updated monthly, that show global performance of all portfolios that you can access. Management Reports
OR 217,I-5 Experience Portland, OR
 OR 217,I-5 Experience Portland, OR By: Abby Caringula Parsons Brinckerhoff July 8th, 2011 Presentation Outline Background VISUM Network Adjustment Model Origin-Destination(O-D) Demand Development ANM Export
PRELIMINARY REVIEW COPY Technical Report Documentation Page
 PRELIMINARY REVIEW COPY Technical Report Documentation Page 1. Report No. Preliminary Review Copy 2. Government Accession No. 3. Recipient s Catalog No. 4. Title and Subtitle User s Guide to GIS-Based
This section contains context-sensitive Online Help content for the Web Client > Monitor tab.
 This section contains context-sensitive Online Help content for the Web Client > tab. Viewing Switch CPU Information, page 2 Viewing Switch Memory Information, page 2 Viewing Switch Traffic and Errors
3D Laser Imaging for Pavement Survey at 60 mph and True 1mm Resolution
 3D Laser Imaging for Pavement Survey at 60 mph and True 1mm Resolution Kelvin C. P. Wang Oklahoma State University & WayLink kelvin.wang@okstate.edu 2013 Arizona Pavements/Materials Conference ASU MU,
CVEN 5835 Cable Supported Structures 1
 CVEN 5835 Cable Supported Structures George.Hearn@colorado.edu 1 Cable Structures An app for force-displacement analysis is used to set up a model of a single strand carrying three point loads. We worked
SECTION 114 MATERIALS CERTIFICATION SCHOOLS PROGRAM
 VIRGINIA DEPARTMENT OF TRANSPORTATION MATERIALS DIVISION MEMORANDUM GENERAL SUBJECT: MATERIALS CERTIFICATION SCHOOLS PROGRAM SPECIFIC SUBJECT: Revisions to the Materials Certification Schools policies
Economic Crash Analysis Tool. Release Notes
 Release Notes August 2017 Release: 1. Project Information Worksheet: a. Update: Removed the design exception report option b. Enhancement: The first question has been expanded to provide better clarity
Distress Image Library for Precision and Bias of Fully Automated Pavement Cracking Survey
 Distress Image Library for Precision and Bias of Fully Automated Pavement Cracking Survey Kelvin C.P. Wang, Ran Ji, and Cheng Chen kelvin.wang@okstate.edu Oklahoma State University/WayLink School of Civil
Lesson 14: Design Reports
 14 Lesson 14: Design Reports WELCOME! This lesson is about producing reports from the design data generated in the tutorial. Now that you have designed the commercial site, it is possible to extract information
Site 17 W3-160 KEY: District Department of Transportation 55 M Street, SE, Suite 400 Washington, DC 20003
 Speed Limit and Safety Nexus Studies for Automated Enforcement Locations in the District of Columbia Connecticut Avenue at Calvert Street NW Study Area and Location District PSA Ward ANC Phase Description
LICENSE PLATE RECOGNITION SETUP AND FIELD INSTALLATION GUIDE
 LICENSE PLATE RECOGNITION SETUP AND FIELD INSTALLATION GUIDE This document was created to benchmark the settings and tools needed to successfully deploy LPR with the ipconfigure s Enterprise Surveillance
Using the Big 5 Generator 2013/2014
 Using the Big 5 Generator 2013/2014 Contents Getting Started... 3 Using the Big-5 Generator... 3 Step 1: School Set Up... 3 Step 2: Per Day/ Per Month... 5 Step 3: Behavior... 8 Step 4: Location... 10
Technical Report Documentation Page 2. Government Accession No. 3. Recipient's Catalog No. 1. Report No. FHWA/TX-12/
 1. Report No. FHWA/TX-12/5-5597-01-1 4. Title and Subtitle LABORATORY AND FIELD PERFORMANCE MEASUREMENTS TO SUPPORT THE IMPLEMENTATION OF WARM MIX ASPHALT IN TEXAS Technical Report Documentation Page 2.
Job Aid. Remote Access BAIRS Printing and Saving a Report. Table of Contents
 Remote Access BAIRS Printing and Saving a Report Table of Contents Remote Access BAIRS Printing a Report PDF HTML... 2 Remote Access BAIRS Printing a Report Export to PDF Interactive Reporting... 3 Remote
Speed Limit and Safety Nexus Studies for Automated Enforcement Locations in the District of Columbia Inside Southern part of 3rd Street Tunnel
 Speed Limit and Safety Nexus Studies for Automated Enforcement Locations in the District of Columbia Inside Southern part of 3rd Street Tunnel Study Area and Location District PSA Ward ANC Phase Description
Excel Model Reference REFERENCE
 Excel Model Reference 1 Navigating Accounting Excel Models REFERENCE TABLE OF CONTENTS Introduction 2 How Do I Use the Models? 3 Model Overview 4 EntryInputs Sheet Tab 5 Accounts Sheet Tab 6 BSE Sheet
Horizontal Alignment
 AMRC 2012 MODULE 8 Horizontal Alignment CONTENTS Overview... 8-1 Objectives... 8-1 Procedures... 8-1 8.1 Design Considerations and Circular Curves... 8-3 8.2 Superelevation and Transitional Spiral... 8-5
Science, Technology, Engineering, and Math Revised Summer 2014 Division Implemented Fall 2014 Textbook Update Fall 2017
 Butler Community College Karen Waddell Science, Technology, Engineering, and Math Revised Summer 2014 Division Implemented Fall 2014 Textbook Update Fall 2017 COURSE OUTLINE Advanced Computer Applications
A parabolic curve that is applied to make a smooth and safe transition between two grades on a roadway or a highway.
 A parabolic curve that is applied to make a smooth and safe transition between two grades on a roadway or a highway. VPC: Vertical Point of Curvature VPI: Vertical Point of Intersection VPT: Vertical Point
ADOT Experience with Warm Mix Asphalt. Chad Auker Flagstaff Regional Materials Engineer ADOT - Materials Group
 ADOT Experience with Warm Mix Asphalt Chad Auker Flagstaff Regional Materials Engineer ADOT - Materials Group Overview of Presentation History of WMA in ADOT Initial WMA Projects (2009 2010) ADOT/AGC WMA
AcqDemo Pay Pool Analysis Tool (PAT) User Guide
 User Guide") AcqDemo Pay Pool Analysis Tool (PAT) User Guide December 2014 The spreadsheet is a Microsoft Excel workbook called PAT 2014 v1.0 consisting of eighteen tabbed worksheets. The PAT was created for AcqDemo
AcqDemo Pay Pool Analysis Tool (PAT) User Guide December 2014 The spreadsheet is a Microsoft Excel workbook called PAT 2014 v1.0 consisting of eighteen tabbed worksheets. The PAT was created for AcqDemo
The Andbjerg Plough Radio-carbon dated at year 1520 (± 100 years)
") The Andbjerg Plough Radio-carbon dated at year 1520 (± 100 years) The Andbjerg Plough is an example of an early aggregate wear testing device. The landside of the plough is studded with granite pebbles
The Andbjerg Plough Radio-carbon dated at year 1520 (± 100 years) The Andbjerg Plough is an example of an early aggregate wear testing device. The landside of the plough is studded with granite pebbles
Demand Impact Model User Manual
 Final Demand Impact Model User Manual Part of the Massachusetts Residential Retrofit and Low Income Program Area Evaluation June 2012 Prepared by: The Cadmus Group, Inc. Energy Services Division 720 SW
Accuracy of the Rubicon Toolbox Finite Element Model
 Accuracy of the Rubicon Toolbox Finite Element Model Introduction This document deals with the accuracy and recommended use of the Rubicon Toolbox Finite Element module. The document is intended to provide
Essentials for professional use
 Road Surveys using smartphones Essentials for professional use June 2016 - App version 2.1.8- This guide gives a short introduction and briefly describes how to: 1. Collect road roughness data + auto photos
SMART CURRENT SOFTWARE GUIDE
 Page 1 of 6 System Requirements 1. Designed for use with computers running Windows 7 or a more recent operating system. 2. Microsoft.NET Framework 4.0 runtime 3. FTDI D2xx Driver CDM v2.12.24 or above
USING FULL LANE 3D ROAD TEXTURE DATA FOR THE AUTOMATED DETECTION OF SEALED CRACKS, BLEEDING AND RAVELING
 USING FULL LANE 3D ROAD TEXTURE DATA FOR THE AUTOMATED DETECTION OF SEALED CRACKS, BLEEDING AND RAVELING John Laurent 1, Jean François Hébert 1, Mario Talbot 1 1 Pavemetrics Systems Inc., Québec, Canada
Microsoft Windows Software Manual for FITstep Stream Version 3
 Thank you for purchasing this product from Gopher. If you are not satisfied with any Gopher purchase for any reason at any time, contact us and we will replace the product, credit your account, or refund
APPENDIX E TRANSPORTATION
 APPENDIX E TRANSPORTATION 2011 PATRON SURVEYS VISSIM MODEL CALIBRATION AND VALIDATION Environmental and Planning Consultants 440 Park Avenue South 7th Floor New York, NY 10016 tel: 212 696-0670 fax:
Dashboard 8.0. User Guide
 Dashboard 8.0 User Guide Table of Contents Dashboard User Reference Guide Table of Contents...2 Basic Navigation...3 Content Section...3 Filter Frame...4 Table Types...5 The Drilling Process...6 The Metric
User Guide. Kronodoc Kronodoc Oy. Intelligent methods for process improvement and project execution
 User Guide Kronodoc 3.0 Intelligent methods for process improvement and project execution 2003 Kronodoc Oy 2 Table of Contents 1 User Guide 5 2 Information Structure in Kronodoc 6 3 Entering and Exiting
Advanced Excel Macros : Data Validation/Analysis : OneDrive
 Advanced Excel Macros : Data Validation/Analysis : OneDrive Macros Macros in Excel are in short, a recording of keystrokes. Beyond simple recording, you can use macros to automate tasks that you will use
Reliability of Results Depends On:
 HDM-4 Calibration Reliability of Results Depends On: How well the available data represent the real conditions to HDM How well the model s predictions fit the real behaviour and respond to prevailing conditions
ANALYSIS SOFTWARE. CAmReport
 ANALYSIS SOFTWARE CAmReport ENGLISH User Manual CONTENTS 1. INSTALLATION... 3 2. GETTING STARTED... 4 2.1 Starting and Exiting CAmReport... 4 2.2 Setup... 4 2.2.1 Language... 4 2.2.2 Units... 4 2.2.3 CAmReport
COLLEGE OF WILLIAM AND MARY
 Position Management Staff and Professional Positions COLLEGE OF WILLIAM AND MARY Human Resources Table of Contents Topic Page Create a New Position Description 2 Classification Details 5 Position Details
Dynamic Message Sign Message Design and Display Manual
 Product 0-4023-P1 October 2004 Dynamic Message Sign Message Design and Display Manual Project performed in Cooperation with the Texas Department of Transportation and the Federal Highway Administration
The Document Viewer (DV) provides a document s original format, including images, tables and graphs, within the Similarity Report.
 provides a document s original format, including images, tables and graphs, within the Similarity Report.") Section: Document Viewer Report Modes The Document Viewer The Document Viewer (DV) provides a document s original format, including images, tables and graphs, within the Similarity Report. Document Viewer
Section: Document Viewer Report Modes The Document Viewer The Document Viewer (DV) provides a document s original format, including images, tables and graphs, within the Similarity Report. Document Viewer
The Document Viewer (DV) provides a document s original format, including images, tables and graphs, within the Similarity Report.
 provides a document s original format, including images, tables and graphs, within the Similarity Report.") Section: Accessing the Document Viewer The Document Viewer The Document Viewer (DV) provides a document s original format, including images, tables and graphs, within the Similarity Report. Accessing the
Section: Accessing the Document Viewer The Document Viewer The Document Viewer (DV) provides a document s original format, including images, tables and graphs, within the Similarity Report. Accessing the
SMARTEVALS (FCE) DEAN/DEPT HEAD RESULTS GUIDE
 DEAN/DEPT HEAD RESULTS GUIDE") FCE Results Semester FCE results are calculated and released a few days after the final grade deadline ensuring that all participating campuses have submitted final grades. Results are sent via email to
FCE Results Semester FCE results are calculated and released a few days after the final grade deadline ensuring that all participating campuses have submitted final grades. Results are sent via email to
Pavement Preservation and the Role of Bituminous Surface Treatments A Washington State View. Minnesota Pavement Conference February 14, 2008
 Pavement Preservation and the Role of Bituminous Surface Treatments A Washington State View Minnesota Pavement Conference February 14, 2008 1 The Situation 2 WSDOT policy, in essence, mandated use of BSTs
Matrix Overview. Houston Association of Realtors. 4 Hours CE Course#: 31761
 Houston Association of Realtors 4 Hours CE Course#: 31761 2 Table of Contents 1. Home 4 1.1 Home Widgets... 4 1.2 Hot Sheets (Customize)... 5 1.3 Market Watch (Customize)... 6 2. My Matrix 7 2.1 Contacts
Development of design tool for Nigerian (CBR) design of flexible pavement
 design of flexible pavement") Available online atwww.scholarsresearchlibrary.com Archives of Applied Science Research, 2015, 7 (10):1-16 (http://scholarsresearchlibrary.com/archive.html) ISSN 0975-508X CODEN (USA) AASRC9 Development
Available online atwww.scholarsresearchlibrary.com Archives of Applied Science Research, 2015, 7 (10):1-16 (http://scholarsresearchlibrary.com/archive.html) ISSN 0975-508X CODEN (USA) AASRC9 Development
Valley. Scheduling. Client User Manual _ Valmont Industries, Inc., Valley, NE USA. All rights reserved.
 Valley Scheduling Client User Manual 09805_0 09 Valmont Industries, Inc., Valley, NE 6806 USA. All rights reserved. www.valleyirrigation.com Valley Scheduling This page was left blank intentionally Table
Load Watch SM Distributed Resources System Operations Center
 DTE Energy Generator and Energy Monitoring Services Load Watch SM Distributed Resources System Operations Center Users Guide V.8 March 00 For Technical Support or Questions Call --5-5590 Log-in Screen
Grade Point Scales Standard Honors AP/College A B C D F Sample file
 64 Transcripts Weighted Cumulative GPA When your student works extra hard and takes honors or college courses, they deserve a little credit. The best way to reflect this is through their GPA. They deserve
Getting Started With. A Step-by-Step Guide to Using WorldAPP Analytics to Analyze Survey Data, Create Charts, & Share Results Online
 Getting Started With A Step-by-Step Guide to Using WorldAPP Analytics to Analyze Survey, Create Charts, & Share Results Online Variables Crosstabs Charts PowerPoint Tables Introduction WorldAPP Analytics
Construction IC User Guide. Analyse Markets.
 Construction IC User Guide Analyse Markets clientservices.construction@globaldata.com https://construction.globaldata.com Analyse Markets Our Market Analysis Tools are designed to give you highly intuitive
2018 Material Certification Schools
 2018 Material Certification Schools Registration VECAT classroom courses are now open for sign up on the Germanna Community College website (GCC). 2018 classroom courses will be held at the following Virginia
Roadway Alignments and Profiles
 NOTES Module 15 Roadway Alignments and Profiles In this module, you learn how to create horizontal alignments, surface profiles, layout (design) profiles, and profile views in AutoCAD Civil 3D. This module