DARWIN-ME Pavement Analysis and Design Manual for NJDOT
|
|
|
- Duane Holmes
- 5 years ago
- Views:
Transcription

1 2012 DARWIN-ME Pavement Analysis and Design Manual for NJDOT Book 1 Pavement Overview, Traffic and Climatic Inputs Vitillo, Nicholas Rutgers - CAIT Pavement Resource Program 1 4/1/2012
2 Darwin ME Flexible Pavement Design and Flexible Overlay Design
3 Table of Content Contents Darwin ME Flexible Pavement Design and Flexible Overlay Design And Material Inputs New Flexible Pavement and HMA Overlay Design Strategies Applicable for Use with the MEPDG (Manual of Practice for the ME Pavement Design Guide) Selecting Design Criteria and Reliability Level Recommended Design-Performance Criteria Reliability DARWin-ME Main Window General DARWin-ME Features Explorer Pane Project Tab Material Layer Selection Property Grid Progress Pane Output Pane Error List Pane Compare Pane Options Identifiers Saving a Project to Folder Exiting Absolute and Recommended Inputs Ranges Input Hierarchy Reports Traffic Traffic Inputs Vehicle Class Distribution and Growth Monthly Adjustment Axles per Truck... 40
4 5.3.5 Hourly Adjustment [Not required for new Flexible design or HMA Overlay] Axle Load Distribution Climate Climate Station Summary Tab Hourly Climate Data Tab Verify Weather... 52
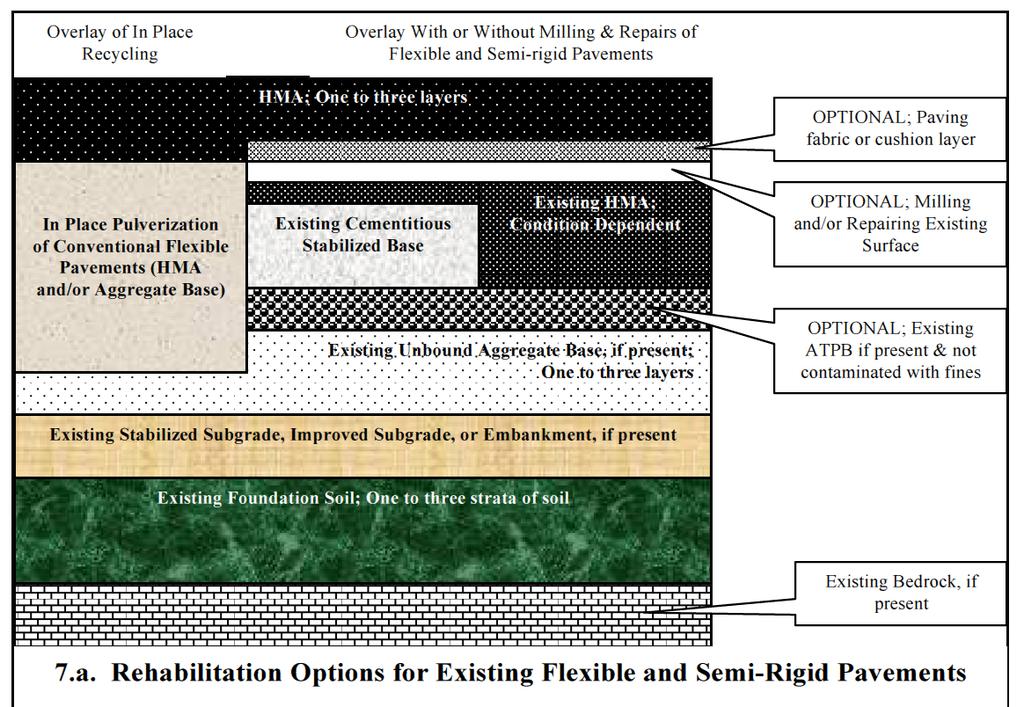
5 Manual of Practice for the ME Pavement Design Guide August 24, 2007 Darwin ME Flexible Pavement Design and Flexible Overlay Design And Material Inputs AASHTOWare 2011 The design manual that follows is based on excerpts from the 2007 Manual of Practice for the ME Pavement Design Guide, the Darwin-ME Help files, and NJDOT Research Reports characterizing material inputs for Subgrade, Aggregate Base and Subbase, and HMA materials. Material characterization and design parameters for chemically stabilized soil material and PCC pavements can be found in the 2007 Manual of Practice for the ME Pavement Design Guide, and the Darwin-ME Help files. A new Manual of Practice for the Darwin ME Pavement Design Guide is being developed. 3.3 New Flexible Pavement and HMA Overlay Design Strategies Applicable for Use with the MEPDG (Manual of Practice for the ME Pavement Design Guide) The MEPDG can be used to analyze the expected performance of new and reconstructed HMA-surfaced pavements, as well as HMA overlays. The HMA-surfaced pavement types include the following, which are illustrated in Figures 6 and 7. Conventional Flexible Pavements: Flexible pavements that consist of relatively thin HMA surfaces (less than 6 inches thick) and unbound aggregate base layers (crushed stone or gravel, and soil-aggregate mixtures). Many of the pavements used in the global calibration process had multiple aggregate base layers. Conventional flexible pavements may also have a stabilized or treated subgrade layer. Deep Strength Flexible Pavements: Flexible pavements that consist of a relatively thick HMA surface and a dense-graded HMA or asphalt stabilized base mixture placed over an aggregate base layer. Deep strength flexible pavements may also have a stabilized or treated subgrade layer. Many of the flexible pavements used in the global calibration process had asphalt stabilized base layers and would be defined deep strength flexible pavements. Full-Depth HMA Pavements: HMA layers placed on a stabilized subgrade layer or placed directly on the prepared embankment or foundation soil. Full-depth flexible pavements were also included in the global calibration process, but there were fewer test sections than for conventional and deep strength flexible pavements. Semi-Rigid Pavements: HMA placed over cementitious stabilized materials. Cementitious materials may include lime, lime-fly ash, and Portland cement stabilizers. This type of pavement is also referred to as composite pavements in the MEPDG. Semi-rigid pavements were not included in the global calibration process, and are not recommended for analysis using the MEPDG until this type of pavement has been calibrated. 5

6 6


7 Manual of Practice for the ME Pavement Design Guide August 24, 2007 Full Depth Reclamation (In-Place Pulverization of Conventional Flexible Pavements): Cold in-place recycling of the HMA and existing aggregate base layers, and hot in-place recycling of HMA. Cold in-place recycling as a rehabilitation strategy is considered reconstruction under the MEPDG design/analysis process and would be defined as a new flexible pavement. Hot in-place recycling as a rehabilitation strategy is considered mill and fill with an HMA overlay of the existing flexible pavement. The thickness of the hot in-place recycled material is considered part of the HMA overlay, as well as the thickness of the milled material. Full depth reclamation, however, was not included in the global calibration of the MEPDG. HMA Overlays of all types of flexible and intact rigid pavements, with or without pavement repairs and surface milling. Pavement repairs and milling of the existing surface layer is considered by the MEPDG. The expected milling depth is an input value, and pavement repairs are considered by entering the condition of the pavement prior to overlay placement. The MEPDG may also be used to design HMA overlays of fractured PCC slabs (break and seat [applicable to JPCP]; crack and seat [applicable to JRCP]; and Rubblization [applicable to all PCC pavements]). HMA overlays of fractured PCC slabs, however, were not included in the global calibration process. 7
8 8 Selecting Design Criteria and Reliability Level Design performance criteria and design reliability greatly affect construction costs and performance. Section 5 summarized all of the performance indicators that are predicted with the MEPDG for both HMA- and PCC-surfaced pavements. Guidance is provided within this section for selecting the design criteria and reliability for a particular project. Each user or agency may evaluate these recommendations and modify them according to their experience, agency policies, and local needs. The design criteria and design reliability levels could be selected in balance with each other. A low level of distress should not be selected in conjunction with a high level of reliability because this may make it impossible or costly to obtain an adequate design. These levels could become policy values that are usually fixed for routine designs. 8.1 Recommended Design-Performance Criteria Performance criteria (or Analysis Parameters on the MEPDG software window) are used to ensure that a pavement design will perform satisfactorily over its design life. The designer selects critical limits or threshold values to judge the adequacy of a design. These criterion or threshold values could represent agency policies regarding the condition of the pavements that trigger some type of major rehabilitation activity or reconstruction. In addition, these values could represent the average values along a project. These criteria are similar to the current AASHTO Design Guide use of the initial and terminal serviceability index levels (AASHTO, 1993). The distress and IRI specific design policy criteria could be selected by visualizing the pavement condition and its impact on safety, maintenance needs (e.g., amount of lane closure), ability to rehabilitate the pavement in that condition, and the realization that this level is set at a given level of design reliability (e.g., 90 percent). These policy values may also be determined from an analysis of the agency s pavement management data through the use of survivability analyses (in terms of conditions when major rehabilitation activities are undertaken), or based on user considerations and for safety reasons (for example, a rut depth to reduce the probability of hydroplaning). The consequences of a project exceeding a performance criterion could likely require earlier than programmed maintenance or rehabilitation. Table 4 provides values for considerations by highway agencies, realizing that these levels may vary between agencies based on their specific conditions. 8

9 Table 4. Design Criteria or Threshold Values Recommended for Use in Judging the Acceptability of a Trial Design 8.2 Reliability Reliability has been incorporated in the MEPDG in a consistent and uniform fashion for all pavement types. A designer may specify the desired level of reliability for each distress type and smoothness. The level of design reliability could be based on the general consequence of reaching the terminal condition earlier than the design life. Design reliability (R) is defined as the probability (P) that the predicted distress will be less than the critical level over the design period. R = P [ Distress over Design Period < Critical Distress Level ] (37.a) Design reliability is defined as follows for smoothness (IRI): R = P [ IRI over Design Period < Critical IRI Level ] (37.b) This means that if 10 projects were designed and constructed using the MEPDG and each had a design reliability for fatigue cracking of 90 percent, one of those projects, on average, would show more than the threshold or terminal value of fatigue cracking at the end of the design period. This definition deviates from previous versions of the AASHTO Design Guide in that it considers multiple predicted distresses and IRI directly in the definition. Design reliability levels selected may vary by distress type and IRI or may remain constant for each. It is recommended, however, that the same reliability be used for all performance indicators. 9
10 Table 5. Levels of Reliability for Different Functional Classifications of the Roadway. 10


11 3.8 DARWin-ME Main Window DARWin-ME Main Window Explorer Pane: The Explorer Pane contains controls for Projects, Multiple Project Summary, Batch Run, Tools, and Calibration settings. See the Explorer Pane topic for more information. Menu: The Menu contains a dropdown for Recent Files and buttons for basic program operation. See the Menu topic for more information. Project Tab: The Project Tab allows you to select the type of design and pavement type. It also allows you to define the pavement structure, design and material properties and performance criteria. See the Project Tab topic for more information. Output Pane: The Output Pane displays a log of analysis activities. See the Output Pane topic for more information. Error List Pane: The Error List Pane displays a list of errors. See the Error List topic for more information. 11

12 Compare Pane: The Compare Pane allows the user to compare two projects and display any differences between them. See the Compare Pane topic for more information. Progress Pane: The Progress Pane displays the progress of an analysis as it runs. Click the Stop All Analysis button to abort a run. 4 General DARWin-ME Features 4.1 Explorer Pane Explorer Pane The Explorer Pane displays information about your project and the DARWin-ME application as a whole. Projects: The Projects folder contains information about any open projects, their analyses, preferences for those projects, and any output results. Multiple Project Summary: The Multiple Project Summary displays a report for any Batch Runs you have performed. Batch Run: This control allows you to perform an analysis for multiple projects without opening them individually. Load Projects: This control allows you to load multiple projects in the program. 12
13 Run Batch Projects: This control allows you to run multiple projects. View Batch Reports: This control allows you to view summary of multiple projects after batch is complete. Close All: This control allows you to close all projects. Stop All Execution: This control allows you to stop running all loaded projects. Tools: The Tools folder contains options for changing the settings of the DARWin-ME application. Advanced Search: This control allows you to search a database to which you are connected. Options: This control opens the Options pane, which allows you to specify preferences for the application. Administrator: This control allows a database administrator to create and edit user accounts. Password: This control allows a database administrator to change the password for user accounts. Delete: This control allows a database administrator to delete user accounts. DARWin-ME Calibration Factors: This control allows the user to specify project specific calibration factors and also national level default calibration factors. 4.3 Project Tab The Project Tab allows the user to select design options and inputs for a trial design. Note that the name assigned to the project appears on this screen. 13


 and pavement type you select.")
14 Project Tab General Info: The General Information pane contains controls for selecting the type of design (new, overlay or restoration), pavement type, and other general inputs. Performance Criteria: The Performance Criteria pane allows you to define the limits of critical distresses and smoothness that can be tolerated by the agency at the specified reliability levels. Pavement Structure: The Pavement Structure pane displays the layers that make up the pavement and allows the user to add or remove those layers. See the Pavement Structure topic for more information. Pavement Material Layer: The Pavement Material Layer is representation of the material type that makes up a pavement layer. Clicking a pavement layer displays its properties on the Property Page. Property Grid: The Property Grid pane allows you to view and define inputs for selective items (e.g. pavement material layer properties, design features, rehabilitation properties etc): General Information The controls for General Information pane change with the type of design (new, overlay or restoration) and pavement type you select. See the General Information topic under each pavement type for more information. 14


15 4.3.2 Performance Criteria The controls for Performance Criteria pane change with the type of design (new, overlay or restoration) and pavement type you select. See the Performance Criteria topic under each pavement type for more information Pavement Structure Once you select the pavement type for your project, DARWin-ME automatically provides the top layers of the selected pavement type. You are required to define the underlying layers and subgrade. If you try to insert a layer that violates the basic definition of the selected pavement type, DARWin-ME displays an error message Invalid material insert: Structural validation error. Add Layer/Remove Layer Pavement Structure The controls available here allow you to add, remove, and edit pavement material layers for the trial design. Add Layer: The Add Layer button opens the Material Layer Selection dialog, which allows you to add layers, select the layer material type, edit the properties of that material, and determine the position of the layer relative to the other layers in the pavement structure. The layer you add appears in the graphic. Remove Layer: The Remove Layer button allows you to remove any pavement material layer. The layer you remove disappears in the graphic. Click the layer on the graphic to display its properties in the Property Page. See the Property Grid topic for more information. 15


16 4.3.4 Material Layer Selection Material Layer Selection Insert Layer Below: This control allows you to a layer under which the new layer should be placed. Layer Type: This control allows you to select the type of layer you are adding to the pavement. Select Material Type: This control provides you the options to select the material type of your layer. Material type can be selected from a list of default material types, or from your agency s data libraries database or from an external source. 16

17 Select from Default List: This control allows you to select the material type for your new layer from the list of default material types. For each material type selected, DARWin-ME provides a set of default inputs. You can customize the default input values for your new layer by using the controls that appear on the right. Import from Database: This control allows you to retrieve layer information in XML format from the database (if you are connected). Import from an External Source: This control allows you retrieve layer data in XML format from an external source or folder. 4.4 Property Grid The Property Grid pane allows you to select the following items for viewing and defining inputs: Pavement Material Layers AC Layer Properties (includes AC Rehabilitation) JPCP Design Properties CRCP Design Properties JPCP Rehabilitation CRCP Rehabilitation Foundation Support Project-specific Calibration Factors Project Identifiers You can also open these items from the Explorer pane. Property Page: The Property Page pane allows you to view and define inputs for the selected items. Property Controls: The Property Controls allows you to select an item for display in the Property Page. 17


18 Property Controls Property Description: The Property Description section provides a brief description for each control on the Property Page, including limits for values as appropriate. Property Description Categories Button: Click the Categories Button to sort the properties displayed on the Property Page by category. A-Z Sort Button: Click the A-Z Sort Button to sort the properties displayed on the Property Page alphabetically. 18


19 4.5 Progress Pane Progress Pane The Progress Pane displays the status of any ongoing analyses. A green circle indicates that the analysis has been completed. A yellow triangle indicates that the analysis is on-going. A red square indicates that the analysis has not yet been run. You can force the program to terminate the on-going analyses by selecting Stop All Analysis control. 19


20 4.6 Output Pane Output Pane The Output Pane displays a log of the analysis activities, including timestamps for each entry. 4.7 Error List Pane Error List Pane DARWin-ME cannot run your project if it contains errors and gaps in inputs. In this case, the program will track and report these errors and gaps in an error list that appears in the lower section of the screen. Project: The Project column displays the project in which the error occurred. Object: The Object column displays the item (layer, pavement, etc) in which the error occurred for that project. 20


21 Property: The Property column displays the property of the object in which the error occurred for that project. Description: The Description column provides a description of the error. 4.8 Compare Pane Compare Pane Project Dropdown: This control allows you to select an open project on which to base your comparison. Compare To Dropdown: This control allows you to select a project to compare to the previously specified project. Run Compare: Click Run Compare to compare the two projects and identify differences. Clear Comparison: Click Clear Comparison to reset the Compare Pane. Display Name: The Display Name column shows the name of the property that differs between the two projects. Project 1: The Project 1 column displays the value of the property shown in Display Name for the base project. Project 2: The Project 2 column displays the value of the property shown in Display Name for the compare to project. Comparison Message: The Comparison Message column displays how the property shown in the Display Name is unequal (usually COMPARE_NOT_EQUAL_WARNING). 4.9 Options Way to Access this Interface Select Options from the Explorer Pane under Tools. 21


22 Options Delete intermediate files?: DARWin-ME produces several intermediate files that contain a wide range of calculated output parameters. Select True to delete these files after the analysis is complete. The default value is False. Generate Excel reports?: DARWin-ME produces an output report in PDF format. Select True to generate an additional report in Excel format. The default value is False (PDF report only). Generate structural response?: Select True to produce structural response in an intermediate file. The default value is False. Import MEPDG file formats?: Select True to import MEPDG legacy data tables and project files. The default value is False. Are analysis units US customary?: Shows the units convention you selected during installation. The value is True for US Customary units and False for SI units. Location of My DARWin-ME folder: Specify the location of the default user folder for DARWin-ME. Maximum number of errors to show on climate editing: Specify how many errors to display when editing hour climate data. Version: Displays the current version and build number of the program Identifiers Identifiers are the unique informational tag specific to each object. Objects can be any discrete item such as pavement material layer data, axle load distribution factors, climate 22
, Traffic (by right clicking the traffic and axle load spectra input screens),")
23 and design features or the project itself. Identifiers are used to identify, search, filter, save and retrieve information in a database environment. Way to Access this Interface Element Identifiers are available for the following objects--project (from the Project Tab), Traffic (by right clicking the traffic and axle load spectra input screens), Climate (from the Climate tab), Pavement Materials (from each individual layer input screens), Backcalculation (from the input screen), Design Properties (AC, JPCP, and CRCP), all Rehabilitation screens (from the input screen), and Project-Specific Calibration Factors (from the input screens). Identifiers Display name/identifier: This control allows you to define the display name of the object/material/project for outputs and graphical interface. Description of object: This control allows you to define or modify a description for the selected object. 23
24 Approver: This field control allows you to define the person who approved the use of the selected object/material/project. Date approved: This control allows you to define the date the approver accepted the selected object/material/project. Author: This control allows you to define the designer responsible for creating the selected object/material/project. Date created: This control allows you to define the date the selected object/material/ project was created. County: This control is optional, and allows you to define the political/organization division for which the selected object/material/project was created. State: This control is optional, and allows you to define the political/organization division for which the selected object/material/project was created. District: This control is optional, and allows you to define the political/organization division for which the selected object/material/project was created. Direction of travel: This control allows you to define which side of the roadway the design project is located. From station (miles): This control allows you to define the design project's begin station for linear referencing. To station (miles): This control allows you to define the design project's end station for linear referencing. Highway: This control allows you to define the roadway where the design project is located. Revision Number: This control displays the project's current revision number. Province: This control allows you to define the province where the project is located. User-defined fields (1-3): This series of controls allows you to define your own custom data fields for the project. Item Locked?: This control allows you to mark the project as editable or read-only. The default setting for this configuration property is False. For enterprise versions of DARWin- ME, if a user with administrator privileges changes the setting to True, the configuration grid becomes read-only. The application will gray it out to show that future changes are disabled. Only a user with administrator privileges can reset the Item Locked property to False. Select one of the following options: False: This option allows you to edit the values of the project. True: This option allows you to make the project read-only. 24
25 4.11 Saving a Project to Folder Projects created in DARWin-ME are saved as.dgpx files in a folder you specify in the Options tab. If the user does not specify a folder, the default folder for saved project files is My Documents\My Darwin ME\Projects Exiting Click the Exit button on the Menu to close all open projects and exit the program. If you are running the enterprise version of DARWin-ME, the program will require you to save each updated project to a new project name before closing. DARWin-ME will not overwrite an existing project that has been saved to the database Absolute and Recommended Inputs Ranges DARWin-ME uses two sets of input ranges for identifying errors and outliers in input values: recommended and absolute. Outliers are input data that lie outside the recommended range but are within the absolute range. Errors are input data that lie outside the absolute range. For outliers, the program will give a warning flag for your review. You can choose to accept or modify the input as needed. For an input value flagged as an error, you must provide a new value that is within the absolute range for the program to run Input Hierarchy DARWin-ME uses a three-level hierarchical input scheme for most of the input parameters related to traffic, material, and pavement condition. This approach provides DARWin-ME users with a lot of flexibility in obtaining the inputs for your project based on its criticality and the available resources. The following defines each hierarchical input level: Input Level 1 Input parameter is measured directly; it is site- or project-specific. This level represents the greatest knowledge about the input parameter for a specific project but has the highest testing and data collection costs to determine the input value. Input Level 2 Input parameter is estimated from correlations or regression equations. In other words, the input value is calculated from other site specific data or parameters that are less costly to measure. Input level 2 may also represent measured regional values that are not project-specific. 25


26 Input Level 3 Input parameter is based on best-estimated or default values. Level 3 inputs are based on national or regional default values the median value from a group of data with similar characteristics. Refer to the AASHTO Manual of Practice for more guidance on selecting an input level Reports PDF Output Report After a design/analysis run has been successfully completed, the application will generate and display a PDF file containing input summary and output results of the trial design. Once the PDF report is closed, you can re-open by double-clicking the PDF Output Report node located in the project tree view of the Explorer pane. 26


27 To locate the PDF report, go to the folder where the project file (.dgpx) is saved. The PDF report also shows the folder path of the project file. That folder will include a subfolder with the same name as the project file. The PDF report is inside the project subfolder. PDF Multiple Project Summary (Batch Report) If you have multiple project tabs open and you perform analysis on each of them, you can click on the Multiple Projects Summary option in the Explorer Pane project tree to obtain a summary report for all the projects that are open and have been run successfully. Alternatively, if projects which have been previously run and which contain valid results in the respective project folders are opened, clicking on the Multiple Projects Summary option provides a summary report for all the analysis with valid results. The application will open a batch report file (PDF) that will display the first page of each individual report, including the file pathway to the location of the project. Excel Output Report As long as the Excel Report Option is set as True in the Options tab, the output report will also be available as an Excel file. Click on the Excel Output Report option under each project in the tree to open the report in Excel. 27


28 28

29 5.3 Traffic Traffic data is one of the key data elements required for the structural design/analysis of pavement structures. It is required for estimating the loads that are applied to a pavement and the frequency with which those given loads are applied throughout the pavement s design life. The following lists traffic data required for design: Base year truck volume and speed Traffic capacity Axle configuration Lateral wander Wheelbase Vehicle class distribution and growth Hourly adjustment Axles per truck Monthly adjustment Axle load distribution factors DARWin-ME uses a hierarchical approach (Levels 1 through 3) to define traffic inputs based on the source of traffic data available. These levels represent how well you can estimate future truck traffic characteristics for the roadway being designed. Level 1 data is considered as the most representative of the past and future traffic characteristics of the project. It uses the actual axle weights and truck traffic volume distributions measured using weigh-in-motion (WIM) and automatic vehicle classification (AVC) sites that are located on nearby highway segments, assuming that there are no features or major intersections that could change the truck traffic stream. The regional summaries (statewide averages) obtained from the agency s traffic and planning departments can be considered as Level 2 data, while the Level 3 defaults (national averages) included in the program can be used when there are no regional data available from similar roadways. 29


30 Way to Access this Interface 1. In the Explorer tab under the Projects treeview, double-click the Traffic node. 2. Another way is to click on the tire in the Pavement Structure Definition area. Traffic Tab Links to Relevant Section in AASHTO Manual of Practice Refer to Section 9.1 Truck Traffic. 30


31 5.3.1 Traffic Inputs Base Year Truck Volume and Speed Traffic Inputs Base Year Truck Volume and Traffic Capacity Base year two-way AADTT: This control allows you to define the average annual daily truck traffic (FHWA vehicle classes 4-13) expected over the base year in both directions of travel for your project. 31

32 Number of lanes in the design direction: This control allows you to define the number of lanes present in the design direction. The program uses the number of lanes to estimate the traffic distribution in each lane. Percent trucks in design direction: This control allows you to define the percentage of trucks (from the entire two-way AADTT count) that is expected to travel in the design direction. Note that although this value is close to 50 percent, it is not necessarily so especially in cases where truck traffic does not use the same route for the onward and return trips. Percent trucks in design lane: This control allows you to define percentage of trucks in the design direction expected to use the design lane (typically the outer right lane). Operational speed (mph): This control allows you to define the expected speed of traffic traveling in the design lane. Note that the inputs in this control impact the loading frequency of asphalt layers. Traffic Capacity Cap Traffic Capacity Cap: This control opens the traffic capacity cap dialog, which allows you enforce a cap on estimated traffic volumes used in the design/analysis so that the expected highway capacity is not exceeded. In the Traffic tab, click on the Traffic Capacity Cap control. The following drop-down will appear: Traffic Capacity Cap Annual average daily traffic excluding trucks: This control allows you to define the annual average daily volume of FHWA vehicle classes 1 through 3 (motorcycles, cars, pickup trucks, vans and SUVs). This value is computed as the difference between annual average daily traffic (AADT) and annual average daily truck traffic (AADTT). The AADT includes both cars (or light vehicles - classes 1-3) and trucks (classes 4-13). 32
33 Non-truck linear traffic growth rate (%): This control allows you to define the annual linear growth rate of non-trucks (i.e., light vehicles - classes 1-3). Highway facility type: This control allows you to select freeway, multilane highway, or twolane highway. Traffic signal: Check this box to estimate highway capacity for signalized intersections. This option is available only for multilane and two-lane highways. Highway terrain type: This control allows you to select whether the terrain is level (includes short grades of no more than 1 to 2 percent) or rolling (otherwise). Rural or urban highway environment: This control allows you to select an urban or rural highway environment. User-specified capacity limit: DARWin-ME by default internally computes capacity estimates based on the 2000 Highway Capacity Manual (HCM). Enable this control to define a specific value for capacity limit. Enforce highway capacity limits: Enable this control to enforce traffic capacity cap. Disable this control to prevent DARWin-ME from enforcing traffic capacity cap. Axle Configuration Axle Configuration Average axle width (ft): This control allows you to define the distance in feet between two outside edges of an axle. DARWin-ME provides a default value of 8.5 ft. Dual tire spacing (in.): This control allows you to define the transverse distance in inches between the centers of a dual tire. This value is calculated from WIM data measured over time by averaging the distance measured between the dual tires of a tandem, tridem, or quad axle for each truck class. DARWin-ME provides a default value of 12 in. 33
34 Tire pressure (psi): This control allows you to define the hot inflation pressure of tires in pounds per square inch. It is assumed that the hot inflation pressure equals the contact pressure and is 10% above cold inflation pressure. DARWin-ME provides a default value of 120 psi. Tandem axle spacing (in.): This control allows you to define the center-to-center longitudinal spacing in inches between two consecutive axles in a tandem configuration. This value is calculated using WIM data by averaging distance measured between the tandem axles for each truck class. DARWin-ME provides a default value of 51.6 in. Tridem axle spacing (in.): This control allows you to define the center-to-center longitudinal spacing in inches between two consecutive axles in a tridem configuration. This value is calculated using WIM data by averaging distance measured between the tridem axles for each truck class. DARWin-ME provides a default value of 49.2 in. Quad axle spacing (in.): This control allows you to define the average distance in inches between two consecutive axles in a quad configuration. This value is calculated using WIM data by averaging distance measured between the quad axles for each truck class. DARWin-ME provides a default value of 49.2 in. Lateral Wander Lateral Wander Mean wheel location (in.): This control allows you to define the distance in inches from the outer edge of the wheel to the pavement marking. DARWin-ME provides a default value of 18 in. Traffic wander standard deviation (in.): This control allows you to define the divergence from average in inches of the lateral traffic wander. This standard deviation is used to estimate the number of axle load repetitions over a single point in a probabilistic manner for predicting distress and performance. DARWin-ME provides a default value of 10 in. Design lane width (ft): This control allows you to define the distance in feet between the lane marking on either side of the design lane. DARWin-ME provides a default value of 12 ft. 34
![Wheelbase [not used for new flexible design or HMA overlay designs] Wheelbase Average spacing of short axles (ft): This control allows you to define the average longitudinal spacing in feet of short](/docs-images/88/115246950/images/35-0.jpg "axles. DARWin-ME provides a default value of 12 ft. Average spacing of medium axles (ft): This control allows you to define the average longitudinal spacing in feet of medium axles.")
35 Wheelbase [not used for new flexible design or HMA overlay designs] Wheelbase Average spacing of short axles (ft): This control allows you to define the average longitudinal spacing in feet of short axles. DARWin-ME provides a default value of 12 ft. Average spacing of medium axles (ft): This control allows you to define the average longitudinal spacing in feet of medium axles. DARWin-ME provides a default value of 15 ft. Average spacing of long axles (ft): This control allows you to define the average longitudinal spacing in feet of long axles. DARWin-ME provides a default value of 18 ft. Percent of trucks with short axles: This control allows you to define the percentage of trucks in your design with short axles. DARWin-ME provides a default value of 33 percent. Percent of trucks with medium axles: This control allows you to define the percentage of trucks in your design with medium axles. DARWin-ME provides a default value of 33 percent. Percent of trucks with long axles: This control allows you to define the percentage of trucks in your design with long axles. DARWin-ME provides a default value of 34 percent. Wheelbase is not required for new flexible pavements, AC overlay of existing flexible pavement and AC overlay of fractured JPCP/CRCP. 35
 Groups dialog to load default vehicle class distribution factors based on the group that best describes the truck traffic mix for your")
: This column allows you to define the percentage of each vehicle class designated for the selected TTC group.")

36 5.3.2 Vehicle Class Distribution and Growth Vehicle Class Distribution and Growth Table Load Default Distribution: This button opens the Truck Traffic Classification (TTC) Groups dialog to load default vehicle class distribution factors based on the group that best describes the truck traffic mix for your project. Vehicle Class: This column displays the 10 classes (classes 4-13) used to classify types of trucks. Distribution (%): This column allows you to define the percentage of each vehicle class designated for the selected TTC group. The column will run a total, which displays in the bottom row and should always equal 100. Growth rate: This column allows you to define the common growth of truck volume based on the function of the truck class. Growth function: This control allows you to select the traffic growth function to compute the growth or decay in truck traffic over time (forecasting truck traffic). Select one of the following options: 36


37 None: This option sets traffic volume to remain the same throughout the design life. Linear: This option allows traffic volume to increase by constant percentage of the base year traffic across each truck class growth to happen at the defined rate. Compound: This option allows traffic volume to increase by constant percentage of the preceding year traffic across each truck class. Right-Click Menu Options Right-click on a cell in the table to access the following functionality: Copy: This menu item copies the selected value. Paste: This menu item pastes the copied value. Save to Database: This menu item saves the current table data to the database. Get from Database: This menu item retrieves database data to overwrite any information in the current table. Truck Traffic Classification (TTC) Groups This dialog box provides default Vehicle Class Distribution that you can use in your design. TTC factors are developed based on default traffic patterns noted from LTPP data for different highway classes. Way to Access this Interface In the Traffic tab, click Load Default Distribution. Truck Traffic Classification (TTC) Groups 37
38 General Category: This control allows you to select the highway functional class and updates the data marked with an asterisk in the TTC Groups Table accordingly. The asterisk denotes recommended distribution data for the selected highway functional class. Use: Enable this control to select the associated data. Disable this control to prevent DARWin-ME from including the associated data. *: This column denotes recommended distribution data for the selected highway functional class. TTC: This column displays the truck traffic classification. Bus (%): This column displays the percentage of buses on the roadway. Multi-trailer (%): This column displays the percentage of trucks with multiple trailers on the roadway. Single-trailer and single trailer unit (SU) trucks: This column describes the amount of single-trailer and single-trailer unit trucks on the roadway. Vehicle Class Distribution Table: This table displays traffic distribution values (expressed as percentage by vehicle class) that pertain to the data selected in the TTC Table. OK: This closes the dialog and saves your changes. Cancel: This closes the dialog without saving any changes. 38
 format Monthly Adjustment Table: This table allows you to distribute the truck traffic within each class throughout the year.")

39 5.3.3 Monthly Adjustment Monthly Adjustment Table Import Monthly Adjustment: This button allows you to browse and import monthly traffic volume adjustment data in MEPDG (*.txt) format Monthly Adjustment Table: This table allows you to distribute the truck traffic within each class throughout the year. Truck traffic monthly adjustment factors represent the proportion of the annual truck traffic for a given truck class that occurs in a specific month. In other words, the monthly distribution factor for a specific month is computed by dividing the monthly truck traffic for the given class for the month by the total truck traffic for that truck class for the entire year. The default values are 1.0 for each month assuming no seasonal variations in truck volume. You can override the defaults to enter project-specific values. The sum of monthly factors for all months (columnwise) for each vehicle class must equal 12. There are three ways to enter data in the table: enter data manually, retrieve data from the database, and import monthly traffic volume adjustment factors from the MEPDG (.txt) format. Right-Click Menu Options Right-click on a cell in the table to access the following functionality: Copy: This menu item copies the selected value. Paste: This menu item pastes the copied value. Import Monthly Factors in MEPDG (.txt) Format: This menu item allows you to browse for a monthly factors file that was created in using MEPDG. Save to Database: This menu item saves the current table data to the database. 39
 for each axle type (single, tandem,")

40 Get from Database: This menu item retrieves database data to overwrite any information in the current table Axles per Truck Axles Per Truck Table Axles Per Truck Table: This table allows you to define the average number of axles for each truck class (classes 4 to 13) for each axle type (single, tandem, tridem, and quad). You can override the defaults populated in the table to enter project-specific values. There are two ways to enter data in the table: enter data manually or retrieve data from the database. Right-Click Menu Options Right-click on a cell in the table to access the following functionality: Copy: This menu item copies the selected value. Paste: This menu item pastes the copied value. Save to Database: This menu item saves the current table data to the database. Get from Database: This menu item retrieves database data to overwrite any information in the current table. 40
![5.3.5 Hourly Adjustment [Not [ required for new Flexible design or HMA Overlay] Hourly Adjustment Hourly Adjustment Table: This table allows you to define the hourly distribution](/docs-images/88/115246950/images/41-0.jpg "factors, as the term describes, is the fraction (in percentage) of truck traffic traveling in a given hour relative to the 24-hour period.")

41 5.3.5 Hourly Adjustment [Not [ required for new Flexible design or HMA Overlay] Hourly Adjustment Hourly Adjustment Table: This table allows you to define the hourly distribution factors, as the term describes, is the fraction (in percentage) of truck traffic traveling in a given hour relative to the 24-hour period. It is calculated from hourly AVC/WIM or vehicle count data measured over time by dividing the average annual truck traffic within a particular hour by the AADTT. The hourly adjustment factors are constant over time and between truck classes. The sum of the 24-hourly distribution factors should equal 100. You can override the defaults populated in the table to enter project specific values. 41
42 Right-Click Menu Options Right-click on a cell in the table to access the following functionality: Copy: This menu item copies the selected value. Paste: This menu item pastes the copied value. Save to Database: This menu item saves the current table data to the database. Get from Database: This menu item retrieves database data to overwrite any information in the current table Axle Load Distribution These tabs allow you to define the axle load distribution factors, which simply represent the percentage of the total axle applications within each load interval for a specific axle type (single, tandem, tridem, and quad) and vehicle class (classes 4 through 13). The following lists the load intervals for each axle type: Single Axle Load Distributions: 3,000 lb to 40,000 lb at 1,000-lb intervals Tandem Axle Load Distributions: 6,000 lb to 80,000 lb at 2,000-lb intervals Tridem and Quad Axle Load Distributions: 12,000 lb to 102,000 lb at 3,000-lb intervals Way to Access this Interface In the Explorer tab, expand the Traffic node and double-click an Axle Distribution node. 42
 and vehicle class (classes 4 through 13). There are four ways to enter data in the table: enter data manually, import an axle load file in MEPDG (.")


43 Single Axle Load Distribution Axle Distribution Table: This table allows you to define the percentage of the total axle applications within each load interval for a specific axle type (single, tandem, tridem, and quad) and vehicle class (classes 4 through 13). There are four ways to enter data in the table: enter data manually, import an axle load file in MEPDG (.alf) format, retrieve the data from the DARWin-ME database, or import third party data in an XML format. The recommended method is to create the table in Excel and copy and paste the values into Darwin ME Axle Load Distribution tables. Right-Click Menu Options Right-click on an Axle Distribution node in the Explorer tab to access the following functionality: Copy: This menu item copies the selected value. Paste: This menu item pastes the copied value. Save to Database: This menu item saves the current table data to the database. Get from Database: This menu item retrieves database data to overwrite any information in the current table. Import XML: This menu item retrieves axle load distribution factors data from an XML file to overwrite any information in the current table. 43

44 Export XML: This menu item saves the axle load distribution factors data to an XML file. Import ALF File: This menu item retrieves axle load distribution factors data from a MEPDG (.alf) format to overwrite any information in the current table. 44

45 5.4 Climate Environmental conditions have a significant effect on the performance of both flexible and rigid pavements. Factors such as precipitation, temperature, freeze-thaw cycles, and depth to water table affect temperature and moisture contents of unbound materials, which, in turn, directly affect the load-carrying capacity of the pavement. Further, the temperature levels have a direct bearing on the stiffness in the case of asphalt materials, and temperature gradients induce stresses and deformations in the case of PCC layers. DARWin-ME considers the affects of the environmental factors. Therefore, DARWin-ME models diurnal and seasonal fluctuations in the moisture and temperature profiles in the pavement structure brought about by changes in ground water table, precipitation/infiltration, freeze-thaw cycles, and other external factors. This dialog allows you to define the effects of climatic variables on pavement responses and pavement performance. Way to Access this Interface 1. In the Explorer tab, expand Project tree and double-click on the Climate node. 2. Another way to access is to click on the white area (left of the tire) in the Pavement Structure Definition area Climate Station Climate Tab 45


46 Populating the Inputs in this Interface Climate Station Longitude (decimal.degrees): This control allows you to define the longitude of the project site. Enter west longitudes using negative values. For example, if you wanted to define the site at 47 degrees, 30 minutes W, you would enter in this control. Latitude (decimal.degrees): This control allows you to define the latitude of the project site. Enter south latitudes using negative values. For example, if you wanted to define the site at 69 degrees, 30 minutes S, you would enter in this control. Elevation (ft): This control allows you to define the elevation of the project site, which determines the lapse rate that temperatures change due to change in elevation. You can enter a negative value for a project site located below the Earth s mean sea level. Depth of water table (ft): This control opens the Water Table dialog, which allows you to define average depth of ground water table on an annual or seasonal basis. The depth is defined from the top surface of the subgrade to the ground water table. Clicking this control displays a table for entering depth values. The view of this information differs, depending on whether the Seasonal or Annual control is selected. Depth of Water Table Annual: Mutually exclusive with the Seasonal control. When this control is selected, the Depth of Water Table field in the Climate Tab displays the Annual designation and its associated water table depth, in feet. DARWin-ME by default displays this control. 46

47 Annual Depth of Water Table Period: Annual (display-only) Water Table Depth (ft): Enter the annual average water table depth value. Seasonal: Mutually exclusive with the Annual control. When this control is selected, the Depth of Water Table field in the Climate Tab displays four Seasonal designations and the water table value for each season. Selecting the Seasonal control activates the following table: Seasonal Depth of Water Table Period: The contents of this column are display-only are as follows: Spring (Seasonal) March to May Summer (Seasonal) June to August Autumn (Seasonal) September to November Winter (Seasonal) December to February Water Table Depth (ft): Enter the average water table depth values for each season. 47


48 Climate Station: This control opens the Climate Station dialog, which allows you to select a single weather station or create a virtual weather station. Click the Climate Station name to display the following drop-down menu: Use single weather station: This control allows you to select an existing weather station from the Select weather station control. DARWin-ME by default activates this control. State/Province: This control allows you to select the state or province in which your weather station is located. Select weather station: This control allows you to define the weather station that will provide climate data for the project. You can also add new stations to this list by adding new hourly climate data files to the \AASHTO\Darwin ME\HCD folder and the station information to the station.dat file located in the \AASHTO\Darwin ME\Defaults folder. Create a virtual weather station: This control allows you to select several weather stations from the Weather Station Table. DARWin-ME creates the virtual weather station using climate data from the selected stations. Selecting the Create a virtual weather station option activities the following table: Creating a Virtual Weather Station Weather Station Table: This table allows you to define the weather stations that will be combined and averaged to create data for a virtual weather station. Select weather stations based on the following information: Distance (miles): This column displays the distance in miles between the weather station and associated city. City: This column displays the city associated with the weather station. State: This column displays the state/province where the weather station is located. Latitude (decimal degrees): This column displays the latitude of the weather station. 48

49 Longitude (decimal degrees): This column displays the longitude of the weather station. Elevation (ft.): This column displays the elevation of the weather station. Description: This column displays the name of the weather station. First month/year: This column displays the month and year that data is first available for the weather station. Last month/year: This column displays the month and year that data is last available for the weather station. Other ways to use Climate Data DARWin-ME allows other ways to use climate data: You can import a previously created climate data file in MEPDG (*.ICM format) by clicking the Import ICM button on the Hourly climate data tab. Make sure that Import MEPDG file formats in the Options tree of the Explorer pane is set as TRUE. You can import climate data in XML format from an external source or folder using the Import option on the menu. You can also import climate data in XML format from an agency database by using the Get from Database option. You can access this option by right clicking the climate node in the Explorer pane under the Projects treeview Summary Tab This tab allows you to view the summary of input climate data for your selected weather station. Climate Summary: This control allows you to view the summary of temperature and precipitation data for your selected weather station. Monthly Temperatures: This control allows you to view the mean temperature for each month for your selected weather station. 49


50 5.4.3 Hourly Climate Data Tab Climate Summary Tab This tab tabulates the hourly climate records for your selected weather station. This tab also allows you to view the available hourly records for the start and end dates you select and verify if these records meet the minimum quality requirements. Start Date: This control allows you to define beginning date of the date range for which you want weather data. End Date: This control allows you define the end date of the date range for which you want weather data. Verify Weather: This button verifies the values you defined in the Weather Data Table. 50


51 Hourly Climate Data Weather Data Table: This table allows you to define various aspects of climate for the selected date range. Define the following values: Date/Hour: This column allows you to define the date and time associated with the climate information defined in the row. Temperature: This column allows you to define the temperature associated with the date/hour and other climate information defined in the row. Wind Speed: This column allows you to define the wind speed associated with the date/hour and other climate information defined in the row. Sunshine: This column allows you to define the percentage of sunshine associated with the date/hour and other climate information defined in the row. Precipitation: This column allows you to define the inches of precipitation associated with the date/hour and other climate information defined in the row. Humidity: This column allows you to define the humidity percent associated with the date/hour and other climate information defined in the row. Water Table: This column allows you to define the water table associated with the date/hour and other climate information defined in the row. Right-click a cell to perform one of the following actions: Copy: This menu item copies the value(s) in the highlighted cell(s). Paste Special: This menu item pastes sets of sparse data values. 51

52 Paste: This menu item pastes copied values into the highlighted cell(s). Delete: This menu item deletes the value(s) in the highlighted cell(s) Verify Weather Click on the Verify Weather button located on the top right side of the Hourly Climate Data tab. This control allows you to perform quality checks of climate data for the station you selected. Clicking the Verify Weather button allows DARWin-ME to check for the following: If the data value of an hourly record is within an acceptable range If the difference between the data values of two consecutive hourly records are within an acceptable range If there are any missing or blank data in a record If an hourly record does not meet all the criteria mentioned above, the program displays an error or a warning message listed in the Error List Pane area of the program. Doubleclicking the error message takes you to the hourly record of concern. You must correct the erroneous data value. 52
Applied Research Associates. Release Notes. Build
 Applied Research Associates Release Notes Build 2.0.19 January 22 nd 2014 Contents 1 INTRODUCTION... 3 2 ENHANCEMENTS... 3 3 ISSUES RESOLVED... 4 4 OUTSTANDING ISSUES... 13 5 FAQ... 14 6 UPGRADING... 15
Student Guide. Product P2. Validation of TxDOT Flexible Pavement Skid Prediction Model: Workshop
 Student Guide Product 0-6746-01-P2 Validation of TxDOT Flexible Pavement Skid Prediction Model: Workshop Published: May 2017 VALIDATION OF TXDOT FLEXIBLE PAVEMENT SKID PREDICTION MODEL: WORKSHOP by Arif
Hot-Mix Asphalt and Flexible Pavement Design: the MEPDG
 Hot-Mix Asphalt and Flexible Pavement Design: the MEPDG Kevin D. Hall, Ph.D., P.E. Professor and Head, Dept. of Civil Engineering University of Arkansas Flexible Pavement Research Symposium Denver, Colorado
INPUT DATA PROCEDURES
 79 SECTION 7 INPUT DATA PROCEDURES This section describes the forms and message boxes used to enter input data for an RSRAP optimization problem. These forms and message boxes implement Steps 1 through
Interactive Highway Safety Design Model (IHSDM) Workshop Nevada DOT Las Vegas, NV February 13, 2014
 Workshop Nevada DOT Las Vegas, NV February 13, 2014") Interactive Highway Safety Design Model (IHSDM) Workshop Nevada DOT Las Vegas, NV February 13, 2014 Overview Hands-on Exercises: IHSDM Crash Prediction Module (CPM) The Crash Prediction Module estimates
Interactive Highway Safety Design Model (IHSDM) Workshop Nevada DOT Las Vegas, NV February 13, 2014 Overview Hands-on Exercises: IHSDM Crash Prediction Module (CPM) The Crash Prediction Module estimates
Smoothness of Pavement in Weighin-Motion
 Standard Specification for Smoothness of Pavement in Weighin-Motion (WIM) Systems AASHTO Designation: MP 14-05 American Association of State Highway and Transportation Officials 444 North Capitol Street
OUTSTANDING ISSUES...
 Contents 1 INTRODUCTION...2 2 ISSUES RESOLVED...2 3 OUTSTANDING ISSUES... 24 4 FAQ... 25 5 UPGRADING... 25 6 CONTACT INFORMATION... 26 1 Release Notes Build 1.3.28 February 15, 2013 Introduction Version
Economic Crash Analysis Tool. Release Notes
 Release Notes August 2017 Release: 1. Project Information Worksheet: a. Update: Removed the design exception report option b. Enhancement: The first question has been expanded to provide better clarity
Polymer-Modified Asphalts Enhancing HMA Performance. New Orleans, Louisiana January 28, 2003
 Polymer-Modified Asphalts Enhancing HMA Performance New Orleans, Louisiana January 28, 2003 Presentation Overview 1. Introduction 2. Phase I Overview 3. Summary of Interim Results & Findings Study Objectives
Pavement Preservation and the Role of Bituminous Surface Treatments A Washington State View. Minnesota Pavement Conference February 14, 2008
 Pavement Preservation and the Role of Bituminous Surface Treatments A Washington State View Minnesota Pavement Conference February 14, 2008 1 The Situation 2 WSDOT policy, in essence, mandated use of BSTs
Detecting and Correcting Localized Roughness Features
 0 0 Detecting and Correcting Localized Features Gary J. Higgins Earth Engineering Consultants, LLC Greenfield Drive Windsor, Colorado 00 Tel: 0--0; Fax: 0--0; Email: garyh@earth-engineering.com Word count:,
MS2. Modern Traffic Analytics ms2soft.com
 MS2 Modern Traffic Analytics ms2soft.com Updated: October 31, 2014 The Traffic Count Database System (TCDS) module is a powerful tool for the traffic engineer or planner to organize an agency's traffic
James L. Brown, Larry J. Buttler and William P. Ezzell
 ~.,_~w._'''... SURVEY OF STRUCTURAL FAILURES IN A CONTINUOUSLY REINFORCED CONCRETE PAVEMENT By James L. Brown, Larry J. Buttler and William P. Ezzell Special Study No.. Highway Design Division, Research
AISIBEAM User's Manual (Version 3.0)
") AISIBEAM User's Manual (Version 3.0) Shabin Taavoni, Ph.D., PE, title Structural Software Inc. location John C. Huang Ph.D., PE, Principal CHC Engineering, LLC Herndon, VA Scope of Software The software
AISIBEAM User's Manual (Version 3.0) Shabin Taavoni, Ph.D., PE, title Structural Software Inc. location John C. Huang Ph.D., PE, Principal CHC Engineering, LLC Herndon, VA Scope of Software The software
MATERIALS MANAGEMENT SYSTEM (MMS) USER S GUIDE
 USER S GUIDE") MATERIALS MANAGEMENT SYSTEM (MMS) USER S GUIDE Version. STATE HIGHWAY ADMINISTRATION STATE OF MARYLAND June, 08 Table of Contents Overview... 8. MATERIAL MANAGEMENT SYSTEM (MMS) GOALS... 8. MMS BENEFITS...
MATERIALS MANAGEMENT SYSTEM (MMS) USER S GUIDE Version. STATE HIGHWAY ADMINISTRATION STATE OF MARYLAND June, 08 Table of Contents Overview... 8. MATERIAL MANAGEMENT SYSTEM (MMS) GOALS... 8. MMS BENEFITS...
Valley. Scheduling. Client User Manual _ Valmont Industries, Inc., Valley, NE USA. All rights reserved.
 Valley Scheduling Client User Manual 09805_0 09 Valmont Industries, Inc., Valley, NE 6806 USA. All rights reserved. www.valleyirrigation.com Valley Scheduling This page was left blank intentionally Table
NJDOT Companion Manual to the 1993 AASHTO Guide for the Design of Pavement Structures
 FHWA-NJ-2003-007 NJDOT Companion Manual to the 1993 AASHTO Guide for the Design of Pavement Structures FINAL REPORT June 2003 Submitted by Mr. Patrick Szary Research Engineer and Associate Director and
Data Mining of the Caltrans. Pavement Management System (PMS) Database
 Database") Data Mining of the Caltrans Pavement Management System (PMS) Database Draft report prepared for the California Department of Transportation by Jeremy Lea, Research Engineer Infrastructure Engineering Transportek,
Data Mining of the Caltrans Pavement Management System (PMS) Database Draft report prepared for the California Department of Transportation by Jeremy Lea, Research Engineer Infrastructure Engineering Transportek,
ADOT Experience with Warm Mix Asphalt. Chad Auker Flagstaff Regional Materials Engineer ADOT - Materials Group
 ADOT Experience with Warm Mix Asphalt Chad Auker Flagstaff Regional Materials Engineer ADOT - Materials Group Overview of Presentation History of WMA in ADOT Initial WMA Projects (2009 2010) ADOT/AGC WMA
Guidelines for Traffic Counting. May 2013
 Guidelines for Traffic Counting May 2013 Guidelines for Traffic Counting Matthew Rodwell Hastings District Council Abbreviations ADT AADT HCV HPMV NZTA RAMM RCA TMS VKT Average Daily Traffic Annual Average
Multi-Speed Deflectometer. An innovative tool for local authority network asset management
 Multi-Speed Deflectometer An innovative tool for local authority network asset management What is the MSD? Falling Weight Deflectometer The Multi-Speed Deflectometer (MSD) is a new, innovative technique
SAS Publishing SAS. Forecast Studio 1.4. User s Guide
 SAS Publishing SAS User s Guide Forecast Studio 1.4 The correct bibliographic citation for this manual is as follows: SAS Institute Inc. 2006. SAS Forecast Studio 1.4: User s Guide. Cary, NC: SAS Institute
Autodesk Moldflow Insight AMI Cool Analysis Products
 Autodesk Moldflow Insight 2012 AMI Cool Analysis Products Revision 1, 22 March 2012. This document contains Autodesk and third-party software license agreements/notices and/or additional terms and conditions
Accuracy of the Rubicon Toolbox Finite Element Model
 Accuracy of the Rubicon Toolbox Finite Element Model Introduction This document deals with the accuracy and recommended use of the Rubicon Toolbox Finite Element module. The document is intended to provide
New Technologies for Pavement Evaluation
 New Technologies for Pavement Evaluation TxDOT 3-D Pavement Survey Technology For 86 th Annual Transportation Short Course at Texas A&M University, 2012 Dr. Yaxiong (Robin) Huang, Robin.Huang@txdot.gov
Journal of Emerging Trends in Computing and Information Sciences
 Method of Fault Data Analysis of Sensor Node based on Wireless Data Communication Protocols Seung-Ki Ryu * Research Fellow, Korea Institute of Civil Engineering and Building Technology, Korea (*corresponding
Road Surface Texture Evaluation with 3-D Laser Data
 Road Surface Texture Evaluation with -D Laser Data Shuvo Islam 1, Mustaque Hossain, and Humaira Zahir ( 1 Kansas State University, Manhattan, KS, USA, sislam@ksu.edu) ( Kansas State University, Manhattan,
Todd V. Scholz, Ph.D., P.E. Roadworthy Research & Design 1580 Royal Drive Reno, NV and
 LIFE CYCLE COSTS FOR LIME IN HOT MIX ASPHALT VOLUME III - LCCA SOFTWARE USER S GUIDE by Todd V. Scholz, Ph.D., P.E. Roadworthy Research & Design 1580 Royal Drive Reno, NV 89503 and R.G. Hicks, P.E. Professor
Rutgers Interactive Lane Closure Application (RILCA) for Work Zone Planning User Manual. New Jersey Highway Authority. Garden State Parkway
 for Work Zone Planning User Manual. New Jersey Highway Authority. Garden State Parkway") Rutgers Interactive Lane Closure Application (RILCA) for Work Zone Planning User Manual Prepared for Garden State Parkway New Jersey Highway Authority April 2007 Developed by: Rutgers University Intelligent
Rutgers Interactive Lane Closure Application (RILCA) for Work Zone Planning User Manual Prepared for Garden State Parkway New Jersey Highway Authority April 2007 Developed by: Rutgers University Intelligent
1. Managing Information in Table
 1. Managing Information in Table Spreadsheets are great for making lists (such as phone lists, client lists). The researchers discovered that not only was list management the number one spreadsheet activity,
Demand Impact Model User Manual
 Final Demand Impact Model User Manual Part of the Massachusetts Residential Retrofit and Low Income Program Area Evaluation June 2012 Prepared by: The Cadmus Group, Inc. Energy Services Division 720 SW
AASHTOWare BrR - SIMPLE SPAN PRESTRESSED I BEAM EXAMPLE - BR 76015
 AASHTOWare BrR - SIMPLE SPAN PRESTRESSED I BEAM EXAMPLE - BR 76015 M N D O T B R I D G E S T A T E A I D Page 1 PS1 - Simple Span Prestressed I Beam Example (BrR 6.7.1) 1. From the Bridge Explorer create
FleetLocate v2.7 User Guide
 FleetLocate v2.7 User Guide User Guide v2.7 - FleetLocate: Fleet & Asset Intelligence Contents FleetLocate Fleet Intelligence v2.7 User Guide... 5 Map Tab... 6 Changing and Printing the Map View... 6 Bookmarks
Contact Center Advisor and Workforce Advisor. Genesys Performance Management Advisors TM. Administration User Manual Release 3.3
 Genesys Performance Management Advisors TM Administration User Manual Release 3.3 Genesys Advisor, Contact Center Advisor, Workforce Advisor, Alert Management, Resource Management, and Genesys Performance
1. Managing Information in Table
 1. Managing Information in Table Spreadsheets are great for making lists (such as phone lists, client lists). The researchers discovered that not only was list management the number one spreadsheet activity,
Highway Performance Monitoring System
 Highway Performance Monitoring System Version 1.0 June 2011 Quick Start Guide for Version 8.0 Federal Highway Administration Table of Contents Chapter 1 Introduction... 1 Chapter 2 HPMS Workflow... 2 Chapter
Pavement Surface Microtexture: Testing, Characterization and Frictional Interpretation
 Pavement Surface Microtexture: Testing, Characterization and Frictional Interpretation S h u o L i, S a m y N o u r e l d i n, K a r e n Z h u a n d Y i J i a n g Acknowledgements This project was sponsored
Development of design tool for Nigerian (CBR) design of flexible pavement
 design of flexible pavement") Available online atwww.scholarsresearchlibrary.com Archives of Applied Science Research, 2015, 7 (10):1-16 (http://scholarsresearchlibrary.com/archive.html) ISSN 0975-508X CODEN (USA) AASRC9 Development
Available online atwww.scholarsresearchlibrary.com Archives of Applied Science Research, 2015, 7 (10):1-16 (http://scholarsresearchlibrary.com/archive.html) ISSN 0975-508X CODEN (USA) AASRC9 Development
CHAPTER 11. Learn to use GEOPAK Automated Superelevation dialog box and Autoshape Builder to apply superelevation to a roadway.
 CHAPTER 11 Superelevation 11.1 Introduction Objectives Project Manager Learn to use GEOPAK Automated Superelevation dialog box and Autoshape Builder to apply superelevation to a roadway. Calculate Superelevation
NCHRP Project No. NCHRP 9-44 A. Validating an Endurance Limit for HMA Pavements: Laboratory Experiment and Algorithm Development
 NCHRP Project No. NCHRP 9-44 A Validating an Endurance Limit for HMA Pavements: Laboratory Experiment and Algorithm Development Appendix 3 Project Lab Test Results Inserted into the Mechanistic Empirical
DESIGN CRITERIA MEMORANDUM
 State Route 49 Realignment Study DESIGN CRITERIA MEMORANDUM ATTACHMENT G SR 49 Realignment Study STATE ROUTE 49 El Dorado to Coloma El Dorado County, CA DESIGN CRITERIA MEMORANDUM Introduction The El
Facility Explorer for Validated Environments
 Facility Explorer for Validated Environments User s Guide 1 Facility Explorer for Validated Environments Introduction Facility Explorer for Validated Environments is an information-based software application
Introduction Texture/Friction Measurement at Winnipeg International Airport Data Analysis Conclusions
 Texture/Friction Measurements and Analysis at Runway 13-31 of James Armstrong Richardson International Airport in Winnipeg Qingfan Liu, EIT, PhD candidate, University of Manitoba Ahmed Shalaby, PhD, P.
Advisor Workstation Training Manual: Working in the Research Module
 Advisor Workstation Training Manual: Working in the Research Module Overview of the Research module - - - - - - - - - - - - - - - - 1 What you will learn in this section - - - - - - - - - - - - - - - -
PowerTeacher Administrator User Guide. PowerTeacher Gradebook
 PowerTeacher Gradebook Released June 2011 Document Owner: Documentation Services This edition applies to Release 2.3 of the PowerTeacher Gradebook software and to all subsequent releases and modifications
I-96 Case Study: Jointed Concrete Pavement Curling and Warp Presented in the Context of Pavement Asset Management
 I-96 Case Study: Jointed Concrete Pavement Curling and Warp Presented in the Context of Pavement Asset Management Christopher R. Byrum, PhD, PE PAVEMENT ANALYSIS: Soil-Structure Interaction Engineering
PRECISION ESTIMATES OF AASHTO T 201, AASHTO T 202, and AASHTO T 49
 Project No. 10-87, Task2 (Phase A-2) FINAL 11/27/13 PRECISION ESTIMATES OF AASHTO T 201, AASHTO T 202, and AASHTO T 49 Appendices Prepared for National Cooperative Highway Research Program Transportation
State of New Jersey Department of Transportation. Proposal Estimating System and Letting & Award System Guide
 State of New Jersey Department of Transportation Proposal Estimating System and Letting & Award System Guide Prepared by Trns port Team December 2006 Ver 1.0 Proposal Estimating System and Letting & Award
FRICTION TESTING KJ LAW (DYNATEST) SKID TRAILER
 SKID TRAILER") Version 1 June 2009 FRICTION TESTING KJ LAW (DYNATEST) SKID TRAILER General Description Pavement surface friction is regarded as an indicator of safety of vehicles on highways because it is a measure of
Version 1 June 2009 FRICTION TESTING KJ LAW (DYNATEST) SKID TRAILER General Description Pavement surface friction is regarded as an indicator of safety of vehicles on highways because it is a measure of
LONG TERM PAVEMENT PERFORMANCE PROGRAM DIRECTIVE
 LONG TERM PAVEMENT PERFORMANCE PROGRAM DIRECTIVE For the Technical Direction of the LTPP Program Program Area: Traffic Directive Number: TDP-35 Date: May 19, 2004 Supersedes: TDP-33 Subject: Release of
RECOMMENDATION ITU-R P DIGITAL TOPOGRAPHIC DATABASES FOR PROPAGATION STUDIES. (Question ITU-R 202/3)
") Rec. ITU-R P.1058-1 1 RECOMMENDATION ITU-R P.1058-1 DIGITAL TOPOGRAPHIC DATABASES FOR PROPAGATION STUDIES (Question ITU-R 202/3) Rec. ITU-R P.1058-1 (1994-1997) The ITU Radiocommunication Assembly, considering
Rec. ITU-R P.1058-1 1 RECOMMENDATION ITU-R P.1058-1 DIGITAL TOPOGRAPHIC DATABASES FOR PROPAGATION STUDIES (Question ITU-R 202/3) Rec. ITU-R P.1058-1 (1994-1997) The ITU Radiocommunication Assembly, considering
SAS Visual Analytics 8.2: Working with Report Content
 SAS Visual Analytics 8.2: Working with Report Content About Objects After selecting your data source and data items, add one or more objects to display the results. SAS Visual Analytics provides objects
FRICTION TESTING KJ LAW (DYNATEST) SKID TRAILER
 SKID TRAILER") Version 3 November 2016 FRICTION TESTING KJ LAW (DYNATEST) SKID TRAILER General Description Pavement surface friction is regarded as an indicator of safety of vehicles on highways because it is a measure
Version 3 November 2016 FRICTION TESTING KJ LAW (DYNATEST) SKID TRAILER General Description Pavement surface friction is regarded as an indicator of safety of vehicles on highways because it is a measure
Overview of the EMF Refresher Webinar Series. EMF Resources
 Overview of the EMF Refresher Webinar Series Introduction to the EMF Working with Data in the EMF viewing & editing Inventory Data Analysis and Reporting 1 EMF User's Guide EMF Resources http://www.cmascenter.org/emf/internal/guide.html
Development of Warm Mix Asphalt Policies and Specifications in Minnesota
 Development of Warm Mix Asphalt Policies and Specifications in Minnesota Tim Clyne, Greg Johnson, John Garrity MnDOT 2 nd International Warm Mix Conference October 13, 2011 Acknowledgements MnDOT Greg
Detector Data Extractor V3.5 User Manual
 TDRL, DetectorExtractor V3.5 Manual, Page 1 Detector Data Extractor V3.5 User Manual Provided by Transportation Data Research Laboratory A Division of Northland Advanced Transportation Systems Research
WINPRES USER MANUAL. Version 1.0. Robert Lytton Professor Texas A&M University. Charles Aubeny Associate Professor Texas A&M University
 WINPRES USER MANUAL Version 1.0 by Robert Lytton Professor Texas A&M University Charles Aubeny Associate Professor Texas A&M University Gyeong Taek Hong Research Assistant Texas Transportation Institute
STATEWIDE WORKLOAD ANALYTIC TOOL
 ADMINISTRATOR S REFERENCE GUIDE & SYSTEM DOCUMENTATION STATEWIDE WORKLOAD ANALYTIC TOOL PREPARED FOR: MINNESOTA DEPARTMENT OF HUMAN SERVICES BY: HORNBY ZELLER ASSOCIATES, INC. TABLE OF CONTENTS INTRODUCTION
A parabolic curve that is applied to make a smooth and safe transition between two grades on a roadway or a highway.
 A parabolic curve that is applied to make a smooth and safe transition between two grades on a roadway or a highway. VPC: Vertical Point of Curvature VPI: Vertical Point of Intersection VPT: Vertical Point
SPEED SURVEY ANALYSIS SYSTEM
 SPEED SURVEY ANALYSIS SYSTEM user s manual CROSSROADS SOFTWARE 210 W. Birch Street, Suite 207 Brea, CA 92821 (714) 990-6433 Fax: (714) 990-5628 www.crossroadssoftware.com Chapter One: Introducing the Speed
1. GENERAL SYSTEM CHANGES. 2. GRILLAGE TEMPLATES - Skewed Grillages Type 2, 3
 ACES V7.0 MAJOR NEW FEATURES 1. GENERAL SYSTEM CHANGES WINDOWS 7: The program has been compiled to run under the WINDOWS 7 Professional (64 Bit) operating system. However, the same version will also run
Located at Located in the Traffic Signing Category.
 Located at https://mdotjboss.state.mi.us/tssd/tssdhome.htm# Located in the Traffic Signing Category. August 29 th, 2018: The following updates were made to the web site. SIGN-100-G: Dated 05/24/18 - The
Illinois Bituminous Paving Conference Imad L. Al-Qadi. ICT - Where Transportation and Excellence Meet
 Illinois Bituminous Paving Conference Imad L. Al-Qadi ICT - Where Transportation and Excellence Meet 1 ICT Vision, Since its inception in 2005 Serve the transportation needs of IDOT, the State of Illinois,
NCAR SUMMER COLLOQUIUM: July 24-Aug.6, 2011 Boulder, Colorado, USA. General Large Area Crop Model (GLAM) TUTORIAL
 TUTORIAL") NCAR SUMMER COLLOQUIUM: July 24-Aug.6, 2011 Boulder, Colorado, USA General Large Area Crop Model (GLAM) TUTORIAL Gizaw Mengistu, Dept. of Physics, Addis Ababa University, Ethiopia This document provides
NCAR SUMMER COLLOQUIUM: July 24-Aug.6, 2011 Boulder, Colorado, USA General Large Area Crop Model (GLAM) TUTORIAL Gizaw Mengistu, Dept. of Physics, Addis Ababa University, Ethiopia This document provides
PART III: WESTRACK DATABASE
 PART III: WESTRACK DATABASE CONTENTS 431 PART III: WESTRACK DATABASE 435 CHAPTER 1 INTRODUCTION 1.1 Background, 435 1.2 Objectives, 435 1.3 Scope of Data Included in the Database, 435 1.4 Scope of This
Direct Image Viewer User Tutorial
 Direct Image Viewer User Tutorial A guide to understanding the functions and features within the Direct Image Viewer to best present the data and to get the most understanding from the Direct Image logs.
ESTIMATING PARAMETERS FOR MODIFIED GREENSHIELD S MODEL AT FREEWAY SECTIONS FROM FIELD OBSERVATIONS
 0 ESTIMATING PARAMETERS FOR MODIFIED GREENSHIELD S MODEL AT FREEWAY SECTIONS FROM FIELD OBSERVATIONS Omor Sharif University of South Carolina Department of Civil and Environmental Engineering 00 Main Street
EVERSERIES USER S GUIDE Pavement Analysis Computer Software and Case Studies
 INFORMATION AND CHAPTERS IN SUPPORT OF THE BACKCALCULATION TOOL WERE EXTRACTED FROM: EVERSERIES USER S GUIDE Pavement Analysis Computer Software and Case Studies August 2005 Washington State Department
Roadway Alignments and Profiles
 NOTES Module 15 Roadway Alignments and Profiles In this module, you learn how to create horizontal alignments, surface profiles, layout (design) profiles, and profile views in AutoCAD Civil 3D. This module
Planning User Manual
 Planning 11.1.2 User Manual Budget Office May 2011 Hyperion Planning/Workspace/Reports Hyperion Planning Overview.... 3 Logging In.... 3 Setting User Preferences.... 3 Workspace Logging In..4 Navigating
State of New Jersey Department of Transportation. Construction Cost Estimating Guide. December, 2006 Prepared by Trns port Support Group
 State of New Jersey Department of Transportation Construction Cost Estimating Guide December, 2006 Prepared by Trns port Support Group Table of Contents 1. Introduction...1-1 1.1 Support... 1-1 1.2 Submittal...
EDVTS TUTORIAL. Chapter. Tutorial
 Tutorial EDVTS Chapter 5 This tutorial examines a common use for EDVTS: the simulation analysis of a tractor-trailer off-ramp rollover accident. The purpose of the analysis is to determine if the rollover
FWD Data Analysis. version Office of Materials Pavement Engineering Section Pavement Design Unit 1400 Gervais Ave Maplewood, MN
 FWD Data Analysis version 2.2.5 Office of Materials Pavement Engineering Section Pavement Design Unit 1400 Gervais Ave Maplewood, MN 55109-2044 FWD Data Analysis First of all, this program is a work in
Central Valley School District Math Curriculum Map Grade 8. August - September
 August - September Decimals Add, subtract, multiply and/or divide decimals without a calculator (straight computation or word problems) Convert between fractions and decimals ( terminating or repeating
3D Laser Imaging for Pavement Survey at 60 mph and True 1mm Resolution
 3D Laser Imaging for Pavement Survey at 60 mph and True 1mm Resolution Kelvin C. P. Wang Oklahoma State University & WayLink kelvin.wang@okstate.edu 2013 Arizona Pavements/Materials Conference ASU MU,
Traffic Interface Manager User Guide V4.5
 Traffic Interface Manager User Guide V4.5 The Global Leader in Infrastructure Asset Management Highways by Exor the world s leading highways management system This page intentionally blank Copyright Exor
MS2. Modern Traffic Analytics ms2soft.com
 MS2 ms2soft.com Updated: October 31, 2014 The Traffic Crash Location System (TCLS) was designed to manage all crash statistics and crash events within a designated area. This guide is intended for users
ENHANCED PARKWAY STUDY: PHASE 3 REFINED MLT INTERSECTION ANALYSIS
 ENHANCED PARKWAY STUDY: PHASE 3 REFINED MLT INTERSECTION ANALYSIS Final Report Prepared for Maricopa County Department of Transportation Prepared by TABLE OF CONTENTS Page EXECUTIVE SUMMARY ES-1 STUDY
SHRP2 Project L07 Analysis Tool for Design Treatments to Address Nonrecurrent Congestion
 SHRP2 Project L07 Analysis Tool for Design Treatments to Address Nonrecurrent Congestion Annotated Graphical User s Guide Version 2.0 March 14, 2014 1 INTRODUCTION The SHRP2 Project L07 Analysis Tool is
User Guide for the WegenerNet Data Portal
 User Guide for the WegenerNet Data Portal (v9/18feb2010) The WegenerNet Data Portal provides access to measurement data from the climate stations as well as detailed information about the project. Quality-checked
Experiences of integrated GPR and Laser Scanner analysis We should not only look down but also around
 NGM 2016 Reykjavik Proceedings of the 17 th Nordic Geotechnical Meeting Challenges in Nordic Geotechnic 25 th 28 th of May Experiences of integrated GPR and Laser Scanner analysis We should not only look
Local Road Surface Selection Tool Technical Report
 Department Publication No. 293 April 2017 Local Road Surface Selection Tool Technical Report Prepared by: Andrew Wrucke, P.E. Brad Wentz, P.E. Kimberly Vachal, Ph.D. Program development for this project
GEOGRAPHIC INFORMATION SYSTEMS Lecture 18: Spatial Modeling
 Spatial Analysis in GIS (cont d) GEOGRAPHIC INFORMATION SYSTEMS Lecture 18: Spatial Modeling - the basic types of analysis that can be accomplished with a GIS are outlined in The Esri Guide to GIS Analysis
Version 9 User Guide for. Developed for Omnitracs
 Version 9 User Guide for Developed for Omnitracs Table of Contents Welcome to CoPilot Truck 4 Driving Screen 4 Driving Menu 5 GO TO MENU: Single Destination Navigation 6 Address 6 My Places 7 Points of
User's Guide. For CarChip and CarChip E/X 8210 & 8220
 User's Guide TM For CarChip and CarChip E/X 8210 & 8220 Product Number: 8210, 8220 Davis Instruments Part Number: 7395.064 DriveRight CarChip User s Manual Rev A (January 2, 2003) Davis Instruments Corp.,
Application Brief TROXLER MODEL 3430 Plus / 3440 Plus RoadReader Plus Nuclear Moisture Density Gauge
 Application Brief TROXLER MODEL 3430 Plus / 3440 Plus RoadReader Plus Nuclear Moisture Density Gauge September 2007 Introduction The Troxler Model 3430+ / 3440+ nuclear moisture/density gauges are the
Fleet Director Help File
 Fleet Director Help File 1 Contents 1. WELCOME TO THE FLEET DIRECTOR HELP FILE... 4 FLEET DIRECTOR COMPONENTS... 5 SYSTEM REQUIREMENTS... 7 INSTALLING MICROSOFT SILVERLIGHT... 7 LOGGING IN TO FLEET DIRECTOR...
North Central Superpave Center Update. Becky McDaniel NCAUPG Meeting January 28, 2004 Omaha, Nebraska
 North Central Superpave Center Update by Becky McDaniel NCAUPG Meeting January 28, 2004 Omaha, Nebraska What is the NCSC Up To? Research Equipment/Protocol Evaluations Training Communication and Technology
RClimTool USER MANUAL
 RClimTool USER MANUAL By Lizeth Llanos Herrera, student Statistics This tool is designed to support, process automation and analysis of climatic series within the agreement of CIAT-MADR. It is not intended
PennDOT e-notification Bureau of Business Solutions and Services Highway/Engineering Applications Division
 PennDOT e-notification Bureau of Business Solutions and Services Highway/Engineering Applications Division STLRFD No. 013 October 17, 2016 Release of Version 2.4.0.0 The Department s LRFD Steel Girder
NCHRP 9-47A Update October 13, 2010
 NCHRP 9-47A Update October 13, 2010 Overview Acknowledgements Research Objectives Performance of Select WMA Field Projects Lab Results that cause concerns with WMA NCAT Test Track WMA sections NCHRP 9-47A
LICENSE PLATE RECOGNITION SETUP AND FIELD INSTALLATION GUIDE
 LICENSE PLATE RECOGNITION SETUP AND FIELD INSTALLATION GUIDE This document was created to benchmark the settings and tools needed to successfully deploy LPR with the ipconfigure s Enterprise Surveillance
Evolution M Core Training Contract, Sales & Cash Book Issue 2
 Evolution M Core Training Contract, Sales & Cash Book Issue 2 Contents Training............................................................................................ 1 Contract Ledger........................................................................................
Traffic Impact Analysis Shotwell Road Residential Clayton, NC
 Shotwell Road Residential Clayton, NC TABLE O CONTENTS 1. INTROUCTION...1 1.1. Site Location and Study Area...1 1.2. Proposed Land Use and Site Access...2 1.3. Adjacent Land Uses...2 1.4. Existing Roadways...2
RSPile. Tutorial 3 Grouped Pile Analysis. Pile Analysis Software. Grouped Pile Analysis
 RSPile Pile Analysis Software Tutorial 3 Grouped Pile Analysis Grouped Pile Analysis Introduction This tutorial will demonstrate how to model grouped piles under a cap. The finished product of this tutorial
70B. Box and Whisker Plots. Vocabulary: Mean. Median. Mode. Range. Upper Extreme. Upper Quartile. Lower Extreme. Lower Quartile. Inter-Quartile Range
 Algebra 1: Statistics Vocabulary: Mean Name: Block: 70B Median Mode Range Upper Extreme Upper Quartile Lower Extreme Lower Quartile Inter-Quartile Range Box and Whisker Plots Calculator Steps for Mean,
Overview September 7, 2017
 Overview September 7, 2017 Purpose The purpose of this presentation is to provide an overview of the changes to the required deliverables and workflow for developing plans and models for Illinois DOT projects
KS3 MATHEMATICS THRESHOLD DESCRIPTORS NUMBER (Incl. RATIO & PROPORTION)
") KS3 MATHEMATICS THRESHOLD DESCRIPTORS NUMBER (Incl. RATIO & PROPORTION) Topic Integers Decimals Approximation Fractions Concepts and skills Read, write, order and compare positive integers up to 1000 Add
KS3 MATHEMATICS THRESHOLD DESCRIPTORS NUMBER (Incl. RATIO & PROPORTION) Topic Integers Decimals Approximation Fractions Concepts and skills Read, write, order and compare positive integers up to 1000 Add
Length-Based Vehicle Classification Using Images from Uncalibrated Video Cameras
 Length-Based Vehicle Classification Using Images from Uncalibrated Video Cameras Ryan P. Avery, Yinhai Wang, and G. Scott Rutherford Abstract Due to the marked difference in many characteristics between
SAS Visual Analytics 8.2: Getting Started with Reports
 SAS Visual Analytics 8.2: Getting Started with Reports Introduction Reporting The SAS Visual Analytics tools give you everything you need to produce and distribute clear and compelling reports. SAS Visual