Traffic Impact Analysis Shotwell Road Residential Clayton, NC
|
|
|
- Philomena Ruth Foster
- 5 years ago
- Views:
Transcription

1 Shotwell Road Residential Clayton, NC
2
3 TABLE O CONTENTS 1. INTROUCTION Site Location and Study Area Proposed Land Use and Site Access Adjacent Land Uses Existing Roadways EXISTING (2017) PEAK HOUR CONITIONS Existing (2017) Peak Hour Traffic Analysis of Existing (2017) Peak Hour Traffic BACKGROUN (2019) PEAK HOUR CONITIONS Ambient Traffic Growth Adjacent evelopment Traffic uture Roadway Improvements Background (2019) Peak Hour Traffic Volumes Analysis of Background (2019) Peak Hour Traffic SITE TRIP GENERATION AN ISTRIBUTION Trip Generation Site Trip istribution and Assignment COMBINE (2019) TRAIC CONITIONS Combined (2019) Peak Hour Traffic Volumes Analysis of Combined (2019) Peak Hour Traffic TRAIC ANALYSIS PROCEURE Adjustments to Analysis Guidelines CAPACITY ANALYSIS US Highway 70 Business and Shotwell Road US Highway 70 Business and Enterprise rive Shotwell Road and Cameron Way / Stallings Mill Site rive Shotwell Road and Old US Highway Shotwell Road and Executive rive CONCLUSIONS RECOMMENATIONS...33 i
4 LIST O IGURES igure 1 Site Location Map... 4 igure 2 Preliminary Site Plan... 5 igure 3 Existing Lane Configurations... 6 igure 4 Existing (2017) Peak Hour Traffic... 8 igure 5 Projected (2019) Peak Hour Traffic igure 6 Adjacent evelopment Trips igure 7 Background (2019) Peak Hour Traffic igure 8a Site Trip istribution igure 8b Alternate Scenario Site Trip istribution igure 9a Site Trip Assignment igure 9b Alternate Scenario Site Trip Assignment igure 10a Combined (2019) Peak Hour Traffic igure 10b Alternate Scenario Combined (2019) Peak Hour Traffic igure 11 Recommended Lane Configurations LIST O TABLES Table 1: Trip Generation Summary...14 Table 2: Highway Capacity Manual Levels-of-Service and elay...22 Table 3: Analysis Summary of US Highway 70 Business and Shotwell Road...23 Table 4: Analysis Summary of US Highway 70 Business and Enterprise rive...25 Table 5: Analysis Summary of Shotwell Road and Cameron Way / Stallings Mill Site rive..26 Table 6: Analysis Summary of Shotwell Road and Old US Highway Table 7: Analysis Summary of Shotwell Road and Executive rive...30 ii
5 TECHNICAL APPENIX Appendix A: Traffic Counts Appendix B: Signal Plans Appendix C: Adjacent evelopment Information Appendix : uture Roadway Improvements Appendix E: Capacity Calculations US Highway 70 Business and Shotwell Road Appendix : Capacity Calculations US Highway 70 Business and Enterprise rive Appendix G: Capacity Calculations Shotwell Road and Cameron Way Appendix H: Capacity Calculations Shotwell Road and Old US Highway 70 Appendix I: Capacity Calculations Shotwell Road and Executive rive iii
6 TRAIC IMPACT ANALYSIS SHOTWELL ROA RESIENTIAL CLAYTON, NORTH CAROLINA 1. INTROUCTION The contents of this report present the findings of the Traffic Impact Analysis (TIA) conducted for the proposed residential development located northeast of the intersection of US Highway 70 Business and Shotwell Road in Clayton, North Carolina. The purpose of this study is to determine the potential impacts to the surrounding transportation system created by traffic generated by the proposed development, as well as recommend improvements to mitigate the impacts. The proposed development, anticipated to be completed in 2019, is assumed to consist of 152 townhomes. The study analyzes traffic conditions during the weekday AM and PM peak hours for the following scenarios: Existing (2017) Traffic Background (2019) Traffic Combined (2019) Traffic Alternate Scenario Combined (2019) Traffic with cross connection to Atkinson Street 1.1. Site Location and Study Area The development is proposed to be located east of Shotwell Road and north of US Highway 70 Business in Clayton, North Carolina. Refer to igure 1 for the site location map. The study area for the TIA was determined through coordination with the North Carolina epartment of Transportation (NCOT) and the Town of Clayton (Town) and consists of the following existing intersections:
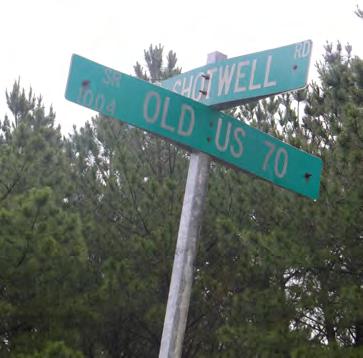
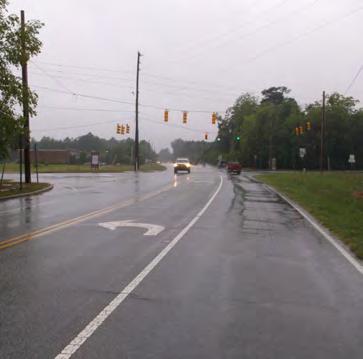
7 US Highway 70 Business and Shotwell Road US Highway 70 Business and Enterprise rive Shotwell Road and Cameron Way Shotwell Road and Old US Highway 70 Shotwell Road and Executive rive 1.2. Proposed Land Use and Site Access The proposed development, anticipated to be completed in 2019, is assumed to consist of 152 townhomes. Site access is proposed via a connection to the existing Enterprise rive and a connection to the existing Cameron Way. As part of the development of this property, a multi-party land swap will be executed to extend Enterprise rive north to directly connect with Cameron Way. The current connection alignment will be removed. The site plan allows for a future connection to the north of the site, if the northern parcel of land develops. An alternate scenario, dependent on the approval of the right-of-way, would allow for an additional connection to the east of the site via the extension of Atkinson Street. Refer to igure 2 for a copy of the preliminary site plan Adjacent Land Uses The proposed development is located in an area consisting primarily of residential development with some retail and industrial development Existing Roadways US Highway 70 Business is a six-lane roadway running in an east-west direction with a posted speed limit of 45 miles per hour (mph) within the study area. Based on the most recent data (2015) from the NCOT, US Highway 70 Business had an average annual daily traffic (AAT) volume of approximately 39,000 vehicles per day (vpd) west of its intersection with Shotwell Road. 2
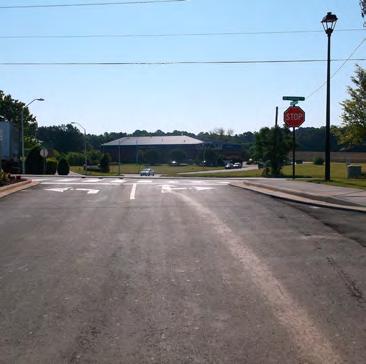
8 Shotwell Road is a two-lane roadway running in a north-south direction with a posted speed limit of 45 mph north of its intersection with US Highway 70 Business and a posted speed limit of 35 mph south of its intersection with US Highway 70 Business. Based on the most recent data (2014) from the NCOT, Shotwell Road had an average AAT volume of approximately 11,000 vpd north of its intersection with US Highway 70 Business. Enterprise rive is a two-lane roadway running in a north-south direction with no posted speed limit within the study area. or the purpose of this study a speed limit of 25 mph was assumed. Based on the traffic counts from 2017, and assuming that the PM peak hour volume is roughly 10% of the average daily traffic, Enterprise rive has an AAT volume of approximately 2,900 vpd north of its intersection with US Highway 70 Business. Cameron Way is a two-lane roadway running in an east-west direction with no posted speed limit within the study area. or the purpose of this study, a speed limit of 25 mph was assumed. Based on the traffic counts from 2017, and assuming that the PM peak hour volume is roughly 10% of the average daily traffic, Cameron Way has an AAT volume of approximately 1,400 vpd east of its intersection with Shotwell Road. Old US Highway 70 is a two-lane roadway running in an east-west direction with a posted speed limit of 45 mph within the study area. Based on the most recent data (2015) from the NCOT, Old US Highway 70 had an AAT volume of approximately 5,300 vpd east of its intersection with Shotwell Road. Executive rive is a two-lane roadway running in an east-west direction with no posted speed limit within the study area. or the purpose of this study, a speed limit of 25 mph was assumed. Based on the traffic counts from 2017, and assuming that the PM peak hour volume is roughly 10% of the average daily traffic, Executive rive has an AAT volume of approximately 740 vpd east of its intersection with Shotwell Road. Existing lane configurations (number of traffic lanes on each intersection approach), lane widths, storage capacities, and other intersection and roadway information were collected through field reconnaissance by Ramey Kemp & Associates, Inc. (RKA). Refer to igure 3 for an illustration of the existing lane configurations within the study area. 3


9 Old US Highway 70 US Highway 70 Business Shotwell Road PROPOSE SITE N LEGEN Proposed Site Location Study Intersection Study Area Shotwell Road Residential Clayton, NC Site Location Map Scale: Not to Scale igure 1 4


10
11
12 2. EXISTING (2017) PEAK HOUR CONITIONS 2.1. Existing (2017) Peak Hour Traffic Existing peak hour traffic volumes were determined based on traffic counts conducted at the study intersections listed below, in May of 2017 by RKA during the typical weekday AM (7:00 AM 9:00 AM) and PM (4:00 PM 6:00 PM) peak periods: US Highway 70 Business and Shotwell Road US Highway 70 Business and Enterprise rive Shotwell Road and Cameron Way Shotwell Road and Old US Highway 70 Shotwell Road and Executive rive Traffic volumes were balanced between study intersections, where appropriate. Refer to igure 4 for existing (2017) weekday AM and PM peak hour traffic volumes. A copy of the count data is located in Appendix A of this report Analysis of Existing (2017) Peak Hour Traffic The existing (2017) weekday AM and PM peak hour traffic volumes were analyzed to determine the current levels of service at the study intersections under existing roadway conditions. Signal information was obtained from NCOT and is included in Appendix B. The results of the analysis are presented in Section 7 of this report. 7
13
14 3. BACKGROUN (2019) PEAK HOUR CONITIONS In order to account for growth of traffic and subsequent traffic conditions at a future year, background traffic projections are needed. Background traffic is the component of traffic due to the growth of the community and surrounding area that is anticipated to occur regardless of whether or not the proposed development is constructed. Background traffic is comprised of existing traffic growth within the study area and additional traffic created as a result of adjacent approved developments Ambient Traffic Growth Through coordination with the Town and NCOT, it was determined that an annual growth rate of 3% would be used to generate projected (2019) weekday AM and PM peak hour traffic volumes. Refer to igure 5 for projected (2019) peak hour traffic Adjacent evelopment Traffic Through coordination with the Town and NCOT, Stallings Mill Apartments, Creech Subdivision, and a Mexican restaurant were identified to be included as adjacent developments in this study. Stallings Mill Apartments is located west of Shotwell Road, with a site drive proposed as the eastbound approach at the intersection of Shotwell Road and Cameron Way and is expected to be fully-built out by 2019 and consist of approximately 288 apartment units. It should be noted that part of the development was constructed and operational at the time of data collection; however, it was decided to include the total trips in order to maintain conservative results of this study. Creech Subdivision is located southeast of the intersection of Shotwell Road and Covered Bridge Road in Clayton, North Carolina. A revised TIA was completed by Morton and Morton esign Services in July According to this TIA, the Creech Subdivision will consist of 180 single-family homes with a build-out year of Site Traffic from this development was distributed through the study area according to the approved trip generation and trip distribution from the Creech Subdivision TIA. 9
15 The Mexican restaurant is to be located in the southeast quadrant of Shotwell Road and Cameron Way. A TIA was not completed for this development; therefore, RKA calculated the approximate traffic impact of the restaurant through coordination with the Town. Refer to Appendix C for the calculations. Adjacent development trips are shown in igure 6. Adjacent development information can be found in Appendix C uture Roadway Improvements Based on coordination with the NCOT and the Town, the median safety project along US Highway 70 Business and the addition of a northbound left-turn lane at the intersection of Shotwell Road and US Highway 70 Business by the Pine Hollow development will be included as future roadway improvements. The median safety project is expected to increase the westbound left-turn storage length at the intersection of US Highway 70 Business and Shotwell Road. A preliminary concept for these improvements was provided by NCOT and can be found in Appendix Background (2019) Peak Hour Traffic Volumes The background (2019) traffic volumes were determined by projecting the existing (2017) peak hour traffic to the year 2019, and adding the adjacent development trips. Refer to igure 7 for an illustration of the background (2019) peak hour traffic volumes at the study intersections Analysis of Background (2019) Peak Hour Traffic The background (2019) AM and PM peak hour traffic volumes at the study intersections were analyzed with future geometric roadway conditions and traffic control. The analysis results are presented in Section 7 of this report. 10
16
17
18
19 4. SITE TRIP GENERATION AN ISTRIBUTION 4.1. Trip Generation The proposed development is assumed to consist of 152 townhomes. Average weekday daily, AM peak hour, and PM peak hour trips for the proposed development were estimated using methodology contained within the ITE Trip Generation Manual, 9th Edition. Table 1 provides a summary of the trip generation potential for the site. Land Use (ITE Code) Residential Condo / Townhouse (230) Table 1: Trip Generation Summary Intensity 152 dwelling units aily Traffic (vpd) AM Peak Hour Trips (vph) PM Peak Hour Trips (vph) Enter Exit Enter Exit It is estimated that the proposed development will generate approximately 890 total site trips on the roadway network during a typical 24-hour weekday period. Of the daily traffic volume, it is anticipated that 67 trips (11 entering and 56 exiting) will occur during the AM peak hour and 79 (53 entering and 26 exiting) will occur during the PM peak hour Site Trip istribution and Assignment Trip distribution percentages used in assigning site traffic for this development were estimated based on a combination of existing traffic patterns, population centers adjacent to the study area, and engineering judgment. It is estimated that trips will be distributed as follows: 45% to/from the west via US Highway 70 Business 25% to/from the east via US Highway 70 Business 15% to/from the west via Old US Highway 70 5% to/from the east via Old US Highway 70 5% to/from the north via Shotwell Road 5% to/from the south via Shotwell Road The site trip distribution is shown in igure 8a. Refer to igure 9a for the site trip assignment. The alternate scenario site trip distribution is shown in igure 8b. Refer to igure 9b for the alternate scenario site trip assignment. 14
20
21
22
23
24 5. COMBINE (2019) TRAIC CONITIONS 5.1. Combined (2019) Peak Hour Traffic Volumes To estimate traffic conditions with the site fully built-out, the total site trips were added to the background (2019) traffic volumes to determine the combined (2019) traffic volumes. Refer to igure 10a for an illustration of the combined (2019) peak hour traffic volumes with the proposed site fully developed and igure 10b for an illustration of the alternate scenario combined (2019) peak hour traffic volumes with the proposed site fully developed Analysis of Combined (2019) Peak Hour Traffic Study intersections were analyzed with the combined (2019) traffic volumes using the same methodology previously discussed for existing and background traffic conditions. Intersections were analyzed with improvements necessary to accommodate future traffic volumes. The results of the capacity analysis for each intersection are presented in Section 7 of this report. 19
25
26
27 6. TRAIC ANALYSIS PROCEURE Study intersections were analyzed using the methodology outlined in the 2010 Highway Capacity Manual (HCM) published by the Transportation Research Board. Capacity and level of service are the design criteria for this traffic study. A computer software package, Synchro (Version 9.1), was used to complete the analyses for most of the study area intersections. Please note that the unsignalized capacity analysis does not provide an overall level of service for an intersection; only delay for an approach with a conflicting movement. The HCM defines capacity as the maximum hourly rate at which persons or vehicles can reasonably be expected to traverse a point or uniform section of a lane or roadway during a given time period under prevailing roadway, traffic, and control conditions. Level of service (LOS) is a term used to represent different driving conditions, and is defined as a qualitative measure describing operational conditions within a traffic stream, and their perception by motorists and/or passengers. Level of service varies from Level A representing free flow, to Level where breakdown conditions are evident. Refer to Table 2 for HCM levels of service and related average control delay per vehicle for both signalized and unsignalized intersections. Control delay as defined by the HCM includes initial deceleration delay, queue move-up time, stopped delay, and final acceleration delay. An average control delay of 50 seconds at a signalized intersection results in LOS operation at the intersection. Table 2: Highway Capacity Manual Levels-of-Service and elay UNSIGNALIZE INTERSECTION AVERAGE CONTROL LEVEL O ELAY PER VEHICLE SERVICE (SECONS) A B C E >50 LEVEL O SERVICE A B C E SIGNALIZE INTERSECTION AVERAGE CONTROL ELAY PER VEHICLE (SECONS) > Adjustments to Analysis Guidelines Capacity analysis at all study intersections was completed according to the Town s LO and NCOT Congestion Management Guidelines. 22
28 7. CAPACITY ANALYSIS 7.1. US Highway 70 Business and Shotwell Road The existing signalized intersection of US Highway 70 Business and Shotwell Road was analyzed under existing (2017), background (2019), combined (2019), and alternate scenario combined (2019) traffic conditions with the lane configurations and traffic control shown in Table 3. Refer to Table 3 for a summary of the analysis results. Refer to Appendix E for the Synchro capacity analysis reports. ANALYSIS SCENARIO Existing (2017) Background (2019) Combined (2019) Alternate Scenario Combined (2019) Table 3: Analysis Summary of US Highway 70 Business and Shotwell Road A P P R O A C H EB NB EB NB EB NB EB NB LANE CONIGURATIONS 1 LT, 2 TH, 1 RT 1 LT, 3 TH, 1 RT 1 LT, 2 TH, 1 RT 1 LT, 3 TH, 1 RT 2 LT, 1 TH-RT 1 LT, 2 TH, 1 RT 1 LT, 3 TH, 1 RT 2 LT, 1 TH-RT 1 LT, 2 TH, 1 RT 1 LT, 3 TH, 1 RT 2 LT, 1 TH-RT WEEKAY AM PEAK HOUR LEVEL O SERVICE Approach C C C C Overall (seconds) (46) E (62) E (67) E (63) Improvements to lane configurations by the Pine Hollow development are shown in bold. WEEKAY PM PEAK HOUR LEVEL O SERVICE Approach E Overall (seconds) E (76) (120) (126) (124) Capacity analysis of existing (2017) traffic conditions indicates the intersection of US Highway 70 Business and Shotwell Road is expected to operate at an overall LOS during the weekday AM peak hour and LOS E during the weekday PM peak hour. Under background (2019), combined (2019), and alternate scenario combined (2019) traffic conditions, the intersection is expected to operate at an overall LOS E during the weekday AM peak hour and overall LOS during the weekday PM peak hour. 23
29 It should be noted that the overall delay at the intersection is expected to increase by only five (5) seconds between background and combined traffic conditions during the weekday AM peak hour and six (6) seconds of delay during the weekday PM peak hour. Under the alternate scenario, the overall delay is expected to increase by one (1) second between background and combined traffic conditions during the weekday AM and PM peak hours. The traffic generated by the proposed development is anticipated to account for 1% of the overall traffic at this intersection. Although not recommended as part of this development, the overall delay at the intersection may be reduced by increasing the split time for the southbound approach. 24
30 7.2. US Highway 70 Business and Enterprise rive The existing unsignalized intersection of US Highway 70 Business and Enterprise rive was analyzed under existing (2017), background (2019), combined (2019), and alternate scenario combined (2019) traffic conditions with the lane configurations and traffic control shown in Table 4. Refer to Table 4 for a summary of the analysis results. Refer to Appendix for the Synchro capacity analysis reports. Table 4: Analysis Summary of US Highway 70 Business and Enterprise rive ANALYSIS SCENARIO Existing (2017) Background (2019) Combined (2019) Alternate Scenario Combined (2019) A P P R O A C H EB EB EB EB LANE CONIGURATIONS 3 TH 3 TH, 1 RT 1 RT 3 TH 3 TH, 1 RT 1 RT 3 TH 3 TH, 1 RT 1 RT 3 TH 3 TH, 1 RT 1 RT 1. Level of service for minor-street approach. WEEKAY AM PEAK HOUR LEVEL O SERVICE Approach Overall (seconds) WEEKAY PM PEAK HOUR LEVEL O SERVICE Approach C 1 C 1 C 1 C 1 Overall (seconds) Capacity analysis of existing (2017), background (2019), combined (2019), and alternate scenario combined (2019) traffic conditions indicates the southbound minor-street approach is expected to operate at LOS during the weekday AM peak hour and LOS C during the weekday PM peak hour with delays typical for a minor approach of a heavily traveled mainline. rom background (2019) to combined (2019) conditions, during the weekday AM peak hour, the delay for the southbound approach increases by approximately 20 seconds and the queue increases by one vehicle. 25
31 7.3. Shotwell Road and Cameron Way / Stallings Mill Site rive The existing unsignalized intersection of Shotwell Road and Cameron Way / Stallings Mill Site rive was analyzed under existing (2017), background (2019), combined (2019), and alternate scenario combined (2019) traffic conditions with the lane configurations and traffic control shown in Table 5. Refer to Table 5 for a summary of the analysis results. Refer to Appendix G for the Synchro capacity analysis reports. Table 5: Analysis Summary of Shotwell Road and Cameron Way / Stallings Mill Site rive ANALYSIS SCENARIO Existing (2017) Background (2019) Combined (2019) Alternate Scenario Combined (2019) Combined (2019) with Improvements A P P R O A C H EB NB EB NB EB NB EB NB EB NB LANE CONIGURATIONS 1 LT-TH-RT 1 LT-TH-RT 1 LT-TH-RT 1 LT-TH-RT 1. Level of service for major-street left-turn movement. 2. Level of service for minor-street approach. Striping improvements by developer denoted in bold. WEEKAY AM PEAK HOUR LEVEL O SERVICE Approach C 2 C 2 C 2 2 C 2 2 C 2 2 C 2 2 Overall (seconds) WEEKAY PM PEAK HOUR LEVEL O SERVICE Approach C 2 2 E 2 2 E 2 2 E 2 2 Overall (seconds) Capacity analysis of existing (2017) traffic conditions indicates that all minor-street approaches and major-street left-turn movements are expected to operate at LOS C or better during the weekday AM peak hour and LOS or better during the weekday PM peak hour. Under background (2019), combined (2019), alternate scenario combined (2019), and E
32 combined (2019) with improvements traffic conditions, the eastbound minor-street approach is expected to operate at LOS C and the westbound minor-street approach is expected to operate at LOS during the weekday AM peak hour. The eastbound minor-street approach is expected to operate at LOS E and the westbound minor-street approach is expected to operate at LOS during the weekday PM peak hour under background (2019), combined (2019), alternate scenario combined (2019), and combined (2019) with improvements traffic conditions. The delay and queuing observed on the westbound approach is due to it being an unsignalized approach at a mainline (Shotwell Road) with heavy through volumes. Striping the Cameron Way approach as one ingress lane and two egress lanes an exclusive left-turn lane and a shared through/right-turn lane may reduce delay and relieve queuing as right-turning vehicles would not be impeded by vehicles waiting to turn left. While the traffic at this intersection meets the peak hour warrant during the weekday PM peak hour from the 2009 Manual on Uniform Traffic Control evices (MUTC), it is unlikely traffic volumes will satisfy the MUTC 8-hour and 4-hour signal warrants, which NCOT favors for the installation of a traffic signal. 27
33 7.4. Shotwell Road and Old US Highway 70 The existing signalized intersection of Shotwell Road and Old US Highway 70 was analyzed under existing (2017), background (2019), combined (2019), and alternate scenario combined (2019) traffic conditions with the lane configurations and traffic control shown in Table 6. Refer to Table 6 for a summary of the analysis results. Refer to Appendix H for the Synchro capacity analysis reports. Table 6: Analysis Summary of Shotwell Road and Old US Highway 70 ANALYSIS SCENARIO Existing (2017) Background (2019) Combined (2019) Alternate Scenario Combined (2019) A P P R O A C H EB NB EB NB EB NB EB NB LANE CONIGURATIONS 1 LT, 1 TH, 1 RT 1 LT, 1 TH, 1 RT 1 LT, 1 TH, 1 RT 1 LT, 1 TH, 1 RT WEEKAY AM PEAK HOUR LEVEL O SERVICE Approach C C C C Overall (seconds) E (57) (88) (88) (88) WEEKAY PM PEAK HOUR LEVEL O SERVICE Approach C E Overall (seconds) (41) E (56) E (57) E (57) Capacity analysis of existing (2017) traffic conditions indicates the intersection of Old US Highway 70 and Shotwell Road operates at an overall LOS E during the weekday AM peak hour and LOS during the weekday PM peak hour. Under background (2019), combined (2019), and alternate scenario combined (2019) traffic conditions, the intersection is expected to operate at an overall LOS during the weekday AM peak hour and overall LOS E during the weekday PM peak hour. 28
34 The intersection is not expected to experience an increase in overall delay between background (2019) and combined (2019) traffic conditions during the weekday AM peak hour and is expected to only experience an increase of one (1) second of delay during the weekday PM peak hour. It should be noted that the signal plans provided by NCOT for the analysis indicate that mainline phases 2 and 6 are along Old US Highway 70. However, due to development in the overall area, the northbound and southbound approaches of Shotwell Road carry more peak-hour volume than Old US Highway 70. A field review of signal operations may be beneficial to ensure the northbound and southbound approach phases are receiving adequate time. 29
35 7.5. Shotwell Road and Executive rive The existing unsignalized intersection of Shotwell Road and Executive rive was analyzed under existing (2017), background (2019), combined (2019), and alternate scenario combined (2019) traffic conditions with the lane configurations and traffic control shown in Table 7. Refer to Table 7 for a summary of the analysis results. Refer to Appendix I for the Synchro capacity analysis reports. Table 7: Analysis Summary of Shotwell Road and Executive rive ANALYSIS SCENARIO Existing (2017) Background (2019) Combined (2019) Alternate Scenario Combined (2019) A P P R O A C H NB NB NB NB LANE CONIGURATIONS 1 RT 1 TH-RT 2 TH 1 RT 1 TH-RT 2 TH 1 RT 1 TH-RT 2 TH 1 RT 1 TH-RT 2 TH 1. Level of service for minor-street approach. WEEKAY AM PEAK HOUR LEVEL O SERVICE Approach B 1 Overall (seconds) B 1 B 1 B 1 WEEKAY PM PEAK HOUR LEVEL O SERVICE Approach B 1 Overall (seconds) C 1 C 1 C 1 Capacity analysis results indicate the westbound minor-street approach is expected to operate at acceptable levels-of-service for all analysis scenarios. 30
36 8. CONCLUSIONS This Traffic Impact Analysis was conducted to determine the potential traffic impacts of the proposed Shotwell Road Residential development, located north of US Highway 70 Business and east of Shotwell Road in Clayton, North Carolina. The proposed development is expected to consist of 152 townhomes and be built out in Site access is proposed via a connection to the existing Enterprise rive and a connection to the existing Cameron Way. As part of the development of this property, a multi-party land swap will be executed to extend Enterprise rive north to directly connect with Cameron Way. The current connection alignment will be removed. The site plan allows for a future connection to the north of the site, if the northern parcel of land develops. An alternate scenario, dependent on the approval of the right of way, would allow for an additional connection to the east of the site via Atkinson Street. The study analyzes traffic conditions during the weekday AM and PM peak hours for the following scenarios: Existing (2017) Traffic Background (2019) Traffic Combined (2019) Traffic Alternate Scenario Combined (2019) Traffic Trip Generation It is estimated that the proposed development will generate approximately 890 total site trips on the roadway network during a typical 24-hour weekday period. Of the daily traffic volume, it is anticipated that 67 trips (11 entering and 56 exiting) will occur during the AM peak hour and 79 (53 entering and 26 exiting) will occur during the PM peak hour. Adjustments to Analysis Guidelines Capacity analysis at all study intersections was completed according to the Town s UO and NCOT Congestion Management Guidelines. 31
37 Capacity Analysis Summary Currently, the signalized intersections in the study area are operating at overall levels-ofservice and E during the AM and PM peak hours. ield review of the traffic along Shotwell Road revealed southbound queueing on Shotwell Road from US Highway 70 Business to north of Cameron Way under existing conditions. ue to this mainline queueing, vehicles on the minor approaches at the unsignalized intersections studied have fewer gaps in which to enter the flow of traffic. Under background (2019) traffic conditions, which include approved future developments in the area, the signalized intersections are anticipated to operate at overall levels-of-service E and during the AM and PM peak hours. The minor approaches to unsignalized intersections are expected to operate at degraded levels-of-service, but this is typical for congested areas. Once built-out, traffic from the proposed site is anticipated to account for approximately 1% or less of the overall traffic at the US Highway 70 Business and Old US Highway 70 intersections with Shotwell Road. Marginal impacts to delays and queue lengths are expected as a result of the development traffic. An alternate access scenario was also analyzed. This scenario accounts to the extension of Atkinson Street from S. Moore Street to the stub-out the development is constructing. This connection will allow traffic within the development and the immediately surrounding area to circumvent the signal at US Highway 70 Business and Shotwell Road to gain access to either eastbound or westbound US Highway 70 Business. This diversion will decrease the amount of development traffic on Shotwell Road and could help reduce delays and queueing. The construction of the Atkinson Street extension will greatly improve overall connectivity in this area. 32
38 9. RECOMMENATIONS Based on the findings of this study, specific geometric improvements have been identified and are recommended to accommodate future traffic conditions. See a more detailed description of the recommended improvements below. Refer to igure 11 for an illustration of the recommended lane configurations. Background Improvements by the NCOT Median Safety Project US Highway 70 Business and Shotwell Road Extend westbound left-turn lane to approximately 350 feet of storage with appropriate taper. Background Improvements by the Pine Hollow evelopment US Highway 70 Business and Shotwell Road Construct an additional northbound left-turn lane with at least 200 feet of storage and appropriate taper. evelop a signal modification plan to accommodate the new lane geometrics. Recommended Improvements by eveloper Shotwell Road and Cameron Way/Stallings Mill Site rive Stripe the westbound approach to accommodate one ingress lane and two egress lanes - a shared through/right turn-lane and an exclusive left-turn lane - with at least 75 feet of storage and appropriate taper. 33
39
CITY OF KIRKLAND TRAFFIC IMPACT ANALYSIS GUIDELINES
 CITY OF KIRKLAND TRAFFIC IMPACT ANALYSIS GUIDELINES SEPA TRANSPORTATION CONCURRENCY - ROAD IMPACT FEES Introduction Revised February 2004 These guidelines describe how to prepare a traffic study, or Traffic
Calipatria Solar Farm TIA
 Calipatria Solar Farm TIA Prepared for: 7SM 8ME, LLC 71SM 8ME, LLC c/o 8minutenergy Renewables LLC Prepared by: Fehr & Peers March 25, 211 IE1-37 TABLE OF CONTENTS Executive Summary... i Project Trip Estimates...
Traffic Impact Study for the TAVA Homes Project at 1584 East Santa Clara Avenue in the City of Santa Ana
 Traffic Impact Study for the TAVA Homes Project at 1584 East Santa Clara Avenue in the City of Santa Ana March 2011 Prepared for: URS Corporation 2020 E. First Street, Suite #400 Santa Ana, CA 92705 Tel:
HILLTOP SENIOR LIVING CENTER Pollard Station Traffic Impact Analysis
 HILLTOP SENIOR LIVING CENTER Pollard Station Traffic Impact Analysis Prepared for Town of Truckee Prepared by TRANSPORTATION CONSULTANTS, INC. Pollard Station TRAFFIC IMPACT ANALYSIS Prepared for the Town
APPENDIX D. Traffic Impact Analysis
 APPENDIX D Traffic Impact Analysis TRAFFIC IMPACT ANALYSIS CALEXICO SOLAR FARM I County of Imperial, California July 8, 2011 LLG Ref. 3-11-2034 Prepared by: Cara Leone Transportation Planner II Under the
Traffic Impact Study for the Girard Winery Project
 October 16, 2014 Ms. Heather McCollister 1512 D Street Napa, CA 94559 Traffic Impact Study for the Girard Winery Project Dear Ms. McCollister; Whitlock & Weinberger Transportation, Inc. (W-Trans) has completed
ENHANCED PARKWAY STUDY: PHASE 3 REFINED MLT INTERSECTION ANALYSIS
 ENHANCED PARKWAY STUDY: PHASE 3 REFINED MLT INTERSECTION ANALYSIS Final Report Prepared for Maricopa County Department of Transportation Prepared by TABLE OF CONTENTS Page EXECUTIVE SUMMARY ES-1 STUDY
195 Hegenberger Road Hotel: Traffic Circulation Analysis in Response to Comments on the Final EIR
 350 Frank H. Ogawa Plaza Suite 300 Oakland, CA 94612 510.839.5066 phone 510.839.5825 fax www.esassoc.com Technical Memorandum date November 12, 2014 to from subject Colleen Liang, Port Associate Environmental
Traffic Impact Analysis
 LA PALMA VILLAGE INITIAL STUDY CITY OF ANAHEIM Appendices Appendix I Traffic Impact Analysis September 2015 LA PALMA VILLAGE INITIAL STUDY CITY OF ANAHEIM Appendices This page intentionally left blank.
SIMULATION AND ANALYSIS OF ARTERIAL TRAFFIC OPERATIONS ALONG THE US 61 CORRIDOR IN BURLINGTON, IOWA FINAL REPORT
 SIMULATION AND ANALYSIS OF ARTERIAL TRAFFIC OPERATIONS ALONG THE US 61 CORRIDOR IN BURLINGTON, IOWA FINAL REPORT Principal Investigator Tom Maze Principal Contributor Ali Kamyab Sponsored by the Engineering
APPENDIX E TRANSPORTATION
 APPENDIX E TRANSPORTATION 2011 PATRON SURVEYS VISSIM MODEL CALIBRATION AND VALIDATION Environmental and Planning Consultants 440 Park Avenue South 7th Floor New York, NY 10016 tel: 212 696-0670 fax:
Prepared for: Rocklin. Prepared by:
 APPENDIX L Sierra Gateway Apartments Transportation Impact Analysis Report Prepared for: Rocklin Sierra Apartments II, LLC Prepared by: SIERRA GATEWAY APARTMENTS TRANSPORTATION IMPACT ANALYSIS REPORT PREPARED
Final Report. Interstate-680 Bus-on-Shoulder Feasibility Assessment. prepared for
 Final Report Interstate-680 Bus-on-Shoulder Feasibility Assessment prepared for Metropolitan Transportation Commission & Contra Costa Transportation Authority prepared by HDR in association with Fehr &
Traffic Impact Study for the Grove Street Subdivision
 Whitlock & Weinberger Transportation, Inc. 490 Mendocino Avenue Suite 201 Santa Rosa, CA 95401 voice (707) 542-9500 fax (707) 542-9590 475 14 th Street Suite 290 Oakland, CA 94612 voice (510) 444-2600
TRAFFIC IMPACT ANALYSIS. MIDWAY SOLAR FARM II County of Imperial, California January 11, 2011
 TRAFFIC IMPACT ANALYSIS MIDWAY SOLAR FARM II County of Imperial, California January 11, 2011 LLG Ref. 3-10-2013 Prepared by: Cara Leone Transportation Planner II Under the Supervision of: Chris Mendiara
Addendum: Final Design Noise Analysis Study Noise Sensitive Area (NSA) 11 Post March 15, 2016 Open House Response to Comments
 11 Post March 15, 2016 Open House Response to Comments") Final Design Township of Lower Makefield, Bucks County, Pennsylvania Township of Ewing, Mercer County, New Jersey Addendum: Final Design Noise Analysis Study Noise Sensitive Area (NSA) 11 Post March 15,
Final Design Township of Lower Makefield, Bucks County, Pennsylvania Township of Ewing, Mercer County, New Jersey Addendum: Final Design Noise Analysis Study Noise Sensitive Area (NSA) 11 Post March 15,
Appendix D. Transportation Study
 Appendix D Transportation Study Draft KUNZLER TERRACE MINE PROJECT Transportation Study Prepared for May 29 County of Mendocino Draft KUNZLER TERRACE MINE PROJECT Transportation Study Prepared for May
STUDY REPORT #1 ADDENDUM
 STUDY REPORT #1 ADDENDUM 1.0 PURPOSE OF ADDENDUM This document is an addendum to Study Report #1: Sub-System Planning Alternatives. The purpose of this addendum is to bridge the gap between the initial
ROADWAY LIGHTING CURFEW
 STATE OF RHODE ISLAND AND PROVIDENCE PLANTATIONS Rhode Island Department of Transportation ROADWAY LIGHTING CURFEW IMPLEMENTATION PLAN March 25, 21 TABLE OF CONTENTS INTRUDUCTION/OVERVIEW... 1 1.1. ANTICIPATED
Rutgers Interactive Lane Closure Application (RILCA) for Work Zone Planning User Manual. New Jersey Highway Authority. Garden State Parkway
 for Work Zone Planning User Manual. New Jersey Highway Authority. Garden State Parkway") Rutgers Interactive Lane Closure Application (RILCA) for Work Zone Planning User Manual Prepared for Garden State Parkway New Jersey Highway Authority April 2007 Developed by: Rutgers University Intelligent
Rutgers Interactive Lane Closure Application (RILCA) for Work Zone Planning User Manual Prepared for Garden State Parkway New Jersey Highway Authority April 2007 Developed by: Rutgers University Intelligent
Treating Potential Back- of-queue Safety. Developed By:
 Treating Potential Back- of-queue Safety Hazards Developed By: 1 Module Objectives Discuss the hazards associated with queuing caused by work zones Describe steps to quantify work zone impacts, determine
An Analysis of TDM Impacts on a Corridor Segment Research Findings
 An Analysis of TDM Impacts on a Corridor Segment Research Findings Phil Winters, CUTR TDM Program Director Liren Zhou, Graduate Research Assistant Sachin Rai, ITS Research Associate Nevine Georggi, TDM
VARIATIONS IN CAPACITY AND DELAY ESTIMATES FROM MICROSCOPIC TRAFFIC SIMULATION MODELS
 VARIATIONS IN CAPACITY AND DELAY ESTIMATES FROM MICROSCOPIC TRAFFIC SIMULATION MODELS (Transportation Research Record 1802, pp. 23-31, 2002) Zong Z. Tian Associate Transportation Researcher Texas Transportation
TRAFFIC CONCURRENCY INFORMATION
 PUBLIC WORKS DEPARTMENT 33325 8 th Avenue South Federal Way WA 98003-6325 253-835-2700; Fax 253-835-2709 www.cityoffederalway.com TRAFFIC CONCURRENCY INFORMATION What is a Concurrency Application? The
ESTIMATING PARAMETERS FOR MODIFIED GREENSHIELD S MODEL AT FREEWAY SECTIONS FROM FIELD OBSERVATIONS
 0 ESTIMATING PARAMETERS FOR MODIFIED GREENSHIELD S MODEL AT FREEWAY SECTIONS FROM FIELD OBSERVATIONS Omor Sharif University of South Carolina Department of Civil and Environmental Engineering 00 Main Street
Bluetooth Travel Time Technology Evaluation Using the BlueTOAD TM
 Bluetooth Travel Time Technology Evaluation Using the BlueTOAD TM E01271 PennDOT District 6-0 ITS & Support Open End Contract Work Order #1 Submitted To: Pennsylvania Department of Transportation Engineering
TRACY HILLS SPECIFIC PLAN RECIRCULATED DRAFT SUBSEQUENT ENVIRONMENTAL IMPACT REPORT VOLUME III OCTOBER 2015
 TRACY HILLS SPECIFIC PLAN RECIRCULATED DRAFT SUBSEQUENT ENVIRONMENTAL IMPACT REPORT VOLUME III OCTOBER 2015 APPENDIX H-6B CORRESPONDENCE DOCUMENTS LIVERMORE, DATED FALL 2014 Chau, Elizabeth From: Sent:
Speed Limit and Safety Nexus Studies for Automated Enforcement Locations in the District of Columbia East Capitol Street at Southern Avenue NE
 Speed Limit and Safety Nexus Studies for Automated Enforcement Locations in the District of Columbia East Capitol Street at Southern Avenue NE Study Area and Location District PSA Ward ANC Phase Description
SITE DESCRIPTION. Vicinity
 SITE DESCRIPTION Vicinity The Montrose Shopping Center is located in the northeast quadrant of the intersection of Randolph Road and Rockville Pike (MD 355). The existing building (formally known as the
CASE 1 TWO LANE TO FOUR LANE DIVIDED TRANSITION GEO-610-C NOT TO SCALE GEOMETRIC DESIGN GUIDE FOR MATCH LINE LINE MATCH. 2 (0.6m) shoulder transition
 shoulder transition") CASE 1 2 (0.6m) Joint Line See sheet #5 for description of variables 4 (1.2m) Transition taper is tangent to Edge of Pavement curve at this point. 1:25 Paved shoulder transition 16 (4.m) Median width 16
CASE 1 2 (0.6m) Joint Line See sheet #5 for description of variables 4 (1.2m) Transition taper is tangent to Edge of Pavement curve at this point. 1:25 Paved shoulder transition 16 (4.m) Median width 16
Rural Expressway Intersection Characteristics that Contribute to Reduced Safety Performance
 Rural Expressway Intersection Characteristics that Contribute to Reduced Safety Performance Garrett D. Burchett Center for Transportation Research and Education Iowa State University 2901 South Loop Drive,
Northwest Needs Improvements Survey
 PW5 NW 107th Ave One thousand feet N of NW 122nd St Okeechobee Rd Widen bridge over Miami Canal PW6 NW 82nd Ave NW 8th St NW 12th St Construct new 4-lane road PW7 NW 87 Ave NW 36th St NW 58th St Add 2-lanes
Site 17 W3-160 KEY: District Department of Transportation 55 M Street, SE, Suite 400 Washington, DC 20003
 Speed Limit and Safety Nexus Studies for Automated Enforcement Locations in the District of Columbia Connecticut Avenue at Calvert Street NW Study Area and Location District PSA Ward ANC Phase Description
Appendix A Air Quality Construction Emissions Calculations
 Appendix A Air Quality Construction Emissions Calculations ES012007014SCO/POLBEDISONAVENEGDEC_BS2501.DOC/070290001 Appendix A POLB - Edison Avenue Construction Emissions Table 1. Construction Emissions
National Roundabout Conference 2005 DRAFT High-Capacity Roundabout Intersection Analysis: Going Around in Circles David Stanek, PE & Ronald T. Milam,
 High-Capacity Roundabout Intersection Analysis: Going Around in Circles David Stanek, PE & Ronald T. Milam, AICP TRB National Roundabout Conference May 24, 2005 Vail, CO Presentation Overview What is a
PROPOSED EXPANSION OF THE BOOYSENDAL SOUTH EVEREST MINE
 BOOYSENDAL PLATINUM (PTY) LTD TRAFFIC IMPACT STUDY (FEB 2017) REV 2 PROPOSED EXPANSION OF THE BOOYSENDAL SOUTH EVEREST MINE PREPARED BY: HAMATINO CONSULTING ENGINEERS 13 HOOGGELEGEN ROAD WHITE RIVER 1240
Travel Demand Modeling and Project Coding Procedures
 Travel Demand Modeling and Project Coding Procedures Revised July 2008 As described in the Final Transportation Conformity Rule (section 93.122), travel demand models used to generate emission estimates
Synchro Studio 9. with Warrants and TripGen 2014 Getting Started and What s New in Version 9
 Synchro Studio 9 with Warrants and TripGen 2014 Getting Started and What s New in Version 9 Table of Contents CHAPTER 1 INTRODUCTION...1-1 LICENSE OPTIONS... 1-1 DEMO VERSIONS... 1-1 Synchro... 1-1 SimTraffic...
Managing DC Work Zones via a Citywide Transportation Management Plan. ITE Mid-Colonial District Annual Meeting May 20, 2014
 Managing DC Work Zones via a Citywide Transportation Management Plan ITE Mid-Colonial District Annual Meeting May 20, 2014 Presentation Outline The Team The Challenge The Approach Project Diagram Work
Study Area and Location District PSA Ward ANC Phase Description G Planned Connecticut Avenue Northbound at Military Road Northwest
 Speed Limit and Safety Nexus Studies for Automated Enforcement Locations in the District of Columbia Connecticut Avenue at Military Road NW Study Area and Location District PSA Ward ANC Phase Description
Study Area and Location District PSA Ward ANC Phase Description A Proposed I-395 Southwest after Exit 4, Eastbound
 Speed Limit and Safety Nexus Studies for Automated Enforcement Locations in the District of Columbia I-395 SW after Exit 4 E/B Study Area and Location District PSA Ward ANC Phase Description 1 71 8 8A
A parabolic curve that is applied to make a smooth and safe transition between two grades on a roadway or a highway.
 A parabolic curve that is applied to make a smooth and safe transition between two grades on a roadway or a highway. VPC: Vertical Point of Curvature VPI: Vertical Point of Intersection VPT: Vertical Point
Using Empirical (real-world) Transportation Data to Extend Travel Demand Model Capabilities
 Transportation Data to Extend Travel Demand Model Capabilities") Portland State University PDXScholar TREC Friday Seminar Series Transportation Research and Education Center (TREC) 10-4-2013 Using Empirical (real-world) Transportation Data to Extend Travel Demand Model
Portland State University PDXScholar TREC Friday Seminar Series Transportation Research and Education Center (TREC) 10-4-2013 Using Empirical (real-world) Transportation Data to Extend Travel Demand Model
Council of State Governments. Takoma Langley Transit Center Purple Line Project Briefing. October 28, 2013
 Council of State Governments Takoma Langley Transit Center Purple Line Project Briefing October 28, 2013 Takoma Langley Transit Center Purpose and Need Provide a safe, attractive and efficient facility
Utilization of TSMO Practices in Highway Construction Work Zones: A Case Study
 Utilization of TSMO Practices in Highway Construction Work Zones: A Case Study James Webb, P.E., Iowa Department of Transportation Liz Finarty, P.E., Iowa Department of Transportation James Armstrong,
Bellevue s Traffic Adaptive Signals
 What we ll cover Bellevue s Traffic Adaptive Signals SCATS Phase 1 Implementation SCATS Operations Responsiveness New Features Some Initial Results 2011 Program and Beyond Final Thoughts ITE Quad Mtg April
research report Evaluation of Driver Reactions for Effective Use of Dynamic Message Signs in Richmond, Virginia
 Final Report VTRC 10-R16 Virginia Transportation Research Council research report Evaluation of Driver Reactions for Effective Use of Dynamic Message Signs in Richmond, Virginia http:/www.virginiadot.org/vtrc/main/online_reports/pdf/10-r16.pdf
Speed Limit and Safety Nexus Studies for Automated Enforcement Locations in the District of Columbia DC Miles South of Pennsylvania Avenue SE
 Speed Limit and Safety Nexus Studies for Automated Enforcement Locations in the District of Columbia DC 295.4 Miles South of Pennsylvania Avenue SE Study Area and Location District PSA Ward ANC Phase Description
M50 Demand Management Study
 Study Briefing paper to the Strategic Policy Committees (Transport) of : Dun Laoghaire Rathdown County Council, Dublin City Council Fingal County Council South Dublin Co Council 5 th June 2013 December
Synchro Studio 10. with Warrants Release Notes
 Synchro Studio 10 with Warrants Release Notes Table of Contents INTRODUCTION...1 RELEASE 10.3.28: OCTOBER 25, 2018... 1 RELEASE 10.3.15: SEPTEMBER 10, 2018... 1 RELEASE 10.2.0: MAY 21.2018... 1 Release
S-03-SegB: South Federal Way to Fife LRT
 Project Number S-03-SegB Subarea South King/Pierce Primary Mode Light Rail Facility Type Corridor Length 4.0 miles Version ST Board Workshop Date Last Modified 11-25-2015 PROJECT AREA AND REPRESENTATIVE
Study Area and Location District PSA Ward ANC Phase Description A Proposed 6100 Block Georgia Avenue Northwest Southbound
 Speed Limit and Safety Nexus Studies for Automated Enforcement Locations in the District of Columbia 6100 Block Georgia Avenue NW Study Area and Location District PSA Ward ANC Phase Description 4 402 4
An Analysis of TDM Impacts on a Corridor Segment
 An Analysis of TDM Impacts on a Corridor Segment Phil Winters, CUTR TDM Program Director Liren Zhou, Graduate Research Assistant Sachin Rai, ITS Research Associate Nevine Georggi, TDM Research Associate
ROARING BROOK COMMUNITY INFORMATIONAL MEETING TACONIC STATE PARKWAY (TSP) AT PUDDING STREET INTERCHANGE
 AT PUDDING STREET INTERCHANGE") ROARING BROOK COMMUNITY INFORMATIONAL MEETING TACONIC STATE PARKWAY (TSP) AT PUDDING STREET INTERCHANGE Town of Putnam Valley, Putnam County February 7, 2018 1 2 MEETING AGENDA Introductions (5 minutes)
ROARING BROOK COMMUNITY INFORMATIONAL MEETING TACONIC STATE PARKWAY (TSP) AT PUDDING STREET INTERCHANGE Town of Putnam Valley, Putnam County February 7, 2018 1 2 MEETING AGENDA Introductions (5 minutes)
Cedar Rapids ITS Deployment Project
 Cedar Rapids ITS Deployment Project Concept of Operations July 29, 2011 Table of Contents Section 1 Introduction Purpose Goal of ITS Deployments Section 2 Needs Assessment General Background Stakeholders
Study Area and Location District PSA Ward ANC Phase Description D Proposed 1900 Block Foxhall Road Northwest Southbound
 Speed Limit and Safety Nexus Studies for Automated Enforcement Locations in the District of Columbia 19 Block Foxhall Road NW S/B Study Area and Location District PSA Ward ANC Phase Description 2 25 3
Northern Virginia Transportation Authority
 IV Northern Virginia Transportation Authority March 23, 2017 Susan Shaw, P.E., Megaprojects Director Virginia Department of Transportation 66 Outside the Beltway Project Scope Multimodal improvements to
MEMORANDUM. Church of the Redeemer School Focused Transportation Impact Analysis
 MEMORANDUM Date: Februrary 2, 2016 To: From: Subject: Father Samer Youssef, Church of the Redeemer Sarah Jampole and Matt Haynes, Fehr & Peers Church of the Redeemer School Focused Transportation Impact
Study Area and Location District PSA Ward ANC Phase Description C Existing 3500 Block Massachusetts Avenue Northwest Eastbound
 Speed Limit and Safety Nexus Studies for Automated Enforcement Locations in the District of Columbia 35 Block Massachusetts Avenue NW Study Area and Location District PSA Ward ANC Phase Description 2 24
Speed Limit and Safety Nexus Studies for Automated Enforcement Locations in the District of Columbia 1100 Block 4th Street NE
 Speed Limit and Safety Nexus Studies for Automated Enforcement Locations in the District of Columbia 11 Block 4th Street NE Study Area and Location District PSA Ward ANC Phase Description 1 14 6 6C Proposed
Study Area and Location District PSA Ward ANC Phase Description B Planned Branch Avenue Northbound at Alabama Avenue Southeast
 Speed Limit and Safety Nexus Studies for Automated Enforcement Locations in the District of Columbia Branch Avenue at Alabama Avenue SE Study Area and Location District PSA Ward ANC Phase Description 6
Integrating Travel Demand Management into the Long-Range Planning Process 2017 AMPO
 Integrating Travel Demand Management into the Long-Range Planning Process 2017 AMPO October 19, 2017 Chattanooga 2045 RTP Chattanooga 2045 RTP addresses both transportation supply and demand Continued
Real-time Adaptive Control System. Technical White Paper. September 2012 Trafficware SynchroGreen Technical White Paper
 SynchroGreen SynchroGreen Real-time Adaptive Control System Technical White Paper Trafficware 522 Gillingham Sugar Land, Texas 77478 (281) 240-7233 sales@trafficware.com www.trafficware.com www.synchrogreen.com
Speed Limit and Safety Nexus Studies for Automated Enforcement Locations in the District of Columbia Inside Southern part of 3rd Street Tunnel
 Speed Limit and Safety Nexus Studies for Automated Enforcement Locations in the District of Columbia Inside Southern part of 3rd Street Tunnel Study Area and Location District PSA Ward ANC Phase Description
The Blue Line Extension
 The Blue Line Extension NORTH CAROLINA JOINT TRANSPORTATION OVERSIGHT COMMITTEE Presented by Carolyn Flowers CATS Chief Executive Officer Raleigh, NC February 10, 2012 Overview Charlotte Area Transit System
An Assessment of Congestion in the Kansas City Region using the MARC Travel Demand Model
 An Assessment of Congestion in the Kansas City Region using the MARC Travel Demand Model The Congestion Management Process Federal Regulations state that all metropolitan planning organizations must carry
Veirs Mill Road Metrobus Improvements Request to Conduct Public Hearing
 Customer Services, Operations, and Safety Committee Board Information Item III-B September 24, 2009 Veirs Mill Road Metrobus Improvements Request to Conduct Public Hearing Washington Metropolitan Area
Appendix D Supportive Transportation Materials
 Appendix D Supportive Transportation Materials D.1. Stakeholder Input and Coordination As noted in Section 1.7 of the main Master Plan document, there have been several opportunities for stakeholders to
OR 217,I-5 Experience Portland, OR
 OR 217,I-5 Experience Portland, OR By: Abby Caringula Parsons Brinckerhoff July 8th, 2011 Presentation Outline Background VISUM Network Adjustment Model Origin-Destination(O-D) Demand Development ANM Export
APPENDIX I Traffic Impact Analysis
 APPENDIX I Traffic Impact Analysis Traffic Impact Analysis Collier Park Renovations Final Report Prepared for: 3570 Carmel Mountain Road Suite 300 San Diego, CA, 92130 8130 Allison Avenue La Mesa, CA
Microscopic Simulation Model Calibration and Validation: A Case Study of VISSIM for a Coordinated Actuated Signal System
 Park and Schneeberger 1 Microscopic Simulation Model Calibration and Validation: A Case Study of VISSIM for a Coordinated Actuated Signal System by Byungkyu "Brian" Park, Ph.D.* Research Assistant Professor
OPTIMAL MERGE LAYOUT ARRANGEMENTS FOR THE M50: A MICROSIMULATION MODELLING APPROACH
 Proceedings O BRIEN and DUNNY: Optimal Merge Layouts OPTIMAL MERGE LAYOUT ARRANGEMENTS FOR THE M50: A MICROSIMULATION MODELLING APPROACH Dr Liam O Brien Senior Consultant, Transportation AECOM Mr Shane
Request Conditional Use Permit (Colleges & Universities, public or private) Staff Planner Ashby Moss
 Staff Planner Ashby Moss") Applicant & Property Owner Public Hearing July 13, 2016 City Council Election District Bayside Agenda Item 9 Request Conditional Use Permit (Colleges & Universities, public or private) Staff Planner Ashby
Applicant & Property Owner Public Hearing July 13, 2016 City Council Election District Bayside Agenda Item 9 Request Conditional Use Permit (Colleges & Universities, public or private) Staff Planner Ashby
Travel Time Estimation Using Bluetooth
 Travel Time Estimation Using Bluetooth Ravindra Gudishala Chester Wilmot Aditya Mokkapatti Louisiana State University/Louisiana Transportation Research Center Objectives Estimate Travel Time in order to
BOARD OF SUPERVISORS 2017 TRANSPORTATION SUMMIT INFORMATION ITEM
 BOARD OF SUPERVISORS 2017 TRANSPORTATION SUMMIT INFORMATION ITEM Date of Meeting: # 9 SUBJECT: ELECTION DISTRICTS: STAFF CONTACTS: Public and Private Infrastructure Improvements Adjacent to the Dulles
Pensacola SunGuide Center Monthly ITS Performance Report to Pensacola RTMC Monthly Report July 2016
 1.0 Operations Summary RTMC Alerts Abandoned Vehicle 111 Congestion 11 Crash 93 Debris 64 Disabled Vehicle 417 Other 2 Police Activity - 3 PSA 22 Road Work Scheduled - 17 Vehicle Alert 22 Vehicle Fire
King County Ombudsman Whistle-Blowers Office Complaint
 King County Ombudsman Whistle-Blowers Office Complaint Filed by: Ho-Chuan Chen, Ph.D., P.E., Supervisor, Travel Forecasting and Data Management Group (TFDM) Hossein Barahimi, Transportation Planner III,
Study Area and Location District PSA Ward ANC Phase Description G Proposed 2900 Block Military Road Northwest Eastbound
 Speed Limit and Safety Nexus Studies for Automated Enforcement Locations in the District of Columbia 29 Block Military Road NW E/B Study Area and Location District PSA Ward ANC Phase Description 2 21 3
Updating NTCIP 1202 (Actuated Signal Controllers) to Support a Connected Vehicle Environment. Authors
 to Support a Connected Vehicle Environment. Authors") Updating NTCIP 1202 (Actuated Signal Controllers) to Support a Connected Vehicle Environment Jean Johnson NEMA 1300 North 17 th Street, Suite 900 Rosslyn, VA 22209 (703) 841-3226 jean.johnson@nema.org
Updating NTCIP 1202 (Actuated Signal Controllers) to Support a Connected Vehicle Environment Jean Johnson NEMA 1300 North 17 th Street, Suite 900 Rosslyn, VA 22209 (703) 841-3226 jean.johnson@nema.org
SAFETY ON THE IH 35 EXPANSION PROJECTS. Andy Petter, P.E. - Waco District
 SAFETY ON THE IH 35 EXPANSION PROJECTS Andy Petter, P.E. - Waco District Presentation IH 35 Expansion through the Waco District Safety Requirements on the Projects IH 35 Safety Summit Meetings Crash Data
Downtown Boise Multimodal Center
 Treasure Valley High Capacity Transit Study Downtown Boise Multimodal Center Environmental Assessment June 2009 Prepared by the Federal Transit Administration and Valley Regional Transit. U.S. Department
Page 2D-12 Revised the following language in the last sentence on the page from; as shown in Figure 2D-3. To; as shown in Chapter 2H, Figure 2H-35.
 IMPERIAL ROAD DESIGN MANUAL REVISIONS January, 2015 CHAPTER 2A Page 2A-1 Revised the following language at the end of the paragraph under PRELIMINARY ENGINEERING AUTHORIZATION from; Funding Allocation/Verification/Submittal
Municipal Service Park 3 December Consolidation of City services to one centralized complex
 Municipal Service Park 3 December 2010 Consolidation of City services to one centralized complex Overview: Operational Challenges and Opportunities South East Connector impacts Opportunities: The South
ITS Canada Annual Conference and General Meeting. May 2013
 Evaluation of Travel Time Data Collection Technologies: An Innovative Approach for a Large- Scale Network ITS Canada Annual Conference and General Meeting May 2013 Study Steps Obtain the traffic data from
Synchro Studio 10. with Warrants and TripGen Release Notes
 Synchro Studio 10 with Warrants and TripGen Release Notes Table of Contents INTRODUCTION...1 Release 10.1.2: September 28, 2017... 1 Release 10.1.1: July 25, 2017... 1 RELEASE 10.1.0: JULY 14, 2017...
CORSIM User's Guide. Version 6.0
 CORSIM User's Guide Version 6.0 Prepared by: ITT Industries, Inc., Systems Division ATMS R&D and Systems Engineering Program Team P O Box 15012 Colorado Springs, CO 80935-5012 Prepared for: FHWA Office
vision42
 vision42 www.vision42.org vision4 auto-free light rail 2 boulevard for 42nd Street Roxanne Warren, AIA, Chair George Haikalis, ASCE, Co-Chair Institute for Rational Urban Mobility,Inc. www.vision42.org
County of Loudoun. Department of Planning and Zoning MEMORANDUM
 County of Loudoun Department of Planning and Zoning MEMORANDUM DATE: June 12, 2015 TO: FROM: Jacqueline Harlow, Project Manager Planner III, Land Use Review Kelly Williams, Planner III Community Planning
Activity-Based Human Mobility Patterns Inferred from Mobile Phone Data: A Case Study of Singapore
 Activity-Based Human Mobility Patterns Inferred from Mobile Phone Data: A Case Study of Singapore By: Shan Jiang, Joseph Ferreira, Jr., and Marta C. Gonzalez Published in: 2017 Presented by: Masijia Qiu
Incident Location Tool 4.X. User s Manual
 Incident Location Tool 4.X User s Manual CONTENTS Contents...3 1.0 INSTALLATION and CONFIGURATION... 1 1.1 Installation Procedure... 1 1.1.1 Requirements...1 1.1.2 Setup...1 1.1.3 Restart Message... 5
1.0 PURPOSE AND NEED
 1.0 PURPOSE AND NEED This chapter documents the need for transit improvements in the Northwest Corridor and the purposes that the proposed project is intended to serve. An overview of the study corridor
Applying Analysis Tools in Planning for Operations
 Applying Analysis Tools in Planning for Operations Case Study #2 Incorporating Highway Capacity Manual Procedures into Long-Range Transportation Planning Notice This document is disseminated under the
GORE BUILDING. 238 N. Massachusetts Avenue, Lakeland, FL 33801
 GORE BUILDING 238 N. Massachusetts Avenue, Lakeland, FL 33801 CDB LOCATION REDEVELOPMENT PROJECT MUNN PARK HISTORIC DISTRICT INCENTIVES AVAILABLE ADJACENT PARKING INCLUDED BK698301 Phone: (863) 683-3425
ARTS DISTRICT 2018 E. 8 TH STREET, LOS ANGELES, CA
 DOWNTOWN LOS ANGELES ARTS DISTRICT 2018 E. 8 TH STREET, LOS ANGELES, CA INVESTMENT / OWNER-USER OPPORTUNITY MARKETING BROCHURE WWW.LAREALTYPARTNERS.COM PROPERTY SUMMARY PROPERTY OVERVIEW 2017 E. 8TH STREET
SPEED SURVEY ANALYSIS SYSTEM
 SPEED SURVEY ANALYSIS SYSTEM user s manual CROSSROADS SOFTWARE 210 W. Birch Street, Suite 207 Brea, CA 92821 (714) 990-6433 Fax: (714) 990-5628 www.crossroadssoftware.com Chapter One: Introducing the Speed
Gaston County GIS. Interactive Mapping Website
 Gaston County GIS Interactive Mapping Website The Gaston County GIS mapping website optimizes the available window viewing area and has interactive tools, collapsible menus and movable windows. This map
Traffic Simulator. Revised Software Requirements Specification. Khalid AlHokail Luke Bay James Grady Michael Murphy
 Traffic Simulator Revised Software Requirements Specification Khalid AlHokail Luke Bay James Grady Michael Murphy Version 2.0 03/07/2007 Table of Contents 1. Map Model...2 1.1. Graph...2 1.2. Rules for
TURNING MOVEMENT CALCULATOR VERSION 3.0
 TURNING MOVEMENT CALCULATOR VERSION 3.0 User Guide February 23, 2008 Whitehouse Group Inc. For support: +1 (202) 241-2008 software@wgianalytics.com TABLE OF CONTENTS INTRODUCTION... 1 Features... 1 Benefits...
Performance Evaluation of Non-Intrusive Methods for Traffic Data Collection. Kamal Banger, Ministry of Transportation of Ontario
 Abstract Performance Evaluation of Non-Intrusive Methods for Traffic Data Collection Kamal Banger, Ministry of Transportation of Ontario Nancy Adriano, P.Eng., Ministry of Transportation of Ontario For
Creating transportation system intelligence using PeMS. Pravin Varaiya PeMS Development Group
 Creating transportation system intelligence using PeMS Pravin Varaiya PeMS Development Group Summary Conclusion System overview Routine reports: Congestion monitoring, LOS Finding bottlenecks Max flow