Some Handy Computing and Graphing Tools
|
|
|
- Dorothy Shanon Stewart
- 6 years ago
- Views:
Transcription

 into a search bar and you will get: Note that the")
1 Some Handy Computing and Graphing Tools I. Google s Calculator Google has a graphing calculator application that is integrated into its search bar. For example, you can simply type 3/sin(2) into a search bar and you will get: Note that the default is radians. If you meant 2 degrees, click the radians/degrees switch, retype the expression directly into the calculator, and click =.
2 2 You must use appropriate syntax. For example, depending on how you type your expression, Google may not recognize it as a formula to feed to the calculator. In that case, it will simply spit out basic search results: On the other hand:
3 3 To graph two or more functions simultaneously, just separate the formulas with a comma. For example, try graphing: f(x) = cos 7x x 2 along with the envelopes y = 1/x 2 and y = 1/x 2. You should see... Notice the + and zoom buttons. If you click on the tab next to the cross, you also have the option to zoom only vertically, or only horizontally. Click and drag to move around the graph. (You can also try zooming with a scroll wheel or trackpad.)
4 4 This can also graph functions of two variables:... what is happening near the origin? Does the limit below exist? Why/why not? lim (x,y) (0,0) xy x 2 + y 2 Note the coordinate window on the bottom right. You can click on each to adjust the window. (Firefox doesn t seem to work here.) You can spin this around in 3-d. Play with the different buttons, for zooming, etc. If you click the arrow by the coordinate window, this removes the coordinate axes and grid...
5 5
 or z = f(x, y).")
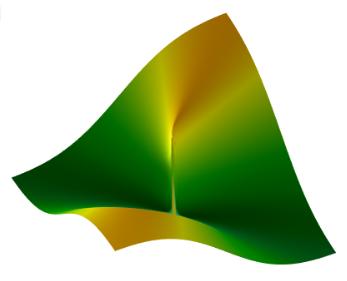
6 6 One of the unfortunate limitations of this application is that it can not graph more general equations in two or three variables. For example, it won t graph the circle x 2 + y 2 = 1, or the sphere x 2 + y 2 + z 2 = 1. As far as I know, it can only graph functions, either y = f(x) or z = f(x, y). If you want to graph a sphere using Google s Calculator you have to settle for splitting it up into pieces which are graphs of functions. For example, the top half of the unit sphere from the origin is the graph of the function f(x, y) = 1 x 2 y 2... and Google still struggles a bit with this. (I also changed the viewing window.)

7 7 II. Graphing with Grapher in OSX If you have access to a Mac, you have another option, which is the Grapher utility. This is a neat program and a proper graphing utility, so you have a bit more control than with Google. It does have its own quirks however. (As I understand it, Apple did not develop this program, but rather bought it from another software company, a long time ago. Because of this, it appears that the program has not been updated in many years, and probably never will.) Grapher is in the Utilities folder, inside the Applications folder. So: Applications > Utilities > Grapher If you have a Mac, I recommend adding this to your dock. When you open the program, you will see: You can play around with the other options later, but just choose default to start. Doing so, you will be prompted to enter a formula. For example, trying y = x 2, (by typing in: x 2), looks like...

8 8 You can graph several functions at once by clicking on the big plus in the bottom left corner, and selecting new equation. For example, trying y = x 2 sin 50x... You can also save these files for later use.


9 9 And with Grapher, you are not limited to functions. For example, you can graph: x 3 + y 3 = 3xy Grapher will also graph basic equations in three variables...

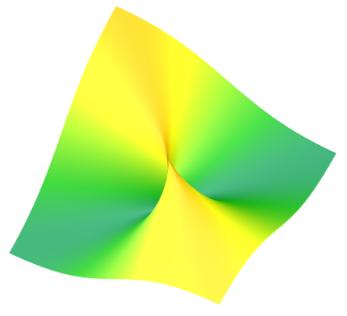
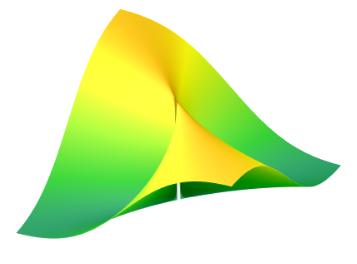
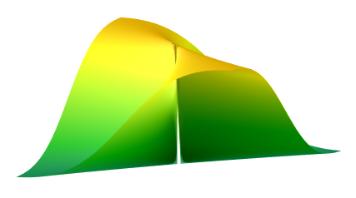
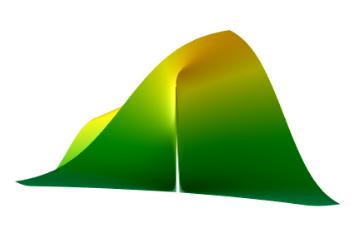
10 Here s a saddle surface, z = y 2 x 2, with a few y-slices shown: 10

 brings up the palette.")
11 To get the pictures above, I graphed the equation z = y 2 x 2, and also the equations y = 0, y =.5. I changed the colors, style, and transparencies using the Inspector. Look for this in a menu, or right-click on the surface you want to edit. Clicking on the color(s) brings up the palette. Turning down the opacity of a color makes it more transparent; 11
 = x 2 + 2y 2 + 3z 2, and using the fact the gradient f is perpendicular to the level sets of f, thus")
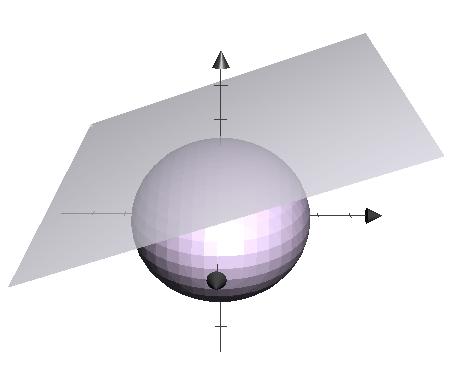
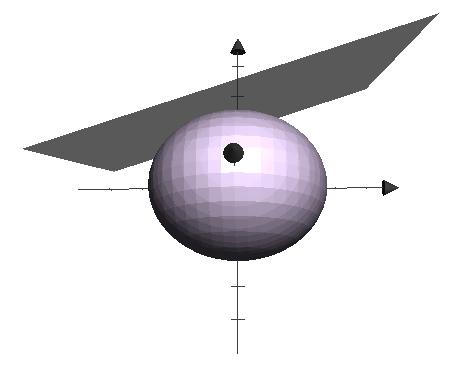
12 12 Remember the ellipsoid from class? (14.5) x 2 + 2y 2 + 3z 2 = 15 We found the equation of the plane tangent to the ellipsoid at (1, 1, 2). (Recall that we did this by viewing the ellipsoid as the 15-level set of the function f(x, y, z) = x 2 + 2y 2 + 3z 2, and using the fact the gradient f is perpendicular to the level sets of f, thus giving a normal vector for the tangent plane.) We can graph both the ellipsoid and its tangent plane together in Grapher:
13 13


14 14 Of course, Grapher has its own limitations too. For example, for the function f(x, y) = 2y x 2 + y On the other hand, Google spits out a beautiful graph for the same function:
x 6 + λ 2 x 6 = for the curve y = 1 2 x3 gives f(1, 1 2 ) = λ actually has another solution besides λ = 1 2 = However, the equation λ
 = λ actually has another solution besides λ = 1 2 = However, the equation λ") Math 0 Prelim I Solutions Spring 010 1. Let f(x, y) = x3 y for (x, y) (0, 0). x 6 + y (4 pts) (a) Show that the cubic curves y = x 3 are level curves of the function f. Solution. Substituting y = x 3 in
Math 0 Prelim I Solutions Spring 010 1. Let f(x, y) = x3 y for (x, y) (0, 0). x 6 + y (4 pts) (a) Show that the cubic curves y = x 3 are level curves of the function f. Solution. Substituting y = x 3 in
f xx (x, y) = 6 + 6x f xy (x, y) = 0 f yy (x, y) = y In general, the quantity that we re interested in is
 = 6 + 6x f xy (x, y) = 0 f yy (x, y) = y In general, the quantity that we re interested in is") 1. Let f(x, y) = 5 + 3x 2 + 3y 2 + 2y 3 + x 3. (a) Final all critical points of f. (b) Use the second derivatives test to classify the critical points you found in (a) as a local maximum, local minimum,
1. Let f(x, y) = 5 + 3x 2 + 3y 2 + 2y 3 + x 3. (a) Final all critical points of f. (b) Use the second derivatives test to classify the critical points you found in (a) as a local maximum, local minimum,
Math 21a Tangent Lines and Planes Fall, What do we know about the gradient f? Tangent Lines to Curves in the Plane.
 Math 21a Tangent Lines and Planes Fall, 2016 What do we know about the gradient f? Tangent Lines to Curves in the Plane. 1. For each of the following curves, find the tangent line to the curve at the point
Organizing Screens with Mission Control
 7 Organizing Screens with Mission Control If you re like a lot of Mac users, you like to do a lot of things at once. No matter how big your screen may be, it can still feel crowded as you open and arrange
How to...create a Video VBOX Gauge in Inkscape. So you want to create your own gauge? How about a transparent background for those text elements?
 BASIC GAUGE CREATION The Video VBox setup software is capable of using many different image formats for gauge backgrounds, static images, or logos, including Bitmaps, JPEGs, or PNG s. When the software
2.9 Linear Approximations and Differentials
 2.9 Linear Approximations and Differentials 2.9.1 Linear Approximation Consider the following graph, Recall that this is the tangent line at x = a. We had the following definition, f (a) = lim x a f(x)
How to Export a Report in Cognos Analytics
 IBM Cognos Analytics How to Export a Report in Cognos Analytics Reports viewed in IBM Cognos Analytics can be exported in many formats including Excel. Some of the steps for exporting are different depending
2D Tutorial. Project Description: Running VisualAnalysis: Setting Up the Project:
 2D Tutorial Project Description: This project has been set-up to demonstrate the basic features of VisualAnalysis. You will model and analyze the following two-dimensional frame with a curved glue-laminated
Parametric Surfaces and Surface Area
 Parametric Surfaces and Surface Area What to know: 1. Be able to parametrize standard surfaces, like the ones in the handout.. Be able to understand what a parametrized surface looks like (for this class,
What you will learn today
 What you will learn today Tangent Planes and Linear Approximation and the Gradient Vector Vector Functions 1/21 Recall in one-variable calculus, as we zoom in toward a point on a curve, the graph becomes
OnCOR Silverlight Viewer Guide
 Getting Around There are many ways to move around the map! The simplest option is to use your mouse in the map area. If you hold the left button down, then click and drag, you can pan the map to a new
CHAPTER 1 COPYRIGHTED MATERIAL. Getting to Know AutoCAD. Opening a new drawing. Getting familiar with the AutoCAD and AutoCAD LT Graphics windows
 CHAPTER 1 Getting to Know AutoCAD Opening a new drawing Getting familiar with the AutoCAD and AutoCAD LT Graphics windows Modifying the display Displaying and arranging toolbars COPYRIGHTED MATERIAL 2
Creating a Text Frame. Create a Table and Type Text. Pointer Tool Text Tool Table Tool Word Art Tool
 Pointer Tool Text Tool Table Tool Word Art Tool Picture Tool Clipart Tool Creating a Text Frame Select the Text Tool with the Pointer Tool. Position the mouse pointer where you want one corner of the text
Date: 16 July 2016, Saturday Time: 14:00-16:00 STUDENT NO:... Math 102 Calculus II Midterm Exam II Solutions TOTAL. Please Read Carefully:
 Date: 16 July 2016, Saturday Time: 14:00-16:00 NAME:... STUDENT NO:... YOUR DEPARTMENT:... Math 102 Calculus II Midterm Exam II Solutions 1 2 3 4 TOTAL 25 25 25 25 100 Please do not write anything inside
14.5 Directional Derivatives and the Gradient Vector
 14.5 Directional Derivatives and the Gradient Vector 1. Directional Derivatives. Recall z = f (x, y) and the partial derivatives f x and f y are defined as f (x 0 + h, y 0 ) f (x 0, y 0 ) f x (x 0, y 0
For more info and downloads go to: Gerrit Stols
 For more info and downloads go to: http://school-maths.com Gerrit Stols Acknowledgements GeoGebra is dynamic mathematics open source (free) software for learning and teaching mathematics in schools. It
Inkscape tutorial: Donate button
 Inkscape tutorial: Donate button By: Very Simple Designs (BDT466) Web Site: http://verysimpledesigns.com/vectors/inkscape-tutorial-donate-button.html This Inkscape beginner tutorial teaches the viewer
10-2 Circles. Warm Up Lesson Presentation Lesson Quiz. Holt Algebra2 2
 10-2 Circles Warm Up Lesson Presentation Lesson Quiz Holt Algebra2 2 Warm Up Find the slope of the line that connects each pair of points. 1. (5, 7) and ( 1, 6) 1 6 2. (3, 4) and ( 4, 3) 1 Warm Up Find
d f(g(t), h(t)) = x dt + f ( y dt = 0. Notice that we can rewrite the relationship on the left hand side of the equality using the dot product: ( f
, h(t)) = x dt + f ( y dt = 0. Notice that we can rewrite the relationship on the left hand side of the equality using the dot product: ( f") Gradients and the Directional Derivative In 14.3, we discussed the partial derivatives f f and, which tell us the rate of change of the x y height of the surface defined by f in the x direction and the
Gradients and the Directional Derivative In 14.3, we discussed the partial derivatives f f and, which tell us the rate of change of the x y height of the surface defined by f in the x direction and the
Introduction to Geogebra
 Aims Introduction to Geogebra Using Geogebra in the A-Level/Higher GCSE Classroom To provide examples of the effective use of Geogebra in the teaching and learning of mathematics at A-Level/Higher GCSE.
REVIEW I MATH 254 Calculus IV. Exam I (Friday, April 29) will cover sections
 will cover sections") REVIEW I MATH 254 Calculus IV Exam I (Friday, April 29 will cover sections 14.1-8. 1. Functions of multivariables The definition of multivariable functions is similar to that of functions of one variable.
REVIEW I MATH 254 Calculus IV Exam I (Friday, April 29 will cover sections 14.1-8. 1. Functions of multivariables The definition of multivariable functions is similar to that of functions of one variable.
Math 213 Calculus III Practice Exam 2 Solutions Fall 2002
 Math 13 Calculus III Practice Exam Solutions Fall 00 1. Let g(x, y, z) = e (x+y) + z (x + y). (a) What is the instantaneous rate of change of g at the point (,, 1) in the direction of the origin? We want
Where Did I Save That File?
 Note: This discussion is based on MacOS, 10.13.6 (High Sierra). Some illustrations may differ when using other versions of macos or OS X. Illustrations are from screenshots on my imac. As I mentioned in
Meeting your new mac
 Meeting your new mac by Robin Shostack, Harvard, Jan 31, 2005 Why mac? Desktop Web browsing Mac mail Burning CDs Getting help Topics Why move to macs? Mac OS X (macintosh operating system version 10) easy
Lines and Circles Guided Practice: Teacher Instructions
 Lines and Circles Guided Practice: Teacher Instructions Overview 1. Together, as a class, go through the Lines and Circles Guided Practice (exercises 1-22) described below. 2. Then have student teams conduct
Math 206 First Midterm October 5, 2012
 Math 206 First Midterm October 5, 2012 Name: EXAM SOLUTIONS Instructor: Section: 1. Do not open this exam until you are told to do so. 2. This exam has 8 pages including this cover AND IS DOUBLE SIDED.
SUMMER REVIEW FOR STUDENTS COMPLETING GEOMETRY show your work. WEEK 1
 Name: 1. Given: 2x 2 3x = 8 SUMMER REVIEW FOR STUDENTS COMPLETING GEOMETRY show your work. WEEK 1 a. Write in standard form. ax 2 +bx+c=0 2. Write an equation for a line parallel to y = -3x + 2 that passes
Student Success Guide
 Student Success Guide Contents Like a web page, links in this document can be clicked and they will take you to where you want to go. Using a Mouse 6 The Left Button 6 The Right Button 7 The Scroll Wheel
Use the Move tool to drag A around and see how the automatically constructed objects (like G or the perpendicular and parallel lines) are updated.
 are updated.") Math 5335 Fall 2015 Lab #0: Installing and using GeoGebra This semester you will have a number of lab assignments which require you to use GeoGebra, a dynamic geometry program. GeoGebra lets you explore
Math 5335 Fall 2015 Lab #0: Installing and using GeoGebra This semester you will have a number of lab assignments which require you to use GeoGebra, a dynamic geometry program. GeoGebra lets you explore
Partial Derivatives. Partial Derivatives. Partial Derivatives. Partial Derivatives. Partial Derivatives. Partial Derivatives
 In general, if f is a function of two variables x and y, suppose we let only x vary while keeping y fixed, say y = b, where b is a constant. By the definition of a derivative, we have Then we are really
Adobe illustrator Introduction
 Adobe illustrator Introduction This document was prepared by Luke Easterbrook 2013 1 Summary This document is an introduction to using adobe illustrator for scientific illustration. The document is a filleable
Number of Regions An Introduction to the TI-Nspire CAS Student Worksheet Created by Melissa Sutherland, State University of New York at Geneseo
 1 Name Number of Regions An Introduction to the TI-Nspire CAS Student Worksheet Created by Melissa Sutherland, State University of New York at Geneseo Below you will find copies of the notes provided on
Directional Derivatives. Directional Derivatives. Directional Derivatives. Directional Derivatives. Directional Derivatives. Directional Derivatives
 Recall that if z = f(x, y), then the partial derivatives f x and f y are defined as and represent the rates of change of z in the x- and y-directions, that is, in the directions of the unit vectors i and
Differentiability and Tangent Planes October 2013
 Differentiability and Tangent Planes 14.4 04 October 2013 Differentiability in one variable. Recall for a function of one variable, f is differentiable at a f (a + h) f (a) lim exists and = f (a) h 0 h
14.6 Directional Derivatives and the Gradient Vector
 14 Partial Derivatives 14.6 and the Gradient Vector Copyright Cengage Learning. All rights reserved. Copyright Cengage Learning. All rights reserved. and the Gradient Vector In this section we introduce
Google Classroom User Manual
 Google Classroom User Manual Table of Contents Table of Contents 1 Google Classroom on a Computer 3 1: Making an Account 3 2: Change Your Profile Photo 5 3: Customize your Notifications 7 4: Join a Class
Scottish Improvement Skills
 Scottish Improvement Skills Creating a run chart on MS Excel 2007 Create and save a new Excel worksheet. Some of the details of steps given below may vary slightly depending on how Excel has been used
Introduction to Mathematica and Graphing in 3-Space
 1 Mathematica is a powerful tool that can be used to carry out computations and construct graphs and images to help deepen our understanding of mathematical concepts. This document will serve as a living
Section 7.6 Graphs of the Sine and Cosine Functions
 Section 7.6 Graphs of the Sine and Cosine Functions We are going to learn how to graph the sine and cosine functions on the xy-plane. Just like with any other function, it is easy to do by plotting points.
Download and Install RootsMagic for Mac
 Download and Install RootsMagic for Mac This Magic Guide covers: A. Finding the RootsMagic Installer on RootsMagic.com B. Downloading with Safari C. Downloading with Google Chrome D. Installing RootsMagic
We will be sketching 3-dimensional functions. You will be responsible for doing this both by hand and with Mathematica.
 Review polar coordinates before 9.7. Section 9.6 Functions and Surfaces We will be sketching 3-dimensional functions. You will be responsible for doing this both b hand and with Mathematica. Remember:
The Addition Formulas in Trigonometry. Scott Fallstrom Faculty Director, Math Learning Center
 The Addition Formulas in Trigonometry Scott Fallstrom Faculty Director, Math Learning Center Why not the usual? In Mathematics, we know that the distributive property allows 7(x + 5) = 7x + 35 With derivatives,
Autodesk Inventor - Basics Tutorial Exercise 1
 Autodesk Inventor - Basics Tutorial Exercise 1 Launch Inventor Professional 2015 1. Start a New part. Depending on how Inventor was installed, using this icon may get you an Inch or Metric file. To be
PASS Sample Size Software
 Chapter 941 Introduction In PASS, it is easy to study power and sample size calculations for a range of possible parameter values. When at least 2 input parameters vary, you can create stunning 3D power
6. Find the equation of the plane that passes through the point (-1,2,1) and contains the line x = y = z.
 and contains the line x = y = z.") Week 1 Worksheet Sections from Thomas 13 th edition: 12.4, 12.5, 12.6, 13.1 1. A plane is a set of points that satisfies an equation of the form c 1 x + c 2 y + c 3 z = c 4. (a) Find any three distinct
Week 1 Worksheet Sections from Thomas 13 th edition: 12.4, 12.5, 12.6, 13.1 1. A plane is a set of points that satisfies an equation of the form c 1 x + c 2 y + c 3 z = c 4. (a) Find any three distinct
Mac: Beyond Basics. Window 2 (Microsoft Word) Window 1 (folder contents)
 Window 1 (folder contents)") Mac: Beyond Basics Working with windows When you open a file or application, you will see a window. This window is your working area. It is possible to have many windows open at the same time. This allows
Mac: Beyond Basics Working with windows When you open a file or application, you will see a window. This window is your working area. It is possible to have many windows open at the same time. This allows
VisualPST 2.4. Visual object report editor for PowerSchool. Copyright Park Bench Software, LLC All Rights Reserved
 VisualPST 2.4 Visual object report editor for PowerSchool Copyright 2004-2015 Park Bench Software, LLC All Rights Reserved www.parkbenchsoftware.com This software is not free - if you use it, you must
An Animated Scene. Pick a color for the street. Then use the Paint can to fill the lower part of the page with grass.
 An Animated Scene In this project, you create a simple animated scene with graphics, a bit of text, a simple animation and some music. Click on the Steps below and be creative! Remember: if you must leave
How To Manually Update QuickBooks Point of Sale 2013 In A Multi User Environment To The Most Current Release Via Intuit s Website
 There will come a time when you may need to manually update QuickBooks Point of Sale 2013 manually via downloading the most current release from Intuit s website. This will usually need to be done when
Beginning Paint 3D A Step by Step Tutorial. By Len Nasman
 A Step by Step Tutorial By Len Nasman Table of Contents Introduction... 3 The Paint 3D User Interface...4 Creating 2D Shapes...5 Drawing Lines with Paint 3D...6 Straight Lines...6 Multi-Point Curves...6
Graphing Interface Overview
 Graphing Interface Overview Note: This document is a reference for using JFree Charts. JFree Charts is m-power s legacy graphing solution, and has been deprecated. JFree Charts have been replace with Fusion
MAT203 OVERVIEW OF CONTENTS AND SAMPLE PROBLEMS
 MAT203 OVERVIEW OF CONTENTS AND SAMPLE PROBLEMS MAT203 covers essentially the same material as MAT201, but is more in depth and theoretical. Exam problems are often more sophisticated in scope and difficulty
CREATING DESMOS ETOOLS
 CREATING DESMOS ETOOLS Table of Contents Using Desmos... 3 Creating & Using a Desmos Account (Top Black Bar)... 4 Domain/Range & Axis Labels & Zoom: (Right side Icons)... 6 Adding Items in the List Tray:
Models for Nurses: Quadratic Model ( ) Linear Model Dx ( ) x Models for Doctors:
 Linear Model Dx ( ) x Models for Doctors:") The goal of this technology assignment is to graph several formulas in Excel. This assignment assumes that you using Excel 2007. The formula you will graph is a rational function formed from two polynomials,
The goal of this technology assignment is to graph several formulas in Excel. This assignment assumes that you using Excel 2007. The formula you will graph is a rational function formed from two polynomials,
3D Surface Plots with Groups
 Chapter 942 3D Surface Plots with Groups Introduction In PASS, it is easy to study power and sample size calculations for a range of possible parameter values. When at least 3 input parameters vary, you
Calculus III. Math 233 Spring In-term exam April 11th. Suggested solutions
 Calculus III Math Spring 7 In-term exam April th. Suggested solutions This exam contains sixteen problems numbered through 6. Problems 5 are multiple choice problems, which each count 5% of your total
12.6 Cylinders and Quadric Surfaces
 12 Vectors and the Geometry of Space 12.6 and Copyright Cengage Learning. All rights reserved. Copyright Cengage Learning. All rights reserved. and We have already looked at two special types of surfaces:
Rectangular Coordinates in Space
 Rectangular Coordinates in Space Philippe B. Laval KSU Today Philippe B. Laval (KSU) Rectangular Coordinates in Space Today 1 / 11 Introduction We quickly review one and two-dimensional spaces and then
PRINTING GROWER FIELD MAPS OFF THE WEB
 PRINTING GROWER FIELD MAPS OFF THE WEB 3-29-2018 A. Google Earth: Very easy to use; easy to print map (either directly or via extraction to Word); easy to scale up or down; locator makes finding field
Direction Fields; Euler s Method
 Direction Fields; Euler s Method It frequently happens that we cannot solve first order systems dy (, ) dx = f xy or corresponding initial value problems in terms of formulas. Remarkably, however, this
Math 113 Calculus III Final Exam Practice Problems Spring 2003
 Math 113 Calculus III Final Exam Practice Problems Spring 23 1. Let g(x, y, z) = 2x 2 + y 2 + 4z 2. (a) Describe the shapes of the level surfaces of g. (b) In three different graphs, sketch the three cross
Find the specific function values. Complete parts (a) through (d) below. f (x,y,z) = x y y 2 + z = (Simplify your answer.) ID: 14.1.
 through (d) below. f (x,y,z) = x y y 2 + z = (Simplify your answer.) ID: 14.1.") . Find the specific function values. Complete parts (a) through (d) below. f (x,y,z) = x y y 2 + z 2 (a) f(2, 4,5) = (b) f 2,, 3 9 = (c) f 0,,0 2 (d) f(4,4,00) = = ID: 4..3 2. Given the function f(x,y)
. Find the specific function values. Complete parts (a) through (d) below. f (x,y,z) = x y y 2 + z 2 (a) f(2, 4,5) = (b) f 2,, 3 9 = (c) f 0,,0 2 (d) f(4,4,00) = = ID: 4..3 2. Given the function f(x,y)
Tangent line problems
 You will find lots of practice problems and homework problems that simply ask you to differentiate. The following examples are to illustrate some of the types of tangent line problems that you may come
Introduction to CS Dealing with tables in Word Jacek Wiślicki, Laurent Babout,
 Most word processors offer possibility to draw and format even very sophisticated tables. A table consists of rows and columns, forming cells. Cells can be split and merged together. Content of each cell
Download and Install Personal Historian 2 for Mac
 Download and Install Personal Historian 2 for Mac This Magic Guide covers: A. Finding the Personal Historian 2 Installer on RootsMagic.com B. Downloading with Safari C. Downloading with Google Chrome D.
Geogebra: Helpful Hints (online version) geogebra.org/graphing
 geogebra.org/graphing") Geogebra: Helpful Hints (online version) geogebra.org/graphing When Geogebra is opened, there are two main screens: algebra screen, on the le: where informa=on is entered graphics screen, the main sec=on
Geogebra: Helpful Hints (online version) geogebra.org/graphing When Geogebra is opened, there are two main screens: algebra screen, on the le: where informa=on is entered graphics screen, the main sec=on
Objectives. Materials
 Activity 6 Local Linearity, Differentiability, and Limits of Difference Quotients Objectives Connect the concept of local linearity to differentiability through numerical explorations of limits of difference
Part 1: Basics. Page Sorter:
 Part 1: Basics Page Sorter: The Page Sorter displays all the pages in an open file as thumbnails and automatically updates as you add content. The page sorter can do the following. Display Pages Create
Introduction to Microsoft Excel
 Chapter A spreadsheet is a computer program that turns the computer into a very powerful calculator. Headings and comments can be entered along with detailed formulas. The spreadsheet screen is divided
Lobby Troubleshooting
 Introduction / Table of Contents This document was created to provide you with easy steps to troubleshoot issues within the lobby. Click on the links below to find the resolution to your problem. If you
TI-89 Clinic. Let s first set up our calculators so that we re all working in the same mode.
 TI-89 Clinic Preliminaries Let s first set up our calculators so that we re all working in the same mode. From the home screen, select F6 new problem. Hit enter to eecute that command. This erases previous
Algebra II. Slide 1 / 181. Slide 2 / 181. Slide 3 / 181. Conic Sections Table of Contents
 Slide 1 / 181 Algebra II Slide 2 / 181 Conic Sections 2015-04-21 www.njctl.org Table of Contents click on the topic to go to that section Slide 3 / 181 Review of Midpoint and Distance Formulas Introduction
Surfaces and Partial Derivatives
 Surfaces and James K. Peterson Department of Biological Sciences and Department of Mathematical Sciences Clemson University November 15, 2017 Outline 1 2 Tangent Planes Let s go back to our simple surface
MAT137 Calculus! Lecture 12
 MAT137 Calculus! Lecture 12 Today we will study more curve sketching (4.6-4.8) and we will make a review Test 2 will be next Monday, June 26. You can check the course website for further information Next
2. Getting Started When you start GeoGebra, you will see a version of the following window. 1
 Math 5335 Fall 2018 Lab #0: Installing and using GeoGebra This semester you will have a number of lab assignments which require you to use GeoGebra, a dynamic geometry program. GeoGebra lets you explore
This is a piece of software that allows the user to make presentations. Its user interface is radically different to that of PowerPoint.
 Prezi www.prezi.com This is a piece of software that allows the user to make presentations. Its user interface is radically different to that of PowerPoint. Users need to register in order to use Prezi
An Introduction to Box.com
 An Introduction to Box.com Box is an online file sharing and cloud content management service and it provides features such as: Security controls Space Mobility Online collaboration Mobile access Version
Autodesk Inventor Design Exercise 2: F1 Team Challenge Car Developed by Tim Varner Synergis Technologies
 Autodesk Inventor Design Exercise 2: F1 Team Challenge Car Developed by Tim Varner Synergis Technologies Tim Varner - 2004 The Inventor User Interface Command Panel Lists the commands that are currently
3D Design with 123D Design
 3D Design with 123D Design Introduction: 3D Design involves thinking and creating in 3 dimensions. x, y and z axis Working with 123D Design 123D Design is a 3D design software package from Autodesk. A
Proceedings of the Third International DERIVE/TI-92 Conference
 Using the TI-92 and TI-92 Plus to Explore Derivatives, Riemann Sums, and Differential Equations with Symbolic Manipulation, Interactive Geometry, Scripts, Regression, and Slope Fields Sally Thomas, Orange
LESSON 1: Trigonometry Pre-test
 LESSON 1: Trigonometry Pre-test Instructions. Answer each question to the best of your ability. If there is more than one answer, put both/all answers down. Try to answer each question, but if there is
Surfaces and Partial Derivatives
 Surfaces and Partial Derivatives James K. Peterson Department of Biological Sciences and Department of Mathematical Sciences Clemson University November 9, 2016 Outline Partial Derivatives Tangent Planes
Keynote 08 Basics Website:
 Website: http://etc.usf.edu/te/ Keynote is Apple's presentation application. Keynote is installed as part of the iwork suite, which also includes the word processing program Pages and the spreadsheet program
Creating a Spreadsheet by Using Excel
 The Excel window...40 Viewing worksheets...41 Entering data...41 Change the cell data format...42 Select cells...42 Move or copy cells...43 Delete or clear cells...43 Enter a series...44 Find or replace
The directional derivative of f x, y in the direction of at x, y u. f x sa y sb f x y (, ) (, ) 0 0 y 0 0
 (, ) 0 0 y 0 0") Review: 0, lim D f u 0 0 0 0 u The directional derivative of f, in the direction of at, is denoted b D f, : u a, b must a unit vector u f sa sb f s 0 (, ) (, ) s f (, ) a f (, ) b 0 0 0 0 0 0 D f, f u
Review: 0, lim D f u 0 0 0 0 u The directional derivative of f, in the direction of at, is denoted b D f, : u a, b must a unit vector u f sa sb f s 0 (, ) (, ) s f (, ) a f (, ) b 0 0 0 0 0 0 D f, f u
MULTIPLE CHOICE. Choose the one alternative that best completes the statement or answers the question.
 Calculus III-Final review Name MULTIPLE CHOICE. Choose the one alternative that best completes the statement or answers the question. Find the corresponding position vector. 1) Define the points P = (-,
solidthinking Environment...1 Modeling Views...5 Console...13 Selecting Objects...15 Working Modes...19 World Browser...25 Construction Tree...
 Copyright 1993-2009 solidthinking, Inc. All rights reserved. solidthinking and renderthinking are trademarks of solidthinking, Inc. All other trademarks or service marks are the property of their respective
Section 2.2 Graphs of Linear Functions
 Section. Graphs of Linear Functions Section. Graphs of Linear Functions When we are working with a new function, it is useful to know as much as we can about the function: its graph, where the function
The x coordinate tells you how far left or right from center the point is. The y coordinate tells you how far up or down from center the point is.
 We will review the Cartesian plane and some familiar formulas. College algebra Graphs 1: The Rectangular Coordinate System, Graphs of Equations, Distance and Midpoint Formulas, Equations of Circles Section
Graphing Calculator Tutorial
 Graphing Calculator Tutorial This tutorial is designed as an interactive activity. The best way to learn the calculator functions will be to work the examples on your own calculator as you read the tutorial.
4 TRANSFORMING OBJECTS
 4 TRANSFORMING OBJECTS Lesson overview In this lesson, you ll learn how to do the following: Add, edit, rename, and reorder artboards in an existing document. Navigate artboards. Select individual objects,
The points (2, 2, 1) and (0, 1, 2) are graphed below in 3-space:
 and (0, 1, 2) are graphed below in 3-space:") Three-Dimensional Coordinate Systems The plane is a two-dimensional coordinate system in the sense that any point in the plane can be uniquely described using two coordinates (usually x and y, but we have
Three-Dimensional Coordinate Systems The plane is a two-dimensional coordinate system in the sense that any point in the plane can be uniquely described using two coordinates (usually x and y, but we have
PRINTING GROWER FIELD MAPS OFF THE WEB
 PRINTING GROWER FIELD MAPS OFF THE WEB 12-01-09 I. FREE map printing options: A. Google Earth: Pros Very easy to use; easy to print map (either directly or via extraction to Word); easy to scale up or
Flash offers a way to simplify your work, using symbols. A symbol can be
 Chapter 7 Heavy Symbolism In This Chapter Exploring types of symbols Making symbols Creating instances Flash offers a way to simplify your work, using symbols. A symbol can be any object or combination
Frequently Asked Questions
 Frequently Asked Questions Employee Self-Service Easy Reference 1. Why didn t I receive the email from The Ahola Corporation (ahola@myisolved.com)? p.2 2. When I click the link in the registration email,
Rational Numbers and the Coordinate Plane
 Rational Numbers and the Coordinate Plane LAUNCH (8 MIN) Before How can you use the numbers placed on the grid to figure out the scale that is used? Can you tell what the signs of the x- and y-coordinates
Section 7.2 Volume: The Disk Method
 Section 7. Volume: The Disk Method White Board Challenge Find the volume of the following cylinder: No Calculator 6 ft 1 ft V 3 1 108 339.9 ft 3 White Board Challenge Calculate the volume V of the solid
4) Finish the spline here. To complete the spline, double click the last point or select the spline tool again.
 Finish the spline here. To complete the spline, double click the last point or select the spline tool again.") 1) Select the line tool 3) Move the cursor along the X direction (be careful to stay on the X axis alignment so that the line is perpendicular) and click for the second point of the line. Type 0.5 for
1) Select the line tool 3) Move the cursor along the X direction (be careful to stay on the X axis alignment so that the line is perpendicular) and click for the second point of the line. Type 0.5 for
Numbers Basics Website:
 Website: http://etc.usf.edu/te/ Numbers is Apple's new spreadsheet application. It is installed as part of the iwork suite, which also includes the word processing program Pages and the presentation program
Appserv Internal Desktop Access Mac OS Device with Safari Browser. Enter your Appserv username and password to sign in to the Website
 Appserv Desktop Access Logging on from a Mac OS device Step 1. To sign in to the Appserv Desktop Access website, enter the following address into the Safari browser address bar. Please Note: This documentation