Restoration of Historic Streetcar Service in Downtown Los Angeles. Alternatives Analysis (AA) FINAL
|
|
|
- Dora Ferguson
- 6 years ago
- Views:
Transcription

 FINAL January 13,")
1 Restoration of Historic Streetcar Service in Downtown Los Angeles (AA) FINAL January 13, 2012
2 This page intentionally left blank
3 Table of Contents 1.0 PURPOSE AND NEED Introduction Previous Planning Efforts Project Study Area Description Project Study Area Overview Characteristics of PSA Demographics in PSA Transit Service and Facilities in the PSA Traffic Conditions in PSA Statement of Need Geographically Disconnected Pedestrian Network Lack of Local Short-Trip Transit Service Increased Transit Demand Traffic Patterns and Imbalanced Parking Capacity Underutilized Land and Historic Buildings Statement of Purpose Enhance Mobility and Transit Circulation in Downtown Los Angeles Support the Growth and Revitalization of Downtown Los Angeles EVALUATION METHODOLOGY Evaluation Process Initial Screening Evaluation Criteria Final Screening Evaluation Criteria INITIAL SCREENING OF ALTERNATIVES Initial Screening Alternatives Initial Screening Evaluation Initial Screening Recommendations FINAL SCREENING OF ALTERNATIVES Final Screening Alternatives Changes to Alternatives Prior to Final Screening Combined Alternatives for Final Screening Final Screening Evaluation Ridership Capital Costs Operation and Maintenance (O&M) Costs Cost/Benefit i
4 Table of Contents (Continued) Destinations Circulation Design Environmental Economic Development Results of Final Screening Final Screening/Locally Preferred Alternative (LPA) Recommendation Future Extension to Union Station Appendices Appendix A: Ridership Technical Memo Appendix B: Capital Costs Appendix C: Operation and Maintenance Costs ii
5 Tables Table 1: Previous Planning Efforts... 3 Table 2: Districts in PSA... 8 Table 3: Population and Employment in PSA and Los Angeles County Table 4: Race and Ethnicity in PSA Table 5: Demographics of Potential Transit Users in PSA Table 6: Metro Rail in PSA Table 7: Metro Rail Weekday Boardings/Alightings by Station in PSA Table 8: Metro Bus Weekday Boardings/Alightings at Bus Stops in PSA Table 9: Mode Share for Commute Trips Table 10: Traffic Conditions at Intersections in PSA Table 11: Initial Screening Evaluation Criteria Table 12: Final Screening Evaluation Criteria Table 13: Description of Initial Screening Alternatives by Segment Table 14: Initial Screening - Segment A Table 15: Initial Screening - Segment B Table 16: Initial Screening - Segment C Table 17: Advantages/Disadvantages of Initial Screening Alternatives Table 18: Initial Screening Recommendations Table 19: Description of Final Screening Alternatives Table 20: Existing Streetcar Systems Table 21: Ridership Table 22: Capital Costs Table 23: O&M Costs Table 24: Cost/Benefit Table 25: Districts Served by Final Screening Alternatives Table 26: Destinations Served by Final Screening Alternatives Table 27: Circulation Issues Table 28: Design Issues Table 29: Potential Environmental Issues Table 30: Economic Development Potential Table 31: Summary of Ridership and Cost Results Table 32: Final Screening Results Table 33: Ranking of Alternatives after Final Screening Table 34: Final Screening/LPA Recommendation iii
6 Figures Figure 1: Project Study Area... 5 Figure 2: Historic Streetcar Service in PSA... 6 Figure 3: Activity Centers and Districts in PSA... 9 Figure 4: Land Use in PSA Figure 5: Historically Significant Buildings in PSA Figure 6: Surface Parking in PSA Figure 7: Development Since 2000 in PSA Figure 8: Planned Development in PSA Figure 9: Population in PSA (2010) Figure 10: Employment in PSA (2010) Figure 11: Race and Ethnicity in PSA (2010) Figure 12: Low Income Households in PSA (2010) Figure 13: Zero Car Households in PSA (2010) Figure 14: Population Under 18 Years in PSA (2010) Figure 15: Population Over 65 Years in PSA (2010) Figure 16: Metro Rail and Bus Service in Downtown Los Angeles Figure 17: DASH Service in Downtown Los Angeles Figure 18: Evaluation Process Figure 19: Initial Screening Alternatives Figure 20: Segment A: North of 5 th Street Figure 21: Alternative A Figure 22: Alternative A Figure 23: Alternative A Figure 24: Alternative A Figure 25: Alternative A Figure 26: Alternative A Figure 27: Alternative A Figure 28: Segment B: Between 5 th Street and 9 th Street Figure 29: Alternative B Figure 30: Alternative B Figure 31: Segment C: South of 9 th Street Figure 32: Alternative C Figure 33: Alternative C Figure 34: Alternative C Figure 35: Alternatives Advanced from Initial Screening Figure 36: Changes to Alternatives Prior to Final Screening Figure 37: Final Screening Alternatives iv
7 Figures (Continued) Figure 38: Alternative Figure 39: Alternative Figure 40: Alternative Figure 41: Alternative Figure 42: Alternative Figure 43: Alternative Figure 44: Alternative Figure 45: Surface Parking and Vacant Lots (Alternatives 1, 3, and 5) Figure 46: Surface Parking and Vacant Lots (Alternatives 2, 4, 6, and 7) Figure 47: Final Screening/LPA Recommendation v
8 ACRONYMS AA ACE ADA AVTA BID CEQA CRA/LA DASH FAR FTA GHG HRT LASED LPA LA LADOT LASI LRT Metro MSF MOCA NEPA OCTA O&M Project PSA SCAG SCC TIGER TOD Advanced Conceptual Engineering American with Disabilities Act Antelope Valley Transit Authority Downtown Center Business Improvement District California Environmental Quality Act Community Redevelopment Agency of the City of Los Angeles Downtown Area Short Hop Floor Area Ratio Federal Transit Administration Greenhouse Gas Heavy Rail Transit Los Angeles Sports and Entertainment District Locally Preferred Alternative Los Angeles Los Angeles Department of Transportation Los Angeles Streetcar, Inc. Light Rail Transit Los Angeles County Metropolitan Transportation Authority Maintenance and Storage Facility Museum of Contemporary Art National Environmental Protection Act Orange County Transportation Authority Operations and Maintenance Restoration of Historic Streetcar Service Project Project Study Area Southern California Association of Governments Standard Cost Category Transportation Investment Generating Economic Recovery Transit-Oriented Development vi 1/11/2012
9 1.0 PURPOSE AND NEED 1.1 Introduction This (AA) presents the development and evaluation of alternatives under consideration for the Restoration of Historic Streetcar Service Project (project). The alternatives were screened based on defined criteria to identify a Locally Preferred Alternative (LPA). This AA provides decision-makers the information needed to approve further investigation, including environmental documentation that would be in compliance with the National Environmental Policy Act (NEPA) and California Environmental Quality Act (CEQA). This section describes the Purpose and Need for the project in Downtown Los Angeles. The project was originated by the Community Redevelopment Agency of the City of Los Angeles (CRA/LA) and is being planned in partnership with the Los Angeles County Metropolitan Transportation Authority (Metro), Los Angeles Streetcar, Inc. (LASI), and the Federal Transit Administration (FTA). The project would reintroduce streetcar service to Downtown Los Angeles and would connect downtown neighborhoods and activity centers while tying together the regional transit network and aiding revitalization efforts. The project aims to address the challenges of navigating a disconnected downtown by providing a transportation link between various districts (Bunker Hill, Financial Core, Historic Core, Broadway, Jewelry District, South Park, Los Angeles Sports and Entertainment District, Civic Center, Chinatown, El Pueblo, and Union Station). By connecting residential and employment hubs, shopping districts, civic resources, cultural institutions, historic landmarks, and entertainment venues in Downtown Los Angeles, the project would increase mobility and accessibility for the people who live, work, and visit downtown. The project would provide better linkages to the regional transit network and connect with the Metro Red, Purple, Blue, Gold, and future Expo rail lines, Metro Rapid and Local bus service, as well as Amtrak, Metrolink, and other regional and intercity transit services. The project would promote transit use and walking within downtown while reducing the need to travel by automobile, decreasing greenhouse gas (GHG) emissions and oil consumption. In concert with local efforts, the project would play a pivotal role in the revitalization of many downtown districts, including the Historic Core. Local initiatives such as Bringing Back Broadway (an effort to restore Broadway, which contains the highest concentration of historic theaters in the western United States), redevelopment plans, street improvements, and proposed design guidelines would contribute to restoring the area s historic significance and stimulate economic development opportunities. Reintroducing streetcar service would facilitate the renewal of the Historic Core and Historic Broadway Theatre District. 1
10 1.1.1 Previous Planning Efforts The streetcar was formally reintroduced in planning efforts by the Community Redevelopment Agency of the City of Los Angeles (CRA/LA) in its study of the South Park district in Since then, there have been several studies and public workshops led by CRA/LA, the Bringing Back Broadway Initiative, and the non-profit Los Angeles Streetcar, Inc. (LASI) that have resulted in a number of proposed streetcar alternatives. The following provides a summary of past studies related to the restoration of streetcar service in Downtown Los Angeles. They range in relevance from the feasibility of restoring streetcar services, to design guidelines incorporating a streetcar into proposed street configuration, and traffic studies that analyze proposed street improvements. Feasibility Study for the Resurrection of the Red Car Trolley Services, 2006 This feasibility study explored the restoration of streetcar services using modern or heritage streetcars as part of an overall redevelopment strategy for the downtown area. It analyzed various alignment concepts and estimated travel times, ridership, and costs for each. The alignment concepts incorporated the best alternatives for providing urban circulator services for residents and tourists in Downtown Los Angeles. Broadway Streetcar Design Resource Book, 2008 The Design Resource Book provided a summary of streetscape design concepts developed from a public workshop in Downtown Los Angeles. It provided design guidance in written and graphic form for private and public projects undertaken around Broadway within the Historic Core. It aimed to promote an enhanced environment by improving pedestrian realms as well as the aesthetic and functional quality of Broadway. The Next Downtown Project Transportation Analysis, 2008 This traffic analysis studied the impact of the new Downtown Street Standards as it aims to provide for improved vehicular circulation and foster a pedestrian-friendly environment in the downtown area. The updated Central City Community Plan proposed street designations based on more comprehensive street hierarchy which balances traffic flow, pedestrian needs, transit routes and stops, bicycle routes, historic structures and other functions and elements of the street. The study year scenarios included existing (2008) conditions, 2030 with or without new street standards, 2030 with additional transit expansion, and 2030 with additional rail transit expansion and travel demand management scenarios. 2
11 Broadway Streetscape Plan Preliminary Traffic Study, 2010 This traffic study provided an initial assessment of the Broadway Streetscape Master Plan that examined the feasibility of implementing streetscape improvements along Broadway between 2 nd Street and Olympic Boulevard in Downtown Los Angeles. The Master Plan and this preliminary traffic study also identified Broadway as an alignment option for the proposed streetcar. This preliminary study outlined the existing and forecast traffic conditions in the designated project area with and without the proposed project for years 2009 and Table 1 provides a summary of the planning efforts that have developed specific streetcar alternatives. Table 1: Previous Planning Efforts Planning Effort Recommendations 2006, Feasibility Study for the Resurrection of the Red 5 streetcar concepts Car Trolley Services 2008, Broadway Streetcar Workshop 6 streetcar alternatives (specific to Broadway) 2009, 7 Stakeholder Meetings 3 streetcar options 2010, Los Angeles Streetcar, Inc. Options 2 streetcar options Source: Metro,

12 1.2 Project Study Area Description Project Study Area Overview The project study area (PSA) is located within Downtown Los Angeles (Figure 1) and is bounded by the Harbor Freeway (SR-110) on the west, Washington Boulevard on the south, Alameda and Los Angeles Streets on the east, Cesar E. Chavez Boulevard on the north with a narrow extension into Chinatown stretching along New High and Alameda Streets just north of College Avenue. The PSA encompasses the following neighborhoods/districts: Bunker Hill, Financial Core, Historic Core, Broadway, Jewelry District, South Park, Los Angeles Sports and Entertainment District (LASED), Civic Center, Chinatown, El Pueblo, and Union Station. The PSA was historically the core of Los Angeles streetcar network that spanned 600 miles during the first half of the 1900s. Despite its expansive coverage, streetcar service was discontinued in Most of the tracks from this extensive streetcar system are still embedded in downtown streets and many of the overhead span wire connections are still found on historic buildings. These historic streetcar alignments within the PSA are being analyzed for the restoration of the proposed streetcar routes. Figure 2 shows a map of historic streetcar service in the PSA. 4

13 Figure 1: Project Study Area Source: Metro,


14 Figure 2: Historic Streetcar Service in PSA Source: Metro,
15 1.2.2 Characteristics of PSA The PSA is a dense urban core covering 2.05 square miles that is home to the region s fastest growing residential area of over 45,000 residents 1, the region s largest employment center of over 500,000 employees 2, and one of the region s largest tourist destinations with over 10 million annual visitors 3. The PSA is also home to many of the region s historic and cultural attractions, such as Bunker Hill (Disney Concert Hall, Museum of Contemporary Art, and future Broad Museum), Broadway (historic theaters and architecture), and Los Angeles Sports and Entertainment District (Staples Center, Nokia Theater, Convention Center, LA Live, Grammy Museum, and potential football stadium). The PSA is a regional hub for transit service, with the highest volumes of boardings/alightings in the Metro rail and bus system as well as connections to Metrolink, Amtrak, and other regional and intercity transportation. Table 2 describes the general characteristics of the districts within the PSA, while Figure 3 shows the activity centers and districts within the PSA Downtown Los Angeles Demographic Study, Downtown Center Business Improvement District (BID) Downtown Los Angeles Demographic Study, Downtown Center BID Downtown Los Angeles Demographic Study, Downtown Center BID 7
16 Table 2: Districts in PSA District Bunker Hill Civic Center Financial Core Historic Core Jewelry District Fashion District South Park Los Angeles Sports and Entertainment District (LASED) Description The Bunker Hill District is located generally between 1 st St on the north, Hill St on the east, 4 th St on the south, and Figueroa St on the west. Major downtown destinations located within Bunker Hill include the Walt Disney Concert Hall, Museum of Contemporary Art, the future Broad Museum, and several high-rise office towers, senior and market-rate housing, hotels and commercial/retail centers. Bordering Bunker Hill to the northeast is the Civic Center, which serves as a hub for City, County, State, and Federal government with the second-largest concentration of civic buildings in the country. The Cathedral of Our Lady of the Angels, the Ahmanson Theater, Mark Taper Forum, and the Dorothy Chandler Pavilion are also destinations in this district. The Financial Core District is located south of Bunker Hill and is dominated by high-rise office buildings. Other landmarks in this district include the Central Library, the Millennium Biltmore Hotel, and Pershing Square. To the east of the Financial Core is the Historic Core District, which contains a large concentration of historic buildings. The Grand Central Market and the Broadway Historic Theater District (with theaters dating back to the early 1900s) are destinations in this district. The retail district is reliant on public transit because parking is in short supply. The Jewelry District, located to the southwest of the Historic Core, is the largest jewelry district in the country and second largest in the world according to the Los Angeles Convention and Visitor Bureau. Like the Historic Core, the district attracts a high volume of retail sales and parking is in short supply. The Fashion District lies to the south of 7 th St and to the east of Broadway and is a popular retail destination. The core shopping district is bounded by 9 th St, Los Angeles St, Pico Blvd, and Stanford Ave. South Park is located south of the Financial Core and includes the Los Angeles Convention Center, Staples Center, LA Live, and a variety of warehouses, office space, and residences. It also includes a growing number of neighborhood supporting commercial and retail uses such as a supermarket, restaurants, and coffee shops. Located within South Park, the LASED is a district with its own specific plan by the same name under the City of Los Angeles General Plan. The district consists of Staples Center (capacity 19,000, home to two NBA teams, one WNBA team, and one NHL team), Nokia Theater (capacity 7,100), Los Angeles Convention Center (720,000 sq. ft.), LA Live, Club Nokia, Grammy Museum, and a potential football stadium (proposed capacity 72,000). Currently, the Staples Center hosts over 250 events per year, while Nokia Theater hosts over 120 events per year. 8
17 Figure 3: Activity Centers and Districts in PSA 9
18 1.2.2 Land Use in PSA As the largest employment center in Los Angeles County, the PSA is comprised primarily of commercial land uses, with numerous office buildings and retail shops. In recent years there has been an increasing amount of residential and mixed uses over the past decade (especially in South Park and the Historic Core), with 9,391 units of housing having been built within downtown since 2000 (an increase of 89 percent), and an additional 11,831 units are in planning (permitted, undergoing the approval process, or under consideration) 4. The PSA also has a substantial number of historic buildings. Some of these buildings have been restored; however, many remain vacant or abandoned totaling over one million square feet of unused commercial and residential space 5. Surface parking lots are also prevalent in the PSA, though these lots are often in poor condition and contribute to blight. Figures 4 through 8 show land use, historically significant buildings, surface parking, development since 2000, and planned development in the PSA, respectively. 4 Downtown Center Business Improvement District 5 Bringing Back Broadway 10


19 Restoration of Historic Streetcar Service in Downtown Los Angeles Figure 4: Land Use in PSA Source: Los Angeles County Assessor,

20 Restoration of Historic Streetcar Service in Downtown Los Angeles Figure 5: Historically Significant Buildings in PSA Source: Los Angeles County Assessor,

21 Figure 6: Surface Parking in PSA Source: Los Angeles County Assessor,
22 Restoration of Historic Streetcar Service in Downtown Los Angeles Figure 7: Development Since 2000 in PSA Source: Downtown Center Business Improvement District,
23 Restoration of Historic Streetcar Service in Downtown Los Angeles Figure 8: Planned Development in PSA Source: Downtown Center Business Improvement District,
24 1.2.3 Demographics in PSA According to the 2010 Census data, the total population of the PSA is 25,269, an increase of 3,890 (18 percent) since the 2000 Census. According to the Southern California of Governments (SCAG) 2010 forecast, the total population of the PSA is 20,981, a total that is significantly lower than both 2000 and 2010 Census data. However, the SCAG 2010 forecast is the basis for population and employment projections in the region and so it is used as a conservative estimate to be consistent with regional estimates and forecast data. The SCAG 2010 estimate for total employment in the PSA is 183,488, which is approximately 4 percent of Los Angeles County s employment. It is worth noting that these employment estimates are likely low as well, given that the PSA encompasses most of Downtown Los Angeles, which has 500,000 workers according to the Downtown Center Business Improvement District (BID). However, it should be noted that the Downtown Center BID employment estimate includes the area between Los Angeles Street and the Los Angeles River, which is outside of the PSA. Table 3 summarizes the PSA and Los Angeles County population and employment information for 2010 according to SCAG. Figures 9 and 10 illustrate the PSA s existing population and employment distribution. Table 3: Population and Employment in PSA and Los Angeles County Demographics PSA Los Angeles County PSA Percent of County Population 20,981 10,610, % Employment 183,488 4,549, % Source: SCAG 2010 Projections. The PSA is a very diverse community, as shown by the existing race and ethnicity distribution in Table 4. According to 2010 Census data, Asian (30 percent), White (28 percent), and Hispanic (24 percent) make up the largest percentage of the population in the PSA. Figure 11 illustrates the population s race and ethnicity distribution in the PSA. Table 4: Race and Ethnicity in PSA Race/Ethnicity PSA Percent Total Population 25, % Asian 7, % White 7, % Hispanic 6, % Black 3, % Native American % Hawaiian or Pacific Islander % Other % Two or more races % Source: 2010 Census. 16
 Source: 2010 Census.")
25 Figure 9: Population in PSA (2010) Source: 2010 Census. 17
 Source: SCAG 2010")
26 Figure 10: Employment in PSA (2010) Source: SCAG 2010 Projections. 18
 Source: 2010 Census.")
27 Figure 11: Race and Ethnicity in PSA (2010) Source: 2010 Census. 19
28 The PSA includes a large transit-dependent population of low income households, zero car households, and population over 65 years. According to SCAG, there are 7,278 low income households in the PSA, while the 2008 Downtown Demographic Study by the Downtown Center Business Improvement District (BID) estimates that downtown is home to over 10,000 units of below market rate affordable housing. Many of the PSA's residents are youth or elderly, with 1,762 age 18 years and younger and 4,111 age 65 years and over. These statistics are indicative of an increased dependence on public transit, since low income households, youth, and elderly populations are less likely to be able to own and operate one or multiple automobiles due to physical, financial, or legal limitations. The American Community Survey indicates that approximately 2,075 households in the PSA have no car and rely exclusively on public transit. Table 5 shows the demographics of potential transit users in the PSA. Figures 12 through 15 show low income households, zero car households, population under 18 years, and population over 65 years in the PSA, respectively. Table 5: Demographics of Potential Transit Users in PSA Demographic Total Percent Population 20, % Low income households 7, % Zero car households 1 2, % Under 18 years 1, % Over 65 years 4, % Source: SCAG 2010 Projections, except 1 American Community Survey ( ). 20
 Source: SCAG 2010 Projections.")
29 Figure 12: Low Income Households in PSA (2010) Source: SCAG 2010 Projections. 21
.")
30 Figure 13: Zero Car Households in PSA (2010) Source: American Community Survey ( ). 22
31 Figure 14: Population Under 18 Years in PSA (2010) Source: SCAG 2010 Projections. 23
 Source: SCAG 2010 Projections.")
32 Figure 15: Population Over 65 Years in PSA (2010) Source: SCAG 2010 Projections. 24
33 1.2.4 Transit Service and Facilities in the PSA The PSA has the highest concentration of transit service of any area in Los Angeles County. At present, ten transit operators provide service within the PSA with the bulk of service provided by Metro. These operators are: Antelope Valley Transit Authority (AVTA) City of Gardena (Gardena Municipal Bus Lines) City of Santa Clarita Transit City of Santa Monica (Big Blue Bus) Foothill Transit City of Los Angeles Department of Transportation (LADOT) Los Angeles County Metropolitan Transportation Authority (Metro) City of Montebello (Montebello Bus Lines) Orange County Transportation Authority (OCTA) City of Torrance (Torrance Transit) With the exception of Metro, LADOT, Montebello Bus Lines, and Gardena Municipal Bus Lines, these transit operators run mostly peak commute hour, peak-direction commuter bus service in and out of the PSA. LADOT provides frequent Downtown Area Short Hop (DASH) service along short, mostly circular shuttle routes within the downtown area. In addition to public transit services, several high-rise office tenants within the PSA offer private shuttle bus service for their employees. Metro This section describes Metro rail and bus service in Downtown Los Angeles, as shown in Figure 16. Metro provides rail service with the Red Line from Union Station to North Hollywood, the Purple Line from Union Station to Wilshire Center, the Blue Line from the 7 th Street/Metro Center to Long Beach, and the Gold Line from Union Station to Pasadena and East Los Angeles. There are seven Metro rail stations located within the PSA. The Red and Purple Line stations are Union Station, Civic Center (Hill Street between Temple Street and 1 st Street), Pershing Square (Hill Street between 4 th Street and 5 th Street), and 7 th Street/Metro Center (7 th Street between Figueroa Street and Hope Street). The 7 th Street/Metro Center Station serves as a transfer point to the Blue Line, which includes stations at Pico (Flower Street between Pico Boulevard and 12 th Street) and Grand (Washington Boulevard between Flower Street and Grand Avenue). Union Station and Chinatown are served by the Gold Line. 25


34 Restoration of Historic Streetcar Service in Downtown Los Angeles Figure 16: Metro Rail and Bus Service in Downtown Los Angeles Source: Metro,
35 By 2012, the Metro Expo Line will provide service from 7 th Street/Metro Center Station to Culver City. By 2019, the Regional Connector will provide a new seamless connection between 7 th Street/Metro Center Station and Union Station. The Regional Connector will add three new stations, two of which are in the PSA at 2 nd Street/Hope Street and 2 nd Street/Broadway. The Regional Connector will enable the Blue/Expo Lines to be interlined with the Gold Line and therefore eliminate the need for Gold, Blue, and Expo Line passengers to transfer to the Red and Purple Line at 7 th Street/Metro Center and Union Station to reach their final destination within the downtown area. Further expansions of Metro rail, such as the Westside extension, can be expected in the coming years as a part of the Measure R 30/10 Plan improvements, so transit ridership in Downtown Los Angeles will continue to increase. All Metro rail stations provide connections to additional public transportation options, including bus service provided by Metro and other transit operators as well as Metrolink and Amtrak rail services at Union Station. Table 6 summarizes existing and future Metro rail service in the PSA. Table 6: Metro Rail in PSA Existing Metro Rail Lines Line Mode Route Length Weekday Boardings Year Red/ HRT Union Station to North 17.4 miles 155, Purple Hollywood, Wilshire/Western Blue LRT 7 th St/Metro Center to Long 22 miles 79, Beach Gold LRT East Los Angeles to Sierra Madre Villa 13.6 miles 34, Future Metro Rail Lines Line Mode Route Length 2020 Weekday Boardings Year Expo LRT 7 th St/Metro Center to Culver 8.5 miles 43, (Phase I) City Regional Connector LRT 7 th St/Metro Center to Little Tokyo and Arts District 1.9 miles 42, Source: Metro, Existing Metro rail boardings/alightings by station in Downtown Los Angeles show that there are many short rail trips within the PSA. For example, the westbound Red/Purple Line has 20,851 daily boardings at Union Station. Of this amount, 1,443 alight at Civic Center, 3,022 alight at Pershing Square, and 9,491 alight at 7 th Street/Metro Center. This means that over half the passengers boarding at Union Station are either circulating within Downtown Los Angeles or connecting to other transit services, such as the Blue Line. Table 7 summarizes weekday ridership for Metro Rail stations in the PSA. 27
36 Table 7: Metro Rail Weekday Boardings/Alightings by Station in PSA Weekday (FY 2010) Station Boardings Alightings Red/Purple Eastbound 7 th /Metro Center 9,185 15,470 Pershing Square 3,439 7,434 Civic Center 1,657 4,749 Union Station 0 20,346 Westbound Union Station 20,851 0 Civic Center 4,565 1,443 Pershing Square 7,671 3,022 7 th /Metro Center 14,577 9,491 Subtotal 61,945 61,955 Blue Northbound Grand 1,685 3,501 Pico 849 1,730 7 th /Metro Center 0 15,016 Southbound 7 th /Metro Center 15,227 0 Pico 1, Grand 3,115 1,495 Subtotal 22,605 22,541 Gold Northbound Union Station 7,035 1,723 Chinatown Southbound Chinatown Union Station 1,917 7,156 Subtotal 10,174 9,997 Total 94,724 94,493 Source: Metro,
37 The majority of bus transit service in the PSA, as well as the Los Angeles region, is provided by Metro, which operates a number of short and long-distance radial lines, as well as crosstown service, express service, and even 24-hour Owl service on many routes. Metro s bus services vary considerably in speed and capacity. The most basic routes provide line-haul service to and from downtown along arterial streets. Heavily-traveled routes often have overlaid limited-stop or Metro Rapid bus service. Table 8 provides total weekday boardings/alightings at bus stops in the PSA as well as the total bus route ridership. Table 8: Metro Bus Weekday Boardings/Alightings at Bus Stops in PSA Bus Stops in PSA Route Route Description Boardings Alightings Ridership 2 Downtown LA - Pacific Palisades via Sunset Blvd 3,704 3,319 19,827 4 Downtown LA - West LA - Santa Monica via Santa Monica Blvd 2,624 2,811 19, Downtown LA - West LA via Temple St & Melrose Ave 2,601 2,660 12, Downtown LA - Beverly Hills via Beverly Blvd 3,073 3,041 19, Downtown LA - Century City via 3 rd St 3,575 3,927 25, Wilshire Center - Montebello via 6 th St & Whittier Blvd 4,121 4,548 24, Downtown LA - Santa Monica via Wilshire Blvd 1,653 1,433 16, Hollywood - Downtown LA - Compton - Artesia Transit Center via Avalon Blvd 4,222 4,634 28, Downtown LA - Century City via West Olympic Blvd 1,330 1,480 8, Pico/Rimpau - Downtown LA - Indiana Station via Pico Blvd & East 1 st St 4,148 3,868 12, Downtown LA - Santa Monica via Venice Blvd 1,480 1,351 11, Downtown LA - Fairfax/Washington via Washington Blvd 1,540 1,636 7, th /Broadway - Washington/Fairfax via W Jefferson Blvd , Downtown LA - LAX -South Bay Galleria via King - La Tijera - Hawthorne 4,977 4,843 23, Lincoln Heights - Rosewood via Broadway 8,514 8,142 21, CSU Dominguez Hills via Central 2,017 1,838 13, Downtown LA - Imperial/Wilmington Station via Compton Ave 2,025 2,026 9, Downtown LA - Artesia Station via Long Beach Blvd 4,256 3,726 16, Downtown LA - Hawaiian Gardens via Telegraph Rd , Wilshire Center - Downtown LA - Montebello via 8 th & Olympic Blvd 3,375 3,467 19, Downtown LA - El Monte via Garvey Ave 2,654 2,449 12, Downtown LA Cal State LA via Wabash Av & City Terrace Dr , El Monte - Downtown LA via Valley Blvd 2,312 2,379 11,095 Source: Metro,
38 Table 8 (Continued): Metro Bus Weekday Boardings/Alightings at Bus Stops in PSA Bus Stops in PSA Route Route Description Boardings Alightings Ridership 78 Downtown LA - Arcadia via Las Tunas Dr & Huntington Dr 2,732 2,514 11, Eagle Rock - Downtown LA - Harbor Freeway Station via Figueroa 3,586 3,801 16, Downtown LA - Eagle Rock via York Blvd - Pasadena Ave 1,612 1,351 4, Eagle Rock - Downtown LA Montebello via Eagle Rock Blvd & Cesar E Chavez Ave 1,510 1,684 9, Downtown LA - Sunland via Glendale Ave, Foothill Blvd 1,258 1,185 5, Downtown LA to Burbank Station via Glenoaks Blvd, Brand Blvd, Glendale Blvd 903 1,001 5, Downtown LA - Sun Valley via San Fernando Rd 1,448 1,203 6, Downtown LA - Sherman Oaks via Riverside Dr, LA Zoo , Downtown LA - Culver City Transit Center via I-10 Freeway Downtown LA - Hawthorne Station via Manchester B San Pedro - Union Station via Pacific Ave, 1 st St, Harbor Beacon Park Ride Lot & Harbor Transitway , Artesia Transit Center - Downtown LA via Harbor Transitway Downtown LA - Disneyland via Harbor Transitway & I-105 Freeway , Altadena - Downtown LA via Lake Av & El Monte Busway , Downtown LA - Sierra Madre Villa Station - El Monte Station , Glendale Galleria - Grand Station via Hoover St, Rampart Blvd & San Fernando Rd , Downtown LA - Santa Monica via Santa Monica Blvd , Santa Monica - Commerce via Wilshire Blvd & Whittier Blvd 3,861 4,171 39, Downtown LA - Century City via Olympic Blvd 1,335 1,597 7, Downtown LA - Pico Rimpau via Pico Blvd 1,176 1,271 4, Downtown LA - Santa Monica via Venice Blvd 1,563 1,764 12, South Bay Galleria - Downtown LA via Hawthorne Blvd, Crenshaw Blvd & M.L. King Blvd 1,626 1,799 8, Downtown LA - Harbor Freeway Station via Broadway 2,593 3,152 7, Downtown LA - Artesia Station via Long Beach Blvd 1,463 1,541 8, Downtown LA - El Monte via Cesar E. Chavez Ave & Garvey Ave 1,495 1,448 8, Downtown LA - Sylmar Station via San Fernando Rd, Brand Blvd , Silver Line 2,570 2,838 8,049 Total 101, , ,479 Source: Metro,
39 LADOT The Los Angeles Department of Transportation (LADOT) provides Downtown Area Short Hop (DASH) bus service. Downtown DASH includes five local circulation routes connecting the PSA with Little Tokyo, Chinatown, the Fashion District, and the University of Southern California (Figure 17). Fares are lower than Metro ($0.50 for DASH vs. $1.50 for Metro) and frequencies are high (approximately every 5-10 minutes). Service hours are 6a.m. to 7p.m., Monday through Friday, and some limited service on weekends. Table 9 provides a summary of DASH ridership in Downtown Los Angeles, which attracted over 22,000 daily boardings in Table 9: Downtown DASH Weekday Boardings Source: LADOT, DASH Route Weekday Boardings (2011) A 3,886 B 3,525 D 4,081 E 7,352 F 3,306 Total 22,150 31


40 Figure 17: DASH Service in Downtown Los Angeles Source: LADOT,
41 Intercity and Commuter Rail Intercity and commuter rail service to Downtown Los Angeles are provided by Metrolink and Amtrak, with connections to Metro rail service at Union Station. Most passengers arriving at Union Station on Metrolink are bound for downtown and presently use the Metro Red and Purple Lines, Metro buses, DASH buses, or employer-provided shuttles to complete their trips. Metrolink serves the counties of Los Angeles, Orange, Riverside, San Bernardino, San Diego, and Ventura and six lines serve Union Station. Average weekday ridership on Metrolink trains through the third quarter of FY 2011 was 41,739 with 13,796 boardings at Union Station (the most systemwide) 6. Amtrak serves Union Station with its regional Pacific Surfliner train and long distance Coast Starlight, Texas Eagle, Sunset Limited, and Southwest Chief trains, as well as its intercity buses. The Pacific Surfliner was Amtrak s second-busiest line in 2010 with an average daily ridership of approximately 7,200, connecting Los Angeles with major destinations in Southern and Central California such as San Diego, Santa Barbara, and San Luis Obispo with 11 daily trains in each direction 7. Average daily Amtrak boardings in Union Station were approximately 4,200 in 2010 for all Amtrak routes serving Union Station, the most of any station in California and the fifth largest nationwide 8. Union Station will grow as an intercity rail hub as a result of the California High Speed Rail project. The first phase to link San Francisco and Los Angeles is projected to open by 2020, while extensions to Sacramento, San Diego, and Las Vegas could follow. High speed rail ridership at Union Station is expected to exceed 14,000 daily boardings by Transit Mode Share The transit mode share for commute trips in downtown is available from the 2011 Downtown Los Angeles Demographic Study by the Downtown Center Business Improvement District (BID). According to the study, which is a survey of downtown residents, employees, and visitors, approximately 20 percent of employees commuted by Metro rail, 15 percent commuted by Metro bus or other public bus, 7 percent commuted by DASH, and 6.5 percent commuted by Metrolink and Amtrak 10. Table 9 provides the survey results of the mode share for commute trips. 6 Metrolink May 2011 Ridership Report 7 Pacific Surfliner 2010 Ridership Report 8 Amtrak California Fact Sheet California High Speed Rail 2010 Business Plan Downtown Los Angeles Demographic Study, Downtown Center Business Improvement District (BID) 33
42 Table 9: Mode Share for Commute Trips Residence Live and Work Total Downtown LA LA County Downtown Resident 10,742 4,464 6,278 2,439 Metro rail 19.7% 15.6% 22.6% 14.0% Metro bus/other bus 15.3% 11.7% 17.9% 10.8% DASH 7.1% 10.5% 4.6% 14.2% Metrolink/Amtrak 6.5% 3.6% 8.6% 3.4% Alone by car 60.4% 54.5% 64.6% 41.0% Carpool 8.5% 6.0% 10.4% 4.9% Shuttle/vanpool 1.2% 0.9% 1.3% 1.2% Walk 15.4% 31.4% 4.1% 49.3% Bicycle 5.1% 8.3% 2.8% 10.3% Other 2.4% 2.6% 2.2% 2.4% Do not commute/work 7.9% 14.0% 3.5% 15.5% Source: 2011 Downtown Los Angeles Demographic Study, Downtown Center Business Improvement District (BID) The forecast transit mode share in downtown was obtained from the Metro Regional Connector New Starts submittal 11. By 2035, there are projected to be approximately 278,500 auto vehicle trips and 71,100 transit trips in downtown, which equals an auto/transit mode split of 80/20 percent. However, this mode share changes when considering home-based work peak (trips from home to work during peak hours). By 2035, there are projected to be approximately 36,000 auto vehicle trips and 32,500 transit trips in downtown, which equals an auto/transit mode split of 53/47 percent. 11 Metro,
43 1.2.5 Traffic Conditions in PSA This section summarizes traffic conditions within the PSA. The PSA is surrounded by freeways, including SR-110 on the west, US-101 on the north, and I-10 on the south. Key freeway access points are provided by 3 rd Street, 4 th Street, 5 th Street, 6 th Street, 8 th Street, Hope Street, Main Street, and Los Angeles Street. These freeway access points are supplemented by other roadways streets in the downtown street network, including Figueroa Street, Flower Street, Grand Avenue, Olive Street, Hill Street, Broadway, Spring Street, Temple Street, 1 st Street, 7 th Street, 9 th Street, Olympic Boulevard, and Pico Boulevard. The PSA also includes a bus and right turn only lane on Figueroa Street and a shared peak hour travel lane/off peak parking lane on Hill Street. LADOT does not have current traffic data for intersections within the PSA. Therefore, existing traffic conditions were obtained from the Metro Regional Connector Draft Environmental Impact Statement/Environmental Impact Report (EIS/EIR) 12. However, the Regional Connector PSA does not include traffic conditions south of 8 th Street so two other sources were included for these locations; the Broadway Streetscape Plan Traffic Study 13 and the 1340 S. Figueroa Traffic Impact Study 14. Together, these three studies include AM peak and PM peak traffic conditions at key intersections within the PSA. For intersections, the AM and PM peak hour volumes were analyzed using Level of Service (LOS). LOS is a qualitative measure used to describe traffic flow conditions, ranging from excellent flow (LOS A) to overloaded, stop-and-go conditions (LOS F). Table 10 summarizes the existing operating conditions for the key intersections in the PSA. 12 Metro, IBI, Crain and Associates,
44 Table 10: Traffic Conditions at Intersections in PSA AM Peak PM Peak Intersection LOS Delay LOS Delay Grand Ave / 1st St C 24.9 C 27.6 Hill St / 1st St B 16.6 C 27.8 Broadway / 1st St B 15.3 B 16.1 Spring St / 1st St B 14.2 B 11.5 Main St / 1st St B 11.7 C 21.4 Los Angeles St / 1st St B 11.7 B 17.6 Judge John Aliso St / 1st St A 8.8 B 13.6 Central Ave / 1st St A 5.5 A 8.8 Alameda St / 1st St B 17.1 C 28.8 Figueroa St / 2nd St B 19.8 C 30.4 Grand Ave / 2nd St B 10.3 B 13.1 Hill St / 2nd St B 13.5 B 11.8 Broadway / 2nd St B 14.5 B 15.5 Spring St / 2nd St B 15.3 B 12 Main St / 2nd St B 10.4 B 16.8 Los Angeles St / 2nd St B 11.4 B 18.5 San Pedro St / 2nd St B 11.3 B 13.6 Central Ave / 2nd St A 7.4 A 8.3 Alameda St /2nd St B 10.2 B 13.8 Figueroa St / 3rd St C 27.9 D 45 Flower St / 3rd St B 19.3 B 10.4 Grand Ave / 3rd St A 6.7 A 9.8 Hill St / 3rd St B 18.3 B 18.7 Broadway / 3rd St C 23.9 B 18.1 Spring St / 3rd St C 22.3 B 13.7 Main St / 3rd St B 13.6 B 15.7 Los Angeles St / 3rd St B 14.2 B 15.1 San Pedro St / 3rd St A 10 A 9 Central Ave / 3rd St B 12.1 B 11.5 Alameda St / 3rd St C 21.6 B 12.9 Figueroa St / 4th St B 13.2 B 13.3 Flower St / 4th St C 20.3 D 44.6 Grand Ave / 4th St A 2.7 A 4.4 Figueroa St / 5th St B 12.8 C 25.4 Flower St / 5th St B 13.9 B 16.6 Grand Ave / 5th St B 14.7 C 24.3 Olive St / 5th St B 15.4 B 17.7 Figueroa St / 6th St C 30.8 D 43.6 Flower St / 6th St B 14.8 B 19 Source: 1 Regional Connector Draft EIS/EIR, Metro, 2010; 2 Broadway Streetscape Plan Traffic Study, IBI, 2010; S. Figueroa Traffic Impact Study, Crain and Associates,
45 Table 10 (Continued): Traffic Conditions at Intersections in PSA AM Peak PM Peak Intersection LOS Delay LOS Delay Hope St / 6th St A 6 B 10.7 Grand Ave / 6th St B 13 B 15.2 Olive St / 6th St B 12.6 C 20 Figueroa St / Wilshire Blvd C 21.3 F Flower St / Wilshire Blvd B 14.5 C 22.4 Figueroa St / 7th St B 19.3 C 27.4 Flower St / 7th St A 8.9 B 19.8 Hope St / 7th St A 7.7 B 10.5 Grand Ave / 7th St B 12.9 B 17.9 Olive St / 7th St B 12 B 16.1 Figueroa St / 8th St B 13.5 C 20.5 Flower St / 8th St A 9.4 B 18.8 Hope St / Temple St C 23.6 C 30.6 Grand Ave / Temple St C 29.8 D 38.4 Hill St / Temple St B 17.6 C 33.1 Broadway / Temple St C 20.3 C 21.8 Spring St / Temple St B 14.5 B 12.8 Main St / Temple St A 8.8 B 19.5 Los Angeles St / Temple St B 12.5 B 14.7 Judge John Aiso St / Temple St A 7.5 A 9.7 Alameda St / Temple St C 22.8 C 34.4 Los Angeles St / Aliso St B 11.1 B 15.8 Alameda St / Aliso St C 20.1 C 24 Los Angeles St / Arcadia St B 11.7 B 12.3 Alameda St / Arcadia St C 22.9 B 15.8 Alameda St / N Los Angeles St B 13.3 B 10.5 Alameda St / S Los Angeles St A 4.4 B 10.6 Dewap Rd. / 1st St A 2.7 B 12.1 Olive St / 1st St B 11.7 B 17.8 Hope St / 1st St D 35.8 C 25.6 S. Hope St / 2nd St A 7 B 12.2 S. Hope St / General Thaddeus B 15.1 B 17.7 Kosciuszko Way Broadway / Arcadia St A 9.7 B 12.6 Spring St / Arcadia St B 12.5 A 9 Main St / Arcadia St A 8.1 B 11.3 Broadway / Aliso St B 12.8 B 11.5 Spring St / Aliso St A 9.1 A 9.7 Main St / Aliso St A 5.9 B 11.6 Hill St / 4th St B 11.5 B 17 Source: 1 Regional Connector Draft EIS/EIR, Metro, 2010; 2 Broadway Streetscape Plan Traffic Study, IBI, 2010; S. Figueroa Traffic Impact Study, Crain and Associates,
46 Table 10 (Continued): Traffic Conditions at Intersections in PSA AM Peak PM Peak Intersection LOS Delay LOS Delay Olive St / 4th St B 14.2 C 24.2 Broadway / 4th St A 9.1 B 15 Spring St / 4th St A 9.9 B 14.9 Main St / 4th St A 7.2 C 20.3 Los Angeles St / 4th St A 7.9 B 19.2 San Pedro St / 4th St A 6.3 B 11.4 Central Ave / 4th St A 7.3 B 14.3 Alameda St / 4th St A 8.3 C Hill St / 9 th St A n/a A n/a Hill St / Olympic A n/a A n/a Hill St / 11 th St A n/a A n/a Broadway / 9 th St A n/a A n/a Broadway / Olympic A n/a A n/a Broadway / 11 th St A n/a A n/a Spring St and Main St / 9 th St A n/a A n/a Main St / Olympic A n/a A n/a Main St / 11 th St A n/a A n/a Figueroa St / Olympic Blvd A n/a A n/a Figueroa St / Pico Blvd B n/a A n/a Figueroa St / Venice Blvd B n/a A n/a Figueroa St / 18 th St A n/a A n/a Figueroa St / Washington Blvd C n/a B n/a Flower St / Olympic Blvd A n/a A n/a Flower St / Pico Blvd A n/a B n/a Flower St / Venice Blvd A n/a A n/a Grand Ave / Venice Blvd A n/a A n/a Source: 1 Regional Connector Draft EIS/EIR, Metro, 2010; 2 Broadway Streetscape Plan Traffic Study, IBI, 2010; S. Figueroa Traffic Impact Study, Crain and Associates,
47 1.3 Statement of Need This section describes the existing problems/deficiencies within the PSA to demonstrate the need for the project. In evaluating the activity centers, districts, characteristics, demographics, and travel conditions within the PSA, several themes emerge which reinforce the need for the project. The following themes describe the need for the project in Downtown Los Angeles: Geographically disconnected pedestrian network Lack of local short-trip transit service Increased transit demand from development, population, household, and employment growth Traffic congestion and parking demand Underutilized land and historic buildings Geographically Disconnected Pedestrian Network There is a geographic disconnect between many of the activity centers and districts within Downtown Los Angeles due to its size, topography, and street grid, inhibiting pedestrian circulation. The PSA is very large and extends approximately three miles from the Los Angeles Convention Center on the southwestern end to Union Station and Chinatown on the northeastern end, with various commercial, residential, and entertainment nodes in between. Topography also poses a challenge: Bunker Hill, which is the commercial core of Downtown, rises feet above the surrounding areas, creating steep grades (15-30 percent) for pedestrian navigation. The street grid similarly impedes pedestrian circulation; blocks are fairly large (600 by 350 feet, on average, compared to 300 by 300 feet in Downtown San Francisco and 225 by 225 feet in Downtown Portland), interruptions in the grid network are commonplace, and sidewalk quality is often poor. Furthermore, temperatures typically exceed 75 degrees for eight months of the year, and shade can be difficult to find in some locations. The combination of these geographic factors means that many internal downtown trips exceed a comfortable walking distance of a quarter/half mile, inhibiting pedestrian circulation from South Park to Grand Central Market (1.2 miles), Bunker Hill to the Jewelry District (0.6 miles, 14 percent grade), or the Metro Pershing Square Station to the Orpheum Theater (0.6 miles), and thereby creating voids of investment and activity Lack of Local Short-Trip Transit Service While there is an abundance of transit service in Downtown Los Angeles, it serves travel markets with generally longer commute-based trips with varying service hours and frequency. There is no surface transit option that is geared towards short trips with a high quality service 39
48 that includes a full span of service, high frequency, large passenger capacity, simple route structure, and level boarding. Metro provides transit service downtown, but this service is a complex network of dozens of regional lines that make local circulation difficult to navigate. No single line ties together downtown s major activity centers; so taking Metro can be more difficult than walking. For example, to travel from Bunker Hill to the historic downtown core around 6 th Street and Broadway is approximately three quarters of a mile, yet taking the bus takes the same amount of time as walking due to lack of direct service. Moreover, at $1.50 per trip, Metro rail and bus fares are high enough that they discourage short trips. As a result, the use of the Metro rail and local bus system is challenging for downtown circulation, especially for novice transit users. DASH is better utilized for local downtown trips, yet it still provides an incomplete transit circulation service to the PSA. DASH is not an optimal downtown circulator due to its complicated network of meandering routes, low stop visibility, non-level boarding, poor service of South Park and Broadway, and truncated service hours (6a.m.-7p.m., limited weekend service). Furthermore, no single DASH line connects South Park and Bunker Hill. Like Metro, DASH has a broader service focus of providing connections between the PSA and surrounding districts, rather than circulation within the PSA. A more developed local transit circulation network is needed to complement DASH and provide an intuitive, user-friendly, one seat ride between major downtown destinations Increased Transit Demand from Development, Population, Household, and Employment Growth Over the past decade Downtown Los Angeles has experienced significant new development and population growth, placing an increased strain on its transportation system. Since 2000, 9,391 housing units have been constructed in the PSA (89 percent increase), as well as other major nonresidential projects such as LA Live. There are presently 11,831 additional housing units 15 in planning along with numerous retail and commercial developments, suggesting considerable future growth and development. In addition, the population of the PSA is projected to grow over 10 percent and employment is projected to grow over 6 percent by 2035 based on estimates by SCAG. Transit dependent populations, such as elderly and low income populations, are also expected to increase by 34 percent and 18 percent, respectively, by This growth in development, population, and employment will increase trips within Downtown Los Angeles and place an increasing strain on the local transportation system, requiring expanded transit service. 15 Downtown Center Business Improvement District 40
49 1.3.4 Traffic Patterns and Parking Demand Due to the aforementioned problems with local pedestrian and transit circulation, many short trips in downtown are made by automobile. The high demand for parking compounds the mobility issues in parts of the PSA as on-street parking is difficult to find. This parking demand needs to be redistributed so that some users can park once and circulate throughout downtown using transit instead of making multiple short trips by automobile and parking in multiple on-street parking spaces. This approach compliments LADOT s parking strategy which is to better utilize existing on-street parking spaces in areas with less parking demand. Downtown parking is primarily concentrated in Bunker Hill and the Financial District and is not evenly distributed. Parking problems are especially prevalent in older districts such as the Jewelry District and the Historic Core, which also have a shortage of off-street parking. Depending on the time of day and whether a special event is occurring, a lack of parking capacity exists on a larger scale around the Staples Center, Nokia Theater, and the Convention Center (where major events occur almost every day). The proposed football stadium and convention center expansion could further compound these issues. As a result, automobile traffic circulating throughout downtown in search of parking contributes to unnecessary vehicular trips. The lack of on-street parking in downtown has led to the prevalence of surface parking lots throughout downtown; a short term solution that comes at the expense of the overall vitality of the surrounding neighborhood and often contributes to blight. With substantial development in planning in geographically isolated districts such as South Park, traffic congestion and parking scarcity would likely increase without transit improvements to improve mobility and better utilization of downtown s parking resources Underutilized Land and Historic Buildings Despite considerable development and investment over the past decade, significant underutilized land and commercial space remains in the PSA, particularly along Broadway and in South Park. These areas are particularly geographically isolated from the primary employment centers of Bunker Hill and the Financial District, and have poor local transit circulation and connections to Metro rail. Over a million square feet of potential commercial and residential space is presently unused in historic buildings primarily on and around Broadway, while vacant lots are commonplace, especially in South Park. It is necessary to strengthen the connection between Broadway, South Park, and the major activity centers in downtown to better utilize transportation resources and revitalize neighborhoods, especially given local, regional, and state goals to reduce greenhouse gas (GHG) emissions through infill development and smart growth. 41
50 1.4 Statement of Purpose The purpose of the project is to connect residents, employees, and visitors to various services, employment centers, points of interest, and the regional transit network while serving as a catalyst for the revitalization of Downtown Los Angeles. This urban circulator service would link otherwise disconnected districts and increase opportunities for mobility within the downtown area as a convenience for residents, employees, and visitors. The project has two overarching goals which were generated during public workshops, meetings, and open houses and reflect input from public agencies, community groups, and stakeholders: 1. Enhance mobility and surface transit circulation in Downtown Los Angeles 2. Support the growth and revitalization of Downtown Los Angeles, including its historic districts Within these overarching goals are numerous objectives, as outlined below Enhance Mobility and Transit Circulation in Downtown Los Angeles Connect major districts, destinations, and activity centers Improve transit coverage and circulation Provide simple, localized, high frequency service Alleviate traffic and reduce parking demand Serve transit-dependent populations Improve transit accessibility Connect major districts, destinations, and activity centers The project would strengthen the connection between major districts, destinations, and activity centers within the PSA, fostering a more unified and cohesive downtown area. The project would enable easy, frequent, and convenient travel throughout the downtown area for residents, employees, and visitors. Improve transit coverage and circulation The project would improve transit coverage and circulation within the PSA, helping to complete the first/last mile of many trips and providing stronger intermodal connections to bus and rail, as well as to the pedestrian and bicycle network. In particular, the project would 42
51 help fill gaps in transit coverage in parts of South Park, the Jewelry District, the Historic Core, and Bunker Hill. By improving transit coverage, the project would enhance mobility, acting as a pedestrian accelerator to shorten long walking distances and reduce travel times within the PSA. The project would also serve cyclists by bridging gaps in the bicycle network since bicycles could be accommodated on board the vehicles. Provide simple, localized, high frequency service The project would provide a higher quality transit circulation service than what is currently available for travel within the PSA. As discussed earlier, transit service in downtown is primarily geared towards regional travel corridors or peak commuter service rather than local trips within downtown. The project would differ from current transit service by providing the following: Simple route structure: Project would provide a simple, user-friendly, intuitive route to provide a direct one seat connection between major downtown activity nodes. All-day high frequency service: Project would run approximately hours a day, 7 days a week at headways of 10 minutes or less, and requiring no schedule for travel. Intermodal connections: Project would maximize connections to Metro rail and bus service and complement existing DASH service. Higher vehicle capacity: Project would provide a larger passenger capacity than existing bus service, creating a more comfortable ride and accommodating higher load factors from special events. Low-floor vehicles: Project would have low floor vehicles compliant with the Americans with Disabilities Act (ADA) to facilitate rapid and accessible boardings and alightings. Proof of Payment and All-Door Boarding: Project would employ a proof of payment ticket system and all-door boarding to minimize stop dwell times and ensure easy use. Alleviate traffic and reduce parking demand By connecting activity centers, districts, and destinations in downtown, the project would reduce the need to travel by car for trips within the PSA. The project would help promote a park once strategy which would better utilize existing parking resources so people would no longer need to drive within the PSA for short trips. Expanding transit coverage and circulation within the PSA encourages people to take transit into the PSA, further reducing traffic and parking demand. Additionally, the project would help relieve parking pressures in parking deficient areas like the Historic Core, and for major events at the convention center, Staples Center, Nokia Theater, and potential football stadium by linking these activity centers with downtown parking garages to better utilize existing parking capacity. 43
52 Serve transit-dependent populations The project s expansion of transit service and coverage in downtown would improve mobility for transit-dependent populations. The PSA can be characterized as more transit dependent than Los Angeles County as a whole because of its dense population, proportionately low income levels, number of households with zero vehicles, and public transportation users. The project would enhance transit service downtown and therefore provide greater mobility to transit-dependent populations. Improve transit accessibility The project would use low floor and American with Disabilities Act (ADA) compliant vehicles with level boarding to improve service and mobility for seniors, disabled, families with children and strollers, and shoppers with heavy bags. The project could also accommodate bicycles on board the vehicles Support the Growth and Revitalization of Downtown Los Angeles, including its Historic Districts Restore historic streetcar service Revitalize geographically isolated, economically depressed areas Support smart, sustainable growth Foster a more livable downtown Encourage historic restoration and transit-oriented development Strengthen downtown s economic competitiveness Restore historic streetcar service The project would restore historic streetcar service to Downtown Los Angeles, reinstating a valuable cultural resource and attraction as well providing a new transit connection. Revitalize geographically isolated, economically depressed areas The project would help revitalize struggling neighborhoods by connecting them with a frequent, efficient, high quality transit service. By forging stronger physical connections between employment hubs, residential neighborhoods, arts and entertainment destinations, retail centers, and tourist attractions, the project would unify downtown into a unified destination rather than a series of fragmented areas. This connectivity would strengthen downtown s economic competitiveness and help reactivate economically depressed, geographically isolated neighborhoods. 44
53 Support smart, sustainable growth The project would support smart and sustainable growth in population and employment which meets local, regional, and state goals to reduce greenhouse gas (GHG) emissions and oil consumption. Currently there are 11,831 housing units in planning in downtown. The project would help ensure this growth is backed by an expansion in transit services to help reduce the GHG emissions and oil consumption which would otherwise occur from increased automobile use in the area. Foster a more livable downtown The project would help make downtown a more livable, attractive environment by increasing the frequency, reliability, connectivity, and accessibility of transit and providing a wider variety of transportation choices. The project would foster a more vibrant pedestrian environment and improve access to currently isolated neighborhoods. Encourage historic restoration and transit-oriented development The project would help foster a more attractive investment environment in Downtown Los Angeles to support transit oriented development (TOD) and the restoration of historic buildings. TOD is development characterized by a mixed-use, high density, and pedestrian friendly environment along the streetcar line. Presently there is over a million square feet of abandoned commercial and residential space in historic buildings in the PSA with no development or restoration plans in place, as well as significant underused land in the form of vacant lots and surface parking lots. The Los Angeles Streetcar Economic Impact Analysis (2010) prepared by AECOM for CRA/LA and LASI demonstrated that the permanence of a streetcar line and the enhanced mobility and connectivity it would bring would create a more attractive investment environment and lead to more TOD and building restoration over a no-streetcar scenario. The economic assessment found that a streetcar would support and induce: Development of nearly 675,000 square feet of new and rehabilitated office space, with construction costs valued at $210 million Development of 2,600 new housing units, with construction costs valued at $730 million, providing housing for 3,600 new residents 7,200 new construction jobs over the development period, with employee compensation of approximately $500 million 2,100 new permanent office, retail, entertainment, and hotel jobs with employee compensation of approximately $120 million annually by the end of the study period 5,800 new hotel room nights from new convention and business visitors 45
54 New retail, restaurant, hotel, and entertainment spending reaching up to $24.5 million annually over the course of the development period $47 million in cumulative City of Los Angeles tax revenues during the 25-year development period Strengthen downtown s economic competitiveness The project would strengthen downtown s economic competitiveness as a place to live and work. Economic competitiveness was evaluated in the economic impact analysis of the project relative to employment, labor, income, and value added. An economic impact analysis was completed as part of the project s TIGER (Transportation Investment Generating Economic Recovery) III application16. The Minnesota IMPLAN (IMpact analysis for PLANning) Group s input-output model was used to estimate the direct, indirect, and induced effects of the Los Angeles Streetcar, in terms of employment, labor income, and value added. The estimated spending on project engineering, construction, and vehicle procurement (capital expenditures) between 2012 and 2015 was used to compute short-term economic impacts, which are described below: The project is expected to generate 1,719 job-years during the project development phase The project is expected to create $143.5 million in value added, including $92.6 million in labor income The project is expected to create 718 cumulative job-years (42 percent of total jobyears) in key industries employing low-income people by the end of 2015, bringing in an estimate of $39.3 million in labor income (the majority in the construction sector) In addition to short-term job creation, the project is expected to generate long-term employment opportunities. Unlike those resulting from capital expenditures, these jobs are expected to exist through the useful life of the project. The annual long-term employment impacts resulting from the operation and maintenance of the project were estimated and resulted in the following: The project is expected to create $5.3 million in net incremental spending annually The project is expected to create 79 total job-years annually The project is expected to create 19 job-years annually in industries employing lowincome workers 16 Los Angeles Streetcar, Inc. TIGER III application; HDR Decision Economics Benefit Cost and Economic Impact Analysis 46
55 2.0 EVALUATION METHODOLOGY This section describes the evaluation methodology for the project. 2.1 Evaluation Process The (AA) presents an evaluation of alternatives under consideration for the project. The alternatives were screened based on criteria developed by Metro to identify a Locally Preferred Alternative (LPA). The AA provides decision-makers the information needed to advance the project into the next phases, including environmental documentation in compliance with the National Environmental Policy Act (NEPA) and California Environmental Quality Act (CEQA), design, and construction. The evaluation process (Figure 18) included two phases: Initial Screening and Final Screening. Initial screening included a conceptual level evaluation that analyzed the advantages and disadvantages of the alternatives considered. The initial screening included an analysis of reasonable alternatives, which were developed cooperatively by Metro, the Community Redevelopment Agency of the City of Los Angeles (CRA/LA), and Los Angeles Streetcar, Inc. (LASI). The purpose of the initial screening was to determine which of the alternatives would be the most feasible, and thereby narrow the range of alternatives considered for more detailed analysis in the final screening phase. The initial screening evaluation criteria were qualitative in nature and sought to eliminate alternatives that have fatal flaws, do not meet project goals, or do not have public support. The final screening analyzed the list of alternatives that advanced from the initial screening. The final screening evaluation criteria were more quantitative than the criteria used for initial screening and address ridership potential, operational characteristics, cost, system configuration, design issues, environmental issues, land use and economic development opportunities, and community support. The results of the final screening culminate in the identification of a LPA. The evaluation process does not include the analysis of maintenance and storage facility (MSF) site locations, as these will be identified separately from the preliminary identification of the LPA. This approach was taken so that the development and evaluation of alternatives was not constrained by a speculative MSF location. In order to advance the development and evaluation of streetcar alignment alternatives, potential MSF sites will be considered following preliminary identification of the LPA in this AA. LPA adoption by the Metro Board of Directors will occur prior to the start of environmental documentation. The MSF sites will be refined during the subsequent advanced conceptual engineering and environmental documentation phases. 47
56 Figure 18: Evaluation Process Definition of Alternatives Evaluation Criteria Initial Screening of Alternatives Final Screening of Alternatives Locally Preferred Alternative 48
57 2.2 Initial Screening Evaluation Criteria The initial screening evaluation analyzed the list of reasonable alternatives considered (which were developed cooperatively by Metro, CRA/LA, and LASI) using a set of qualitative evaluation criteria. Its purpose was to eliminate alternatives that have fatal flaws, do not meet project goals, or do not have public support. These evaluation criteria correlated to the project s two overarching goals which were generated during pubic workshops, meetings, and open houses and reflect input from public agencies, community groups, and stakeholders: 1. Enhance mobility and surface transit circulation in Downtown Los Angeles Connect major districts, destinations, and activity centers Improve transit coverage and circulation Provide simple, localized, high frequency service Alleviate traffic and reduce parking demand Serve transit-dependent populations Improve transit accessibility 2. Support the growth and revitalization of Downtown Los Angeles, including its historic districts Restore historic streetcar service Revitalize geographically isolated, economically depressed areas Support smart, sustainable growth Foster a more livable downtown Encourage historic restoration and transit-oriented development Strengthen downtown s economic competitiveness Table 11 describes the criteria used in the initial screening analysis to evaluate potential alternatives. The alternatives were rated High, Medium, or Low for each criteria, with High meaning optimal performance and Low indicating sub-standard performance. All of the criteria were weighted equally for the initial screening. 49
58 Table 11: Initial Screening Evaluation Criteria Criteria Project Goal Measurement Length Goal #1 What is the relative length of the alternative (the shorter alternatives receive higher scores because they have a lower capital cost)? Connectivity Goal #1 and #2 Does the alternative connect to the following: Union Station, Bunker Hill, Civic Center, Financial Core, Historic Core, South Park, and LASED? Missed destinations Goal #1 and #2 Does the alternative miss any major destinations, namely Union Station and Bunker Hill? Required connections Goal #1 Does the alternative require transfers, walking, or vertical circulation (stairs, escalators, etc.) to reach major destinations? Street grade Goal #1 Does the alternative use streets with a grade over 9 percent? Out-of-direction travel Goal #1 Does the alternative travel out-of-direction, which may increase passenger travel time? Ridership potential Goal #1 What is the relative potential of the alternative to attract riders? Capital costs Goal #1 What is the relative capital cost of the alternative? Operation and maintenance cost Goal #1 What is the relative operating and maintenance cost of the alternative? Transit system integration Goal #1 Does the alternative improve linkages to the regional transit network? Expandability Goal #1 Does the alternative include flexibility for future service expansion? Historic integrity Goal #2 Does the alternative use streets that had streetcar service? Traffic delay Goal #1 Does the alternative use intersections/streets that experience traffic delay? Traffic and parking Goal #1 Does the alternative require the elimination of a travel lane and/or parking? Risks Goal #1 Goal #2 Economic development Goal #2 Are there major risks (schedule, design, and construction) associated with the alternative that jeopardize the ability to implement the alternative? Does the alternative serve areas with substantial potential for future economic development (both new and revitalization of historic buildings)? Local funding Goal #1 and #2 What is the potential of the alternative to generate local funding since it is anticipated that a property assessment will be use for local funding? Consistency with plans and guidelines Goal #2 Is the alternative consistent with adopted local/regional plans and Federal guidelines (FTA project development guidelines)? Community support Goal #1 and #2 Is there community support for the alternative? Fatal flaw Goal #1 Does the alternative have a fatal flaw, such as a planning, design, environmental, or community issue that prevents implementation of the alternative? Goal #1: Enhance mobility and surface transit circulation in Downtown Los Angeles. Goal #2: Support the growth and revitalization of Downtown Los Angeles, including its historic districts. 50
59 2.3 Final Screening Evaluation Criteria The alternatives that advanced from initial screening were evaluated in more detail in final screening. The final screening evaluation criteria were more quantitative than the initial screening evaluation criteria and were intended to identify a Locally Preferred Alternative (LPA). The final screening evaluation criteria were based on the following categories: Ridership Capital Costs Operation and Maintenance (O&M) Costs Cost/Benefit Destinations Circulation Design Environmental Economic Development The final screening criteria evolved from the initial screening criteria. For example, while the initial screening criteria evaluated the general ridership potential of each alternative, the final screening criteria evaluated the actual ridership of each alternative based on the daily boardings and boardings per mile. While the final screening criteria were quantitative, there was not a fixed threshold for each category. Instead, the alternatives were evaluated relative to each other using the quantitative data available. For example, there is not a fixed threshold for ridership, but rather the alternatives were evaluated relative to each other based on the daily boardings and boardings per mile. Detailed environmental analysis would take place during the environmental documentation phase to comply with the National Environmental Policy Act (NEPA) and the California Environmental Policy Act (CEQA). The environmental documentation phase would begin after adoption of the LPA. Service planning, stop configurations, and effects to existing transit services (including transit service equity) due to streetcar implementation would also be examined during the environmental documentation phase. Table 12 further describes the criteria used in the final screening analysis to evaluate potential alternatives. 51
60 Table 12: Final Screening Evaluation Criteria Criteria Ridership Capital costs O&M costs Cost/benefit Destinations Circulation Transit operations and facilities Traffic operations Bicycle/pedestrian integration Design Physical constraints Transit system constraints Traffic constraints Environmental Property impacts Land Use Communities and neighborhoods Visual and aesthetics Historic and cultural resources Parklands Noise and vibration Energy Hazardous materials Public safety and security Soils, geology and seismic Ecosystem and natural environment Water quality and hydrology Air quality Construction Economic development Description/Measurement What is the ridership for each alternative? What is the capital cost of each alternative? What is the operating and maintenance (O&M) cost of each alternative? What is the cost/benefit of each alternative using cost per user (Annualized Capital Cost + Annualized O&M Cost / Daily Boardings)? What districts and destinations are served by the alternative? What are the transit issues (transit operations, transit stops, transit integration, and expansion) associated with each alternative? What are the traffic operation issues associated with each alternative? What are the bicycle/pedestrian integration issues associated with each alternative? What are the physical constraints (street grade, crossings, right-of-way, and bridge structures) of each alternative? What are the transit system issues (track and guideway, system configuration, and expansion) associated with each alternative? What are the traffic constraints (travel lanes and left turns) associated with each alternative? Does the alternative require additional right-of-way? What are the existing and future land use implications of each alternative? Does the alternative have community and neighborhood issues? Does the alternative have visual and aesthetic issues? Does the alternative affect historic resources? Does the alternative affect parklands? Does the alternative affect sensitive noise receptors? Does the alternative positively or negatively affect overall energy consumption? Does the alternative have hazardous material issues? Does the alternative have public safety and security issues? Does the alternative have soil, geology, and seismic issues? Does the alternative affect the ecosystem and natural environment? Does the alternative affect water quality and hydrology? Does the alternative have air quality issues? Does the alternative have construction issues that differentiate it from the other alternatives? Does the alternative include bridge decks or structures that have construction issues (construction staging, noise, etc.)? What are the opportunities for economic development for each alternative? 52
61 3.0 INITIAL SCREENING OF ALTERNATIVES This section describes the initial screening of alternatives for the project. 3.1 Initial Screening Alternatives The Build Alternatives include the proposed improvements to reintroduce streetcar service into Downtown Los Angeles. Multiple Build Alternatives were considered for initial screening. In order to better evaluate the range of alternatives, the initial screening alternatives were divided into three segments, as shown in Figure 19: Segment A: North of 5 th Street Segment B: Between 5 th Street and 9 th Street Segment C: South of 9 th Street Dividing the corridor into segments reduced the number of potential combinations that needed to be evaluated and allowed the differences between the alternatives to be clearly identified. In addition, it was easier to illustrate the alternatives by segment since the corridor is very linear. 53


62 Figure 19: Initial Screening Alternatives 54
63 Table 13 includes a description of the initial screening alternatives by segment. The initial screening alternatives are illustrated in Figures 20 through 34. It should be noted that southbound Broadway between 1 st Street and 9 th Street is common for all alternatives. This is consistent with prior planning efforts which identified streetscape improvements on Broadway to complement the streetcar and meets a primary purpose and need of the project, which is to serve as a catalyst for the restoration of the Historic Broadway Theatre District. Table 13: Description of Initial Screening Alternatives by Segment Alt. Description Details Segment A A1 Northbound on Hill St between 5 th St and 1 st St, westbound on 1 st St between Hill St and Hope St, two-way on Hope St between 1 st St and Hope Pl, Uses Broadway/Hill St couplet. Uses 1 st St and Hope St to access Bunker Hill. Two-way segment on Hope St between 1 st St and and eastbound on 1 st between Hope St and Hope St could be single track. Broadway. Serves Bunker Hill. Does not serve Union Station. A2 A3 A4 Northbound on Hill St between 5 th St and 1 st St, westbound on 1 st St between Hill St and Grand Ave, southbound on Grand Ave between 1 st St and 3 rd St, westbound on 3 rd St between Grand Ave and Hope St, northbound on Hope St between 3 rd St and 1 st St, and eastbound on 1 st St between Hope St and Broadway. Northbound on Olive St between 5 th St and General Thad Kosciuszko (GTK) Way, westbound on GTK Way between Olive St and Hope St, northbound on Hope St between GTK Way and 1 st St, and eastbound on 1 st St between Hope St and Broadway. Westbound on 5 th St between from Hill St or Olive St to Grand Ave, northbound on Grand Ave between 5 th St and 1 st St, and eastbound on 1 st St between Grand Ave and Broadway. Uses Broadway/Hill St couplet. Uses 1 st St and a Grand Ave/3 rd St/Hope St clockwise loop to access Bunker Hill. Serves Bunker Hill. Does not serve Union Station. Uses Olive Street and GTK Way to access Bunker Hill. GTK Way passes under Grand Ave bridge deck. Serves Bunker Hill. Does not serve Union Station. Forms a continuous loop. Uses Grand Ave (14% grade). Requires custom vehicle technology and operation because of 14% grade on Grand Ave. Risk to determine grade solution (feasibility cannot be determined until final design). Creates one-way clockwise loop. Serves Bunker Hill. Does not serve Union Station. Forms a continuous loop. Note: Southbound Broadway between 1 st Street and 9 th Street is common for all alternatives. 55
64 Table 13 (Continued): Description of Initial Screening Alternatives by Segment Alt. Description Details A5 Northbound on Hill St between 5th St and Temple Uses Broadway/Hill St couplet. St, westbound on Temple St between Hill St and Uses Temple St and Grand Ave to access Bunker Grand Ave, two-way on Grand Ave between Hill. Temple St and 1st St, eastbound on Temple St Two-way segment on Grand Ave between Temple between Grand Ave and Broadway, and southbound St and 1st St could be single track. on Broadway between Temple St and 1st St. Serves Bunker Hill. Does not serve Union Station. A6 A7 Northbound on Hill St between 5 th St and 1 st St, westbound on 1 st St between Hill St and Grand Ave, two-way on Grand Ave between 1 st St and the Grand Ave bridge deck just north of 2 nd St, and eastbound on 1 st St between Grand Ave and Broadway. Eastbound on 1 st St between Hill St and Main St, northbound on Main St between 1 st St and Paseo de la Plaza, southbound on Los Angeles St between Paseo de la Plaza and 1 st Street, and westbound on 1 st St between Los Angeles Street and Broadway. Uses Broadway/Hill St couplet. Uses 1 st St and Grand Ave to access Bunker Hill. Two way segment on Grand Ave could be single track, as could the track on 1 st St. Serves Bunker Hill. Does not serve Union Station. Uses Broadway/Hill St couplet. Uses Main St/Los Angeles St couplet to access Union Station. Crosses U.S. 101 freeway. Serves Union Station. Does not serve Bunker Hill. Forms a continuous loop. Segment B B1 Northbound on Hill St between 9 th St and 5 th St. Uses Broadway/Hill St couplet. Uses peak hour travel lane/off peak parking lane on Hill St (one or the other would need to be eliminated since they currently share the same travel lane). B2 Northbound on Olive St between 9 th St and 5 th St Uses Broadway/Olive St couplet. Segment C C1 Southbound on Broadway, westbound on Pico Blvd, northbound on Figueroa, eastbound on 9 th St. C2 C3 Southbound on Broadway, westbound on Pico Blvd, northbound on Hope St, westbound on 11 th St, northbound on Figueroa St, eastbound on 9 th St. Southbound on Broadway, westbound on 11 th St, northbound on Figueroa St, eastbound on 9 th St. Can use Broadway/Hill St or Broadway/Olive St couplet. Crosses Blue Line at grade at Pico Blvd. Can use Broadway/Hill St or Broadway/Olive St couplet. Does not cross Blue Line at grade. Can use Broadway/Hill St or Broadway/Olive St couplet. Does not cross Blue Line at grade. Note: Southbound Broadway between 1 st Street and 9 th Street is common for all alternatives. 56


65 Figure 20: Segment A: North of 5 th Street 57

66 Figure 21: Alternative A1 Figure 22: Alternative A2 Figure 23: Alternative A3 Figure 24: Alternative A4 58
67 Figure 25: Alternative A5 Figure 26: Alternative A6 Figure 27: Alternative A7 59


68 Figure 28: Segment B: Between 5 th Street and 9 th Street 60

69 Figure 29: Alternative B1 Figure 30: Alternative B2 61


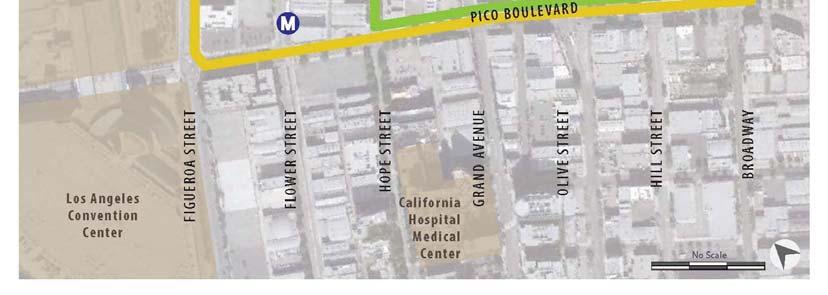
70 Figure 31: Segment C: South of 9 th Street 62

71 Figure 32: Alternative C1 Figure 33: Alternative C2 Figure 34: Alternative C3 63
72 3.2 Initial Screening Evaluation This section includes the initial screening evaluation for Segments A, B, and C. The alternatives were rated High (1), Medium (2), or Low (3) for each criteria, with High (1) meaning optimal performance and Low (3) indicating sub-standard performance. All of the criteria were weighted equally for the initial screening. Overall, the lower the score equals the higher the performance of the alternative. Tables 14 through 16 show the results of the initial screening for Segments A, B, and C, respectively. Table 17 presents a comparison of the advantages and disadvantages of the alternatives. Table 14: Initial Screening - Segment A Criteria A1 A2 A3 A4 A5 A6 A7 Details Length A3, A4, and A6 are the shortest alignments. A1 and A7 are the longest alignments. Connectivity A3 and A4 create wide loops that do not serve the north end of Historic Broadway effectively because they require out of direction travel to get there from south. Missed destinations A1, A2, A3, A4, A5, and A6 do not serve Union Station. A7 does not serve Bunker Hill. Required connections A3 requires vertical circulation at Grand Ave. A3 does not serve Angels Flight. A1, A2, A3, A4, A5, and A6 require a transfer to reach Union Station. Street grade A1, A2, A3, A4, and A6 have grade issues on 1 st St (9%). A3 has a grade issue on Olive St (9%). A4 has a grade issue on Grand Ave (14%). A5 and A7 have no grade issues. Out-of-direction A1, A2, and A4 travel slightly out-ofdirection to serve Bunker Hill. A3 travels below Grand Ave which requires vertical circulation. A5 travels out-of-direction by using Temple St as an alternative to 1 st St. A6 and A7 do not travel out-of-direction. High (1) = Optimal Performance, Medium (2) = Moderate Performance, and Low (3) = Substandard Performance. 64
73 Table 14 (Continued): Initial Screening - Segment A Criteria A1 A2 A3 A4 A5 A6 A7 Details Ridership potential A3 and A5 have the lowest ridership potential because they are confusing to the passenger and miss destinations and connections. A1, A2, A4, and A6 have good ridership potential because they serve more destinations and make more connections A7 has the highest ridership potential because it serves Union Station. Capital costs A6 has the lowest capital cost because it is the shortest and most simple alignment. A4 has the highest capital cost because it requires custom technology. O&M cost A6 has the lowest O&M cost because it is the shortest and most simple alignment. Transit integration A1, A2, A3, A4, and A6 serve the Regional Connector station at 2 nd St and Hope St. A1, A2, A5, A6, and A7 serve the Regional Connector station at 2 nd St and Broadway and the Red Line/Purple Line Pershing Square and Civic Center stations. A3 does not serve Angels Flight. A3 requires a vertical circulation element at Grand Ave for transit integration. A1, A2, A3, A4, A5, and A6 require a transfer to reach Union Station. Expandability A1 terminates at Hope Pl and cannot be expanded. A2, A3, and A4 have limited expansion opportunities because how they serve Bunker Hill. A6 and A7 have the most flexibility for expansion because they are simple, linear alignments. High (1) = Optimal Performance, Medium (2) = Moderate Performance, and Low (3) = Substandard Performance. 65
74 Table 14 (Continued): Initial Screening - Segment A Criteria A1 A2 A3 A4 A5 A6 A7 Details Historic integrity A1, A2, A3, and A4 serve Bunker Hill which did not have historic streetcar service. A5, A6, and A7 serve streets that were part of the historic streetcar system. Traffic delay A1, A2, A3, A4, A5, A6, and A7 use intersections and street segments with similar traffic characteristics. Traffic and parking A1, A2, A3, A4, A5, A6, and A7 have similar traffic and parking characteristics. Risks A1, A2, and A3 have risk because they must follow Regional Connector construction on Hope St which would delay the project A2 has risk because of bridge deck on Hope St over 4 th St. A3 has risk because of vertical clearance on Olive St. A4 has a risk because of the 14% grade on Grand Ave, since the feasibility cannot be determined until further research is completed. Economic development A1, A2, and A6 have the most economic development potential because they serve Bunker Hill. A5 and A7 have less economic development potential because they serve more civic buildings. A3 has the least economic development potential because of its alignment on Olive St and GTK Way. Local funding A1, A2, A3, and A6 have the most local funding potential because they serve Bunker Hill. A5 and A7 have less funding potential because the serve more civic buildings. A3 has less funding potential because of its alignment on Olive St and GTK Way. High (1) = Optimal Performance, Medium (2) = Moderate Performance, and Low (3) = Substandard Performance. 66
75 Table 14 (Continued): Initial Screening - Segment A Criteria A1 A2 A3 A4 A5 A6 A7 Details Consistency with plans and guidelines A1, A2, A4, A5, A6, and A7 include segments that have been previously identified as potential streetcar alignments in local and regional plans. A3 has not been identified previously because of its operation on GTK Way. Community support A4, A6, and A7 received the most support at the public scoping meeting and public workshops. A1, A4, and A6 received support for serving Bunker Hill. A7 received support for serving Union Station. Fatal flaw A1, A2, and A3 have a fatal flaw because they must follow Regional Connector construction on Hope St which would delay the project. This schedule delay is considered a fatal flaw since it would delay project implementation until It could also jeopardize the ability to establish a benefit assessment district, which would provide local funding for the project. Total The lower the score equals the higher the performance of the alternative. High (1) = Optimal Performance, Medium (2) = Moderate Performance, and Low (3) = Substandard Performance. 67
76 Table 15: Initial Screening - Segment B Criteria B1 B2 Details Length 1 1 B1 and B2 are the same length. Connectivity 1 1 B1 and B2 serve the same districts because they are one block apart. Missed destinations 1 1 B1 and B2 serve similar destinations because they are one block apart. Required connections 1 2 B1 is a one block couplet and Hill St is served by Red/Purple Line Pershing Square station. B2 is a two block couplet and Olive St is one block away from Red/Purple Line Pershing Square station. Street grade 1 1 B1 and B2 have no grade issues. Out-of-direction 1 1 B1 and B2 do not travel out of direction. Ridership potential 1 1 B1 and B2 have similar ridership potential because they are one block apart. Capital costs 1 1 B1 and B2 have similar capital costs because they are the same length. O&M cost 1 1 B1 and B2 have similar O&M costs because they are the same length. Transit integration 1 1 B1 and B2 have similar opportunities for transit integration. Expandability 1 1 B1 and B2 have the same potential for expansion. Historic integrity 1 2 B1 and B2 previously had streetcar service, although it was only for one block on Olive St. Traffic delay 2 2 B1 and B2 intersections and street segments are characterized by peak hour delay and high transit and pedestrian volumes. Traffic and parking 2 2 B1 and B2 have shared peak hour travel/off peak parking lanes that would need to be modified by either eliminating the peak hour travel lane (between 4pm and 7pm) and preserving the on-street parking all day or eliminating the on-street parking and preserving the travel lane all day. Risks 2 1 B1 has medium risk because of the elimination of the shared peak hour travel/off peak parking lanes. Economic development 1 1 B1 and B2 have similar potential for economic development because they have similar coverage and density. Local funding 1 1 B1 and B2 have similar potential for local funding through property assessments because they have similar coverage. Plans and guidelines 1 1 B1 and B2 have both been identified in plans and guidelines as potential streetcar alignments. Community support 1 2 B1 received more support than B2 at the public scoping meeting and project workshops. Fatal flaw 1 1 B1 and B2 do not have any fatal flaws. Total The lower the score equals the higher the performance of the alternative. High (1) = Optimal Performance, Medium (2) = Moderate Performance, and Low (3) = Substandard Performance. 68
77 Table 16: Initial Screening - Segment C Criteria C1 C2 C3 Details Length C1 and C2 are the same length while C3 is a shorter alignment. Connectivity C1, C2, and C3 serve the same districts. Missed destinations C1 does not serve the heart of South Park. C2 and C3 do not serve the front door of the Convention Center. C3 does not serve California Hospital Medical Center. Required connections C1 is two blocks from the heart of South Park. C2 and C3 are two blocks from the Convention Center. C3 is one block away from the Blue Line Pico station Street grade C1, C2, and C3 have no grade issues. Out-of-direction C1 and C2 require more out-of-direction travel because the distance is longer between 9 th St and Pico Blvd. C3 requires less out-of-direction travel because the distance is shorter between 9 th St and 11 th St. Ridership potential C1, C2, and C3 have similar ridership potential, but different ridership characteristics (C1 and C2 serve more special event locations while C3 is more neighborhood focused). Capital costs C1 and C2 have higher capital costs because they are longer alignments than C3. C1 would require automatic train control. O&M cost C1 and C2 have higher O&M costs because they are longer alignments than C3. C1 would require automatic train control. Transit integration C1 serves the Blue Line Pico station. C2 and C3 are one block away from the Blue Line Pico station. Expandability C1, C2, and C3 have similar potential for expansion because they are all one way loop alignments. Historic integrity C1, C2, and C3 previously had streetcar service for all segments. Traffic delay C1, C2, and C3 would be subject to traffic delay on Figueroa St during peak hour and special events. C2 and C3 bypass the at-grade Blue Line crossing by using 11 th St. Traffic and parking C1, C2, and C3 have similar characteristics for traffic and parking. Risks C1 is higher risk because of the at-grade Blue Line crossing. Economic development C1 and C2 have similar potential for economic development because they serve more areas of South Park and serve underutilized parcels on Pico Blvd. C3 has less potential for economic development because it is a shorter alignment and 11 th St is relatively built out. High (1) = Optimal Performance, Medium (2) = Moderate Performance, and Low (3) = Substandard Performance. 69
78 Table 16 (Continued): Initial Screening - Segment C Criteria C1 C2 C3 Details Local funding C1 and C2 have similar potential for local funding through property assessments because they have similar coverage. C3 has less potential for local funding because it serves a smaller geographic area. Plans and guidelines C1 and C3 have been identified in plans and guidelines as potential streetcar alignments. Community support C1 and C3 received more support than C1 at the public scoping meeting and project workshops. Fatal flaw C1, C2, and C3 do not have any fatal flaws. Total The lower the score equals the higher the performance of the alternative. High (1) = Optimal Performance, Medium (2) = Moderate Performance, and Low (3) = Substandard Performance. 70
79 Table 17 provides a general description of the advantages and disadvantages of the initial screening alternatives. Table 17: Advantages/Disadvantages of Initial Screening Alternatives Alt. Advantages Disadvantages Segment A A1 Linear connection through Bunker Hill. Serves south end of Bunker Hill. Preserves Broadway/Hill St couplet, which is more user friendly for passenger. Connects to Regional Connector station at 2 nd St and Hope St. Serves short trips between Library and Regional Connector station at 2 nd St and Hope St. Avoids bridge deck on Grand Ave, which requires special track construction. More property assessment opportunities, given adjacent density. Must follow Regional Connector construction, which may delay implementation. Requires reconstruction of Hope St. 9% grade on 1 st St. Serves back door of buildings on Hope St. Cannot be extended south from terminus on Hope St. Out of direction travel to Bunker Hill by going north to 1 st St, then south on Hope St to Bunker Hill. Requires special track construction on Grand Avenue Bridge deck. Hope St is not a historic streetcar route. A2 Preserves Broadway/Hill St couplet. Connects to Regional Connector station at 2 nd St and Hope St. Serves front door of buildings on Grand Ave. Must follow Regional Connector construction, which may delay implementation. Requires reconstruction of Hope St. 9% grade on 1 st St. Requires special track construction on Grand Avenue Bridge deck. Must cross 3 rd St tunnel. Additional track miles with no new attractions. Out-of-direction travel to Bunker Hill by going north to 1 st St, then south on Grand Ave. Hope St and Grand Ave are not historic streetcar routes. 71
80 Table 17 (Continued): Advantages/Disadvantages of Alternatives Alt. Advantages Disadvantages A3 Serves south end of Bunker Hill, including Wells Fargo Center and Library. Connects to Regional Connector station at 2 nd St and Hope St. Avoids bridge deck on Grand Ave, which otherwise requires special track construction. Serves more buildings, resulting in more potential property assessments opportunities, given adjacent density (Olive St is closer to the Financial District). Must follow Regional Connector construction, which may delay implementation. Requires reconstruction of Hope St. 9% grade on 1 st St and Olive St. Tunnel operation on GTK Way, which creates additional design constraints (site distance, lighting, vertical clearance). Existing pedestrian environment in tunnel is poor (limited visibility, poor lighting, and narrow sidewalks). Dependent on vertical circulation elements Grand Ave. Does not connect to Angels Flight. Wide loop/couplet, which is less user friendly for passenger. Serves back door of buildings and service entrances on Olive St, GTK Way, and Hope St. Vertical clearance issues at California Plaza. Olive St is not a historic streetcar route. A4 A5 Linear connection through Bunker Hill. Serves south end of Bunker Hill. Serves front door of buildings on Grand Ave. More property assessment opportunities, given adjacent density. Identified in prior studies. Avoids grade issues on 1 st St to Bunker Hill (approximately 5% on Temple St vs. 9% on 1 st St). Serves additional attractions north of 1 st St, including Civic Center, County Administration Buildings, Courthouses, Music Center, Cathedral, and future Civic Park. Preserves Broadway/Hill St couplet. 14% grade on Grand Ave and 9% grade on 1 st St. Requires special track construction on Grand Avenue Bridge deck. Requires custom vehicle technology and operation (cog or cable) because of 14% grade on Grand Ave. Risk to determine grade solution (feasibility cannot be determined until final design). Wide loop/couplet. Out of direction travel by going north to 1 st St, then south on Grand to Bunker Hill. May lose through ridership with deviation. Adjacent government properties cannot provide revenue through property assessments. 72
81 Table 17 (Continued): Advantages/Disadvantages of Alternatives Alt. Advantages Disadvantages A6 Shortest and most direct connection to Bunker Hill. Lowest capital cost because it is the shortest distance. No design flaws. Preserves Broadway/Hill St couplet, which is user friendly. Potential for two-way single track on Grand Ave. Avoids bridge deck on Grand Ave, which requires special track construction. Serves front door of buildings on Grand Ave. 9% grade on 1 st St. Fewer property assessment opportunities, given adjacent density. Does not stop in front of California Plaza or Library. A7 Serves Union Station, City Hall, and Olvera St. Linear connection. Potential for future extension through Chinatown. Obvious corridor and connection. No out-of-direction travel. Serves regional trips. Preserves Broadway/Hill St couplet. Must cross freeway. Adjacent government properties cannot provide revenue through property assessments. Does not serve Bunker Hill. Serves same activity centers as Red/Purple Line and Regional Connector. Segment B B1 Preserves Broadway/Hill St couplet. 1 block couplet. Simple alignment. Works well with Metro buses. Closer to Spring St/Main St and growing residential population. Shared parking lane. Potential trade-off between parking and peak capacity. B2 Closer to Financial Core. Pairs up best with some Bunker Hill alternatives. Wide couplet. Northbound does not serve Broadway effectively. Less obvious to passenger because couplet is 2 blocks apart. Farther from Spring St/Main St and growing residential population. 73
82 Table 17 (Continued): Advantages/Disadvantages of Alternatives Alt. Advantages Disadvantages Segment C C1 Economic development potential because of underutilized properties on Pico Blvd. Serves front door of Convention Center. Serves more areas of South Park compared to an alternative on 11 th St. Serves California Hospital Medical Center. Blue Line grade crossing at Pico Blvd. Additional mileage (approximately 0.5 miles) to serve Pico Blvd versus 11 th St. Impacts from special events at Staples Center, etc. Figueroa St congestion during peak hours and special events. C2 C3 Serves both Pico Blvd and 11 th St. Economic development potential in underutilized areas on Pico Blvd. Serves more areas of South Park compared to an alternative on 11 th St. Serves California Hospital Medical Center. Most direct. Shorter alignment. Serves existing activity centers and future residential development on 11 th St. Lowest cost capital cost because it is the shortest distance. Additional mileage (approximately 0.5 miles) to serve Pico Blvd versus 11 th St. Does not serve front door of Convention Center. 2 additional turns compared to and alternative using only Pico Blvd or 11 th St. Figueroa St congestion during peak hour and special events. Less economic development potential. Does not serve area around Pico Blvd. Impacts from special events at Staples Center, etc. Figueroa St congestion during peak hour and special events. 74
83 3.3 Initial Screening Recommendations Based on the results of the initial screening evaluation, the following recommendations were made for alternatives advancing into final screening. Within Segment A (north of 5 th St), it was recommended that A4, A6, and A7 be advanced and A1, A2, A3, and A5 be eliminated from further consideration. Within Segment B (between 5 th St and 9 th St), it was recommended that both B1 and B2 be advanced. Within Segment C (south of 9 th St), it was recommended that C1 and C3 be advanced and that C2 be preserved as an alternative variation for C1 because of the at-grade crossing of the Metro Blue/Expo Line. Table 18 summarizes the results of the initial screening. Figure 35 shows the alternatives that advanced from initial screening. Table 18: Initial Screening Recommendations Recommendations Segment A Advance: A4, A6, and A7 Eliminate: A1, A2, A3, and A5 Segment B Advance: B1 and B2 Eliminate: None Segment C Advance: C1 and C3 Variation: C2 Notes A4 requires additional research regarding the ability to operate on the segment of Grand Ave with 14% grade. While this was considered a major risk, it was not considered a fatal flaw since the use of alternate technologies could allow the alternative to be feasible in the future. A1, A2, and A3 were eliminated because they have a fatal flaw (must follow Regional Connector construction on Hope St which would delay the project). This schedule delay is considered a fatal flaw since it would delay project implementation until It could also jeopardize the ability to establish a benefit assessment district, which would provide local funding for the project. A1 and A2 were also eliminated because they serve the back door of buildings on Hope St. A3 was also eliminated because it requires tunnel operation on GTK Way, which creates additional design constraints and has a poor pedestrian environment. A5 was eliminated because it travels out of direction and has limited opportunity to capture revenue through property assessments. Minimal differences between B1 and B2 so both were advanced. Minimal differences between C1 and C3 so both were advanced. C2 was recommended as an alternative variation for C1 because of the atgrade crossing of the Metro Blue/Expo Line. 75


84 Restoration of Historic Streetcar Service in Downtown Los Angeles Figure 35: Alternatives Advanced from Initial Screening 76
85 4.0 FINAL SCREENING OF ALTERNATIVES This section describes the final screening of alternatives for the project. 4.1 Final Screening Alternatives Final screening considered the alternatives that advanced from initial screening, which were recommended for segments A, B, and C Changes to Alternatives Prior to Final Screening The following changes were made to the alternatives prior to final screening: A4 (revised) and B3 (new alternative): A modification was made to the A4 alternative to address the 14 percent grade on Grand Avenue between 5 th Street and 4 th Street. The revised A4 alternative uses an elevated bridge structure for the streetcar that starts north of 6 th Street, crosses above 5 th Street, and ends on Grand Avenue south of 4 th Street. The revised A4 alternative requires a new B3 alternative on Grand Avenue between 9 th Street and 5 th Street so the streetcar can operate northbound on Grand Avenue between 9 th Street and 1 st Street. C1 (eliminated) and C2 (advanced): The C1 alternative was eliminated from consideration and replaced with the C2 alternative, which uses Hope Street and 11 th Street to bypass the at-grade crossing of the Metro Blue/Expo Line on Pico Boulevard. It has not been determined whether Metro or another provider would operate the streetcar. However, Metro will not allow another operator to cross the Metro Blue/Expo Line because of safety concerns. Therefore, the C2 alternative was advanced in place of the C1 alternative because it bypasses the at-grade crossing. B4 (new alternative): A new B4 alternative was added that uses Figueroa Street between 9 th Street and 7 th Street,7 th Street between Figueroa Street and Hill Street, and Hill Street between 7 th Street and 5 th Street. The B4 alternative was added in response to public and stakeholder requests following the presentation of the initial screening results to add an alternative that more directly serves the Financial Core and the 7 th Street/Metro Center Station. The revised alternatives by segment that advanced from initial screening are described below: Segment A: Advance A4 (revised), A6, and A7 Segment B: Advance B1, B3 (new), and B4 (new) Segment C: Advance C2 (new) and C3 These changes are illustrated in Figure 36, which shows the new alternatives in dashed lines. 77


86 Figure 36: Changes to Alternatives Prior to Final Screening 78
87 4.1.2 Combined Alternatives for Final Screening The alternatives by segment that advanced from initial screening were combined into seven alternatives for final screening. These alternatives are listed below and shown on one map in Figure 37 and individual maps in Figures 38 through 44: Alternative 1: A4/B3/C1 (Figure 38) Alternative 2: A4/B3/C3 (Figure 39) Alternative 3: A6/B1/C1 (Figure 40) Alternative 4: A6/B1/C3 (Figure 41) Alternative 5: A7/B1/C1 (Figure 42) Alternative 6: A7/B1/C3 (Figure 43) Alternative 7: A6/B4/C3 (Figure 44) 79

88 Figure 37: Final Screening Alternatives 80

89 Figure 38: Alternative 1 81


90 Figure 39: Alternative 2 82

91 Figure 40: Alternative 3 83
92 Figure 41: Alternative 4 84
93 Figure 42: Alternative 5 85

94 Figure 43: Alternative 6 86
95 Figure 44: Alternative 7 87
96 The seven alternatives evaluated in final screening are described in Table 19. Table 19: Description of Final Screening Alternatives Alt Description 1 Southbound on Broadway between 1 st St and Pico Blvd, westbound on Pico Blvd between Broadway and Hope St, northbound on Hope St between Pico Blvd and 11 th St, westbound on 11 th St between Hope St and Figueroa St, northbound on Figueroa St between Pico Blvd and 9 th St, eastbound on 9 th St between Figueroa St and Grand Avenue, northbound on Grand Avenue between 9 th St and 1 st St with the streetcar elevated from 6 th St to 4 th St, eastbound on 1 st St between Grand Ave and Broadway. 2 Southbound on Broadway between 1 st St and 11 th St, westbound on 11 th St between Broadway and Figueroa St, northbound on Figueroa St between 11 th St and 9 th St, eastbound on 9 th St between Figueroa St and Grand Avenue, northbound on Grand Avenue between 9 th St and 1 st St with the streetcar elevated from 6 th St to 4 th St, eastbound on 1 st St between Grand Ave and Broadway. 3 Southbound on Broadway between 1 st St and Pico Blvd, westbound on Pico Blvd between Broadway and Hope St, northbound on Hope St between Pico Blvd and 11 th St, westbound on 11 th St between Hope St and Figueroa St, northbound on Figueroa St between Pico Blvd and 9 th St, eastbound on 9 th St between Figueroa St and Hill St, northbound on Hill St between 9 th St and 1 st St, westbound on 1 st St between Hill St and Grand Ave, two-way on Grand Ave between 1 st St and 2 nd St, and eastbound on 1 st St between Grand Ave and Broadway. 4 Southbound on Broadway between 1 st St and 11 th St, westbound on 11 th St between Broadway and Figueroa St, northbound on Figueroa St between 11 th St and 9 th St, eastbound on 9 th St between Figueroa St and Hill St, northbound on Hill St between 9 th St and 1 st St, westbound on 1 st St between Hill St and Grand Ave, two-way on Grand Ave between 1 st St and 2 nd St, and eastbound on 1 st St between Grand Ave and Broadway. 5 Southbound on Broadway between 1 st St and Pico Blvd, westbound on Pico Blvd between Broadway and Hope St, northbound on Hope St between Pico Blvd and 11 th St, westbound on 11 th St between Hope St and Figueroa St, northbound on Figueroa St between Pico Blvd and 9 th St, eastbound on 9 th St between Figueroa St and Hill St, northbound on Hill St between 9 th St and 1 st St, eastbound on 1 st St between Hill St and Main St, northbound on Main St between 1 st St and Paseo de la Plaza, southbound on Los Angeles St between Paseo de la Plaza and 1 st Street, and westbound on 1 st St between Los Angeles Street and Broadway. 6 Southbound on Broadway between 1 st St and 11 th St, westbound on 11 th St between Broadway and Figueroa St, northbound on Figueroa St between 11 th St and 9 th St, eastbound on 9 th St between Figueroa St and Hill St, northbound on Hill St between 9 th St and 1 st St, eastbound on 1 st St between Hill St and Main St, northbound on Main St between 1 st St and Paseo de la Plaza, southbound on Los Angeles St between Paseo de la Plaza and 1 st Street, and westbound on 1 st St between Los Angeles Street and Broadway. 7 Southbound on Broadway between 1 st St and 11 th St, westbound on 11 th St between Broadway and Figueroa St, northbound on Figueroa St between 11 th St and 7 th St, eastbound on 7 th St between Figueroa St and Hill St, northbound on Hill St between 9 th St and 1 st St, westbound on 1 st St between Hill St and Grand Ave, two-way on Grand Ave between 1 st St and 2 nd St, and eastbound on 1 st St between Grand Ave and Broadway. Note: Southbound Broadway between 1 st Street and 11 th Street is common for all alternatives. 88
97 4.2 Final Screening Evaluation Ridership Methodology Ridership forecasts were generated for the seven alternatives in final screening using a Direct Ridership Model (DRM). Traditional methods of forecasting transit ridership often employ regional travel demand models to predict ridership. Such models are relatively unresponsive to changes in station-level land use and transit service characteristics. In the case of Los Angeles, the large sizes of the traffic analysis zones in the Metro travel demand model preclude detailed land use data collection and differentiation at the station-level. Because streetcars serve a local travel market, DRMs are better at analyzing ridership at the local level versus traditional regional travel demand models. Furthermore, the Metro travel demand model does not have a streetcar calibrated mode, meaning its use would require calibration and validation of a new streetcar mode of travel in the model. Alternatively, the streetcar would have to be classified using a mode that currently exists in the model such as bus or light rail, which have different ridership characteristics than streetcar. DRMs are directly and quantitatively responsive to land use and transit service characteristics within the immediate vicinity and catchment area of streetcar stops. They can predict ridership at individual stops based on local stop area and system characteristics. DRMs are based on empirical relationships found through statistical analysis of stop ridership and local stop characteristics. The effects of stop-level variables are highly significant in accurately forecasting streetcar ridership. While streetcar systems are used for traditional commute trips, research with transit agencies suggests they more often provide access and circulation for downtown or city center areas. They serve tourist needs and often duplicate existing transit service provided by bus. Thus, it was expected that individual stop-area characteristics greatly affect boardings and overall ridership projections. Recognizing that variables affecting streetcar ridership are different than those for regional rail systems, the basis for analysis draws from the characteristics of existing streetcar systems in Portland, Seattle, and Tacoma. These systems were chosen because they are similar to the proposed streetcar. Ridership data was collected for each system at the system level, and where available, at the individual stop level. Variables were collected at the system level including route length, opening year, frequency of service, train capacity, fare (including presence of free stops), and transfer policy. At the stop level, data were gathered for the area within a quartermile (5 minute walk) of the stop and included, intersecting transit, retail and general employment density, household density, street connectivity, distance between stops, number of hotels and number of special events centers. Table 20 shows the characteristics of existing streetcar systems. 89
98 Table 20: Existing Streetcar Systems System Route Length Number of Stops (Both Directions) Portland Streetcar System 8.0 miles 47 Seattle South Lake Union Line 2.6 miles 12 Tacoma Streetcar System 2.7 miles 8 The stop level data collected from Portland, Seattle, and Tacoma were used to perform ordinary least squares (OLS) regression analysis to predict daily boardings. This analysis was based on empirical relationships found through statistical analysis of stop ridership and local stop characteristics. Multiple iterations of all collected data were tested in the regression model, but the variables that entered into the DRM model as significant were the following: Households: A measure of residential density. Retail Employment: A measure of retail intensity. Number of Feeder Trains: A measure of the number of regional transit connections. Start of Line: Applies to bi-directional lines where more passengers tend to board at the first station; does not apply to loop alignments. Center: Stop located near a special events center (such as the Staples Center). Free vs. Paid: Assumes a paid system but a comparison as a free system is made. Data for each of these variables were collected for potential stop locations along the alternatives. These variables were used to predict daily boardings at each stop and were summed for each configuration to estimate daily boardings. Post Model Processing Frequency of Service A post-model adjustment for frequency of service was considered to account for variables not included in the DRM model. There is not enough data to make a statistically significant relationship between frequency and boardings, but this variable has been identified as an important factor distinguishing the project s alternatives from the other streetcar systems. Among the other streetcar systems studied, the average frequency is 3.6 trains per hour. However, the project s alternatives are planned to have 8.6 trains per hour (one train every 7 minutes) during the peak. Although no research exists that provides an elasticity value for frequency of service specifically for streetcar systems, according to TCRP Synthesis 66, New York City reported an elasticity value of 0.2 for transit service frequency. Elasticity is the ratio of the percentage 90
99 change in one variable to the percentage change in another variable. An elasticity value for frequency of service of 0.2 means that for every 100 percent increase in frequency there is a corresponding 20 percent increase in ridership. Therefore, increasing service frequency from 3.6 to 8.6 trains per hour equals a 138 percent increase in service frequency. Multiplying that increase by 0.2 yields an expected ridership increase of 28 percent for the seven alternatives. This increase was applied as a post-model process to the results of the DRM model to account for increased ridership due to the more frequent service of the project s alternatives. Consideration of Angels Flight Angels Flight is funicular railway connecting Hill Street and California Plaza in Bunker Hill. Each ride costs $0.25 and the railway averages approximately 2,100 weekday boardings. While this service is well utilized by office workers traveling between the Broadway area and Bunker Hill, it is also a tourist attraction. Alternatives 3, 4, 5, 6, and 7 would provide a direct connection to the Angels Flight terminus on Hill Street. Overall, it is estimated that approximately 30 percent of weekday boardings on Angels Flight are attributable to tourists. Considering a likely synergy between the use of Angels Flight and streetcar among tourists, a post model adjustment equal to one third of projected daily tourist boardings on Angels Flight was distributed proportionally among the alternatives serving the funicular railway. Reduced Fare A sensitivity test of a reduced fare versus full fare was completed to better understand the results, differences in alternatives, and how they compare to other system types. The Tacoma streetcar system and significant portions of the Portland streetcar system are free fare. The variable Free/Paid was found to have a statistically significant influence on ridership in the DRM model. To test the impact of applying a fare free system to the streetcar alternatives, a comparison of ridership estimates of free versus paid systems was conducted using the free/paid variable in the model. While the DRM model can distinguish between free fare and full fare systems, it does not measure changes in the level of fare. Rather than charging the full Metro fare of $1.50 per ride, Metro assumed that the streetcar alternatives charge a reduced fare of $0.50 per ride which would be similar to DASH. A widely accepted value for fare to ridership elasticity is -0.4 (although this value is not streetcar specific). According to this elasticity value, a fare decrease from $1.50 to $0.50 per ride would result in a 27 percent increase in ridership for all alternatives. Ridership Results The daily ridership and performance (boardings per mile) of each alternative are summarized in Table 21. This includes the results of the DRM model and post model processing. A technical memorandum on ridership is included as Appendix A. 91
100 Table 21: Ridership Alternative Number of Stops Daily Boardings Boardings per Mile ,090 2, ,390 2, ,880 2, ,180 2, ,190 2, ,500 2, ,390 2,210 Alternative 5 (11,190) and Alternative 3 (9,880) have the highest number of daily boardings. This is due to better access to major trip generators and the most number of stops. In general, the higher the number of stops (assuming the stop is located near factors that influence ridership), the higher the ridership. Alternative 2 (7,390) has the lowest number of boardings, but is also the shortest alignment. Alternative 1 (2,370) has the highest boardings per mile while Alternative 6 (2,040) has the lowest boardings per mile. Overall, Alternatives 1, 3, and 7 perform the best in terms of ridership with a high number of daily boardings and boardings per mile. Alternatives 5 and 6 have the highest number of daily boardings, but also the lowest boardings per mile. 92
101 4.2.2 Capital Costs Methodology Capital costs were generated for each of the alternatives in final screening using the FTA Standard Cost Category (SCC) workbooks. The SCC workbook methodology includes the following categories: Construction categories Guideway and track elements: Guideway (at-grade or aerial), track, and special trackwork (turnouts). Stops: Stops, shelters, platforms, and passenger amenities. Support facilities: Maintenance and storage facility, shops, and administration buildings. Sitework and special conditions: Demolition, clearing, earthwork, utilities, civil improvements, roadway improvements, curb, gutter, sidewalk, and paving. Systems: Train control, train signals, automatic train protection, traction power (substations and equipment), traffic signals, communications, and fare collection. Other categories Right-of-way: Purchase or lease of land. Vehicles: Vehicles and spare parts. Professional services: Preliminary engineering, final design, program management, construction management, insurance, permits, and inspections. Project reserve: Unallocated contingency. Capital Costs The capital costs for each alternative are summarized in Table 22. The full capital cost estimate is included as Appendix B. 93
102 Table 22: Capital Costs Alternative SCC Item Guideway and $14,577 $12,964 $13,693 $12,143 $17,437 $15,824 $12,143 Track Elements 20 Stops $2,520 $2,117 $2,923 $2,520 $3,326 $2,923 $2, Support $11,193 $11,193 $11,193 $11,193 $11,193 $11,193 $11,193 Facilities 40 Sitework and $13,796 $11,660 $12,334 $10,415 $16,696 $14,724 $10,417 Special Conditions 50 Systems $12,536 $11,366 $13,826 $11,994 $15,327 $14,156 $12,267 Construction $54,622 $49,300 $53,970 $48,265 $63,979 $58,821 $48,540 Subtotal 60 Right-of-Way $1,809 $1,740 $1,877 $1,775 $1,979 $1,911 $1, Vehicles $30,240 $30,240 $34,020 $30,240 $37,800 $37,800 $30, Professional $18,328 $16,726 $18,364 $16,418 $21,600 $20,048 $16,501 Services Subtotal $104,999 $98, ,230 $96, , ,580 $97,055 Project Reserve $10,500 $9,801 $10,823 $9,670 $12,536 $11,858 $9,706 (10%) Total $115,499 $107,807 $119,053 $106,367 $137,895 $130,438 $106,761 Track Miles Cost per Track Mile $30,156 $32,472 $29,180 $29,629 $26,724 $28,051 $29,738 Note: All costs in thousands and $2011. Alternative 4 ($106.4 million) and Alternative 7 ($106.8 million) have the lowest capital cost. These alternatives are shorter alignments, use 11th Street instead of Pico Boulevard, and serve Bunker Hill instead of Union Station. Alternative 5 ($137.9 million) and Alternative 6 ($130.4 million) have the highest capital cost. These alternatives are the longest alignments by over a mile and serve Union Station. The capital cost is generally a function of the route length, number of stops, and number of vehicles. For example, the longer the route the higher the capital cost. The exception to this is when the alternative has a large capital cost item, such as the Grand Avenue bridge structure associated with Alternatives 1 and 2. The cost per track mile is relatively similar between all of the alternatives and ranges from approximately $27 million to $32 million. Alternative 5 ($26.7 million) and Alternative 6 ($28.1 million) have the lowest capital cost per mile despite having the highest capital cost overall. Alternative 2 ($32.5 million) and Alternative 1 ($30.2 million) have the highest capital cost per mile. 94
103 4.2.3 Operation and Maintenance (O&M) Costs Methodology and Assumptions The operation and maintenance (O&M) costs were generated for each alternative in final screening using a cost per hour. The O&M costs were based on the following assumptions: O&M cost estimates assumed a streetcar cost of $200 per hour, which is an average of the existing Portland, Seattle, and Tacoma streetcar systems. Annual operating requirements based on 254 weekdays, 52 Saturdays, and 59 Sundays and holidays per year. Frequency is 7 minutes during the peak, 10 minutes during midday, and 15 minutes during the evening. Operating hours are 6a.m. to 12a.m. on Monday through Friday and 7a.m. to 12a.m. on Saturdays and Sundays/Holidays. Annual revenue miles and hours can both be used to calculate O&M costs, although revenue hours are more common for streetcar systems. Annual revenue miles and hours include layover time, but do not include report and deadhead time. O&M Costs The O&M costs for each alternative in final screening are summarized in Table 23. The full O&M cost estimate is included as Appendix C. Alternative Route Length Run Time Table 23: O&M Costs Peak Vehicles Fleet Vehicles Annual Vehicle- Hours Annual Vehicle- Miles Annual O&M Cost ($2011) :34: , ,900 $5,318, :31: , ,400 $5,318, :40: , ,400 $6,148, :35: , ,900 $5,318, :49: , ,400 $7,442, :45: , ,000 $6,916, :35: , ,300 $5,318,000 Note: Assumes streetcar cost of $200 per hour. All costs in $2011. Alternatives 1, 2, 4, and 7 ($5.3 million) have the lowest O&M cost and are also the shortest alignments. Alternative 5 ($7.4 million) and Alternative 6 ($6.9 million) have the highest O&M cost and are the longest alternatives (both serve Union Station). Overall, the O&M cost is generally a function of the route length and the number of vehicles. 95
104 4.2.4 Cost/Benefit The cost/benefit was determined by using the ridership, capital costs and operation and maintenance (O&M) costs of each alternative to calculate the cost per user. This provided an additional comparison, since in many cases the performance of the alternative is a function of the route length, number of stops and vehicles. For example, the following trends have been observed for ridership, capital cost, and O&M cost: Ridership is often a function of the number of stops (the more stops the more riders). Capital cost is often a function of the route length, number of stops, and number of vehicles (the longer route the higher capital cost). O&M cost is often a function of the route length and number of vehicles (the longer the route the higher the O&M cost). In order to compare the alternatives more effectively, the cost/benefit of each alternative can be determined by calculating the cost per user. The formula that is used to calculate the cost per user of each alternative is described below: Cost per User = (Annualized Capital Cost + Annualized O&M Cost) / Daily Boardings Note that the annualized capital cost is based on a 50-year amortization of costs at a 5 percent interest rate. Table 24 summarizes the ridership, capital cost, and O&M cost and calculates the cost per user for each alternative. Table 24: Cost/Benefit Alternative Boardings Capital Cost Annualized Capital Cost Annual O&M Cost Annualized Capital + O&M Cost Cost per User 1 9,090 $115,499 $6,327 $5,318 $11,645 $ ,390 $107,807 $5,905 $5,318 $11,223 $ ,880 $119,053 $6,521 $6,148 $12,669 $ ,180 $106,367 $5,826 $5,318 $11,144 $ ,190 $137,895 $7,553 $7,442 $14,995 $ ,500 $130,438 $7,145 $6,916 $14,061 $ ,390 $106,761 $5,848 $5,318 $11,166 $1.33 Note: All costs in thousands and $2011. The annualized capital cost is based on a 50-year amortization of costs at a 5 percent interest rate. Alternatives 1 and 3 ($1.28) have the lowest cost per user, followed by Alternative 7 ($1.33). The cost per user is generally less for alternatives that generate a greater number of users. Alternative 2 ($1.52) and Alternative 6 ($1.48) have the highest cost per user, which suggest a weak investment relative to the other alternatives. 96
105 4.2.5 Destinations This section describes the districts and destinations served by the alternatives evaluated in final screening. The following highlights the key differences between the alternatives in terms of destinations served: Alternatives 1, 3, 4, and 7 serve the most destinations overall. Alternatives 1 and 2 serve Grand Avenue instead of Hill Street. Alternatives 3, 4, and 7 use a Broadway/Hill Street couplet and Alternatives 1 and 2 use a Broadway/Grand Avenue loop. Alternatives 1, 2, 3, 4, and 7 serve Bunker Hill, but do not serve Union Station. Alternatives 5 and 6 serve Union Station, but do not serve Bunker Hill. Alternatives 1, 3, and 5 directly serve Pico Boulevard. Alternatives 2, 4, 6, and 7 directly serve 11 th Street. All alternatives serve Broadway between 1 st Street and 11 th Street. Alternatives 1, 2, 3, 4, and 7 do not go north of 1 st Street or east of Broadway. Tables 25 and 26 provide a summary of the districts and destinations served by each alternative. Table 25: Districts Served by Final Screening Alternatives Alternative Districts Bunker Hill Civic Center El Pueblo Financial Core Historic Core Jewelry District South Park Los Angeles Sports and Entertainment District (LASED) 97
106 Table 26: Destinations Served by Final Screening Alternatives Alternative Destinations th St / Restaurant Row Ahmanson Theatre Angels Flight Broad Museum California Hospital Medical Center California Plaza City Hall Civic Center Park Convention Center El Pueblo de Los Angeles Grand Central Market Historic Broadway Theatre District LA Live Mark Taper Forum Metro Civic Center Station Metro Pershing Square Station Metro 7 th St/Metro Center Station Metro Pico Boulevard Station Metro Regional Connector Hope Station Metro Regional Connector Broadway Station Museum of Contemporary Art Music Center Nokia Theater Olvera Street Ralph s Grocery Store Staples Center Union Station Walt Disney Concert Hall Total
107 4.2.6 Circulation This section addresses circulation issues associated with the alternatives evaluated in final screening. Potential circulation issues were grouped related to transit, traffic, and bicycle/pedestrian. The following highlights the circulation issues associated with each alternative. Transit operations and facilities All alternatives would have transit operation issues on southbound Broadway following the implementation of the Broadway streetscape improvements proposed by a separate project which would reduce southbound Broadway to one lane with no turn lane or turn restrictions; this configuration would make southbound travel time unreliable because of queues created by left and right turning vehicles and pedestrian crossings. All alternatives would have transit operation issues with bus volumes on Broadway and either Grand Avenue or Hill Street. This conflict would affect both bus and streetcar operations depending on the location and stop configuration. The streetcar would be affected by the delay from bus boarding/alighting (especially high floor buses). Alternatives 3, 4, 5, 6, and 7 could affect the shared peak hour travel lane on Hill Street (used by buses and other vehicles between 4p.m. and 7p.m.). The peak hour travel lane and the off peak parking lane use the same travel lane so one or the other would need to be eliminated. Alternatives 1 and 2 would not serve stops on Grand Avenue between 3 rd Street and 6 th Street because of the slope of the elevated bridge structure. Alternatives 1 and 2 do not serve the Metro Pershing Square Station. Alternatives 2, 4, 6, and 7 do not serve the Metro Pico Station. Alternatives 1, 2, 3, 4, and 7 do not serve Union Station. Alternatives 3, 4, 5, 6, and 7 affect the peak hour travel lane or the off peak parking lane on Hill Street. Traffic operations All alternatives would have traffic capacity issues on southbound Broadway following the implementation of the Broadway streetscape improvements proposed by a separate project which would reduce southbound Broadway to one lane with no turn lane or turn restrictions; this configuration would make southbound travel time unreliable because of queues created by left and right turning vehicles and pedestrian crossings. Alternatives 1 and 2 require a contra-flow lane on Grand Avenue between 5 th Street and 9 th Street which requires a southbound lane reduction. Alternatives 3, 4, 5, 6, and 7 would eliminate either the peak hour travel lane or the off peak parking lane on Hill Street. The peak hour travel lane and the off peak parking 99
108 lane use the same travel lane so one or the other would need to be eliminated because the streetcar uses a fixed-guideway and cannot shift lanes depending on time of day. Alternatives 5 and 6 cross US 101 freeway on-ramp/off-ramps which are subject to traffic congestion and high vehicular speeds. Alternatives 1 and 2 require one left turn while Alternatives 3, 4, 5, 6, and 7 require three left turns; left turns sometimes require a transit only signal. Alternative 7 may be affected by traffic congestion on 7 th Street if a proposed lane reduction is implemented. Bicycle/pedestrian integration All alternatives have potential conflict with bicycles because of the inherent conflict between bicycle tires and tracks, particularly at side stops where the distance between the track and the stop narrows and locations where the streetcar curves or turns at an intersection. All alternatives require coordination with a proposed bicycle facility on Figueroa Street Alternative 7 requires coordination with proposed bicycle facility on 7 th Street which may result in an eastbound lane reduction. Alternatives 1 and 2 create one-way loops which limit access in one direction for pedestrians. Alternatives 1 and 2 use a contra-flow lane on Grand Avenue between 5 th Street and 9 th Street, which may impact bicycle and pedestrian movements depending on how the contra-flow lane is designed. Table 27 provides a summary of the circulation issues for each alternative. 100
109 Table 27: Circulation Issues Alternative Issues Transit Operations Stops Transit Integration Expansion Broadway lane reduction Bus volumes on Broadway and Grand Ave Cannot serve stops on Grand Ave between 3 rd St and 6 th St because of elevated bridge structure Bus volumes on Broadway and Grand Ave Does not serve Pershing Square Station Does not serve Union Station No issues identified Broadway lane reduction Bus volumes on Broadway and Grand Ave Cannot serve stops on Grand Ave between 3 rd St and 6 th St because of elevated bridge structure Bus volumes on Broadway and Grand Ave Does not serve Pershing Square Station or Pico Station Does not serve Union Station Broadway lane reduction Bus volumes on Broadway and Hill St Bus volumes on Broadway and Hill St Does not serve Union Station Affects peak hour travel lane on Hill St for Metro Broadway lane reduction Bus volumes on Broadway and Hill St Bus volumes on Broadway and Hill St Does not serve Pico Station Does not serve Union Station Affects peak hour travel lane on Hill St for Metro Broadway lane reduction US 101 freeway onramps/offramps Bus volumes on Broadway and Hill St Bus volumes on Broadway and Hill St Does not serve Regional Connector Hope Station Affects peak hour travel lane on Hill St for Metro Broadway lane reduction US 101 freeway onramps/offramps Bus volumes on Broadway and Hill St Bus volumes on Broadway and Hill St Does not serve Pico Station or Regional Connector Hope Station Affects peak hour travel lane on Hill St for Metro Broadway lane reduction Bus volumes on Broadway and Hill St Bus volumes and loading zones on 7 th St Bus volumes on Broadway and Hill St 7 th St/ Metro Center Station over capacity Does not serve Pico Station Does not serve Union Station 7 th St/ Metro Center Station over capacity 101
110 Table 27 (Continued): Circulation Issues Alternative Issues Traffic Capacity Traffic capacity issues on southbound Broadway following the implementation of the Broadway streetscape improvements which would reduce southbound Broadway to one lane with no turn lane or turn restrictions Travel Lane Contraflow lane on Grand Avenue between 5 th St and 9 th St Contraflow lane on Grand Avenue between 5 th St and 9 th St Peak hour travel/off peak parking lane on Hill St Peak hour travel/off peak parking lane on Hill St Peak hour travel/off peak parking lane on Hill St Peak hour travel/off peak parking lane on Hill St Peak hour travel/off peak parking lane on Hill St Left Turns 1 left turn 1 left turn 3 left turns 3 left turns 3 left turns 3 left turns 3 left turns Bicycle/Pedestrian Bicycle Potential conflict with bicycle and tracks, particularly at turn/curve locations, outside lane streetcar operation, and side stops Conflict with Figueroa bicycle facility as outlined in Figueroa Corridor Project; require potential modification to lane figuration and stops for streetcar or changes to bicycle facility Pedestrian Creates large oneway loop which limits access in one direction Contraflow lane on Grand Ave between 5 th St and 9 th St Creates large oneway loop which limits access in one direction Contraflow lane on Grand Ave between 5 th St and 9 th St No issues identified No issues identified Streetcar operation pedestrian plaza (Paseo de la Plaza) Streetcar operation pedestrian plaza (Paseo de la Plaza) No issues identified 102
111 4.2.7 Design This section addresses potential design issues associated with the alternatives evaluated in final screening. These are issues that would need to be addressed in the next phase after the LPA is selected. Potential design issues were grouped into physical constraints, transit system constraints, and traffic constraints. Physical constraints (street grade, crossings, right-of-way, bridge structures, etc.) Alternatives 1 and 2 require an elevated bridge structure between 4 th Street and 6 th Street to avoid the 14 percent grade on Grand Avenue. Alternatives 1, 2, 3, 4, and 7 use 1 st Street which is 9 percent grade between Grand Avenue and Broadway. Alternatives 1 and 2 require modification of the Grand Avenue bridge deck. Alternatives 3, 4, and 7 require modification of the Grand Avenue bridge deck if it is decided to provide a stop at 3 rd Street and Grand Avenue. Alternatives 5 and 6 require modification of the Main Street and Los Angeles Street bridge decks over US 101. Alternatives 5 and 6 cross US 101 freeway on-ramp/off-ramps, which may require redesign depending on track and stop placement. Transit system constraints (track and guideway, system configuration, expansion, etc.) Alternatives 3, 4, and 7 may require two-way single track operation on 1 st Street between Broadway and Grand Avenue and Grand Avenue between 1 st Street and 2 nd Street or 3 rd Street which may limit streetcar headways and require semi-exclusive right-of-way. Alternatives 5 and 6 may require two-way single track operation on 1 st Street east of Broadway which may limit streetcar headways and require semi-exclusive right-of-way. Alternatives 1 and 2 may have system expansion constraints because elevated bridge structure on Grand Avenue is single track, preventing double-track and two-way loop operation. Traffic constraints (travel lanes, left turns, etc.) Alternatives 1 and 2 require a contra-flow lane on Grand Avenue between 5 th Street and 9 th Street which requires a southbound lane reduction. Alternatives 3, 4, 5, 6, and 7 could eliminate the peak hour travel/off peak parking lane on Hill Street. Alternatives 1 and 2 require one left turn while Alternatives 3, 4, 5, 6, and 7 require three left turns; left turns require a transit only signal. Alternatives 5 and 6 cross US 101 freeway on-ramp/off-ramps which are subject to traffic congestion and high vehicular speeds. Table 28 provides a summary of the design issues for each alternative. 103
112 Table 28: Design Issues Alternative Issues Physical Constraints Street Grade Crossings US 101 freeway onramps/offramps Right-of- Way Bridge Structures 9% grade on 1 st St Elevated bridge structure at 8% required to mitigate 14% grade on Grand Ave No issues identified 9% grade on 1 st St Elevated bridge structure at 8% required to mitigate 14% grade on Grand Ave No issues identified 9% grade on 1 st St No issues identified 9% grade on 1 st St No issues identified No issues identified All alternatives are located within the existing street right-of-way Potential Maintenance and Storage Facility Site to be identified Elevated bridge structure on Grand Ave between 4 th St and 6 th St Grand Ave bridge deck Transit System Constraints System Loop Configura- operation tion Track and Guideway No issues identified Elevated bridge structure on Grand Ave between 4 th St and 6 th St Grand Ave bridge deck Loop operation No issues identified Optional Grand Ave bridge deck Loop operation plus couplet Potential two-way single track operation on 1 st St and/or Grand Ave Optional Grand Ave bridge deck Loop operation plus couplet Potential two-way single track operation on 1 st St and/or Grand Ave No issues identified US 101 freeway onramps/offramps Main St and Los Angeles St bridge decks over US 101 Loop operation plus couplet Potential two-way single track operation on 1 st St No issues identified Main St and Los Angeles St bridge decks over US 101 Loop operation plus couplet Potential two-way single track operation on 1 st St 9% grade on 1 st St No issues identified Optional Grand Ave bridge deck Loop operation plus couplet Potential two-way single track operation on 1 st St and/or Grand Ave 104
113 Table 28 (Continued): Design Issues Alternative Issues Expansion No issues identified Traffic Constraints Travel Lanes Contraflow lane on Grand Avenue between 5 th St and 9 th St Broadway lane reduction Contraflow lane on Grand Avenue between 5 th St and 9 th St Broadway lane reduction Broadway lane reduction Peak hour travel/off peak parking lane on Hill St Broadway lane reduction Peak hour travel/off peak parking lane on Hill St Broadway lane reduction Peak hour travel/off peak parking lane on Hill St US 101 freeway onramps/offramps Broadway lane reduction Peak hour travel/off peak parking lane on Hill St US 101 freeway onramps/offramps Broadway lane reduction Peak hour travel/off peak parking lane on Hill St Left Turns 1 left turn 1 left turn 3 left turns 3 left turns 3 left turns 3 left turns 3 left turns 105
114 4.2.8 Environmental This section identifies potential environmental issues related to each alternative in final screening. Potential environmental issues were identified for each alternative relative to the environmental impact categories: Property Impacts Land Use Communities and Neighborhoods Visual and Aesthetics Historic and Cultural Resources Parklands Noise and Vibration Energy Hazardous Materials Public Safety and Security Soils, Geology and Seismic Ecosystem and Natural Environment Water Quality and Hydrology Air Quality Construction Table 29 provides a summary of potential environmental issues for each alternative. The goal was to determine if there were differences between the alternatives relative to the environmental impact categories. Because the seven alternatives overlap in many locations and there has been limited conceptual design work completed for the alternatives, this table only identified the potential major issues that differentiated the alternatives. Detailed environmental analysis would take place during the subsequent environmental documentation phase to comply with the National Environmental Policy Act (NEPA) and the California Environmental Policy Act (CEQA). The environmental documentation phase would begin after adoption of the LPA. Alternatives 1 and 2 have the most potential environmental issues. This is primarily due to the transportation, visual aesthetic, public safety, and construction issues associated with the elevated bridge structure on Grand Avenue between 4 th Street and 6 th Street as well as the contra-flow lane that would be required for the streetcar between 5 th Street and 9 th Street. Alternatives 1 and 3 have the most potential for sensitive noise and vibration receptors because of the proximity to the California Hospital Medical Center (residential areas were not screened as sensitive noise and vibration receptors but will be evaluated in the environmental documentation phase). Alternatives 4 and 7 have the least environmental issues because of their relative simplicity and avoidance of grade issues and bridge structures. 106
115 Table 29: Potential Environmental Issues Alternative Issues Property Impacts Land Use Community and Neighborhoods Visual and Aesthetics Historic and Cultural Resources Parklands Noise and Vibration No issues identified All alternatives are located within existing street right-of-way and will not require property acquisition Property acquisition will likely be required for the maintenance and storage facility (MSF); MSF site(s) will be identified after identification of the LPA No issues identified All alternatives are compatible with existing and future land use; the PSA is comprised primarily of commercial land use but is seeing a substantial increase in residential land uses Potential gentrification along Broadway and in South Park for all alternatives Elevated bridge structure on Grand Ave between 4 th St and 6 th St Overhead wires Elevated bridge structure on Grand Ave between 4 th St and 6 th St Overhead wires Overhead wires Overhead wires Overhead wires Overhead wires Overhead wires No issues identified All alternatives serve the Historic Core District, which includes the Historic Broadway Theatre District There is no anticipated use or alternation of historic buildings for all alternatives No issues identified All alternatives are located within existing street right-of-way and will not affect parklands during construction and operation Disney Concert Hall Music Center Broadway Historic Theaters California Hospital Medical Center Nokia Theatre Disney Concert Hall Music Center Broadway Historic Theaters Nokia Theatre Disney Concert Hall Music Center Broadway Historic Theaters California Hospital Medical Center Nokia Theatre Disney Concert Hall Music Center Broadway Historic Theaters Nokia Theatre El Pueblo Broadway Historic Theaters California Hospital Medical Center Nokia Theatre El Pueblo Broadway Historic Theaters Nokia Theatre Disney Concert Hall Music Center Broadway Historic Theaters Nokia Theatre 107
116 Table 29 (Continued): Potential Environmental Issues Alternative Issues Energy No issues identified All alternatives would result in an overall conservation of energy that would otherwise be required to transport people within the PSA Hazardous Materials Public Safety and Security Soils, Geology and Seismic Ecosystem and Natural Environment Water Quality and Hydrology All alternatives are located within existing street right-of-way so potential for hazardous materials is low Maintenance and storage facility (MSF) sites will be identified after identification of the LPA; subsequent hazardous materials analysis will be performed on MSF site(s) Elevated bridge structure on Grand Ave between 4 th St and 6 th St (require safe exit routes) Special event operation on Figueroa St (pedestrian conflicts) Elevated bridge structure on Grand Ave between 4 th St and 6 th St (seismic) Elevated bridge structure on Grand Ave between 4 th St and 6 th St (require safe exit routes) Special event operation on Figueroa St (pedestrian conflicts) Elevated bridge structure on Grand Ave between 4 th St and 6 th St (seismic) Grand Ave bridge deck (seismic) Special event operation on Figueroa St (pedestrian conflicts) Grand Ave bridge deck (seismic) Special event operation on Figueroa St (pedestrian conflicts) Grand Ave bridge deck (seismic) Special event operation on Figueroa St (pedestrian conflicts) Streetcar operation in Paseo de la Plaza (pedestrian conflicts) Main St and Los Angeles St bridge decks over US 101 (seismic) Special event operation on Figueroa St (pedestrian conflicts) Streetcar operation in Paseo de la Plaza (pedestrian conflicts) Main St and Los Angeles St bridge decks over US 101 (seismic) Special event operation on Figueroa St (pedestrian conflicts) Grand Ave bridge deck (seismic) No issues identified All alternatives are located with the existing street right-of-way and a highly urbanized area so the potential for natural environment issues is low All alternatives are located with the existing street right-of-way so the potential for water quality and hydrology issues is low and primarily relates to storm water runoff 108
117 Table 29 (Continued): Potential Environmental Issues Alternative Issues Air Quality An air quality hot spot analysis may be necessary if there are significant traffic impacts to intersections Construction Longer construction phasing and sequence because of elevated bridge structure on Grand Ave between 4 th St and 6 th St Modification to Grand Ave bridge deck would increase construction duration Longer construction phasing and sequence because of elevated bridge structure on Grand Ave between 4 th St and 6 th St Modification to Grand Ave bridge deck would increase construction duration Modification to Grand Ave bridge deck (if extended south to 3 rd St) could increase construction duration Modification to Grand Ave bridge deck (if extended south to 3 rd St) could increase construction duration Modification to Main St and Los Angeles St bridge decks over US 101 would increase construction duration Modification to Main St and Los Angeles St bridge decks over US 101 would increase construction duration Modification to Grand Ave bridge deck (if extended south to 3 rd St) could increase construction duration 109
118 4.2.9 Economic Development This section details the economic development potential for each alternative in final screening. The analysis focused on the potential for new development for the area south of 9 th Street in the South Park district of Downtown Los Angeles. In other areas of the PSA, the alternatives either share common alignments or are located in areas with limited opportunities for economic development. While Broadway has immense economic development potential, all of the alternatives share a common alignment on Broadway between 1 st Street and 11 th Street and therefore it is not possible to differentiate between the alternatives in this segment. In addition, most of the other areas of the PSA (Financial Core, Bunker Hill, Union Station, etc.) are relatively built-out with limited opportunity for new development or redevelopment. In order to compare economic development potential in the South Park, an inventory of surface parking lots and vacant lots was taken in the area. These lots have the lowest land use intensity and are the most likely to develop in the future. The analysis was divided into two zones: (1) parcels within 350 feet (approximately one east-west block) and (2) parcels within 750 feet (approximately two east-west blocks). Table 30 provides a summary of the economic development potential in South Park. Figures 45 and 46 illustrate the surface parking lots and vacant lots within the 350 feet and 750 feet buffer. Table 30: Economic Development Potential Buffer Alternatives 1, 3, and 5 (Pico Blvd) Alternatives 2, 4, 6, and 7 (11 th St) 350 feet (1 block) acres acres 750 feet (2 blocks) acres acres The analysis showed that the alternatives using Pico Boulevard (Alternatives 1, 3, and 5) provide a 20 percent increase in economic development potential within 1 block and 26 percent increase within 2 blocks in economic development potential relative to the alternatives using 11 th Street (Alternatives 2, 4, 6, and 7). This correlates to an additional 6.58 acres within one block and acres within two blocks of Alternatives 1, 3, and 5 due to greater opportunities around Pico Boulevard. 110

119 Figure 45: Surface Parking and Vacant Lots (Alternatives 1, 3, and 5) 111

")
120 Figure 46: Surface Parking and Vacant Lots (Alternatives 2, 4, 6, and 7) 112
121 Results of Final Screening The following summarizes the results of the final screening for each alternative. Table 31 shows the ridership, capital cost, operation and maintenance (O&M) cost, and cost per user results for each alternative. Table 31: Summary of Ridership and Cost Results Ridership Daily Boardings Annual Cost Alternative Boardings Per Mile Capital Cost O&M Cost per User 1 9,090 2,370 $115,499,000 $5,318,000 $ ,390 2,230 $107,807,000 $5,318,000 $ ,880 2,300 $119,053,000 $6,148,000 $ ,180 2,160 $106,367,000 $5,318,000 $ ,190 2,170 $137,895,000 $7,442,000 $ ,500 2,040 $130,438,000 $6,916,000 $ ,390 2,210 $106,761,000 $5,318,000 $1.33 Note: Cost per User = (Annualized Capital Cost + Annualized O&M Cost) / Daily Boardings Table 32 shows the results of the final screening using the final screening criteria. The alternatives were rated High (1), Medium (2), or Low (3) for each criteria, with High (1) meaning optimal performance and Low (3) indicating sub-standard performance. All of the criteria were weighted equally for the final screening. 113
122 Table 32: Final Screening Results Alternative Criteria Summary Ridership Alternatives 1, 3, 6, and 7 have the highest combined average of daily boardings and boardings per mile Capital Costs Alternative 4 ($106.4 million) and Alternative 7 ($106.8 million) have the lowest capital cost O&M Costs Alternatives 1, 2, 4, and 7 ($5.3 million) have the lowest O&M cost Cost/Benefit Alternatives 1 and 3 ($1.28) have the lowest cost per user, followed by Alternative 7 ($1.33), Alternative 5 ($1.34), and Alternative 4 ($1.36) Destinations Alternatives 1, 2, 3, 4, and 7 serve Bunker Hill, while Alternatives 5 and 6 serve Union Station Circulation Alternatives 1 and 2 cannot serve stops on Grand Ave between 3 rd St and 6 th St because of elevated bridge structure Alternatives 5 and 6 cross US 101 freeway onramp/off-ramps Design Alternatives 1 and 2 require an elevated bridge structure on Grand Ave Alternatives 1 and 2 require modification of the Grand Ave bridge deck Alternatives 5 and 6 require modification of the Main St and Los Angeles St bridge decks over US 101 Environmental Alternatives 1 and 2 have the most potential environmental issues because of elevated bridge structure on Grand Ave Economic Development Alternatives 1, 3, and 5 (Pico Blvd) have more economic development potential than Alternatives 2, 4, 6, and 7 (11 th St). Total The lower the score equals the higher the performance of the alternative. High (1) = Optimal Performance, Medium (2) = Moderate Performance, and Low (3) = Substandard Performance. 114
123 Table 33 shows the final rankings of the alternatives evaluated in final screening. Overall, the lower the score equals the higher the performance of the alternative. Table 33: Ranking of Alternatives after Final Screening Rank Alternative Total Points 1 Alternative Alternative Alternative Alternative Alternative (tie) Alternative (tie) Alternative 6 21 Note: The lower the score equals the higher the performance of the alternative. 4.3 Final Screening/Locally Preferred Alternative (LPA) Recommendation Based on the results of the final screening evaluation, which examines the ability of an alternative to meet the purpose and need of the project, Alternative 7 was recommended as the LPA. Alternative 7 was recommended as the LPA because: It was tied for highest combined average of daily boardings and boardings per mile. It had the lowest capital cost. It was tied for the lowest operation and maintenance cost. It had the third lowest cost per user. It had the fewest number of potential circulation, design, and environmental issues. It received a high level of community support. It had the most potential for generating revenue through a property assessment. The LPA includes a service connection on 7 th Street between Hill Street and Broadway to provide operational flexibility. The LPA also includes an alternative alignment that would use 9 th Street between Figueroa Street and Hill Street instead of 7 th Street. This is the same alignment as Alternative 7 (except it uses 9 th Street instead of 7 th Street as in Alternative 4). This alternative alignment is being included because: The Los Angeles Department of Transportation (LADOT) is proposing a potential lane reduction on 7 th Street that includes the addition of bicycle lanes. This project has not been designed, so it is unclear if it would affect the LPA on 7 th Street. Identifying an alternative alignment provides a contingency plan for the LPA should the LADOT project preclude streetcar operation on 7 th Street. 115
124 Metro and LADOT will continue to work together on both projects, including during the advanced conceptual engineering and environmental documentation phases. In addition, the LPA includes a variation to extend the terminus south on Grand Avenue from 2 nd Street to 3 rd Street. This variation is being proposed to maximize flexibility for stop and terminus locations on Grand Avenue. The LPA is described in Table 34 and shown in Figure 47. Table 34: Final Screening/LPA Recommendation Recommendation Alternative 7 Description Southbound on Broadway between 1 st St and 11 th St, westbound on 11 th St between Broadway and Figueroa St, northbound on Figueroa St between 11 th St and 7 th St, eastbound on 7 th St between Figueroa St and Hill St, northbound on Hill St between 9 th St and 1 st St, westbound on 1 st St between Hill St and Grand Ave, two-way on Grand Ave between 1 st St and 2 nd St, and eastbound on 1 st St between Grand Ave and Broadway Future Extension to Union Station While Alternative 7 was recommended as the LPA, there remains strong support for a connection to Union Station (as shown in Alternatives 5 and 6 earlier). Therefore, it was recommended that an extension to Union Station be evaluated in a future study. This extension could function as a second streetcar line paired with Bunker Hill or South Park. 116
125 Figure 47: Final Screening/LPA Recommendation 117
126 This page intentionally left blank
127 Appendices Appendix A
128 This page intentionally left blank


129 Technical Memorandum Date: October 4, 2011 To: From: Subject: Jim Hecht, HDR Fehr & Peers Preliminary Estimates of Ridership for the Downtown Los Angeles Streetcar 1.0 Description of Methodology Traditional methods of forecasting transit ridership often employ regional travel demand models to predict ridership. Such models are relatively unresponsive to changes in station level land use and transit service characteristics. In the case of Los Angeles, the large sizes of the traffic analysis zones in the Metro travel demand model preclude detailed land use data collection and differentiation at the station level. Furthermore, the Metro travel demand model does not have a streetcar calibrated mode, meaning its use would require calibration and validation of a new streetcar mode of travel in the model. Alternatively the streetcar would have to be classified using a mode that currently exists in the model such as bus or light rail, which have different ridership characteristics than streetcar. Therefore, for the purposes of the (AA) Study, we have chosen not to use the Metro travel demand model for forecasting Downtown Los Angeles Streetcar (LA Streetcar) ridership and instead use a Direct Ridership Model calibrated and validated to streetcar for ridership forecasting. Direct Ridership Models (DRMs) are directly and quantitatively responsive to land use and transit service characteristics within the immediate vicinity and within the catchment area of transit stations. They can predict ridership at individual stations based on local station area and system characteristics. DRMs are based on empirical relationships found through statistical analysis of station ridership and local station characteristics. The effects of station level variables are expected to be highly significant in accurately forecasting streetcar ridership. While streetcar systems are used for traditional commute trips, our research with transit agencies suggests they more often provide access and circulation for downtown or city center areas. They serve tourist needs and often duplicate existing transit service provided by bus. Thus, it was expected that individual station area characteristics greatly affect boardings and overall ridership projections. Recognizing that variables affecting streetcar ridership are different than those for regional rail systems, the basis for analysis draws from the characteristics of existing streetcar systems in Portland, Seattle, and Tacoma. These systems were chosen because they are most similar to the proposed LA Streetcar. Fehr & Peers Page 1 October 4, 2011
November 28, 2012 ALTERNATIVES ANALYSIS PUBLIC MEETING
 November 28, 2012 ALTERNATIVES ANALYSIS PUBLIC MEETING Project Background Description of the Project Alternatives Analysis Process Project Progress Activity Stations Comments Adjourn 2 VIA spent 2 years
METRO SHORT RANGE TRANSIT PLAN FY Executive Summary May 2009 DIVERSIFIED TRANSPORTATION SOLUTIONS
 METRO SHORT RANGE TRANSIT PLAN FY 2010 2014 2014 Executive Summary May 2009 DIVERSIFIED TRANSPORTATION SOLUTIONS OVERVIEW Purpose of Metro SRTP Develop multi year strategic plan to improve transit quality,
Station Location Feasibility Study
 Station Location Feasibility Study Gateway Cities Gateway Cities Service Council Meeting May 11, 2017 Gateway Cities Service Council Meeting May 11, 2017 1 Meeting Purpose Introduce and present the Metrolink
Downtown Boise Multimodal Center
 Treasure Valley High Capacity Transit Study Downtown Boise Multimodal Center Environmental Assessment June 2009 Prepared by the Federal Transit Administration and Valley Regional Transit. U.S. Department
Public Outreach Overview Tuesday, September 27. COTA William J. Lhota Building 33 N. High St. Columbus, OH 43215
 Public Outreach Overview Tuesday, September 27 COTA William J. Lhota Building 33 N. High St. Columbus, OH 43215 Project Overview Goals and Overview Create a community vision for the future of public transportation
Council of State Governments. Takoma Langley Transit Center Purple Line Project Briefing. October 28, 2013
 Council of State Governments Takoma Langley Transit Center Purple Line Project Briefing October 28, 2013 Takoma Langley Transit Center Purpose and Need Provide a safe, attractive and efficient facility
Dallas Streetcar Central Link Locally Preferred Alternative Selection
 Dallas Streetcar Central Link Locally Preferred Alternative Selection Mobility Solutions, Infrastructure & Sustainability Committee August 28, 2017 Tanya Brooks, Assistant Director Mobility and Street
The Blue Line Extension
 The Blue Line Extension NORTH CAROLINA JOINT TRANSPORTATION OVERSIGHT COMMITTEE Presented by Carolyn Flowers CATS Chief Executive Officer Raleigh, NC February 10, 2012 Overview Charlotte Area Transit System
MARTA BOARD OF DIRECTORS OCTOBER 4, 2018
 MARTA BOARD OF DIRECTORS OCTOBER 4, 2018 TODAY S AGENDA o Key driver of the program o Recommended plan o Project summaries o Next steps 2 KEY DRIVER: PUBLIC INPUT o Atlanta City Design o Atlanta s Transportation
vision42
 vision42 www.vision42.org vision4 auto-free light rail 2 boulevard for 42nd Street Roxanne Warren, AIA, Chair George Haikalis, ASCE, Co-Chair Institute for Rational Urban Mobility,Inc. www.vision42.org
Evolution of TOC. Joint Development Program TOD Land Use/Planning Grants Transit Supportive Toolkit Union Station Redevelopment
 Transit Oriented Communities October 12, 2018 Evolution of TOC Joint Development Program TOD Land Use/Planning Grants Transit Supportive Toolkit Union Station Redevelopment First/Last Mile Strategy Systemwide
Board of Directors April 25, BART The Next 40 Years BART Metro Vision Update Enhancing Service, Capacity and Coverage
 Board of Directors April 25, 2013 BART The Next 40 Years BART Metro Vision Update Enhancing Service, Capacity and Coverage Agenda Project background Update on progress of study Review evaluation process
Looking Ahead. A Context for the Next Twenty Year Needs Assessment. July 2013
 Looking Ahead A Context for the Next Twenty Year Needs Assessment July 2013 A Larger Context for Twenty Year Needs Growing transit demand and complexity of travel paths and times Growing economy changing
Herzog History. and the future of transportation
 Herzog History and the future of transportation How It all Began 1969 Herzog Contracting Corp. was founded on May 7, 1969 by William Bill Herzog as an asphalt paving contractor on the guiding principles
Organization Name Name of Community Zip Code
 Service Planning Area (SPA): Using your school's zip code, locate the Service Planning Area (SPA) in which your school is located. You will need your school's SPA number when completing the FEDCO application.
Denver Moves: Transit Task Force
 Insert transit picture Denver Moves: Transit Task Force Meeting #5 April 6, 2017 1. Welcome & Introductions Opening remarks and housekeeping Task Force and audience introductions 2 4/6/2017 Task Force
Los Angeles County One Gateway Plaza 2i3.g Tel Metropolitan Transportation Authority Los Angeles, CA metro.net
 Metro Los Angeles County One Gateway Plaza 2i3.g22.2000 Tel Metropolitan Transportation Authority Los Angeles, CA 90012-2952 metro.net PLANNING AND PROGRAMMING COMMITTEE JULY 14,2010 SUBJECT: BUENA VISTA
Proposed FY 06 Project Development Program and FY 05 Project Development Program Update
 Washington Metropolitan Area Transit Authority Proposed FY 06 Project Development Program and FY 05 Project Development Program Update Presented to the Board of Directors: P D E C Planning & Development
Making Mobility Better, Together JANUARY 31, 2013 AUSTIN CITY COUNCIL PROJECT CONNECT REGIONAL TRANSIT UPDATE
 Making Mobility Better, Together JANUARY 31, 2013 AUSTIN CITY COUNCIL PROJECT CONNECT REGIONAL TRANSIT UPDATE Achieving Compact & Connected Engaging in a regional transit discussion Pursuing a compact
GORE BUILDING. 238 N. Massachusetts Avenue, Lakeland, FL 33801
 GORE BUILDING 238 N. Massachusetts Avenue, Lakeland, FL 33801 CDB LOCATION REDEVELOPMENT PROJECT MUNN PARK HISTORIC DISTRICT INCENTIVES AVAILABLE ADJACENT PARKING INCLUDED BK698301 Phone: (863) 683-3425
TRANSIT CENTER DISTRICT PLAN
 TRANSIT CENTER DISTRICT PLAN Informational Presentation Planning Commission 04.19.2012 San Francisco Planning Department In partnership with: San Francisco Redevelopment Agency Transbay Joint Powers Authority
Next Steps. Investing in the Future of. MASTER DEVELOPER PROCUREMENT OVERVIEW October 2016 July Chicago Union Station Chicago Union Station
 Investing in the Future of Chicago Union Station Chicago Union Station MASTER DEVELOPER PROCUREMENT OVERVIEW October 2016 July 2015 Next Steps 1 Chicago Union Station Operations 4 th busiest station in
S-03-SegB: South Federal Way to Fife LRT
 Project Number S-03-SegB Subarea South King/Pierce Primary Mode Light Rail Facility Type Corridor Length 4.0 miles Version ST Board Workshop Date Last Modified 11-25-2015 PROJECT AREA AND REPRESENTATIVE
EXTENDING RED/PURPLE LINE REVENUE SERVICE TO EAST SIDE OF DOWNTOWN LOS ANGELES/ARTS DISTRICT
 16 One Gateway Plaza Los Angeles, CA 90012-2952 213.922.2000 Tel metro. net PLANNING AND PROGRAMMING COMMITTEE MARCH 18, 2015 SUBJECT: ACTION: EXTENDING RED/PURPLE LINE REVENUE SERVICE TO EAST SIDE OF
Traffic Impact Study for the TAVA Homes Project at 1584 East Santa Clara Avenue in the City of Santa Ana
 Traffic Impact Study for the TAVA Homes Project at 1584 East Santa Clara Avenue in the City of Santa Ana March 2011 Prepared for: URS Corporation 2020 E. First Street, Suite #400 Santa Ana, CA 92705 Tel:
PLANNING COMMISSION JUNE 7, 2018 PUBLIC HEARING
 PLANNING COMMISSION JUNE 7, 2018 PUBLIC HEARING SUBJECT: MUNICIPAL CODE AMENDMENT TO UPDATE TITLE 10, VEHICLES AND TRAFFIC, AND TITLE 19, ZONING ORDINANCE, WEST HOLLYWOOD MUNICIPAL CODE TO AMEND THE TRANSPORTATION
PROPOSED SOUTH LOS ANGELES COMMUNITY PLAN Transportation Improvement & Mitigation Program (TIMP) Draft Version 2.2
 Draft Version 2.2") PROPOSED SOUTH LOS ANGELES COMMUNITY PLAN Transportation Improvement & Mitigation Program (TIMP) October 2016 Submitted to: 17J17 0080 Prepared by Iteris, Inc. City of Los Angeles Department of City Planning
PROPOSED SOUTH LOS ANGELES COMMUNITY PLAN Transportation Improvement & Mitigation Program (TIMP) October 2016 Submitted to: 17J17 0080 Prepared by Iteris, Inc. City of Los Angeles Department of City Planning
Metrobus 30s Line Enhancements
 Customer Service, Operations and Safety Committee Action Item III-C February 14, 2008 Metrobus 30s Line Enhancements Washington Metropolitan Area Transportation Authority Board Action/Information Summary
Hennepin Avenue Downtown
 Hennepin Avenue Downtown Construction Kick-off Meeting Stakeholders, Owners, Managers January 14 & 17, 2019 Agenda Summary Background Principles Scope, Schedule, Budget Construction Utilities Roadway What
Des Moines Area Regional Transit Non Rider Survey
 Moines Area Regional Transit Non Rider Survey helping organizations make better decisions since 1982 Findings Report Submitted to the Moines Area Regional Transit Authority by: ETC Institute 725 W. Frontier
VTA s BART Silicon Valley Phase II Extension Project San Jose Downtown Association
 VTA s BART Silicon Valley Phase II Extension Project San Jose Downtown Association August 24, 2017 THANK YOU! San Jose Downtown Association for inviting us & San Jose First United Methodist Church for
Transportation Demand Management (TDM) Plan
 Plan") Transportation Demand Management (TDM) Plan WELCOME TO COMMUNITY MEETING #2 AGENDA 5:30 6:10 PM Presentation, including Q&A 6:10 PM Open House 6:30 PM Meeting Adjourns Please sign in and fill out a comment
Transportation Demand Management (TDM) Plan WELCOME TO COMMUNITY MEETING #2 AGENDA 5:30 6:10 PM Presentation, including Q&A 6:10 PM Open House 6:30 PM Meeting Adjourns Please sign in and fill out a comment
An Assessment of Congestion in the Kansas City Region using the MARC Travel Demand Model
 An Assessment of Congestion in the Kansas City Region using the MARC Travel Demand Model The Congestion Management Process Federal Regulations state that all metropolitan planning organizations must carry
Welcome! Visioning Workshop. 24 March 2015
 Welcome! Visioning Workshop 24 March 2015 5:30p.m. Open House and Check-in 6:00 p.m. Opening Remarks 6:10 p.m. Overview Presentation 6:25 p.m. Discussion 7:00 p.m. Report back 7:10 p.m. Wrap-up Overview
The Maryland Transit Administration. A Plan to Connect Baltimore
 The Maryland Transit Administration A Plan to Connect Baltimore 1 What We ve Heard Over 1,100 stakeholder comments submitted through the Bus Network Improvement Project (BNIP) Six workshops, three pop-up
Approval of Navy Yard Chiller Joint Development Agreement
 Planning, Program Development and Real Estate Committee Item V B July 9, 2015 Approval of Navy Yard Chiller Joint Development Agreement Washington Metropolitan Area Transit Authority Board Action/Information
High Speed Rail Update
 Update Mobility Solutions, Infrastructure and Sustainability Committee October 8, 2018 Brady Redwine Vice President Texas Central Molly Carroll Executive Director Project City of Dallas 1 Presentation
Policy Section VI: B 2: Assignment of Clubs to Districts, Divisions, and Areas and the District Alignment web page, which states:
 August 27, 2016 APPENDIX DIVISION BOUNDARIES Policy Section VI: B 2: Assignment of Clubs to Districts, Divisions, and Areas and the District Alignment web page, which states: Align newly-chartered clubs
Deployment of ITS Projects in Pasadena A Local Agency Perspective
 Deployment of ITS Projects in Pasadena A Local Agency Perspective ITS California Annual Meeting October 2, 2013 Norman Baculinao, PE Pasadena and the Region Source: Census Transportation Planning Package,
1.0 PURPOSE AND NEED
 1.0 PURPOSE AND NEED This chapter documents the need for transit improvements in the Northwest Corridor and the purposes that the proposed project is intended to serve. An overview of the study corridor
Traffic Impact Analysis
 LA PALMA VILLAGE INITIAL STUDY CITY OF ANAHEIM Appendices Appendix I Traffic Impact Analysis September 2015 LA PALMA VILLAGE INITIAL STUDY CITY OF ANAHEIM Appendices This page intentionally left blank.
West of Hudson Regional Transit Access Study
 West of Hudson Regional Transit Access Study Open House Presentation June 1, 2009 1 Agenda 1. Progress to Date 2. Level 1 Screening Analysis 3. Level 2 Screening Criteria 4. Next Steps 5. Questions and
// Atlanta BeltLine Quarterly Briefing
 // Atlanta BeltLine Quarterly Briefing Second Quarter // May 15, 2014 5/20/2014 Atlanta BeltLine // 2014 Page 1 // Agenda Welcome Atlanta BeltLine, Inc. Update Parks, Trails, Transit Art on the Atlanta
BEVRLYRLY STAFF REPORT. Meeting Date: August 4, 2015 Item Number: To: From:
 BEVRLYRLY STAFF REPORT Meeting Date: August 4, 215 Item Number: To: From: Honorable Mayor & City Council Mark Cuneo, City Engineer Aaron Kunz, Deputy Director of Transportation Subject: Update on Metro
Downtown Austin Retail Initiative. City of Austin & Downtown Austin Alliance
 Downtown Austin Retail Initiative City of Austin & Downtown Austin Alliance History of Downtown Retail In 1960 downtown Austin was the retail district serving the city s residential neighborhoods and surrounding
Click to edit Master title style Click to edit Master title style
 Southwest Chief & Front Range Passenger Rail Commission Overview for Transportation Legislative Review Committee November 2, 2017 Presented by: Sal Pace Jacob Riger, AICP November 2, 2017 FIRST WE WERE
Bus Circulator Feasibility Study Scope of Work March 12, 2018
 The City of Hyattsville Comprehensive Transportation and Infrastructure Study Bus Circulator Feasibility Study Scope of Work March 12, 2018 Project Approach At the request of the City of Hyattsville, Toole
NORTH HOUSTON HIGHWAY IMPROVEMENT PROJECT (NHHIP): SEGMENT 3
: SEGMENT 3") NORTH HOUSTON HIGHWAY IMPROVEMENT PROJECT (NHHIP): SEGMENT 3 Varuna A. Singh August 17, 2018 NHHIP OVERVIEW Project divided into three segments: Segment 1: I-45: from Beltway 8 to I-610 (9 mi) 45 Segment
NORTH HOUSTON HIGHWAY IMPROVEMENT PROJECT (NHHIP): SEGMENT 3 Varuna A. Singh August 17, 2018 NHHIP OVERVIEW Project divided into three segments: Segment 1: I-45: from Beltway 8 to I-610 (9 mi) 45 Segment
Agenda Overview. Process Update Overview of Revised Goals Transportation Trends Small Group Breakout Questions and Comments Next Steps Meeting Close
 Agenda Overview Process Update Overview of Revised Goals Transportation Trends Small Group Breakout Questions and Comments Next Steps Meeting Close 2 1. Welcome and Meeting Overview 1. Process Update 3
Los Angeles County Metropolitan Transportation Authority (Metro) Arterial Performance Measures Framework
 Arterial Performance Measures Framework") Los Angeles County Metropolitan Transportation Authority (Metro) Arterial Performance Measures Framework Anita Vandervalk-Ostrander Iteris, Inc. Santa Ana, California, USA Steven Gota, Deputy Executive
Los Angeles County Metropolitan Transportation Authority (Metro) Arterial Performance Measures Framework Anita Vandervalk-Ostrander Iteris, Inc. Santa Ana, California, USA Steven Gota, Deputy Executive
Approval to Negotiate and Execute a Term Sheet for the Navy Yard Chiller Site Joint Development
 Planning, Program Development and Real Estate Committee Item V- B September 11, 2014 Approval to Negotiate and Execute a Term Sheet for the Navy Yard Chiller Site Joint Development Washington Metropolitan
The Westside s Next Creative Address
 JEFFERSON Culver City Project Overview Location 1 Jefferson Boulevard Culver City, California Project Size 132,387 RSF Floor Sizes North Building: South Building: 1st 23,827 1st 20,306 2nd 23,827 2nd 20,300
CLAYTON COUNTY TRANSIT INITIATIVE. Technical Advisory Committee/ Stakeholder Advisory Committee Webinar August 29, 2017
 CLAYTON COUNTY TRANSIT INITIATIVE Technical Advisory Committee/ Stakeholder Advisory Committee Webinar August 29, 2017 AGENDA Welcome! Introduction of Speakers Webinar Housekeeping Project Overview & Status
Crystal Springs Upland School Transportation Demand Management Plan. March 2016
 Crystal Springs Upland School Transportation Demand Management Plan March 06 CONTENTS Introduction... Transportation Demand Management (TDM) Program.... Background/Survey of Existing Student Commuting
4400 WEST 78TH STREET, MINNEAPOLIS, MN
 PROPERTY SPECIFICATIONS BUILDING DESCRIPTION Developed by Ryan Companies in 2008, Two MarketPointe is comprised of 236,000 SF over eight (8) floors. One of the defining features of the building is its
plansa ! City Council Comprehensive Planning Committee August 28, 2014 ! Presented by: John M. Dugan, AICP Director 2040 Comprehensive Plan Initiative
 plansa 2040 Comprehensive Plan Initiative City Council Comprehensive Planning Committee August 28, 2014 Presented by: John M. Dugan, AICP Director Berkeley Denver Los Angeles Sacramento PlanSA 2040 Initiative
PUBLIC WORKS ORGANIZATIONAL CHART
 PUBLIC WORKS ORGANIZATIONAL CHART C-108 Actual 2012-13 Adopted Year-End Estimated 2014-15 2015-16 PROGRAM EXPENSES/REVENUES Salaries & Benefits $ 1,725,030 $ 1,855,980 $ 1,676,130 $ 1,956,510 $ 1,979,470
Recommendation to Board. Final Action
 MOTION NO. M2017-59 City of Seattle Center City Mobility Plan Agreement MEETING: DATE: TYPE OF ACTION: STAFF CONTACT: Operations and Administration Committee PROPOSED ACTION 05/04/2017 05/25/2017 Recommendation
Bill Jackson Asst. Statewide Utility Engineer, Office of Construction MDOT SHA
 Jeff Ensor TDD Chief of Staff Director of Project Development & Delivery MDOT MTA Purple Line Judy Freedman Breckon Director of Property Acquisition MDOT MTA Purple Line Brian Horn Purple Line Real Estate
APPENDIX D. Traffic Impact Analysis
 APPENDIX D Traffic Impact Analysis TRAFFIC IMPACT ANALYSIS CALEXICO SOLAR FARM I County of Imperial, California July 8, 2011 LLG Ref. 3-11-2034 Prepared by: Cara Leone Transportation Planner II Under the
ARTS DISTRICT 2018 E. 8 TH STREET, LOS ANGELES, CA
 DOWNTOWN LOS ANGELES ARTS DISTRICT 2018 E. 8 TH STREET, LOS ANGELES, CA INVESTMENT / OWNER-USER OPPORTUNITY MARKETING BROCHURE WWW.LAREALTYPARTNERS.COM PROPERTY SUMMARY PROPERTY OVERVIEW 2017 E. 8TH STREET
DATE: September 2014 Project Sponsors Rachel Schuett and Transportation Team Transportation Demand Management (TDM) Data Collection
 Data Collection") DATE: September 2014 TO: FROM: RE: Project Sponsors Rachel Schuett and Transportation Team Transportation Demand Management (TDM) Data Collection The San Francisco Planning Department and the San Francisco
DATE: September 2014 TO: FROM: RE: Project Sponsors Rachel Schuett and Transportation Team Transportation Demand Management (TDM) Data Collection The San Francisco Planning Department and the San Francisco
Westside Subway Extension of the Metro Purple Line
 metro.net/works Westside Subway Extension of the Metro Purple Line Station Fact Sheet fall 2012 Background Station Overview Work to bring the Metro Purple Line to the Westside is moving forward, with plans
Veirs Mill Road Metrobus Improvements Request to Conduct Public Hearing
 Customer Services, Operations, and Safety Committee Board Information Item III-B September 24, 2009 Veirs Mill Road Metrobus Improvements Request to Conduct Public Hearing Washington Metropolitan Area
Open house April 26 & 27, 2017
 Open house April 26 & 27, 2017 ROAD MAP ENVIRONMENTAL ASSESSMENT Approved by City Council 2012 and Province of Ontario 2013 LA SALLE CAUSEWAY Traffic Operations Study ACTION PLAN SHOVEL-READY Approved
EMPIRE LAKES. CORPORATE CENTER 9500 Cleveland Avenue Rancho Cucamonga, CA UP TO +51,000 SF CONTIGOUS THOMAS P. PIERIK, SIOR
 UP TO +51,000 SF CONTIGOUS EMPIRE LAKES CORPORATE CENTER 9500 Cleveland Avenue Rancho Cucamonga, CA 91730 THOMAS P. PIERIK, SIOR SENIOR VICE PRESIDENT 951.276.3610 // DRE# 00982027 TPIERIK@LEERIVERSIDE.COM
Integrating Travel Demand Management into the Long-Range Planning Process 2017 AMPO
 Integrating Travel Demand Management into the Long-Range Planning Process 2017 AMPO October 19, 2017 Chattanooga 2045 RTP Chattanooga 2045 RTP addresses both transportation supply and demand Continued
West Seattle and Ballard Link Extensions. Downtown Open House and Neighborhood Forum September 11, 2018
 West Seattle and Ballard Link Extensions Downtown Open House and Neighborhood Forum September 11, 2018 Agenda Why we re here today Alternatives development overview What we heard in Level 1 Level 2 alternatives
Bike Sharing Feasibility Study and Implementation Plan 2012
 Source: Nice Ride (Twin Cities MN) Source: Capital Bikeshare (Washington, DC) City of Cleveland Bike Sharing Feasibility Study and Implementation Plan 2012 November 20, 2013 Toole Design Group BrownFlynn,
Creating Dallas-Fort Worth s Transportation System: Celebrating Partnerships and Milestones
 Creating Dallas-Fort Worth s Transportation System: Celebrating Partnerships and Milestones Presentation to the Texas Transportation Commission August 27, 2014 Presenters Mike Cantrell Commissioner, Dallas
Implementation Plan FY
 Implementation Plan FY 2013 2015 January 18, 2012 Financial Integrity - Address the District's Structural Deficit - Financially support the District's reinvention of its family of services - Promote funding
SAN FRANCISCO MUNICIPAL TRANSPORTATION AGENCY
 THIS PRINT COVERS CALENDAR ITEM NO.: 12 DIVISION: Sustainable Streets BRIEF DESCRIPTION: SAN FRANCISCO MUNICIPAL TRANSPORTATION AGENCY Endorsing proposed legislation amending the Planning Code to adopt
City of Los Angeles Department of Public Works Bureau of Sanitation. Pre-Qualified On-Call Consultant Services Contract
 City of Los Angeles Department of Public Works Bureau of Sanitation Pre-Qualified On-Call Consultant Services Contract Task Order Solicitation (TOS) SN-71 Structural Condition Assessment of the North Outfall
St. Helena Island 5-6 December,
 5-6 December, 2011 Beaufort County Multi-Jurisdictional Form-Based Code Workshop and Charrette Report 2011 Opticos Design, Inc. 154 Beaufort County Multi-Jurisdictional Form-Based Code Workshop and Charrette
Metropolitan Council. Transportation Division Proposed Transit Capital Program
 Metropolitan Council Transportation Division Proposed 2015-2020 Transit Capital Program Transportation Committee October 27, 2014 Goals of the 2015 Capital Program Simplify the process Standardize the
CITY OF KIRKLAND TRAFFIC IMPACT ANALYSIS GUIDELINES
 CITY OF KIRKLAND TRAFFIC IMPACT ANALYSIS GUIDELINES SEPA TRANSPORTATION CONCURRENCY - ROAD IMPACT FEES Introduction Revised February 2004 These guidelines describe how to prepare a traffic study, or Traffic
Transit Oriented Development Best Practices Seminar Series
 Transit Oriented Development Best Practices Seminar Series January 22, 2007 Presented by Jim Prost, AICP, Principal Basile Baumann Prost Cole & Associates 177 Defense Highway, Suite 10 Annapolis, Maryland
7900 HARKINS ROAD Lanham, MD
 7900 HARKINS ROAD 7900 HARKINS ROAD This rare offering represents the opportunity to acquire a best-in-class office asset with guaranteed NNN cash flow for 12 years at a significant discount to replacement
PROJECT TIMELINE. Next steps. Plan. Start of Service
 PROJECT TIMELINE 2018 2019 2020 2021 2022 2023 WE ARE HERE Plan Develop Build Develop design options for termini, station locations, and transit operations Conduct environmental research Assess funding
Report to the HDC JPA
 Report to the HDC JPA Progress Report Transportation Solutions June 1, 2016 Who we are Transportation Solutions Neil Peterson Chief strategic consultant to USDOT FRA s national High Speed Rail Program
GATEWAY. Action Plan JULY Gateway Action Plan DRAFT - July Portland Development Commission
 GATEWAY Action Plan JULY 2016 1 Gateway Action Plan DRAFT - July 2016 - Portland Development Commission INTRODUCTION: The City of Portland, the Portland Development Commission (PDC), and their many partners
After looking at the map here:
 Tuesday, November 24, 2009 10:52 AM Subject: FW: [Metro.net] customer comment Date: Friday, November 20, 2009 3:33 PM From: Regional Connector To: Ginny Brideau ,
CREATING CRITICAL MASS IN THE URBAN CORE
 CREATING CRITICAL MASS IN THE URBAN CORE MICHAEL BALANKY, PRINCIPAL What is Critical Mass In real estate dynamics, critical mass happens when the rate of development becomes selfsustaining and creates
Bremner Transformer Station and Cable Tunnel PROGRESS OF THE CLASS ENVIRONMENTAL ASSESSMENT STUDY
 May 19, 2011 Community Meeting Metro Toronto Convention Centre North Building, Room 203B May 19 th, 2011, 4:30 p.m. to 7:30 p.m. Please sign in and complete a comment sheet Project team members are available
Subject YRRTC Accomplishments and Highlights
 Date May 17, 2018 To Members of York Region Council From Mary-Frances Turner, York Region Rapid Transit Corporation, President Subject 2014-2018 YRRTC Accomplishments and Highlights Ref: Edocs #8410552
Los Angeles Metro Upcoming Tunneling Opportunities
 Los Angeles Metro Upcoming Tunneling Opportunities Westside Subway Extension Regional Connector Crenshaw/LAX Transit Corridor Los Angeles County Metropolitan Transportation Authority 1 Westside Subway
DC Circulator. Transit Development Plan
 DC Circulator Transit Development Plan Draft Final Report March 2011 j Contents EXECUTIVE SUMMARY Executive Summary... 2 Purpose... 4 Planning Process... 4 DC Circulator Strategic Goals and Objectives...
DRAFT INVESTMENT CORRIDORS
 DRAFT INVESTMENT CORRIDORS Mode Studied ID CORRIDOR / ROADWAY FROM TO EXISTING CMTA ROUTES CORRIDOR TYPE BUS RAPID TRANSIT BUS PRIORITY STREET COMMUTER RAIL ELECTRIC BUS RAPID TRANSIT EXPRESS BUS LIGHT
TRANSPORTATION DEPARTMENT Business Plan
 TRANSPORTATION DEPARTMENT 2018 Business Plan Today s Agenda Mission Department Overview Planning Initiatives Commission Priorities and 2018 Budget Requests Five-year Plan Department of Transportation Mission
ARLINGTON COUNTY, VIRGINIA. County Board Agenda Item Meeting of July 16, 2016 SUPPLEMENTAL REPORT
 ARLINGTON COUNTY, VIRGINIA County Board Agenda Item Meeting of July 16, 2016 SUPPLEMENTAL REPORT DATE: July 14, 2016 SUBJECT: Adoption of the Fiscal Year (FY) 2017-2026 Transit Development Plan (TDP).
U.S. System Summary: OHIO HUB
 U.S. System Summary: OHIO HUB Ohio Hub High-Speed Rail System (Source: Ohio Hub Study, 2007) The Ohio Hub high-speed rail system is a system of proposed routes containing 864 miles in four segments with
APPENDIX A TDM Development Guideline
 Appendix A: TDM Development Guideline APPENDIX A TDM Development Guideline Appendix A: TDM Development Guideline Page A.1 1 INTRODUCTION AND OVERVIEW 1.1 About This Guideline This guideline contains information
City Council Report 915 I Street, 1 st Floor
 Meeting Date: 6/16/2015 Report Type: Consent Report ID: 2015-00512 04 City Council Report 915 I Street, 1 st Floor www.cityofsacramento.org Title: Capital Improvement Program: Central City Lighting (T15155200)
Moving Forward with Transit Oriented Communities
 Moving Forward with Transit Oriented Communities Planning & Development Committee October 7, 2014 Packet Pg. 33 History of TOD at RTD Mid 1990s - Local jurisdictions start planning for TOD 2000 RTD hires
DOWNTOWN INDUSTRIAL CORE Data and Recommendations
 DOWTOW IDUSTRIAL CORE Data and Recommendations SUMMARY DATA 620.4 Total Acres of Land 52% Light Industrial Use 0% Heavy Industrial use 2% Residential Use 29% Commercial Use 19% Other 5.393 Businesses 788
Calipatria Solar Farm TIA
 Calipatria Solar Farm TIA Prepared for: 7SM 8ME, LLC 71SM 8ME, LLC c/o 8minutenergy Renewables LLC Prepared by: Fehr & Peers March 25, 211 IE1-37 TABLE OF CONTENTS Executive Summary... i Project Trip Estimates...
Continual Innovation Through Diverse Funding Sources. Paul Comfort, Esq. CEO, Maryland Transit Administration
 Continual Innovation Through Diverse Funding Sources Paul Comfort, Esq. CEO, Maryland Transit Administration Problem Statement and Solution Issue: Funding continues to dry up Declining Federal Formula
EASTSIDE CITY OF BELLEVUE/ PRIVATE PRIVATE PRIVATE MULTI-PRIVATE MULTI-PRIVATE
 SITE COMPARISON CHART CITY Bellevue County Kirkland Kirkland Redmond ADDRESS 555 116th Ave. Lane 118th Ave. 14955 90th St. ACREAGE 5.6 10.7 7.5 5.5 7.2 to 11.6 ACRES ZONING COMMERCIAL LIGHT INDUSTRIAL
4800 HARRY HINES BLVD Dallas, TX REDEVELOPMENT OPPORTUNITY in the na on s busiest medical district
 4800 HARRY HINES BLVD Dallas, TX 75235 REDEVELOPMENT OPPORTUNITY in the na on s busiest medical district 4800 HARRY HINES BLVD Dallas, Texas 75235 INVESTMENT HIGHLIGHTS JLL is pleased to present a rare
Transportation & Mobility
 Transportation & Mobility October 11, 2017 October 11, 2017 Community Dialogue Series Session 3: Transportation & Mobility YOU ARE NOT STUCK IN TRAFFIC. YOU ARE TRAFFIC. October 11, 2017 Community Dialogue