Tutorial for analyzing and mapping contaminated sites data
|
|
|
- Edwin Andrews
- 5 years ago
- Views:
Transcription
1 Tutorial for analyzing and mapping contaminated sites data The federal government oversees thousands of sites that are contaminated with a number of pollutants such as petroleum hydrocarbons, a mixture of chemicals found in crude oil, that carry a collected liability in the billions of dollars. Echoing the Environment Commissioner s concerns, the Parliamentary Budget Office has warned the government that it must get this problem under control. What s worse, there are still sites, many in and near towns and cities, that have yet to be assessed for contaminants. So this is a huge problem that we should be monitoring and holding government to account. Fortunately, the data is readily available, meaning that tables can be downloaded into Excel, and then filtered for interesting subsets that can be uploaded to Google s Fusion Tables. Though there have been lots of stories about the most contaminated sites, little attention has been paid to sites that have yet to be assessed but are suspected of being toxic, potentially dangerous, and expensive to clean up. So let s look at those, identify the federal departments that have the highest number and map them, allowing our audience to see where they re located. Let s get started.
2 1) Go to the Treasury Board of Canada table entitled Find Sites by Classification 2) Download the Active sites in the Site(s) not yet classified section. 3) We had trouble importing the XML tab using our Macs. There are a number of workarounds discussed in this NICAR discussion thread that responded to our request for help. 4) You can explore some of the options they discussed. Failing that, download the Excel worksheet that contains the file of sites we will map. 5) Please click here to download the Excel file.


3 6) The original worksheet is in the XML format and quite messy. So we ll need to clean it up. 7) Select the entire worksheet, copy and paste it as a paste special into a new worksheet. For Mac users, be sure to select the values option in the dialog box.

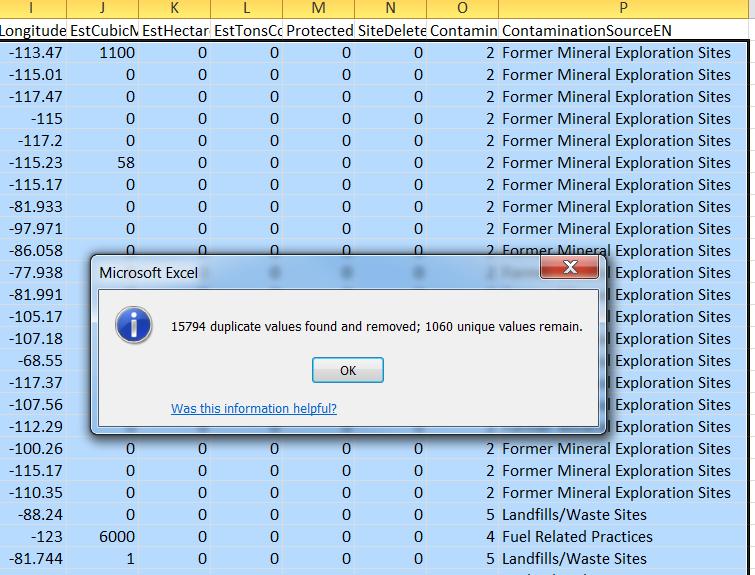
4 8) Now we ll have to clean it up and remove the duplicates. Highlight rows two and three and delete them.

5 9) Delete the columns A to F.

 and delete")
6 10) Use you short-cut key to select the columns I ve highlighted (either because they are in French or otherwise extraneous to this exercise) and delete them.
 You should be left with a table with columns A to P with the all-important Latitude and Longitude, geographic information Fusion Tables will need to place the sites on a map.")
7 11) Highlight the columns after P ContaminationSourceEN for the same reasons described above. 12) You should be left with a table with columns A to P with the all-important Latitude and Longitude, geographic information Fusion Tables will need to place the sites on a map. 13) Now we have to get rid of the duplicates. 14) Make sure cell A1 is activated and locate your Remove Duplicates option, which should be on your menu ribbon above the table.


8 15) 16) Unselect, and then select the first column, the FederalSiteIdentifier.

9
 Mapping this many records randomly is an option, but wouldn t it be better to use a bit of analysis, creating, for instance, a table of top-five departments with the largest number of sites.")
10 17) Selecting OK, leaves you with 1060 Records or unique values, the same number contained in the table on the Treasury Board s website. 18) Mapping this many records randomly is an option, but wouldn t it be better to use a bit of analysis, creating, for instance, a table of top-five departments with the largest number of sites. 19) To do this, we ll have to create a pivot table, grouping the departments in column D ( DOB_Name_EN ), counting the ID numbers (now free of duplicates ), and sorting the result in descending order. 20) Be sure to format your number in the pivot table s column B., label the worksheet, and drag the tab to the right of your
 This is kind of duplication is common with databases. For remember the adage: all data is dirty.")
11 WorkingCopy tab so that everything reads from left-to-right. 21) We have a slight problem in devising our top-five. Rows four and six are the same department, as are rows five and nine. 22) This is kind of duplication is common with databases. For remember the adage: all data is dirty. (NOTE: Discussed in our textbook, beginning on page 99) 23) Let s return to your workingcopy worksheet, and filter for Fisheries and Oceans Canada and the Department of Fisheries

12 and Oceans. 24) The problem is, because the departments are named differently, Excel assumes they are actually separate and treats them as such. So we have to make sure they re all named the same. Because Fisheries and Oceans Canada is the first name in the list, list copy it all the way own to the end by highlighting that cell and double-clicking on its bottom right-hand corner.

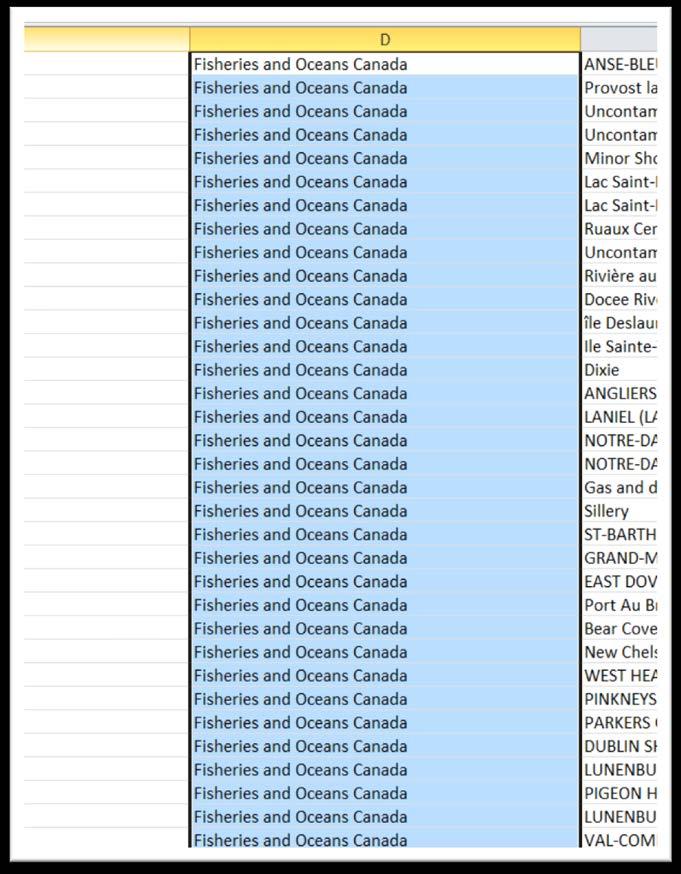
13

14 25) Return to your pivot table and click the refresh button

15 26) Now there is only one fisheries department.
 Return to the workingcopy worksheet.")

16 27) Repeat the process for Aboriginal Affairs. 28) Now we have our top-five departments. 29) Return to the workingcopy worksheet. 30) Filter for the five departments on our top-five list, copy the filtered table, and paste it into a new worksheet, labeled TopFive. 31) Insert a new column to the right of column D, DOB_Name. 32) Call the column FT_Colour (FT for Fusion Table).
 35) The large_red will represent the highest number; the large_yellow the second; the large_green the third; the large_blue the fourth; the large_purple the fifth.")
17 33) In this column, we will assign different coloured icons FT uses to distinguish the points it places on a map. 34) 35) The large_red will represent the highest number; the large_yellow the second; the large_green the third; the large_blue the fourth; the large_purple the fifth. 36) Filter your new worksheet, and assign the icons to each department as you can see in the next succession of screen shots.

18

19

20

21
 Clear the filter, copy the table and paste it into a new file we ll call TopFiveContaminatedSitesToBeAssessed.")
22 37) Double check to make sure all the rows in column E are filled in. The easiest way to do this is apply the filter, and check that column E s drop-down menu contains no blanks. If it does, they will have to be filled in with the appropriate coloured icons. 38) Clear the filter, copy the table and paste it into a new file we ll call TopFiveContaminatedSitesToBeAssessed.xlsx 39) Go to your Google Drive.
23 40) Import our new workbook into the Fusion Table.
24
 Now we ll have to get the Fusion Table to recognize the colours we ve")
25 41) Select the Map of Latitude tab to see the result. 42) Now we ll have to get the Fusion Table to recognize the colours we ve assigned to each department.

26 43) Select the Change feature styles tab.
27 44) The Marker icon section under the Points section. 45) Select the Column tab, and then the column FT_markers that contains the icons.
28
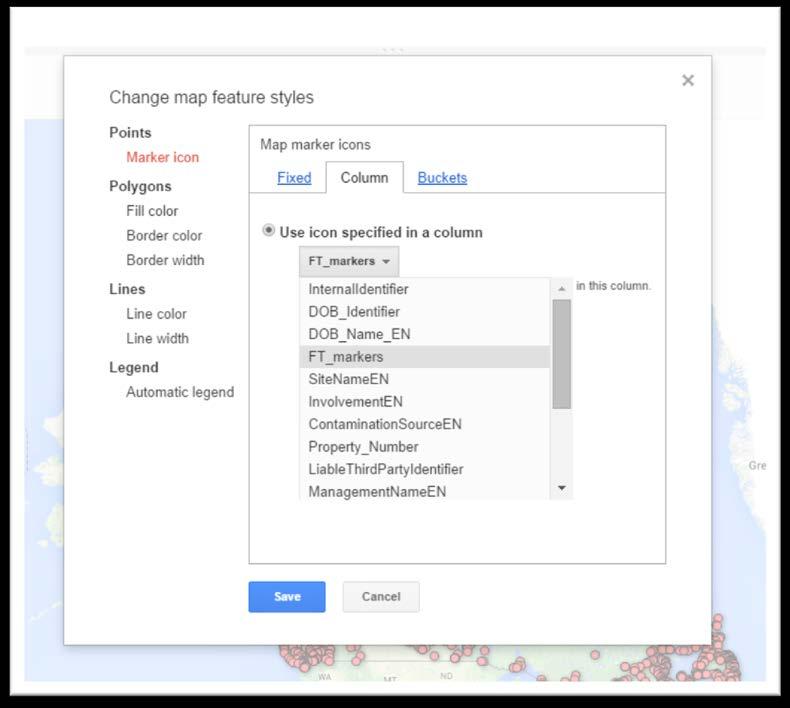
29

30 46) Save the result.

31 47) Click on one of the icons to read the contents in the pop-up box.

32 48) It s too busy!!! Click on the Change info window tab to deselect the information we don t need.
 You could also Select the ContaminationSourceEN field, which describes the nature of the site: landfill, industrial, military site, etc.")
33 49) Let s stick with two columns: the department DOB_Name_EN and SiteNameEN. 50) You could also Select the ContaminationSourceEN field, which describes the nature of the site: landfill, industrial, military site, etc. 51) If you wanted to create a map with one department, you can simply filter the map by selecting the Filter option from the menu at the top, selecting the column you want to filter just like
 Since we want people to select from all departments, let s clear the filter and share")
34 in Excel which in this case is the FT_markers. 52) Choose the top department. 53) Since we want people to select from all departments, let s clear the filter and share the result.

35
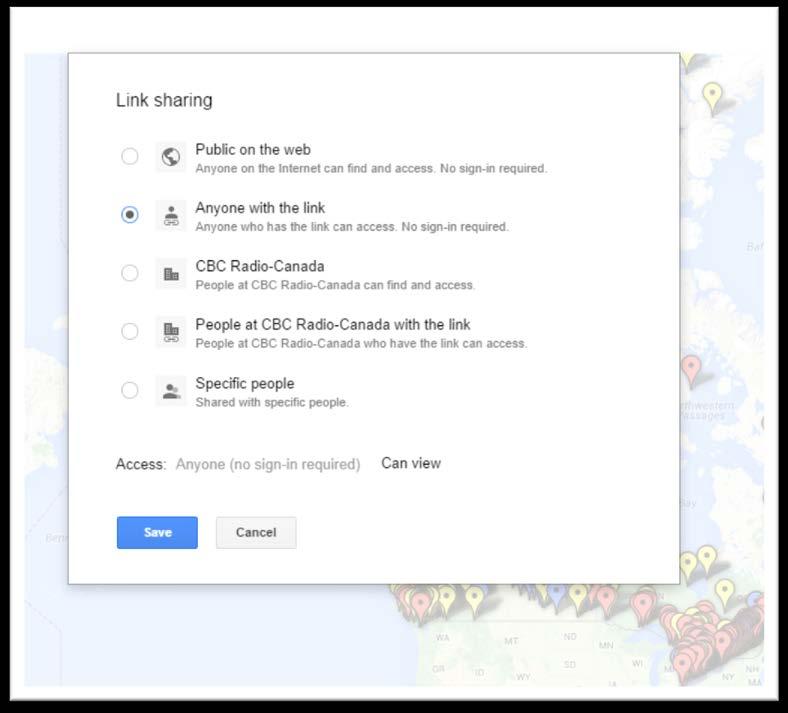
36


37 54) To get the embed code, go to Tools
 If you re happy with the dimensions, highlight the code in the")
38 55) and Publish. 56) If you re happy with the dimensions, highlight the code in the bottom triangle and paste it into your Wordpress HTLM view.
Mapping discarded needles in Fusion Tables Tutorial
 Mapping discarded needles in Fusion Tables Tutorial In the previous tutorials, we ve learned how to turn pivot tables into heat maps and place colour code geographic points using markers that Fusion Tables
Chapter 6. Building Maps with ArcGIS Online
 Chapter 6 Building Maps with ArcGIS Online Summary: ArcGIS Online is an on-line mapping software that allows you to upload tables with latitude and longitude geographic coordinates to create map layers
Tableau Tutorial Using Canadian Arms Sales Data
 Tableau Tutorial Using Canadian Arms Sales Data 1) Your data comes from Industry Canada s Trade site. 2) If you don t want to download the data yourself, use this file. You can also download it from the
Tutorial for downloading and analyzing data from the Atlantic Canada Opportunities Agency
 Tutorial for downloading and analyzing data from the Atlantic Canada Opportunities Agency The agency, which goes by the acronym ACOA, is one of many federal institutions that uploads data to the federal
Tutorial 5: Working with Excel Tables, PivotTables, and PivotCharts. Microsoft Excel 2013 Enhanced
 Tutorial 5: Working with Excel Tables, PivotTables, and PivotCharts Microsoft Excel 2013 Enhanced Objectives Explore a structured range of data Freeze rows and columns Plan and create an Excel table Rename
Census tutorial using the city of Ottawa s wards
 Census tutorial using the city of Ottawa s wards Every five years, Statistics Canada uses the Census Program to collect vital data about Canadians that paints a portrait of who we are. Traditionally, the
Text Conversion Process
 Text Conversion Process TEXT to EXCEL Conversion Template EXCEL to TEXT Purpose F. S. 285.985 - Transparency in Government Spending Data Agencies Steps 1. Get your Agency Contract Data via CD 2. Convert
MIS0855: Data Science In-Class Exercise for Mar Creating Interactive Dashboards
 MIS0855: Data Science In-Class Exercise for Mar 25-27 Creating Interactive Dashboards Objective: Create a dashboard with interactive data filtering using Tableau Learning Outcomes: Understand how to create
Tutorial for downloading and analyzing data from the Atlantic Canada Opportunities Agency
 Tutorial for downloading and analyzing data from the Atlantic Canada Opportunities Agency The agency, which goes by the acronym ACOA, is one of many federal institutions that uploads data to the federal
TUTORIAL FOR IMPORTING OTTAWA FIRE HYDRANT PARKING VIOLATION DATA INTO MYSQL
 TUTORIAL FOR IMPORTING OTTAWA FIRE HYDRANT PARKING VIOLATION DATA INTO MYSQL We have spent the first part of the course learning Excel: importing files, cleaning, sorting, filtering, pivot tables and exporting
Tutorial for mapping Toronto s 2013 fire hydrant parking ticket data
 Tutorial for mapping Toronto s 2013 fire hydrant parking ticket data Toronto, like cities including Vancouver, Edmonton, Ottawa and Halifax, has an open data site with lots of great data to download. The
Using pivot tables in Excel (live exercise with data)
") Using pivot tables in Excel (live exercise with data) In chapter four, we used B.C. s political donations data to learn how to build pivot tables, which group elements in your data and summarize the information
Using pivot tables in Excel (live exercise with data) In chapter four, we used B.C. s political donations data to learn how to build pivot tables, which group elements in your data and summarize the information
Using Pivot Tables in Excel (Live Exercise with Data)
") Chapter 4 Using Pivot Tables in Excel (Live Exercise with Data) In chapter four, we used B.C. s political donations data to learn how to build pivot tables, which group elements in your data and summarize
Chapter 4 Using Pivot Tables in Excel (Live Exercise with Data) In chapter four, we used B.C. s political donations data to learn how to build pivot tables, which group elements in your data and summarize
MIS 0855 Data Science (Section 006) Fall 2017 In-Class Exercise (Day 15) Creating Interactive Dashboards
 Fall 2017 In-Class Exercise (Day 15) Creating Interactive Dashboards") MIS 0855 Data Science (Section 006) Fall 2017 In-Class Exercise (Day 15) Creating Interactive Dashboards Objective: Create a dashboard with interactive data filtering using Tableau Learning Outcomes: Understand
MIS 0855 Data Science (Section 006) Fall 2017 In-Class Exercise (Day 15) Creating Interactive Dashboards Objective: Create a dashboard with interactive data filtering using Tableau Learning Outcomes: Understand
SPREADSHEETS. (Data for this tutorial at
 SPREADSHEETS (Data for this tutorial at www.peteraldhous.com/data) Spreadsheets are great tools for sorting, filtering and running calculations on tables of data. Journalists who know the basics can interview
Microsoft Excel 2010 Level III
 Microsoft Excel 2010 Level III Excel is a spreadsheet program used to enter, manipulate, compute, graph, analyze, and store numeric data. Its uses, include managing budgets, grade books, and maintain simple
New Perspectives on Microsoft Excel Module 5: Working with Excel Tables, PivotTables, and PivotCharts
 New Perspectives on Microsoft Excel 2016 Module 5: Working with Excel Tables, PivotTables, and PivotCharts Objectives, Part 1 Explore a structured range of data Freeze rows and columns Plan and create
Google Fusion Tables Tutorial: Displaying Facilities in Discharge Monitoring Reports (DMR)
") Google Fusion Tables Tutorial: Displaying Facilities in Discharge Monitoring Reports (DMR) This tutorial will introduce you to the following: Obtaining Data from EPA DMR, and relevant base map materials
Google Fusion Tables Tutorial: Displaying Facilities in Discharge Monitoring Reports (DMR) This tutorial will introduce you to the following: Obtaining Data from EPA DMR, and relevant base map materials
EXCEL 2010 BASICS JOUR 772 & 472 / Ira Chinoy
 EXCEL 2010 BASICS JOUR 772 & 472 / Ira Chinoy Virus check and backups: Remember that if you are receiving a file from an external source a government agency or some other source, for example you will want
Filter and PivotTables in Excel
 Filter and PivotTables in Excel FILTERING With filters in Excel you can quickly collapse your spreadsheet to find records meeting specific criteria. A lot of reporters use filter to cut their data down
Part one of an Excel tutorial using the the Alberta Sunshine List Data
 Part one of an Excel tutorial using the the Alberta Sunshine List Data Given that most of you are on Macs, your Excel interfaces will be different from mine. Still, the tutorial and screenshots will give
Tableau tutorial using the city of Ottawa crime Data
 Tableau tutorial using the city of Ottawa 2011-2013 crime Data Tableau is a free tool that according to its mission statement helps people see and understand data. The program helps the people for whom
Using Microsoft Excel
 Using Microsoft Excel Files in Microsoft Excel are referred to as Workbooks. This is because they can contain more than one sheet. The number of sheets a workbook can contain is only limited by your computer
Tutorial for downloading the city of Ottawa s monthly service request submissions data
 Tutorial for downloading the city of Ottawa s monthly service request submissions data Which ward has the gets the most noise complaints in the summer? Where are the city s graffiti hotspots? Which residents
Inserting or deleting a worksheet
 Inserting or deleting a worksheet To insert a new worksheet at the end of the existing worksheets, just click the Insert Worksheet tab at the bottom of the screen. To insert a new worksheet before an existing
TUTORIAL Get Started with Tableau Desktop
 TUTORIAL Get Started with Tableau Desktop Learn how to connect to data, create data visualizations, present your findings, and share your insights with others. http://onlinehelp.tableau.com/current/guides/get-started-tutorial/en-us/get-started-tutorialhome.html
Information Technology
 Information Technology Operations Team Instructional Sharing Protected Data Contents Introduction... 3 Procedure... 3 How to Password Protect a MS Word Document... 3 MS Word 2010/2013/2016... 3 Word 2007...
Chapter 7. Joining Maps to Other Datasets in QGIS
 Chapter 7 Joining Maps to Other Datasets in QGIS Skills you will learn: How to join a map layer to a non-map layer in preparation for analysis, based on a common joining field shared by the two tables.
M i c r o s o f t E x c e l A d v a n c e d P a r t 3-4. Microsoft Excel Advanced 3-4
 Microsoft Excel 2010 Advanced 3-4 0 Absolute references There may be times when you do not want a cell reference to change when copying or filling cells. You can use an absolute reference to keep a row
ADVANCED INQUIRIES IN ALBEDO: PART 2 EXCEL DATA PROCESSING INSTRUCTIONS
 ADVANCED INQUIRIES IN ALBEDO: PART 2 EXCEL DATA PROCESSING INSTRUCTIONS Once you have downloaded a MODIS subset, there are a few steps you must take before you begin analyzing the data. Directions for
Using Microsoft Excel
 Using Microsoft Excel Formatting a spreadsheet means changing the way it looks to make it neater and more attractive. Formatting changes can include modifying number styles, text size and colours. Many
MS Office 2016 Excel Pivot Tables - notes
 Introduction Why You Should Use a Pivot Table: Organize your data by aggregating the rows into interesting and useful views. Calculate and sum data quickly. Great for finding typos. Create a Pivot Table
Using Microsoft Excel
 About Excel Using Microsoft Excel What is a Spreadsheet? Microsoft Excel is a program that s used for creating spreadsheets. So what is a spreadsheet? Before personal computers were common, spreadsheet
Using Microsoft Excel
 Using Microsoft Excel Excel contains numerous tools that are intended to meet a wide range of requirements. Some of the more specialised tools are useful to people in certain situations while others have
Excel Tables and Pivot Tables
 A) Why use a table in the first place a. Easy to filter and sort if you only sort or filter by one item b. Automatically fills formulas down c. Can easily add a totals row d. Easy formatting with preformatted
Making an entry into the CIS Payments workbook
 Making an entry into the CIS Payments workbook By now you should have carried out the CIS Payments workbook Setup. If you have not done so you will need to do this before you can proceed. When you have
How to import text files to Microsoft Excel 2016:
 How to import text files to Microsoft Excel 2016: You would use these directions if you get a delimited text file from a government agency (or some other source). This might be tab-delimited, comma-delimited
TUTORIAL FOR IMPORTING OTTAWA FIRE HYDRANT PARKING VIOLATION DATA INTO MYSQL
 TUTORIAL FOR IMPORTING OTTAWA FIRE HYDRANT PARKING VIOLATION DATA INTO MYSQL We have spent the first part of the course learning Excel: importing files, cleaning, sorting, filtering, pivot tables and exporting
CMPF124 Microsoft Excel Tutorial
 Lab 5: Microsoft Excel Tutorial Excel Worksheet Microsoft Excel works as account ledger. An Excel Workbook (1) could have multiple Worksheets (2). A cell in Excel is referred by its Column and Row naming
Advanced Excel Charts : Tables : Pivots
 Advanced Excel Charts : Tables : Pivots Protecting Your Tables/Cells Protecting your cells/tables is a good idea if multiple people have access to your computer or if you want others to be able to look
Introduction to Microsoft Excel 2007
 Introduction to Microsoft Excel 2007 Microsoft Excel is a very powerful tool for you to use for numeric computations and analysis. Excel can also function as a simple database but that is another class.
ADD AND NAME WORKSHEETS
 1 INTERMEDIATE EXCEL While its primary function is to be a number cruncher, Excel is a versatile program that is used in a variety of ways. Because it easily organizes, manages, and displays information,
Explore commands on the ribbon Each ribbon tab has groups, and each group has a set of related commands.
 Quick Start Guide Microsoft Excel 2013 looks different from previous versions, so we created this guide to help you minimize the learning curve. Add commands to the Quick Access Toolbar Keep favorite commands
Microsoft Excel 2010 Training. Excel 2010 Basics
 Microsoft Excel 2010 Training Excel 2010 Basics Overview Excel is a spreadsheet, a grid made from columns and rows. It is a software program that can make number manipulation easy and somewhat painless.
MICROSOFT EXCEL Understanding Filters
 07 Understanding Filters Understanding a list UNDERSTANDING FILTERS Before proceeding to the topic on filters, it is best to understand what a list is. A list is basically an organized collection of information.
Excel 2016: Part 2 Functions/Formulas/Charts
 Excel 2016: Part 2 Functions/Formulas/Charts Updated: March 2018 Copy cost: $1.30 Getting Started This class requires a basic understanding of Microsoft Excel skills. Please take our introductory class,
Creating and Using an Excel Table
 Creating and Using an Excel Table Overview of Excel 2007 tables In earlier Excel versions, the organization of data in tables was referred to as an Excel database or list. An Excel table is not to be confused
Excel 2007 New Features Table of Contents
 Table of Contents Excel 2007 New Interface... 1 Quick Access Toolbar... 1 Minimizing the Ribbon... 1 The Office Button... 2 Format as Table Filters and Sorting... 2 Table Tools... 4 Filtering Data... 4
COPYRIGHTED MATERIAL. Making Excel More Efficient
 Making Excel More Efficient If you find yourself spending a major part of your day working with Excel, you can make those chores go faster and so make your overall work life more productive by making Excel
Assignment 1 MIS Spreadsheet (Excel)
") Assignment 1 MIS Spreadsheet (Excel) Summary Create a Microsoft Excel file with six worksheets that provides extensive use of Excel capabilities including: importing data, formatting data in tables, summarizing
Assignment 1 MIS Spreadsheet (Excel) Summary Create a Microsoft Excel file with six worksheets that provides extensive use of Excel capabilities including: importing data, formatting data in tables, summarizing
2. create the workbook file
 2. create the workbook file Excel documents are called workbook files. A workbook can include multiple sheets of information. Excel supports two kinds of sheets for working with data: Worksheets, which
Mapping with Google Fusion Tables
 Mapping with Google Fusion Tables You will learn how to transform location information stored in an Excel spreadsheet to a format that can be mapped directly with Google Fusion Tables. Format of Data within
EXCEL BASICS: MICROSOFT OFFICE 2007
 EXCEL BASICS: MICROSOFT OFFICE 2007 GETTING STARTED PAGE 02 Prerequisites What You Will Learn USING MICROSOFT EXCEL PAGE 03 Opening Microsoft Excel Microsoft Excel Features Keyboard Review Pointer Shapes
3/31/2016. Spreadsheets. Spreadsheets. Spreadsheets and Data Management. Unit 3. Can be used to automatically
 MICROSOFT EXCEL and Data Management Unit 3 Thursday March 31, 2016 Allow users to perform simple and complex sorting Allow users to perform calculations quickly Organizes and presents figures that can
Making Excel Work for Your Tribal Community
 Making Excel Work for Your Tribal Community Excel Basics: Intermediate Skills PHONE: 1-800-871-8702 EMAIL: INFO@CBC4TRIBES.ORG WEB: TRIBALINFORMATIONEXCHANGE.ORG MAKING EXCEL WORK FOR YOUR TRIBAL COMMUNITY
Basic Microsoft Excel 2007
 Basic Microsoft Excel 2007 Contents Starting Excel... 2 Excel Window Properties... 2 The Ribbon... 3 Tabs... 3 Contextual Tabs... 3 Dialog Box Launchers... 4 Galleries... 5 Minimizing the Ribbon... 5 The
Excel Tips for Compensation Practitioners Weeks Pivot Tables
 Excel Tips for Compensation Practitioners Weeks 23-28 Pivot Tables Week 23 Creating a Pivot Table Pivot tables are one of the most amazing and powerful tools in Excel, but many users do not know how to
Introduction to Microsoft Excel 2010
 Introduction to Microsoft Excel 2010 This class is designed to cover the following basics: What you can do with Excel Excel Ribbon Moving and selecting cells Formatting cells Adding Worksheets, Rows and
Working with Data in Microsoft Excel 2010
 Working with Data in Microsoft Excel 2010 This document provides instructions for using the sorting and filtering features in Microsoft Excel, as well as working with multiple worksheets in the same workbook
SPREADSHEET (Excel 2007)
") SPREADSHEET (Excel 2007) 1 U N I T 0 4 BY I F T I K H A R H U S S A I N B A B U R Spreadsheet Microsoft Office Excel 2007 (or Excel) is a computer program used to enter, analyze, and present quantitative
SPREADSHEET (Excel 2007) 1 U N I T 0 4 BY I F T I K H A R H U S S A I N B A B U R Spreadsheet Microsoft Office Excel 2007 (or Excel) is a computer program used to enter, analyze, and present quantitative
ITS Training Class Charts and PivotTables Using Excel 2007
 When you have a large amount of data and you need to get summary information and graph it, the PivotTable and PivotChart tools in Microsoft Excel will be the answer. The data does not need to be in one
DOING MORE WITH EXCEL: MICROSOFT OFFICE 2013
 DOING MORE WITH EXCEL: MICROSOFT OFFICE 2013 GETTING STARTED PAGE 02 Prerequisites What You Will Learn MORE TASKS IN MICROSOFT EXCEL PAGE 03 Cutting, Copying, and Pasting Data Basic Formulas Filling Data
LEIAG-Excel Workshop
 Random Sample Excel has a simple formula we can utilize to obtain a random sample (cases, citations, city, etc.) At the Sheriff s Department, we are able to run a case management report that generates
Sort, Filter, Pivot Table
 Sort, Filter, Pivot Table Sort A common database task is to rearrange the information based on a header/field or headers/fields. This is called Sorting or Filtering. Sorting rearranges all of the information
Microsoft Excel: More Tips, Tricks & Techniques. Excel 2010 & Excel Cutting Edge Chapter of IAAP
 Microsoft Excel: More Tips, Tricks & Techniques Excel 2010 & Excel 2007 Cutting Edge Chapter of IAAP Dawn Bjork Buzbee, MCT The Software Pro Microsoft Certified Trainer Bonus Resources Follow-up Q&A, additional
File Name: Pivot Table Labs.xlsx
 File Name: Pivot Table Labs.xlsx Lab Session 1: Create Simple Pivot Table with a Date Grouping Note: Instructions for the first lab are very detailed because it might be the first time you have created
Microsoft Office Illustrated. Using Tables
 Microsoft Office 2007 - Illustrated Using Tables Objectives Plan a Table Create a Table Add Table Data Find and Replace Table Data Delete Table Data 2 Objectives Sort Table Data Use Formulas in a Table
Ćw. IV. DynamicTables
 Ćw. IV. DynamicTables Task 1. We have a table with three columns containing the product name, category to which the product belongs, and its sale last year. The table contains data for 500 products. We
COMM 391 Winter 2014 Term 1. Tutorial 1: Microsoft Excel - Creating Pivot Table
 COMM 391 Winter 2014 Term 1 Tutorial 1: Microsoft Excel - Creating Pivot Table The purpose of this tutorial is to enable you to create Pivot Table to analyze worksheet data in Microsoft Excel. You should
Microsoft Excel 2007 Macros and VBA
 Microsoft Excel 2007 Macros and VBA With the introduction of Excel 2007 Microsoft made a number of changes to the way macros and VBA are approached. This document outlines these special features of Excel
Formatting: Cleaning Up Data
 Formatting: Cleaning Up Data Hello and welcome to our lesson on cleaning up data, which is one of the final ones in this Formatting Module. What we re going to be doing in this lesson is using some of
EXCEL BASICS: MICROSOFT OFFICE 2010
 EXCEL BASICS: MICROSOFT OFFICE 2010 GETTING STARTED PAGE 02 Prerequisites What You Will Learn USING MICROSOFT EXCEL PAGE 03 Opening Microsoft Excel Microsoft Excel Features Keyboard Review Pointer Shapes
Geocoding Reference USA data in ArcMap 9.3
 Tufts GIS Tip Sheet Geocoding Reference USA data in ArcMap 9.3 Written by Barbara Parmenter Revised 3/1/2011 In this exercise, you will map businesses or services for a town in the Boston metropolitan
Excel 2013 Intermediate
 Instructor s Excel 2013 Tutorial 2 - Charts Excel 2013 Intermediate 103-124 Unit 2 - Charts Quick Links Chart Concepts Page EX197 EX199 EX200 Selecting Source Data Pages EX198 EX234 EX237 Creating a Chart
Tutorial: Getting Data into Your Spreadsheet
 Chapter 4 Tutorial: Getting Data into Your Spreadsheet Summary: Getting information into Excel is similar to working with a Word document. To enter text and data, you can simply click on the cell and begin
Database Concepts Using Microsoft Access
 lab Database Concepts Using Microsoft Access 9 Objectives: Upon successful completion of Lab 9, you will be able to Understand fundamental concepts including database, table, record, field, field name,
PivotTables & Charts for Health
 PivotTables & Charts for Health Data Inputs PivotTables Pivot Charts Global Strategic Information UCSF Global Health Sciences Version Malaria 1.0 1 Table of Contents 1.1. Introduction... 3 1.1.1. Software
SHOW ME THE NUMBERS: DESIGNING YOUR OWN DATA VISUALIZATIONS PEPFAR Applied Learning Summit September 2017 A. Chafetz
 SHOW ME THE NUMBERS: DESIGNING YOUR OWN DATA VISUALIZATIONS PEPFAR Applied Learning Summit September 2017 A. Chafetz Overview In order to prepare for the upcoming POART, you need to look into testing as
Excel Tips for Compensation Practitioners Weeks Data Validation and Protection
 Excel Tips for Compensation Practitioners Weeks 29-38 Data Validation and Protection Week 29 Data Validation and Protection One of the essential roles we need to perform as compensation practitioners is
Excel Intermediate
 Excel 2013 - Intermediate (103-124) Multiple Worksheets Quick Links Manipulating Sheets Pages EX16 EX17 Copying Worksheets Page EX337 Grouping Worksheets Pages EX330 EX332 Multi-Sheet Cell References Page
Welcome to Introduction to Microsoft Excel 2010
 Welcome to Introduction to Microsoft Excel 2010 2 Introduction to Excel 2010 What is Microsoft Office Excel 2010? Microsoft Office Excel is a powerful and easy-to-use spreadsheet application. If you are
Microsoft Excel Chapter 2. Formulas, Functions, and Formatting
 Microsoft Excel 2010 Chapter 2 Formulas, Functions, and Formatting Objectives Enter formulas using the keyboard Enter formulas using Point mode Apply the AVERAGE, MAX, and MIN functions Verify a formula
Objective: Class Activities
 Objective: A Pivot Table is way to present information in a report format. The idea is that you can click drop down lists and change the data that is being displayed. Students will learn how to group data
Excel Intermediate. Click in the name column of our Range of Data. (Do not highlight the column) Click on the Data Tab in the Ribbon
 Click on the Data Tab in the Ribbon") Custom Sorting and Subtotaling Excel Intermediate Excel allows us to sort data whether it is alphabetic or numeric. Simply clicking within a column or row of data will begin the process. Click in the name
Custom Sorting and Subtotaling Excel Intermediate Excel allows us to sort data whether it is alphabetic or numeric. Simply clicking within a column or row of data will begin the process. Click in the name
Pivot Tables, Lookup Tables and Scenarios
 Introduction Format and manipulate data using pivot tables. Using a grading sheet as and example you will be shown how to set up and use lookup tables and scenarios. Contents Introduction Contents Pivot
* George Washington University report: Counting for Dollars 2020: The Role of the Decennial Census in the Geographic Distribution of Federal Funds
 1 2 * George Washington University report: Counting for Dollars 2020: The Role of the Decennial Census in the Geographic Distribution of Federal Funds (https://gwipp.gwu.edu/counting dollars role decennial
Microsoft Excel Office 2016/2013/2010/2007 Tips and Tricks
 Microsoft Excel Office 2016/2013/2010/2007 Tips and Tricks In Office 2007, the OFFICE BUTTON is the symbol at the top left of the screen. 1 Enter Fractions That Will Display And Calculate Properly a. Type
A cell is highlighted when a thick black border appears around it. Use TAB to move to the next cell to the LEFT. Use SHIFT-TAB to move to the RIGHT.
 Instructional Center for Educational Technologies EXCEL 2010 BASICS Things to Know Before You Start The cursor in Excel looks like a plus sign. When you click in a cell, the column and row headings will
Excel Conditional Formatting (Mac)
") [Type here] Excel Conditional Formatting (Mac) Using colour to make data analysis easier Excel conditional formatting automatically formats cells in your worksheet if specified criteria are met, giving
[Type here] Excel Conditional Formatting (Mac) Using colour to make data analysis easier Excel conditional formatting automatically formats cells in your worksheet if specified criteria are met, giving
Rockefeller College MPA Excel Workshop: Clinton Impeachment Data Example
 Rockefeller College MPA Excel Workshop: Clinton Impeachment Data Example This exercise is a follow-up to the MPA admissions example used in the Excel Workshop. This document contains detailed solutions
Introduction to Microsoft Excel 2010
 Introduction to Microsoft Excel 2010 This class is designed to cover the following basics: What you can do with Excel Excel Ribbon Moving and selecting cells Formatting cells Adding Worksheets, Rows and
Google FusionTables for Global Health User Manual
 Google FusionTables for Global Health User Manual Version: January 2015 1 1. Introduction... 3 Use Requirements... 3 Video Tutorials... 3 2. Getting started with Google FusionTables... 4 2.1. Setup...
EXCEL 2007 TIP SHEET. Dialog Box Launcher these allow you to access additional features associated with a specific Group of buttons within a Ribbon.
 EXCEL 2007 TIP SHEET GLOSSARY AutoSum a function in Excel that adds the contents of a specified range of Cells; the AutoSum button appears on the Home ribbon as a. Dialog Box Launcher these allow you to
Table JESSICA MILLER WCLS COORDINATOR
 Google Fusion Table JESSICA MILLER WCLS COORDINATOR JMILLER@CITLIB.ORG Purpose Google Fusion Tables is a data management tool that allows you to come to new conclusions about your data by seeing it in
How to Make Graphs with Excel 2007
 Appendix A How to Make Graphs with Excel 2007 A.1 Introduction This is a quick-and-dirty tutorial to teach you the basics of graph creation and formatting in Microsoft Excel. Many of the tasks that you
Using the Dashboard. The dashboard allows you to see, and drill into, important summary information about the health of your reliability solution.
 Using the Dashboard The dashboard allows you to see, and drill into, important summary information about the health of your reliability solution. Opening the Dashboard: You can see part of the dashboard
1. Managing Information in Table
 1. Managing Information in Table Spreadsheets are great for making lists (such as phone lists, client lists). The researchers discovered that not only was list management the number one spreadsheet activity,
Microsoft Excel 2016 LEVEL 3
 TECH TUTOR ONE-ON-ONE COMPUTER HELP COMPUTER CLASSES Microsoft Excel 2016 LEVEL 3 kcls.org/techtutor Microsoft Excel 2016 Level 3 Manual Rev 11/2017 instruction@kcls.org Microsoft Excel 2016 Level 3 Welcome
WORD PROCESSING FOR SALE. By Shel Silverstein
 ASSIGNMENT #1 ~ Scavenger Hunt 2. Your job is to retrieve several documents. Read the poem, and then write down on the worksheet the clue word you find, then you will close and exit the file. 3. Each clue
Looking good! Slicing and dicing to visualize data in Excel Dashboards Michael Winecoff UNC Charlotte J. Murrey Atkins Library
 Looking good! Slicing and dicing to visualize data in Excel Dashboards Michael Winecoff UNC Charlotte J. Murrey Atkins Library http://goo.gl/asn5xt Objective To take spreadsheet data and present it visually