Behavioral Modes Segmentation: GIS Visualization Movement Ecology CEAB 15 June, 2012
|
|
|
- Luke Hodges
- 6 years ago
- Views:
Transcription
 Part A: Visualization of unique behaviours by time spent: Part B: A short note on 3D visualization A: Visualization of unique behaviours by time spent: We used geographic")
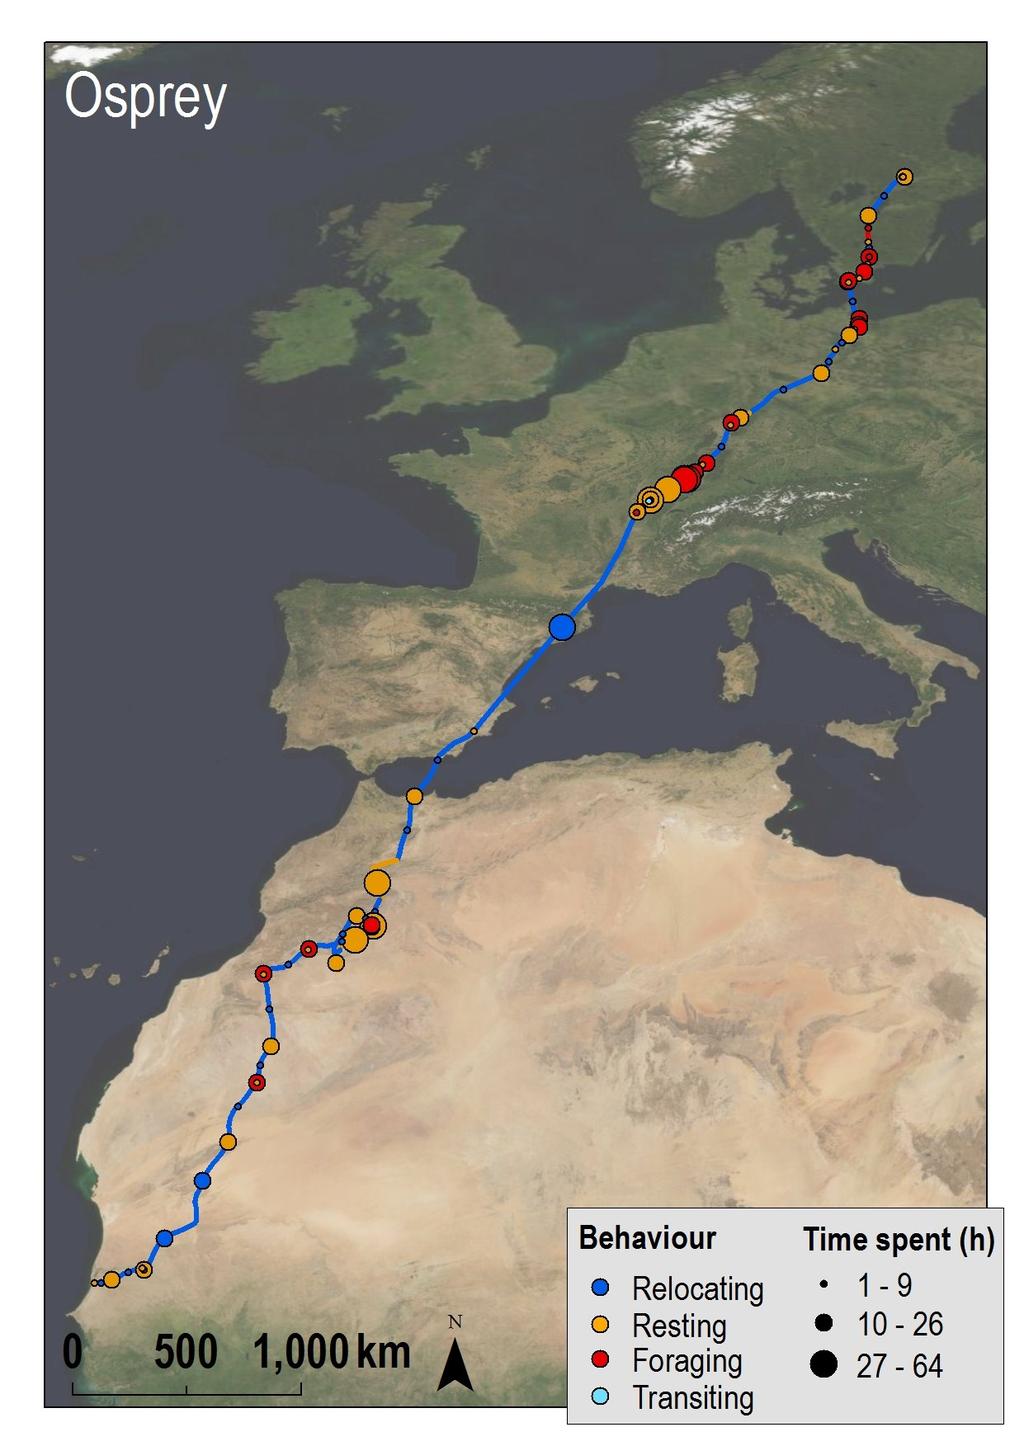
1 Behavioral Modes Segmentation: GIS Visualization Movement Ecology CEAB 15 June, 2012 GIS visualization for segmentation and annotation of animal movement trajectories (for single or few trajectories at a time) Part A: Visualization of unique behaviours by time spent: Part B: A short note on 3D visualization A: Visualization of unique behaviours by time spent: We used geographic Information Systems (GIS) to properly visualize path segmentation and annotation in different trajectories using the same methodology. Tracks used have different spatial characteristics in terms of its resolution and space/area used (Fig. 1). Tracks can be either high resolution (e.g. tracks from GPS technology) or low resolution tracks (e.g. Argos) and can be located at very small or large areas. For instance, migration paths typically move along far away areas in the globe (e.g. from the poles to the equator), whereas foraging paths are typically found within smaller areas (larger scale). This causes visualization problems if using directly each single pair of coordinates (all data in the dataset) for the purpose of representing different tracks in the same way.
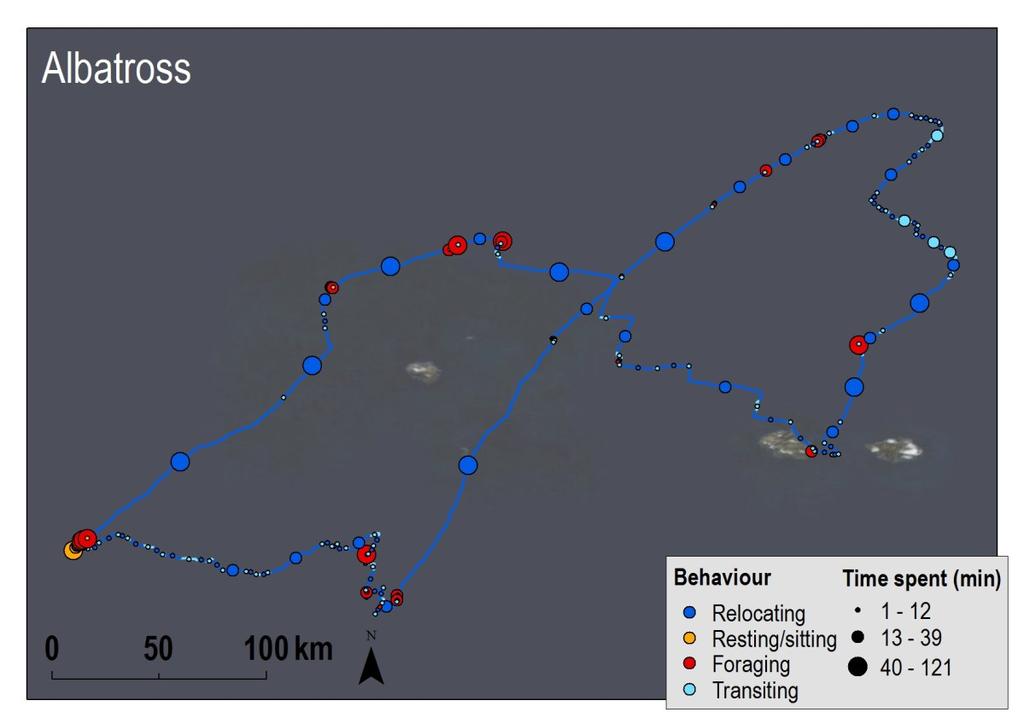
: A: osprey migration track with around 600 pairs of coordinates (represented as bullet points) for a")
2 Fig 1. Illustration of different spatial track characteristics (resolution of the dataset and space used): A: osprey migration track with around 600 pairs of coordinates (represented as bullet points) for a very large area; B: migration albatross track with around 3000 pairs of coordinates (represented as bullet points) for a relatively small area. As an example of visualization problems, for very high resolution tracks that move large distances, behaviours associated to each pair of coordinates are difficult to be seen when plotting the whole trajectory at a time (small scale), either using points or lines. This is especially problematic when it comes to visualize behaviours that occupy a relative small space (e.g. foraging or resting) in comparison to behaviours that occupy a larger space (e.g. relocating). Fig 2. Illustration of behaviour visualization problems, using lines, for a: A) large area track (osprey migration track); B) small area but high resolution track; C) a zoom of a particular area in B. To overcome this and be able to map behaviours of all trajectories in the same way, we have developed a visualization methodology and protocol that is briefly defined below: Step 1; transforming pairs of coordinates into rhumb lines (Fig 3; A): locations (a pair of latitude and longitude coordinates) are transformed into lines (XY to Line, Data Management, ArcGis 10, ESRI). A line is formed by point i and point i+1, therefore the number of resulting lines is the number of pair of coordinates n-1, being the last point of the track the one deleted. Line type used is the rhumb line or line of constant bearing (direction), as recommended for bird trajectories. Each line is associated to the attributes of its initial pair of coordinates. This is consistent with the methodology used to associate behaviours to each
3 pair of coordinates, where physical attributes are attributed to each location using the next point (speed) or the surrounding points (turning angle). Step 2; dissolving continuous behaviours into single lines (Fig 3; B): individual small lines joining each coordinate s pair are dissolved into larger lines using the associated behaviour (Dissolve, Data Management, ArcGis 10, ESRI). Larger lines are formed by dissolving smaller and continuous lines associated to the same behaviour. This way each line represents a unique spatial and temporal continuous behaviour within each track. Step 3; converting lines into points (Fig 3; C): lines are converted into points (Points to Lines, Data Management, ArcGis 10, ESRI) using the inside option, so that points are located at the central position of the line forcing the point to be within the line (not the geographic centroid which can result in points found outside the line). Attributes are associated to each point for further qualitative and quantitative visualization. The attribute aggregation depends on the characteristics being evaluated. For instance, time spent in that particular behaviour is the sum of the time spent at each individual line, whereas for instance distance from home is the average. Step 4; final visualization (Fig 3; D): tracks are visualized as coloured points (each colour represents a different behaviour) where the size of the point represents the time spent within that particular behaviour (visualized in three categories as natural jenks). Moreover, we use the aggregated lines as the background layer using a different colour for each behaviour. Fig 3. Illustration of described steps (1-4) for behaviour visualization This methodology has proven to be particularly useful to solve the previous pointed problems and for representing behaviours in a spatio-temporal context (Fig 4; compare with figures 1 and 2).

4 Fig 4. Comparison of behaviour visualization using a simple line and point method (A) versus the methodology described above (B) However, some potential minor problems have been detected. Further research is needed to improve them: - Overlapping points: in some very specific cases, having overlapping points (points sharing exactly the same coordinates, which means that the animal has not moved or the animal has moved but the coordinate resolution does not capture the movement) may results in length zero lines. Zero length lines do not produce centroid points and therefore, that particular behaviour is not visualized. This only occurs when a behaviour is isolated in-between other behaviours and found only within overlapping points. Potential solutions may be: i) modify the original coordinates so that points never overlap, by adding a very small and unnoticeable visually amount of movement in them; ii) forcing the algorithm to modify those particular situations so that a particular behaviour is never isolated within a group of overlapping points. Apart from this, we have checked that overlapping points that are the continuation or the starting location of a movement (with the same behaviour) do produce lines and therefore, particular zero length lines attributes (those attributes from the part of the overlapping points) do compute for the attribute aggregation (their attributes are not lost).
, points and extruded points.")
5 3D visualization: 3D visualizations allow the visualization and navigation of several parameters at a time, thanks to the 3D capabilities. It is possible to represent values as colours/magnitude through a baseline line, an elevated line (or even extruded), points and extruded points. This allows, for example, the representation of several parameters using these possibilities. For instance, it is possible to represent the turning angle (values 0 and 1) as point values using extruded points (points converted to vertical lines), the speed as lines (baseline lines or elevated lines or both), as well as the annotation (behaviours) as elevated points. The extrusion/elevation values can be expressed as the flying altitude, or as another parameter (e.g. magnitude of the speed, etc.). It is a powerful tool if used as a 3D tool, since it allows interaction and navigation within features. The export as a 2D image is relatively poor in comparison to the in-situ capabilities of the 3D visualization. Fig 5 and 6. Illustration of potential 3D capabilities


6 Examples of behavioural segmentations obtained with the qsum algorithm
7
8

9 Examples of behavioural segmentations obtained with the tlma algorithm VELOCITY TURNING
")
10 BEHAVIOURAL MODES BEHAVIOURAL MODES (short time modes highlighted with large circles)


11 Behavioural Modes Comparison (zoom in) qsum Algorithm tlma Algorithm
Basic Tasks in ArcGIS 10.3.x
 Basic Tasks in ArcGIS 10.3.x This guide provides instructions for performing a few basic tasks in ArcGIS 10.3.1, such as adding data to a map document, viewing and changing coordinate system information,
Analysing crime data in Maps for Office and ArcGIS Online
 Analysing crime data in Maps for Office and ArcGIS Online For non-commercial use only by schools and universities Esri UK GIS for School Programme www.esriuk.com/schools Introduction ArcGIS Online is a
Visualization with ArcGlobe. Brady Hoak
 Visualization with ArcGlobe Brady Hoak Contents What is ArcGlobe? 3D Mapping and ArcGlobe Displaying data in ArcGlobe ArcGlobe tools Tips for constructing ArcGlobe documents New at ArcGIS 9.3 ArcGIS integration
Introduction to the Kinematics Tool
 Introduction to the Kinematics Tool Author: Samantha Ross EarthByte Group, University of Sydney Introduction to the Kinematics Tool Aim Included Files Background Exercise 1 - Using the Kinematics Tool
Exercise One: Estimating The Home Range Of An Individual Animal Using A Minimum Convex Polygon (MCP)
") --- Chapter Three --- Exercise One: Estimating The Home Range Of An Individual Animal Using A Minimum Convex Polygon (MCP) In many populations, different individuals will use different parts of its range.
--- Chapter Three --- Exercise One: Estimating The Home Range Of An Individual Animal Using A Minimum Convex Polygon (MCP) In many populations, different individuals will use different parts of its range.
GEOG4017 Geographical Information Systems Lab 3 Data Collection and Integration (I)
") DEPARTMENT OF GEOGRAPHY HONG KONG BAPTIST UNIVERSITY Prof. Q. Zhou GEOG4017 Geographical Information Systems Lab 3 Data Collection and Integration (I) Objectives Before we can use GIS for any analysis
DEPARTMENT OF GEOGRAPHY HONG KONG BAPTIST UNIVERSITY Prof. Q. Zhou GEOG4017 Geographical Information Systems Lab 3 Data Collection and Integration (I) Objectives Before we can use GIS for any analysis
WAITOMO DISTRICT COUNCIL ONLINE MAPS. Updated June This document contains an overview of Waitomo District Council Online Maps
 WAITOMO DISTRICT COUNCIL ONLINE MAPS V8 Updated June2017 - This document contains an overview of Waitomo District Council Online Maps Table of Contents Starting Online Maps... 3 Main Screen... 4 Menu Bar...
GEOGRAPHIC INFORMATION SYSTEMS Lecture 25: 3D Analyst
 GEOGRAPHIC INFORMATION SYSTEMS Lecture 25: 3D Analyst 3D Analyst - 3D Analyst is an ArcGIS extension designed to work with TIN data (triangulated irregular network) - many of the tools in 3D Analyst also
Data Assembly, Part II. GIS Cyberinfrastructure Module Day 4
 Data Assembly, Part II GIS Cyberinfrastructure Module Day 4 Objectives Continuation of effective troubleshooting Create shapefiles for analysis with buffers, union, and dissolve functions Calculate polygon
Geocoding and Georeferencing. Scott Bell GIS Institute
 Geocoding and Georeferencing Scott Bell GIS Institute Learning Outcomes Define coordinate system and map projection Relate coordinate systems and map projections Distinguish between defining and changing
GPS to GIS Tutorial Exploration of Native Plants
 Grossmont College Introduction to GIScience NAME: Instructors: Curran & Goodman 1 GPS to GIS Tutorial Exploration of Native Plants 1. Create a folder on your USB drive titled: GPS1 2. Using your GPS receiver,
A step-by-step guide to: Collector for ArcGIS
 Created by: Hannah Calich Geographic Information Systems Specialist at the Richter Library (Email: hcalich@rsmas.miami.edu ) A step-by-step guide to: Collector for ArcGIS for ios Devices Before you begin
RT-2 L1TE NovAtel s Single Frequency RTK Solution
 RT-2 L1TE NovAtel s Single Frequency RTK Solution Precise thinking 2009 NovAtel Inc. All rights reserved. Printed in Canada. D12699 www.novatel.com 1-800-NOVATEL (U.S. & Canada) or 403-295-4900 Europe
Neighbourhood Operations Specific Theory
 Neighbourhood Operations Specific Theory Neighbourhood operations are a method of analysing data in a GIS environment. They are especially important when a situation requires the analysis of relationships
Components for Xcelsius. Micro Components
 Components for Xcelsius Micro Components Inovista Micro Components for Xcelsius Inovista provides a full range of spark lines, micro charts, icons, text and shape indicators that can be deployed to create
Appendix 2: Random Plots Workbook: Unstratified Sample
 Appendix 2: Random Plots Workbook: Unstratified Sample These instructions will help users of all skill levels create a random sample of i-tree Eco plot centers, plot areas, and the associated i-tree Eco-required
TRAINING GUIDE. Tablet Cradle to Mobile GIS
 TRAINING GUIDE Tablet Cradle to Mobile GIS Tablet Cradle to Mobile One of the critical components of mobile is the GIS piece, and also can be the most complex. The mobile GIS maps are designed to consume
Chapter 6. Building Maps with ArcGIS Online
 Chapter 6 Building Maps with ArcGIS Online Summary: ArcGIS Online is an on-line mapping software that allows you to upload tables with latitude and longitude geographic coordinates to create map layers
US Geo-Explorer User s Guide. Web:
 US Geo-Explorer User s Guide Web: http://usgeoexplorer.org Updated on October 26, 2016 TABLE OF CONTENTS Introduction... 3 1. System Interface... 5 2. Administrative Unit... 7 2.1 Region Selection... 7
GEOGRAPHIC INFORMATION SYSTEMS Lecture 17: Geoprocessing and Spatial Analysis
 GEOGRAPHIC INFORMATION SYSTEMS Lecture 17: and Spatial Analysis tools are commonly used tools that we normally use to prepare data for further analysis. In ArcMap, the most commonly used tools appear in
ESRI ArcPad 7.1 Quick Reference
 ESRI ArcPad 7.1 GPS POSITION WINDOW SATELLITE SKYPLOT Shows the almanac of which satellites should be available. Black: Available and used for calculating the GPS position Blue: Available but not used
Pinpoint AVM 4.0 Quick Reports Detailed User Manual
 Pinpoint AVM 4.0 Quick Reports Detailed User Manual Page 1 of 11 Table of Contents General avm navigation... 3 1 Quick Reports.... 3 Show... 4 Find... 5 Show Last X hours... 5 Show Trips Over Last 24 Hours...
Graphic Display of Vector Object
 What is GIS? GIS stands for Geographic Information Systems, although the term Geographic Information Science is gaining popularity. A GIS is a software platform for storing, organizing, viewing, querying,
DEM Artifacts: Layering or pancake effects
 Outcomes DEM Artifacts: Stream networks & watersheds derived using ArcGIS s HYDROLOGY routines are only as good as the DEMs used. - Both DEM examples below have problems - Lidar and SRTM DEM products are
Well Unknown ID AKA EPSG: 3857
 Well Unknown ID AKA EPSG: 3857 Pamela Kanu November 2016 WGS 1984 WEB MERCATOR ALIASES: AUXILIARY SPHERE, WKID: 3857, WKID: 102100, WKID: 102113, SHERICAL MERCATOR, WGS 84/PSEUDO-MERCATOR, OPEN LAYERS:
LECTURE TWO Representations, Projections and Coordinates
 LECTURE TWO Representations, Projections and Coordinates GEOGRAPHIC COORDINATE SYSTEMS Why project? What is the difference between a Geographic and Projected coordinate system? PROJECTED COORDINATE SYSTEMS
In order to follow this set of directions you will need the following
 How to Create Maps & Figures in ArcView 9x In order to follow this set of directions you will need the following 1) the Jenny s Louisiana GIS Instructional CD 2) a computer with ArcGIS on it (version 9.0
A Novel Method for Activity Place Sensing Based on Behavior Pattern Mining Using Crowdsourcing Trajectory Data
 A Novel Method for Activity Place Sensing Based on Behavior Pattern Mining Using Crowdsourcing Trajectory Data Wei Yang 1, Tinghua Ai 1, Wei Lu 1, Tong Zhang 2 1 School of Resource and Environment Sciences,
Gridding and Contouring in Geochemistry for ArcGIS
 Gridding and Contouring in Geochemistry for ArcGIS The Geochemsitry for ArcGIS extension includes three gridding options: Minimum Curvature Gridding, Kriging and a new Inverse Distance Weighting algorithm.
Please refer to for specifics and limitations with these operating systems.
 Appendix B ArcReader User Guide For the Southeast Ocean Based Renewable Energy Project INTRODUCTION The purpose of this document is to provide guidance and assistance to users with ArcReader, so that they
TRAINING GUIDE. Tablet: Cradle to Mobile GIS
 TRAINING GUIDE Tablet: Cradle to Mobile GIS Tablet Cradle to Mobile One of the critical components of mobile is the GIS piece, and also can be the most complex. The mobile GIS maps are designed to consume
Calculate a Distance Matrix of Locations along River Network
 Calculate a Distance Matrix of Locations along River Network These instructions enable you to measure the length of line segments between points, which is much more useful than simple straight-line distances
Setting up a 3D Environment for the City of Portland
 Setting up a 3D Environment for the City of Portland www.learn.arcgis.com 380 New York Street Redlands, California 92373 8100 USA Copyright 2018 Esri All rights reserved. Printed in the United States of
Module 4. Stereographic projection: concept and application. Lecture 4. Stereographic projection: concept and application
 Module 4 Stereographic projection: concept and application Lecture 4 Stereographic projection: concept and application 1 NPTEL Phase II : IIT Kharagpur : Prof. R. N. Ghosh, Dept of Metallurgical and Materials
GEOGRAPHIC INFORMATION SYSTEMS Lecture 18: Spatial Modeling
 Spatial Analysis in GIS (cont d) GEOGRAPHIC INFORMATION SYSTEMS Lecture 18: Spatial Modeling - the basic types of analysis that can be accomplished with a GIS are outlined in The Esri Guide to GIS Analysis
Geodatabases. Dr. Zhang SPRING 2016 GISC /03/2016
 Geodatabases Dr. Zhang SPRING 2016 GISC 1401 10/03/2016 Using and making maps Navigating GIS maps Map design Working with spatial data Spatial data infrastructure Interactive maps Map Animations Map layouts
Introduction. Step 1. Build a Rifle Step 2. Choose a Mode Step 3. Establish Position Step 4. Obtain Atmospherics Step 5. Designate a Target
 User Manual 1.1.1 Introduction BallisticsARC currently has 2 modes, and each mode produces solutions independently. However, data entered through the main menu will apply to both modes. The only order
Spatial data and QGIS
 Spatial data and QGIS Xue Jingbo IT Center 2017.08.07 A GIS consists of: Spatial Data. Computer Hardware. Computer Software. Longitude Latitude Disease Date 26.870436-31.909519 Mumps 13/12/2008 26.868682-31.909259
Navigation coordinate systems
 Lecture 3 Navigation coordinate systems Topic items: 1. Basic Coordinate Systems. 2. Plane Cartesian Coordinate Systems. 3. Polar Coordinate Systems. 4. Earth-Based Locational Reference Systems. 5. Reference
Getting Started with GIS using ArcGIS 10.6 What is GIS? and - Module 1 Creating a map document
 Getting Started with GIS using ArcGIS 10.6 What is GIS? and - Module 1 Creating a map document Marcel Fortin Map & Data Library mdl@library.utoronto.ca 2018 http://mdl.library.utoronto.ca This workshop
Asta Powerproject BIM Key Features. elecosoft.com. Asta Powerproject: The power behind successful projects
 Asta Powerproject BIM Key Features elecosoft.com Asta Powerproject BIM Key Features Asta Powerproject BIM enables you to combine 3D models with scheduling tools. This document highlights some of the key
GPS SOFTWARE & MISSION PLANNING
 GPS SOFTWARE & MISSION PLANNING GPS & GIS Fall 2017 Mission Planning Online Mission Planning http://www.gnssplanningonline.com Settings Tab Satellite Library Elevation Number of Satellites Visibility Skyplot
Support. TerraSync. Advanced Data Collection Techniques MGIS. Summary. Advanced Data Collection Options
 TerraSync MGIS Advanced Data Collection Techniques Support Summary Advanced data collection methods offer time-saving techniques for efficient field work. Step-bystep instructions are provided for: Advanced
STUDENT PAGES GIS Tutorial Treasure in the Treasure State
 STUDENT PAGES GIS Tutorial Treasure in the Treasure State Copyright 2015 Bear Trust International GIS Tutorial 1 Exercise 1: Make a Hand Drawn Map of the School Yard and Playground Your teacher will provide
Priemere Power. Geodetic Assistant
 Priemere Power Geodetic Assistant A custom Add-In (extension) to Educate & Inform the ArcGIS User by: Rich Priem Rich@Priemere.com 281-451-8818 APSG-30 Conference September 25, 2013 Awarene$$ Messsages
Lab 4 Projectile Motion
 b Lab 4 Projectile Motion What You Need To Know: x = x v = v v o ox = v + v ox ox + at 1 t + at + a x FIGURE 1 Linear Motion Equations The Physics So far in lab you ve dealt with an object moving horizontally
TimeNotes: A Study on Effective Chart Visualization and Interaction Techniques for Time-Series Data. James Walker, Rita Borgo and Mark W.
 TimeNotes: A Study on Effective Chart Visualization and Interaction Techniques for Time-Series Data James Walker, Rita Borgo and Mark W. Jones 1 Outline Time-series Data Chronolens, Stack Zoom Domain Situation
A Practical Guide to Using QGIS
 A Practical Guide to Using QGIS 1.1 INTRODUCTION Quantum GIS (QGIS) is a useful mapping software that enables the compilation and displaying of spatial data in the form of a map. Gaining experience in
Tutorial 1 Exploring ArcGIS
 Tutorial 1 Exploring ArcGIS Before beginning this tutorial, you should make sure your GIS network folder is mapped on the computer you are using. Please refer to the How to map your GIS server folder as
Ocean Data View (ODV) Manual V1.0
 Manual V1.0") Ocean Data View (ODV) Manual V1.0 Prepared by the Coastal and Regional Oceanography Lab UNSW, Australia (www.oceanography.unsw.edu.au ) for the Sydney Institute of Marine Science. Table of Contents 1 Introduction
Ocean Data View (ODV) Manual V1.0 Prepared by the Coastal and Regional Oceanography Lab UNSW, Australia (www.oceanography.unsw.edu.au ) for the Sydney Institute of Marine Science. Table of Contents 1 Introduction
ArcGIS Runtime SDK for ios and macos: Building Apps. Suganya Baskaran, Gagandeep Singh
 ArcGIS Runtime SDK for ios and macos: Building Apps Suganya Baskaran, Gagandeep Singh Get Started Core Components Agenda - Display Map Content - Search for Content - Perform Analysis - Edit Content Summary
CSTools Guide (for ArcGIS version 10.2 and 10.3)
") CSTools Guide (for ArcGIS version 10.2 and 10.3) 1. Why to use Orientation Analysis and Cross section tools (CSTools) in ArcGIS? 2 2. Data format 2 2.1 Coordinate Systems 2 3. How to get the tools into
CSTools Guide (for ArcGIS version 10.2 and 10.3) 1. Why to use Orientation Analysis and Cross section tools (CSTools) in ArcGIS? 2 2. Data format 2 2.1 Coordinate Systems 2 3. How to get the tools into
ARGOSWEB. USER MANUAL Updated September Argosweb. Worldwide tracking and environmental monitoring by satellite
 ARGOSWEB USER MANUAL Updated September 2016 Argosweb Worldwide tracking and environmental monitoring by satellite Introduction Argos is a global satellite-based location and data collection system dedicated
CE 549 Lab 1 - Linking Streamflow Data to a Gauging Station
 CE 549 Lab 1 - Linking Streamflow Data to a Gauging Station Prepared by Venkatesh Merwade Lyles School of Civil Engineering, Purdue University vmerwade@purdue.edu January 2018 Objective The objective of
INTRODUCTION TO GIS WORKSHOP EXERCISE
 111 Mulford Hall, College of Natural Resources, UC Berkeley (510) 643-4539 INTRODUCTION TO GIS WORKSHOP EXERCISE This exercise is a survey of some GIS and spatial analysis tools for ecological and natural
IF YOU SAVED THE ArcMAP PROJECT FROM LAB#2 OPEN IT!
 Lab #4 Working with Fireatlas Regions in ArcInfo and ArcGIS NR506 Advanced GIS Applications in Fire Ecology and Management Objectives Understanding the Regions concept in GIS Learn a few regions commands
GIS IN ECOLOGY: VISUALIZING IN 3D
 GIS IN ECOLOGY: VISUALIZING IN 3D Contents Introduction... 2 3D Analyst and ArcScene... 2 3D Data... 3 Course Data Sources... 4 Copying the Course Dataset... 5 Tasks... 5 Creating/Converting 3D Data...
GIS IN ECOLOGY: VISUALIZING IN 3D
 GIS IN ECOLOGY: VISUALIZING IN 3D Contents Introduction... 2 3D Analyst and ArcScene... 2 3D Data... 2 Course Data Sources... 3 Instructions for Copying the Course Dataset... 4 Tasks... 4 Visualizing and
Geology and Calculus
 GEOL 452 - Mathematical Tools in Geology Lab Assignment # 6 - Feb 25, 2010 (Due March 9, 2010) Name: Geology and Calculus A. Volume of San Nicolas Island San Nicolas Island is one of the remote and smaller
An Introduction to Geographic Information Systems (GIS) using ArcGIS 9.2
 using ArcGIS 9.2") An Introduction to Geographic Information Systems (GIS) using ArcGIS 9.2 by Marcel Fortin, GIS and Map Librarian, University of Toronto Libraries, 2009 gis.maps@utoronto.ca http://www.library.utoronto.ca/maplib/
An Introduction to Geographic Information Systems (GIS) using ArcGIS 9.2 by Marcel Fortin, GIS and Map Librarian, University of Toronto Libraries, 2009 gis.maps@utoronto.ca http://www.library.utoronto.ca/maplib/
OBIS-SEAMAP Advanced Search Getting familiar with the interface
 OBIS-SEAMAP marine megavertebrate geo-archive http://seamap.env.duke.edu OBIS-SEAMAP Advanced Search Getting familiar with the interface Dec 26 th, 2013 The OBIS-SEAMAP Team Marine Geospatial Ecology Lab
ATNS. USING Google EARTH. Version 1
 ATNS USING Google EARTH Version 1 ATNS/HO/Using Google Earth Page 1 25/04/2013 CONTENTS 1. BASIC SETUP 2. NAVIGATING IN GOOGLE EARTH 3. ADDING OBJECTS TO GOOGLE EARTH 4. USER HELP REFERENCES ATNS/HO/Using
QUICK START GUIDE. SOLO Forest
 QUICK START GUIDE SOLO Forest Software Installation 1. For PC installation, run the.msi file. 2. For Mobile device installation, copy the.cab file onto the device 3. Run the.cab file Starting the Program
TRAINING GUIDE. Mobile for Administrators Part 3 - GIS
 TRAINING GUIDE Mobile for Administrators Part 3 - GIS Mobile for Administrators - GIS One of the critical components of mobile is GIS, and it can also be the most complex. The mobile GIS maps are designed
Predicting Bus Arrivals Using One Bus Away Real-Time Data
 Predicting Bus Arrivals Using One Bus Away Real-Time Data 1 2 3 4 5 Catherine M. Baker Alexander C. Nied Department of Computer Science Department of Computer Science University of Washington University
EMbC R-package (v.1.1) Tutorial
 Tutorial") EMbC Expectation Maximization binary Clustering EMbC R-package (v.1.1) Tutorial J.Garriga, J.R.Palmer, A.Oltra, F.Bartumeus ICREA - Movement Ecology Lab (CEAB-CSIC) 28 April 2014 Behavioural Annotation
EMbC Expectation Maximization binary Clustering EMbC R-package (v.1.1) Tutorial J.Garriga, J.R.Palmer, A.Oltra, F.Bartumeus ICREA - Movement Ecology Lab (CEAB-CSIC) 28 April 2014 Behavioural Annotation
Feature Analysis. In this lab you will create a map of all spruce sawtimber or pole stands with an area greater than 5 hectares that are
 NRM338 Fall 2017 Lab11 Feature Analysis Page 1 of 7 Feature Analysis In this lab you will create a map of all spruce sawtimber or pole stands with an area greater than 5 hectares that are Within 1000 meters
Accessing OGC Services To access OGC WMS and WFS open the service in the directory that you want to consume, and click on either WMS or WFS.
 Using Web Services Web Services Overview This user guide contains instructions on how to consume a range of services through a range of both web based and desktop GIS applications. Web services are a live
( x 1) 2 + ( y 3) 2 = 25
 2 + ( y 3) 2 = 25") The locus of points 2 units from the x-axis. The question does not specify the direction of the 2 units so we must include all options. Therefore, the locus of points 2 units from the x-axis is a pair
The locus of points 2 units from the x-axis. The question does not specify the direction of the 2 units so we must include all options. Therefore, the locus of points 2 units from the x-axis is a pair
New Media in Landscape Architecture: Advanced GIS
 New Media in Landscape Architecture: Advanced GIS - Projections and Transformations - Version 10.2, English ANHALT UNIVERSITY OF APPLIED SCIENCES Hochschule Anhalt Author: Dr. Matthias Pietsch Tutorial-Version:
THE TOOLS OF AUTOMATED GENERALIZATION AND BUILDING GENERALIZATION IN AN ArcGIS ENVIRONMENT
 Vol. XIX, 2011, No. 1, 1 7, DOI: 10.2478/v10189-011-0001-4 V. DROPPOVÁ THE TOOLS OF AUTOMATED GENERALIZATION AND BUILDING GENERALIZATION IN AN ArcGIS ENVIRONMENT Veronika Droppová email: veronika.droppova@gmail.com
GEOGRAPHIC INFORMATION SYSTEMS Lecture 02: Feature Types and Data Models
 GEOGRAPHIC INFORMATION SYSTEMS Lecture 02: Feature Types and Data Models Feature Types and Data Models How Does a GIS Work? - a GIS operates on the premise that all of the features in the real world can
System Block Diagram. Tracking Trajectories of Migrating Birds Around a Skyscraper. Brian Crombie Matt Zivney
 System Block Diagram Tracking Trajectories of Migrating Birds Around a Skyscraper Brian Crombie Matt Zivney Project Advisors Dr. Huggins Dr. Stewart Dr. Malinowski System Level Block Diagram The goal of
Legionnaires GIS. Legionnaires' GIS User Guide
 Legionnaires GIS Legionnaires' GIS User Guide September 2016 Contents Contents Introduction... 4 Introducing the Legionnaires GIS interface... 5 Layers... 6 Basemaps... 7 Measurements... 8 Searching for
Exercise 2.2. Explore QGIS. GIS Techniques for Monitoring and Evaluation of HIV/AIDS and Related Programs
 GIS Techniques for Monitoring and Evaluation of HIV/AIDS and Related Programs Exercise 2.2 Explore QGIS *This training was developed as part of a joint effort between MEASURE Evaluation and MEASURE DHS,
Measuring the Lengths of Receiving Polygon Edges
 Measuring the Lengths of Receiving Polygon Edges These instructions enable you to create shapefiles that represent the edge along a receiving polygon that may then be used in the analysis of potential
Coordinate Transformation for Macau Data Using ArcGIS for Desktop
 Coordinate Transformation for Macau Data Using ArcGIS for Desktop Article ID : TT100062 Software : ArcGIS 10.2 for Desktop Platform : Windows 7, Windows 8, Windows Server 2003, Windows Server 2008/R2 Date
GPS/GIS Activities Summary
 GPS/GIS Activities Summary Group activities Outdoor activities Use of GPS receivers Use of computers Calculations Relevant to robotics Relevant to agriculture 1. Information technologies in agriculture
Lecture 7 Attribute-based Operations
 Lecture 7 Attribute-based Operations Learning Objectives 7.1 What is meant by reduce information content using an attribute-based operation? Why would one want to reduce information? 7.2 What is meant
Lab 1: Exploring ArcMap and ArcCatalog In this lab, you will explore the ArcGIS applications ArcCatalog and ArcMap. You will learn how to use
 Lab 1: Exploring ArcMap and ArcCatalog In this lab, you will explore the ArcGIS applications ArcCatalog and ArcMap. You will learn how to use ArcCatalog to find maps and data and how to display maps in
From data source to data view: A practical guide to uploading spatial data sets into MapX
 From data source to data view: A practical guide to uploading spatial data sets into MapX Thomas Piller UNEP/GRID Geneva I Table of contents 1. Adding a new data source to MapX... 1 1.1 Method 1: upload
Introduction to Google SketchUp
 Introduction to Google SketchUp When initially opening SketchUp, it will be useful to select the Google Earth Modelling Meters option from the initial menu. If this menu doesn t appear, the same option
Introduction to Trajectory Clustering. By YONGLI ZHANG
 Introduction to Trajectory Clustering By YONGLI ZHANG Outline 1. Problem Definition 2. Clustering Methods for Trajectory data 3. Model-based Trajectory Clustering 4. Applications 5. Conclusions 1 Problem
CrowdPath: A Framework for Next Generation Routing Services using Volunteered Geographic Information
 CrowdPath: A Framework for Next Generation Routing Services using Volunteered Geographic Information Abdeltawab M. Hendawi, Eugene Sturm, Dev Oliver, Shashi Shekhar hendawi@cs.umn.edu, sturm049@umn.edu,
GIS IN ECOLOGY: CREATING RESEARCH MAPS
 GIS IN ECOLOGY: CREATING RESEARCH MAPS Contents Introduction... 2 Elements of Cartography... 2 Course Data Sources... 3 Tasks... 3 Establishing the Map Document... 3 Laying Out the Map... 5 Exporting Your
From Filing Cabinet to Integrity Management Resource Collecting Useful Data
 From Filing Cabinet to Integrity Management Resource Collecting Useful Data October 10, 2007 Scot Twining Product Manager GeoFields, Inc. EGUG 2007 1 Integrity Management - Collecting Useful Data Regardless
CHAPTER 3 MAP DIGITIZING
 CHAPTER 3 MAP DIGITIZING 3.1 Introduction This chapter deals with the route map digitizing process. The type of data collected, the plotting of the trajectory, digitizing the map into regular intervals
BIO8014 GIS & Remote Sensing Practical Series. Practical 1: Introduction to ArcGIS Desktop
 BIO8014 GIS & Remote Sensing Practical Series Practical 1: Introduction to ArcGIS Desktop 0. Introduction There are various activities associated with the term GIS, these include visualisation, manipulation
Map Functions August 3, 2015 Triangle Homes Group
 Map Functions August 3, 2015 Triangle Homes Group Preston Neighborhoods and Property Map The Map is an interactive web based using ArcGIS Online by ESRI ESRI is the world s largest Geographic Information
Objectives Learn how to work with projections in WMS, and how to combine data from different coordinate systems into the same WMS project.
 s v. 11.0 Projections / Coordinate Systems WMS 11.0 Tutorial Projections / Coordinate Systems Working with map projections in WMS Objectives Learn how to work with projections in WMS, and how to combine
Review of Cartographic Data Types and Data Models
 Review of Cartographic Data Types and Data Models GIS Data Models Raster Versus Vector in GIS Analysis Fundamental element used to represent spatial features: Raster: pixel or grid cell. Vector: x,y coordinate
RAPIDMAP Geocortex HTML5 Viewer Manual
 RAPIDMAP Geocortex HTML5 Viewer Manual This site was developed using the evolving HTML5 web standard and should work in most modern browsers including IE, Safari, Chrome and Firefox. Even though it was
Advanced Parcel Editing. Amy Andis Tim Hodson
 Advanced Parcel Editing Amy Andis Tim Hodson Overview What to expect in this technical workshop Review of the Parcel Fabric Data Model Advanced Tips and tricks for Parcel entry Assessing Quality of Parcel
Mapping Distance and Density
 Mapping Distance and Density Distance functions allow you to determine the nearest location of something or the least-cost path to a particular destination. Density functions, on the other hand, allow
Utility Network Management in ArcGIS: Migrating Your Data to the Utility Network. John Alsup & John Long
 Utility Network Management in ArcGIS: Migrating Your Data to the Utility Network John Alsup & John Long Presentation Outline Utility Network Preparation - Migration Patterns - Understanding the Asset Package
Blacksburg, VA July 24 th 30 th, 2010 Digitizing and Analyzing Data Page 1
 Digitizing and Analyzing Data John McGee Jennifer McKee Prepared by: With support from: NSF DUE-0903270 in partnership with: Geospatial Technician Education Through Virginia s Community Colleges (GTEVCC)
Using GIS to Site Minimal Excavation Helicopter Landings
 Using GIS to Site Minimal Excavation Helicopter Landings The objective of this analysis is to develop a suitability map for aid in locating helicopter landings in mountainous terrain. The tutorial uses
Geographic Information Systems. using QGIS
 Geographic Information Systems using QGIS 1 - INTRODUCTION Generalities A GIS (Geographic Information System) consists of: -Computer hardware -Computer software - Digital Data Generalities GIS softwares
Geological mapping using open
 Geological mapping using open source QGIS MOHSEN ALSHAGHDARI -2017- Abstract Geological mapping is very important to display your field work in a map for geologist and others, many geologists face problems
Importing CDED (Canadian Digital Elevation Data) into ArcGIS 9.x
 into ArcGIS 9.x") Importing CDED (Canadian Digital Elevation Data) into ArcGIS 9.x Related Guides: Obtaining Canadian Digital Elevation Data (CDED) Importing Canadian Digital Elevation Data (CDED) into ArcView 3.x Requirements:
Importing CDED (Canadian Digital Elevation Data) into ArcGIS 9.x Related Guides: Obtaining Canadian Digital Elevation Data (CDED) Importing Canadian Digital Elevation Data (CDED) into ArcView 3.x Requirements: