Statistical surfaces and interpolation. This is lecture ten
|
|
|
- Chastity Gray
- 6 years ago
- Views:
Transcription
1 Statistical surfaces and interpolation This is lecture ten
2 Data models for representation of surfaces So far have considered field and object data models (represented by raster and vector data structures). There is a further type of data model used widely in GIS These are the models used to create approximations of the earth s surface: digital elevation models (DEM) or digital terrain models (DTM).
3 DEM
4 What is a DEM? DEMs are traditionally presented as twodimensional computer arrays (like putting graph paper over the terrain). Data may be presented in ASCII (character text) or 2-byte integer binary formats. Elevations are also presented as: points or spots, such as at mountain peaks, lake surface elevations, confluences of streams, and cultural landmarks (e.g. airports, cities, geodetic control marker locations).
5 Point data for DEMs Points may be determined by cadastral survey, Global Positioning Survey, photo interpretation or other technique. Physical line drop measurements (for bathymetry), which are presumed to be vertical, but which often deviate slightly from the vertical because of currents in the water, movement of the ship from which measurements are made, slope of the bottom surface, etc.

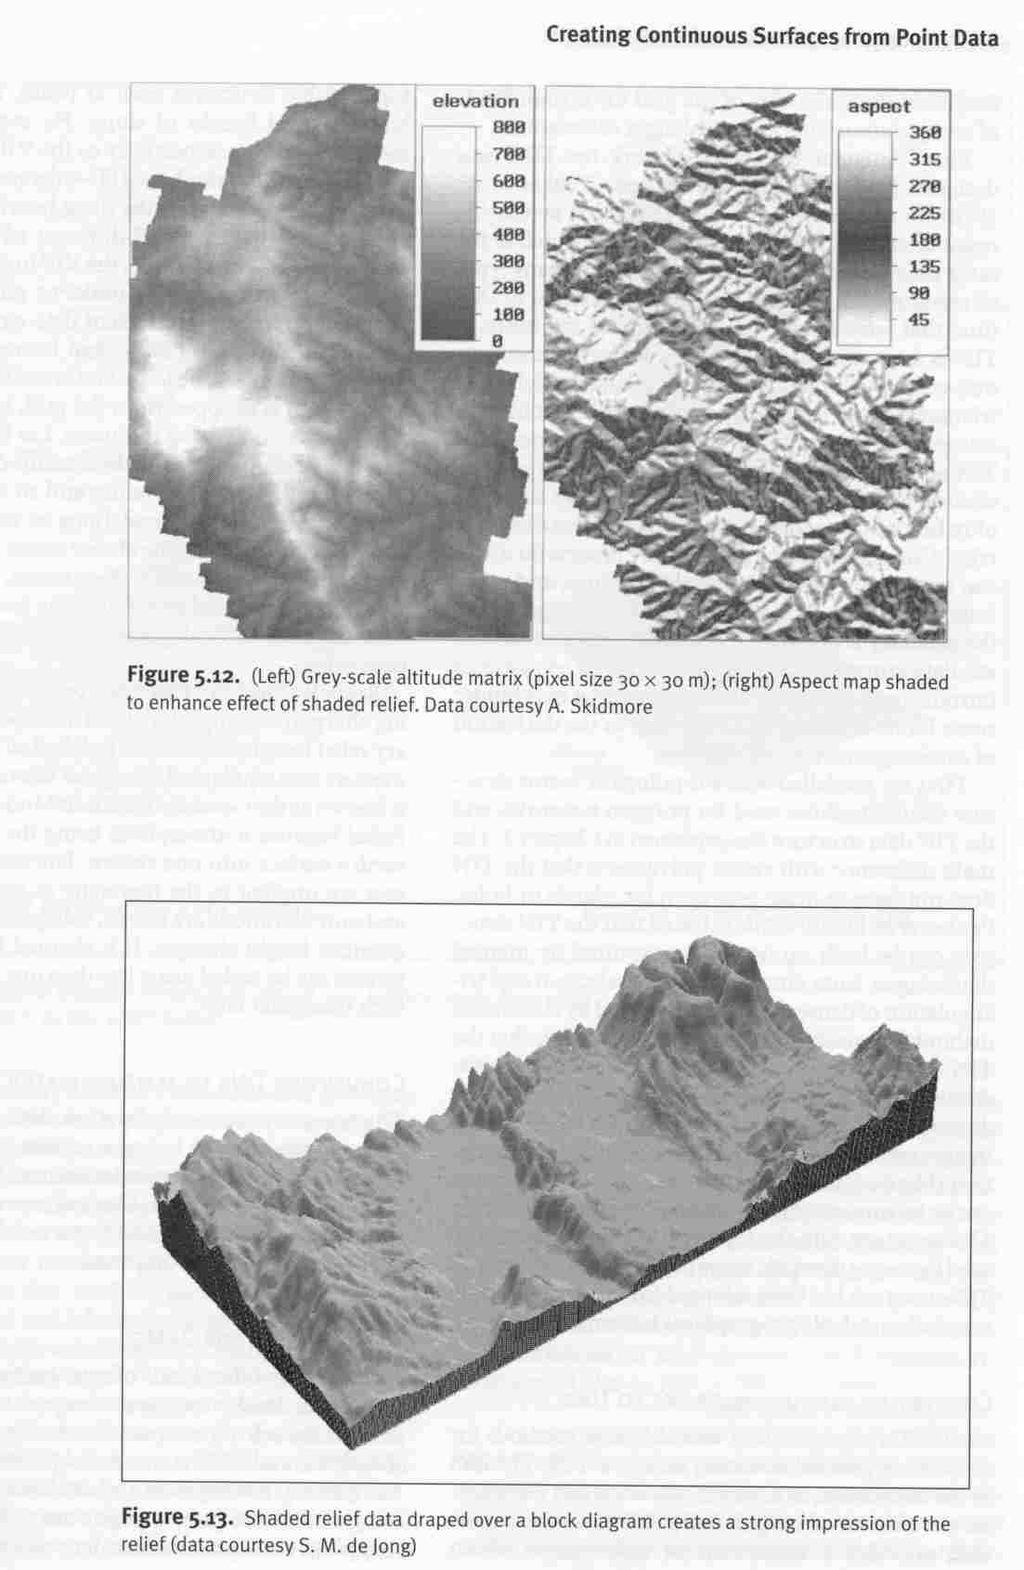
6 Hill shaded relief

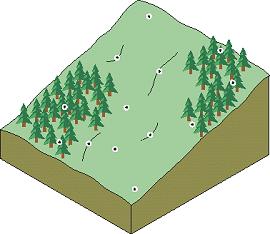
7 Slope draped over a DEM
8 TIN and GRID These are called numeric or statistical surfaces, because they are generated from numbers (coordinate points). TIN and gridded networks are the predominant methods of representing surfaces.
9
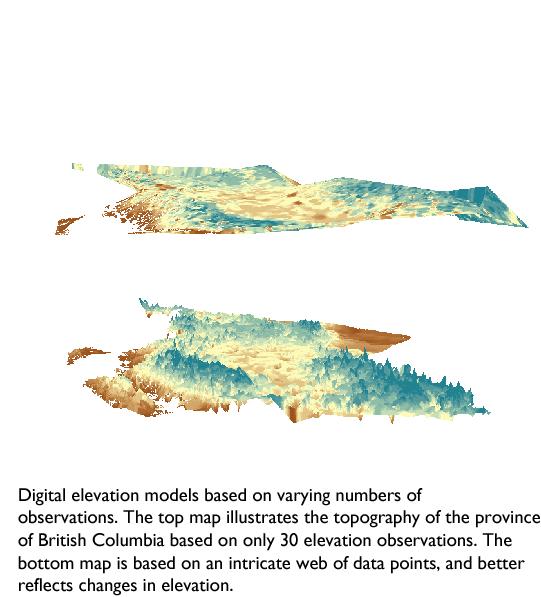
10 Limitations to DTMs There is no way that we could know all elevation values so we interpolate intermediate values. The constriction that faces us is that geometry only has three values associated with it: x,y,z. But you cannot describe a continuous surface using only three variables at discrete intervals. The result is that all DTMs are only approximations of the terrain.
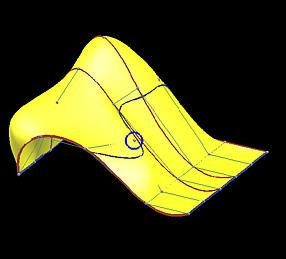
11 2.5 D vs 3D surfaces What a DTM represents is a number of x,y,z points. We use existing points to compute new spot heights between existing data points. Often DTMs are referred to as 2.5 dimensional rather than 3 dimensional. The reason for this is that each x,y point can only store one z value. In a real three dimensional surface, several z values can be stored with each x,y coordinate pair. E.g. elevation heights, a population density surface and the height of the tree-cover or a building could all be stored with one x,y pair. (x,y,z 1, z 2, z 3, z 4, )
12
13 Differences btwn 2.5D and 3D A real 3-D surface can handle different layers of elevations. Another advantage of 3-D models is that they can be used to calculate volumes. On the other hand, 2.5 D models are excellent for visualization of data. It is easy to envisage how terrain looks from above using a DTM. Thus for geographical purposes, a 2.5 D model is fine.
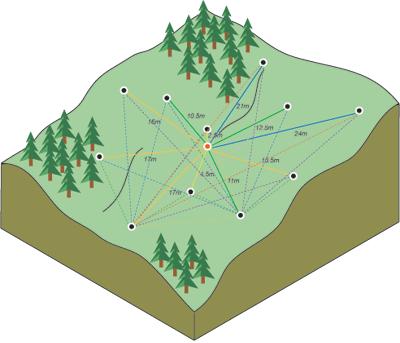
14 Role of interpolation We use interpolation (or inference based on known values) to compute unknown values on our surface. If we didn t structure the points in some way, then all known data points would have to be searched in order to calculate a new point at a given x,y coordinate pair. So instead, we build topology or contiguity relations into the DTM in order to circumscribe the search for relevant points to use to calculate new points.
15 GRID and TIN model There are two data structures used for DTMs: TIN and raster. TIN stores topology explicity while raster stores it implicitly.
16 GRID GRID models for terrain. With grid terrain models, each square of the grid cell is assumed to have a homogeneous elevation so the system is most accurate when the cells are small relative to the area being represented. Since the size of the cells is constant, areas with great terrain variation might have too few cells representing them while areas with very regular elevation might be over-represented. The grid model works best when there aren t any dramatic shifts in the terrain, like faults or cliffs.
17
18 GRID 2 One way to make the grid model more flexible is to store the data as individual points and then generate grids of varying size, depending on the terrain. So an area of tumultuous terrain would be represented by very small cells and a low, lying plain would be represented by large cells. Thus the grid model for terrain representation can be thought of in two ways: (i) a point models that is displayed by grid cells; or (ii) an true grid model (raster) that is based on values averaged over the square rasters.
19
20 Topology of GRID model In the grid model, the elevation values are stored in a matrix. The topology or contiguity is expressed by the column and row numbers. It is an implicit topology.
21 Assigning values to GRID There are two way of determining the values associated with each square of the grid system: (i) area search based on a point cloud; and (ii) line search from intersections with contour lines.
22
23 Point cloud and line search The assumption with the point cloud method is that the terrain varies most in areas where many data points have been collected. Thus the cloud can be used either to (i)determine the raster size; or (ii) to pick the elevation values for a fixed raster size. With the line search method, the intersection with contour lines is used to assign grid cells. Note that in cases where there are multiple intersections that pertain to a given cell, the points can be averaged.
24 Questions What about cells that don t intersect with any contour lines? Why does the line intersection method exist?
25 TINs for representing terrain TIN is an array of triangular areas with their corners located at points of significance in describing terrain. The areas of the triangles may vary and, similar to assumptions of homogeneity associated with cell values in the grid system, the angle of inclination is considered constant for each face of the triangle.
26
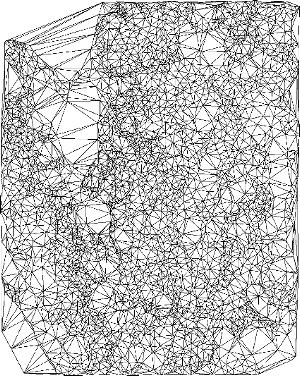
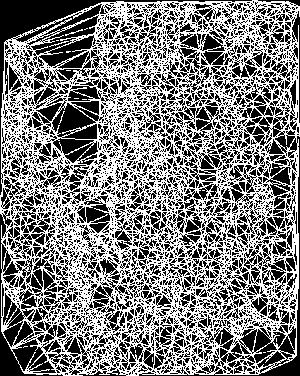
27 Delauney triangulation We prefer equilateral triangles in a TIN and a TIN in which all the triangles are as equilateral as possible is called a Delaunay triangulation. The triangles for a TIN are stored in a topological data structure with topology explicitly defined (i.e the relationship between all arcs, nodes and their neighbours. The TIN is more difficult to build than a grid model but, once established, is more efficient to store because it takes up less space. Only the points that describe elevation shifts are stored.

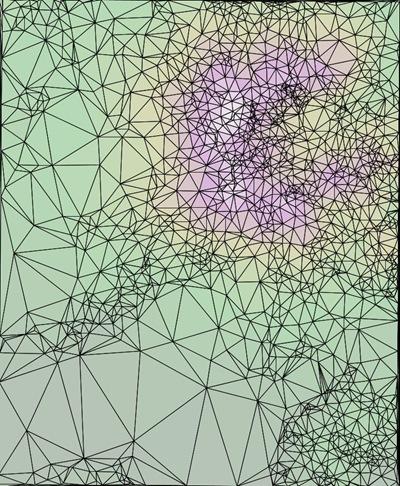
28 Simple Delauney Triangulation and Voronoi network.
29 Two Adjacent Triangles Which (a) Violate and (b) Honour the Delauney Criterion. Delauney triangles must not include vertices of the circumcircles of the triangles in the network.
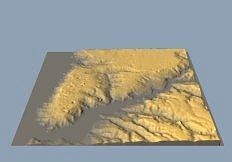
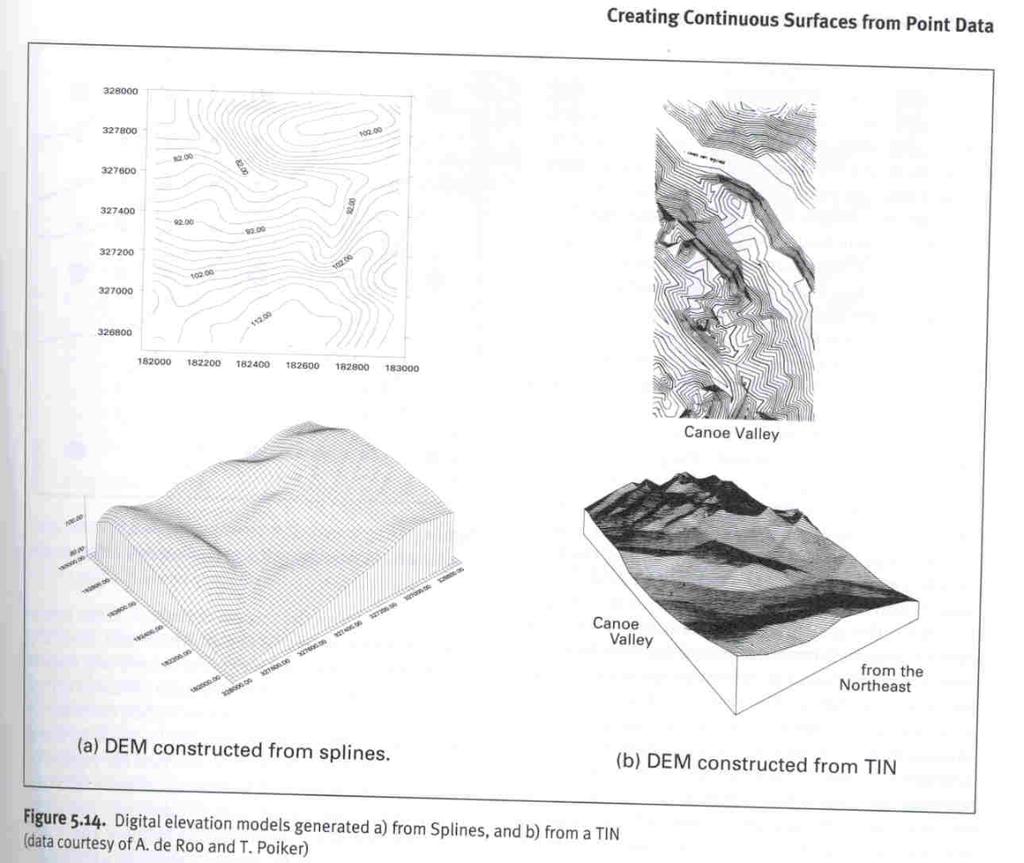
30 A triangulation of spot heights


31 A wire frame developed using triangulation of spot heights.
32 Isolines for terrain models Isolines or lines connecting points of equal elevation can be used to depict terrain. This is the basis of the traditional topo map. Ideally, you would have the densest point sets in areas where there is most variation in the terrain. It is also possible to use a combination of isolines and point elevations. e.g. use of survey elevation marks and isolines.
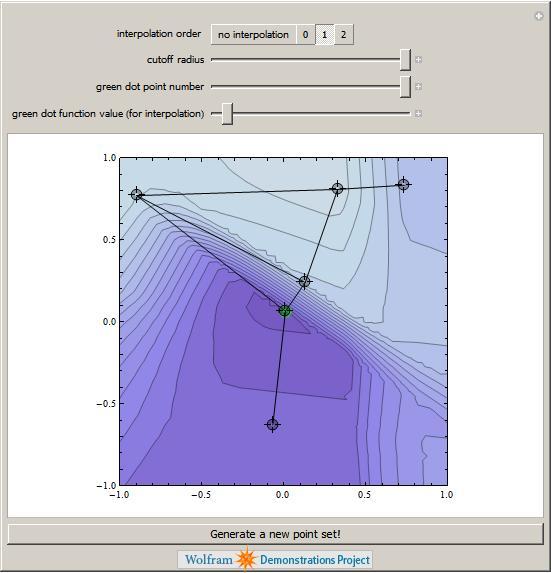
33 Introduction to interpolation Spatial interpolation is the procedure of estimating the value of properties at unsampled sites within the area covered by existing observations. Interpolation is a type of proximity operation in which attribute values are assigned to new points on the basis of values of existing points. Usually the operation defines a search area in which it looks for points to use in order to assign the new values.
34 4 mains steps in interpolation 1. Identify a base point 2. Define or compute the search area 3. Select or search for objects (existing data and/or points to assign new values) 4. Manipulate the attribute data in accordance with the interpolation technique chosen Note: in almost all cases the property must be interval or ratio scaled
35 Rationale for interpolation Can be thought of as the reverse of the process used to select the few points from a DEM which accurately represent the surface Rationale behind spatial interpolation is the observation that points close together in space are more likely to have similar values than points far apart (Tobler's Law of Geography).
36 Uses for interpolation to provide contours for displaying data graphically to calculate some property of the surface at a given point to change the unit of comparison when using different data structures in different layers frequently used as an aid in the spatial decision making process both in physical and human geography, and in related disciplines such as mineral prospecting and hydrocarbon exploration many of the techniques of spatial interpolation are twodimensional developments of the one dimensional methods originally developed for time series analysis
37 Types of interpolation processes There are several different ways to classify spatial interpolation procedures.
38 Point interpolation/areal interpolation Given a number of points whose locations and values are known, determine the values of other points at predetermined locations. Point interpolation is used for data which can be collected at point locations. e.g. weather station readings, spot heights, oil well readings, porosity measurements
39
40 Point based 2 Interpolated grid points are often used as the data input to computer contouring algorithms. Once the grid of points has been determined, isolines (e.g. contours) can be threaded between them using a linear interpolation on the straight line between each pair of grid points. This is the most frequent type of interpolation in GIS.
41 Line to point e.g. contours to elevation grids. We use this when data is taken from existing contour (topo) maps
42 Areal interpolation Given a set of data mapped on one set of source zones determine the values of the data for a different set of target zones. e.g. given population counts for census tracts, estimate populations for electoral districts

43 Areal interpolation from census areas to a single grid cell
44 Global vs local interpolators global interpolators determine a single function which is mapped across the whole region o a change in one input value affects the entire map local interpolators apply an algorithm repeatedly to a small portion of the total set of points o a change in an input value only affects the result within the window
45 Local interpolation
46 Global Interpolation
47 Global/local 2 global algorithms tend to produce smoother surfaces with less abrupt changes o are used when there is an hypothesis about the form of the surface, e.g. a trend some local interpolators may be extended to include a large proportion of the data points in set, thus making them in a sense global the distinction between global and local interpolators is thus a continuum and not a dichotomy o this has led to some confusion and controversy in the literature
48 Exact vs Approximate interpolators Exact interpolators honor the data points upon which the interpolation is based o the surface passes through all points whose values are known o honoring data points is seen as an important feature in many applications e.g. the oil industry o proximal interpolators, B-splines and Kriging methods all honor the given data points Kriging, as discussed below, may incorporate a nugget effect and if this is the case the concept of an exact interpolator ceases to be appropriate.
49 Exact Interpolation
50 Approximate interpolators Approximate interpolators are used when there is some uncertainty about the given surface values o this utilizes the belief that in many data sets there are global trends, which vary slowly, overlain by local fluctuations, which vary rapidly and produce uncertainty (error) in the recorded values o the effect of smoothing will therefore be to reduce the effects of error on the resulting surface
51 Stochastic and deterministic models We divide discussion of terrain models into two element: random (stochastic) and systematic (deterministic) Stochastic models: where each new value (elevation in this case) is determined without reference to existing values. The continuously varying relief generated in a DTM is the product of random number generation (in the simplest sense) in that we estimate the in-between values.
52 Deterministic models The second element that goes into making terrain models is systematic. This is the part that is based on real elevation data and allows us to take into account steep cliffs and faults and depressions cut out to let roads pass through mountains. These systematic elements that comprise a DTM are expressed in data as single points or a series of isolines associated with a given value.
53 Stochastic/Deterministic interpolators Stochastic methods incorporate the concept of randomness o the interpolated surface is conceptualized as one of many that might have been observed, all of which could have produced the known data points Stochastic interpolators include trend surface analysis, Fourier analysis and Kriging Procedures such as trend surface analysis allow the statistical significance of the surface and uncertainty of the predicted values to be calculated.
54
55
56 Gradual/Abrupt interpolators A typical example of a gradual interpolater is inverse distance weighting. o usually produces an interpolated surface with gradual changes o however, if the number of points used in the moving average is reduced to a small number, or even one, there would be abrupt changes in the surface o IDW is a simple way of guessing the values of a field at locations where measurements are not available.
57
58 Abrupt interpolators It may be necessary to include barriers in the interpolation process o semipermeable, e.g. weather fronts o will produce quickly changing but continuous values o impermeable barriers, e.g. geologic faults o will produce abrupt changes
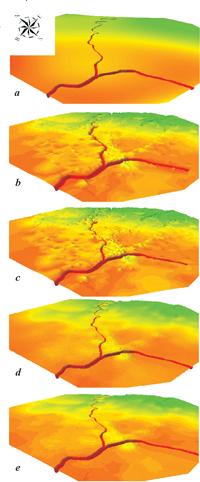
59 Kriging (an example of interpolation) Based on principle that variable may be too complex to be modelled by a smooth mathematical function BUT has spatial dependence. Is an exact interpolator. Based on assumption that the spatial variation of a variable can be related three influences: (i) structural; (ii) random spatial correlation; and (iii) random noise or error. Takes into account a general trend component.
60
61
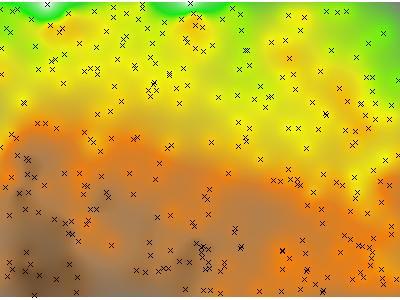
62 Kriging of rainfall data in Australia
63 Common uses of DEMs Creation of orthophoto maps Cut and fill problems in road design and other civil engineering and military engineering applications Analysis of cross country visibility Planning of roads, locations of dams etc. Statistical analysis and comparison of terrain Source data for derived maps of aspect, profile curvature, shaded relief and hydrological and ecological modelling Background for thematic maps
64
Creating Surfaces. Steve Kopp Steve Lynch
 Steve Kopp Steve Lynch Overview Learn the types of surfaces and the data structures used to store them Emphasis on surface interpolation Learn the interpolation workflow Understand how interpolators work
What can we represent as a Surface?
 Geography 38/42:376 GIS II Topic 7: Surface Representation and Analysis (Chang: Chapters 13 & 15) DeMers: Chapter 10 What can we represent as a Surface? Surfaces can be used to represent: Continuously
DATA MODELS IN GIS. Prachi Misra Sahoo I.A.S.R.I., New Delhi
 DATA MODELS IN GIS Prachi Misra Sahoo I.A.S.R.I., New Delhi -110012 1. Introduction GIS depicts the real world through models involving geometry, attributes, relations, and data quality. Here the realization
Esri International User Conference. San Diego, California. Technical Workshops. July Creating Surfaces. Steve Kopp and Steve Lynch
 Esri International User Conference San Diego, California Technical Workshops July 2011 Creating Surfaces Steve Kopp and Steve Lynch Overview Learn the types of surfaces and the data structures used to
Lesson 5 overview. Concepts. Interpolators. Assessing accuracy Exercise 5
 Interpolation Tools Lesson 5 overview Concepts Sampling methods Creating continuous surfaces Interpolation Density surfaces in GIS Interpolators IDW, Spline,Trend, Kriging,Natural neighbors TopoToRaster
GEOGRAPHIC INFORMATION SYSTEMS Lecture 24: Spatial Analyst Continued
 GEOGRAPHIC INFORMATION SYSTEMS Lecture 24: Spatial Analyst Continued Spatial Analyst - Spatial Analyst is an ArcGIS extension designed to work with raster data - in lecture I went through a series of demonstrations
Lecture 9. Raster Data Analysis. Tomislav Sapic GIS Technologist Faculty of Natural Resources Management Lakehead University
 Lecture 9 Raster Data Analysis Tomislav Sapic GIS Technologist Faculty of Natural Resources Management Lakehead University Raster Data Model The GIS raster data model represents datasets in which square
Lecture 6: GIS Spatial Analysis. GE 118: INTRODUCTION TO GIS Engr. Meriam M. Santillan Caraga State University
 Lecture 6: GIS Spatial Analysis GE 118: INTRODUCTION TO GIS Engr. Meriam M. Santillan Caraga State University 1 Spatial Data It can be most simply defined as information that describes the distribution
Contents of Lecture. Surface (Terrain) Data Models. Terrain Surface Representation. Sampling in Surface Model DEM
 Data Models. Terrain Surface Representation. Sampling in Surface Model DEM") Lecture 13: Advanced Data Models: Terrain mapping and Analysis Contents of Lecture Surface Data Models DEM GRID Model TIN Model Visibility Analysis Geography 373 Spring, 2006 Changjoo Kim 11/29/2006 1
Lecture 13: Advanced Data Models: Terrain mapping and Analysis Contents of Lecture Surface Data Models DEM GRID Model TIN Model Visibility Analysis Geography 373 Spring, 2006 Changjoo Kim 11/29/2006 1
Representing Geography
 Data models and axioms Chapters 3 and 7 Representing Geography Road map Representing the real world Conceptual models: objects vs fields Implementation models: vector vs raster Vector topological model
CPSC 695. Methods for interpolation and analysis of continuing surfaces in GIS Dr. M. Gavrilova
 CPSC 695 Methods for interpolation and analysis of continuing surfaces in GIS Dr. M. Gavrilova Overview Data sampling for continuous surfaces Interpolation methods Global interpolation Local interpolation
Review of Cartographic Data Types and Data Models
 Review of Cartographic Data Types and Data Models GIS Data Models Raster Versus Vector in GIS Analysis Fundamental element used to represent spatial features: Raster: pixel or grid cell. Vector: x,y coordinate
DIGITAL TERRAIN MODELLING. Endre Katona University of Szeged Department of Informatics
 DIGITAL TERRAIN MODELLING Endre Katona University of Szeged Department of Informatics katona@inf.u-szeged.hu The problem: data sources data structures algorithms DTM = Digital Terrain Model Terrain function:
Watershed Sciences 4930 & 6920 GEOGRAPHIC INFORMATION SYSTEMS
 HOUSEKEEPING Watershed Sciences 4930 & 6920 GEOGRAPHIC INFORMATION SYSTEMS Quizzes Lab 8? WEEK EIGHT Lecture INTERPOLATION & SPATIAL ESTIMATION Joe Wheaton READING FOR TODAY WHAT CAN WE COLLECT AT POINTS?
IMPROVING THE ACCURACY OF DIGITAL TERRAIN MODELS
 STUDIA UNIV. BABEŞ BOLYAI, INFORMATICA, Volume XLV, Number 1, 2000 IMPROVING THE ACCURACY OF DIGITAL TERRAIN MODELS GABRIELA DROJ Abstract. The change from paper maps to GIS, in various kinds of geographical
Lecture 4: Digital Elevation Models
 Lecture 4: Digital Elevation Models GEOG413/613 Dr. Anthony Jjumba 1 Digital Terrain Modeling Terms: DEM, DTM, DTEM, DSM, DHM not synonyms. The concepts they illustrate are different Digital Terrain Modeling
Spatial Interpolation & Geostatistics
 (Z i Z j ) 2 / 2 Spatial Interpolation & Geostatistics Lag Lag Mean Distance between pairs of points 1 Tobler s Law All places are related, but nearby places are related more than distant places Corollary:
Geostatistics Predictions with Deterministic Procedures
 Instituto Superior de Estatística e Gestão de Informação Universidade Nova de Lisboa Master of Science in Geospatial Technologies Geostatistics Predictions with Deterministic Procedures Carlos Alberto
Surface Analysis with 3D Analyst
 2013 Esri International User Conference July 8 12, 2013 San Diego, California Technical Workshop Surface Analysis with 3D Analyst Khalid H. Duri Esri UC2013. Technical Workshop. Why use 3D GIS? Because
Spatial Interpolation - Geostatistics 4/3/2018
 Spatial Interpolation - Geostatistics 4/3/201 (Z i Z j ) 2 / 2 Spatial Interpolation & Geostatistics Lag Distance between pairs of points Lag Mean Tobler s Law All places are related, but nearby places
GIS Tools - Geometry. A GIS stores data as different layers of information Different feature types are stored in individual files.
 A Definition of GIS GIS is a system of hardware, software, and procedures designed to support the capture, management, manipulation, analysis, modeling and display of spatially referenced data for solving
Understanding Geospatial Data Models
 Understanding Geospatial Data Models 1 A geospatial data model is a formal means of representing spatially referenced information. It is a simplified view of physical entities and a conceptualization of
Surface Creation & Analysis with 3D Analyst
 Esri International User Conference July 23 27 San Diego Convention Center Surface Creation & Analysis with 3D Analyst Khalid Duri Surface Basics Defining the surface Representation of any continuous measurement
Applied Cartography and Introduction to GIS GEOG 2017 EL. Lecture-7 Chapters 13 and 14
 Applied Cartography and Introduction to GIS GEOG 2017 EL Lecture-7 Chapters 13 and 14 Data for Terrain Mapping and Analysis DEM (digital elevation model) and TIN (triangulated irregular network) are two
AUTOMATIC EXTRACTION OF TERRAIN SKELETON LINES FROM DIGITAL ELEVATION MODELS
 AUTOMATIC EXTRACTION OF TERRAIN SKELETON LINES FROM DIGITAL ELEVATION MODELS F. Gülgen, T. Gökgöz Yildiz Technical University, Department of Geodetic and Photogrammetric Engineering, 34349 Besiktas Istanbul,
Dijkstra's Algorithm
 Shortest Path Algorithm Dijkstra's Algorithm To find the shortest path from the origin node to the destination node No matrix calculation Floyd s Algorithm To find all the shortest paths from the nodes
Accuracy, Support, and Interoperability. Michael F. Goodchild University of California Santa Barbara
 Accuracy, Support, and Interoperability Michael F. Goodchild University of California Santa Barbara The traditional view Every object has a true position and set of attributes with enough time and resources
Maps as Numbers: Data Models
 Maps as Numbers: Data Models vertices E Reality S E S arcs S E Conceptual Models nodes E Logical Models S Start node E End node S Physical Models 1 The Task An accurate, registered, digital map that can
Class #2. Data Models: maps as models of reality, geographical and attribute measurement & vector and raster (and other) data structures
 data structures") Class #2 Data Models: maps as models of reality, geographical and attribute measurement & vector and raster (and other) data structures Role of a Data Model Levels of Data Model Abstraction GIS as Digital
Class #2 Data Models: maps as models of reality, geographical and attribute measurement & vector and raster (and other) data structures Role of a Data Model Levels of Data Model Abstraction GIS as Digital
Introduction to 3D Analysis. Jinwu Ma Jie Chang Khalid Duri
 Introduction to 3D Analysis Jinwu Ma Jie Chang Khalid Duri Area & Volume 3D Analyst Features Detect Change Determine Cut/Fill Calculate Surface Area & Volume Data Management Data Creation Data Conversion
product description product capabilities
 product description Geosoft s Airborne Geophy s- ics application for the Oasis montaj software platform provides field geophysicists with the ability to process, filter, grid, and map data from airborne
GEOGRAPHIC INFORMATION SYSTEMS Lecture 25: 3D Analyst
 GEOGRAPHIC INFORMATION SYSTEMS Lecture 25: 3D Analyst 3D Analyst - 3D Analyst is an ArcGIS extension designed to work with TIN data (triangulated irregular network) - many of the tools in 3D Analyst also
M. Andrea Rodríguez-Tastets. I Semester 2008
 M. -Tastets Universidad de Concepción,Chile andrea@udec.cl I Semester 2008 Outline refers to data with a location on the Earth s surface. Examples Census data Administrative boundaries of a country, state
17/07/2013 RASTER DATA STRUCTURE GIS LECTURE 4 GIS DATA MODELS AND STRUCTURES RASTER DATA MODEL& STRUCTURE TIN- TRIANGULAR IRREGULAR NETWORK
 RASTER DATA STRUCTURE GIS LECTURE 4 GIS DATA MODELS AND STRUCTURES Space is subdivided into regular grids of square grid cells or other forms of polygonal meshes known as picture elements (pixels) the
L7 Raster Algorithms
 L7 Raster Algorithms NGEN6(TEK23) Algorithms in Geographical Information Systems by: Abdulghani Hasan, updated Nov 216 by Per-Ola Olsson Background Store and analyze the geographic information: Raster
Raster GIS. Raster GIS 11/1/2015. The early years of GIS involved much debate on raster versus vector - advantages and disadvantages
 Raster GIS Google Earth image (raster) with roads overlain (vector) Raster GIS The early years of GIS involved much debate on raster versus vector - advantages and disadvantages 1 Feb 21, 2010 MODIS satellite
On the Selection of an Interpolation Method for Creating a Terrain Model (TM) from LIDAR Data
 from LIDAR Data") On the Selection of an Interpolation Method for Creating a Terrain Model (TM) from LIDAR Data Tarig A. Ali Department of Technology and Geomatics East Tennessee State University P. O. Box 70552, Johnson
On the Selection of an Interpolation Method for Creating a Terrain Model (TM) from LIDAR Data Tarig A. Ali Department of Technology and Geomatics East Tennessee State University P. O. Box 70552, Johnson
Geographic Surfaces. David Tenenbaum EEOS 383 UMass Boston
 Geographic Surfaces Up to this point, we have talked about spatial data models that operate in two dimensions How about the rd dimension? Surface the continuous variation in space of a third dimension
SPATIAL DATA MODELS Introduction to GIS Winter 2015
 SPATIAL DATA MODELS Introduction to GIS Winter 2015 GIS Data Organization The basics Data can be organized in a variety of ways Spatial location, content (attributes), frequency of use Come up with a system
DIGITAL TERRAIN MODELS
 DIGITAL TERRAIN MODELS 1 Digital Terrain Models Dr. Mohsen Mostafa Hassan Badawy Remote Sensing Center GENERAL: A Digital Terrain Models (DTM) is defined as the digital representation of the spatial distribution
Longley Chapter 3. Representations
 Longley Chapter 3 Digital Geographic Data Representation Geographic Data Type Data Models Representing Spatial and Temporal Data Attributes The Nature of Geographic Data Representations Are needed to convey
Getting Started with Spatial Analyst. Steve Kopp Elizabeth Graham
 Getting Started with Spatial Analyst Steve Kopp Elizabeth Graham Spatial Analyst Overview Over 100 geoprocessing tools plus raster functions Raster and vector analysis Construct workflows with ModelBuilder,
Implementation of Flight Simulator using 3-Dimensional Terrain Modeling
 Implementation of Flight Simulator using 3-Dimensional Terrain Modeling 1 1, First Author School of Computer Engineering, Hanshin University, Osan City, S. Korea, stryoo@hs.ac.kr Abstract During the last
Spatial Analysis and Modeling (GIST 4302/5302) Guofeng Cao Department of Geosciences Texas Tech University
 Guofeng Cao Department of Geosciences Texas Tech University") Spatial Analysis and Modeling (GIST 4302/5302) Guofeng Cao Department of Geosciences Texas Tech University 1 Outline of This Week Last topic, we learned: Spatial autocorrelation of areal data Spatial regression
Spatial Analysis and Modeling (GIST 4302/5302) Guofeng Cao Department of Geosciences Texas Tech University 1 Outline of This Week Last topic, we learned: Spatial autocorrelation of areal data Spatial regression
Spatial Analysis (Vector) II
 II") Spatial Analysis (Vector) II GEOG 300, Lecture 9 Dr. Anthony Jjumba 1 A Spatial Network is a set of geographic locations interconnected in a system by a number of routes is a system of linear features
Spatial Analysis (Vector) II GEOG 300, Lecture 9 Dr. Anthony Jjumba 1 A Spatial Network is a set of geographic locations interconnected in a system by a number of routes is a system of linear features
Surface Modeling with GIS
 Surface Modeling with GIS By Abdul Mohsen Al Maskeen ID # 889360 For CRP 514: Introduction to GIS Course Instructor: Dr. Baqer Al-Ramadan Date: December 29, 2004 1 Outline Page # Outline -------------------------------------------------------------
Geographic Information Systems (GIS) Spatial Analyst [10] Dr. Mohammad N. Almasri. [10] Spring 2018 GIS Dr. Mohammad N. Almasri Spatial Analyst
![Geographic Information Systems (GIS) Spatial Analyst [10] Dr. Mohammad N. Almasri. [10] Spring 2018 GIS Dr. Mohammad N. Almasri Spatial Analyst](/thumbs/80/81171101.jpg "Geographic Information Systems (GIS) Spatial Analyst [10] Dr. Mohammad N. Almasri. [10] Spring 2018 GIS Dr. Mohammad N. Almasri Spatial Analyst") Geographic Information Systems (GIS) Spatial Analyst [10] Dr. Mohammad N. Almasri 1 Preface POINTS, LINES, and POLYGONS are good at representing geographic objects with distinct shapes They are less good
Geographic Information Systems (GIS) Spatial Analyst [10] Dr. Mohammad N. Almasri 1 Preface POINTS, LINES, and POLYGONS are good at representing geographic objects with distinct shapes They are less good
Lab 12: Sampling and Interpolation
 Lab 12: Sampling and Interpolation What You ll Learn: -Systematic and random sampling -Majority filtering -Stratified sampling -A few basic interpolation methods Data for the exercise are in the L12 subdirectory.
Geol 588. GIS for Geoscientists II. Zonal functions. Feb 22, Zonal statistics. Interpolation. Zonal statistics Sp. Analyst Tools - Zonal.
 Zonal functions Geol 588 GIS for Geoscientists II Feb 22, 2011 Zonal statistics Interpolation Zonal statistics Sp. Analyst Tools - Zonal Choose correct attribute for zones (usually: must be unique ID for
LECTURE 2 SPATIAL DATA MODELS
 LECTURE 2 SPATIAL DATA MODELS Computers and GIS cannot directly be applied to the real world: a data gathering step comes first. Digital computers operate in numbers and characters held internally as binary
Investigation of Sampling and Interpolation Techniques for DEMs Derived from Different Data Sources
 Investigation of Sampling and Interpolation Techniques for DEMs Derived from Different Data Sources FARRAG ALI FARRAG 1 and RAGAB KHALIL 2 1: Assistant professor at Civil Engineering Department, Faculty
LAB #7 Creating TIN and 3D scenes (ArcScene) GISC, UNIVERSITY OF CALIFORNIA BERKELEY
 GISC, UNIVERSITY OF CALIFORNIA BERKELEY") LAB #7 Creating TIN and 3D scenes (ArcScene) GISC, UNIVERSITY OF CALIFORNIA BERKELEY The purpose of this laboratory is to introduce and explore surface data analysis using a vector data model: TIN. We
LAB #7 Creating TIN and 3D scenes (ArcScene) GISC, UNIVERSITY OF CALIFORNIA BERKELEY The purpose of this laboratory is to introduce and explore surface data analysis using a vector data model: TIN. We
Lecture 21 - Chapter 8 (Raster Analysis, part2)
") GEOL 452/552 - GIS for Geoscientists I Lecture 21 - Chapter 8 (Raster Analysis, part2) Today: Digital Elevation Models (DEMs), Topographic functions (surface analysis): slope, aspect hillshade, viewshed,
GEOL 452/552 - GIS for Geoscientists I Lecture 21 - Chapter 8 (Raster Analysis, part2) Today: Digital Elevation Models (DEMs), Topographic functions (surface analysis): slope, aspect hillshade, viewshed,
Raster Data. James Frew ESM 263 Winter
 Raster Data 1 Vector Data Review discrete objects geometry = points by themselves connected lines closed polygons attributes linked to feature ID explicit location every point has coordinates 2 Fields
Roadway Design using GeoTools
 Roadway Design using GeoTools Introduction GeoTools is a general-purpose productivity tool for users of all types of geographic data. In the Civil Tools section, there are many tools for Civil engineering
GEOGRAPHIC INFORMATION SYSTEMS Lecture 18: Spatial Modeling
 Spatial Analysis in GIS (cont d) GEOGRAPHIC INFORMATION SYSTEMS Lecture 18: Spatial Modeling - the basic types of analysis that can be accomplished with a GIS are outlined in The Esri Guide to GIS Analysis
v TUFLOW-2D Hydrodynamics SMS Tutorials Time minutes Prerequisites Overview Tutorial
 v. 12.2 SMS 12.2 Tutorial TUFLOW-2D Hydrodynamics Objectives This tutorial describes the generation of a TUFLOW project using the SMS interface. This project utilizes only the two dimensional flow calculation
Getting Started with Spatial Analyst. Steve Kopp Elizabeth Graham
 Getting Started with Spatial Analyst Steve Kopp Elizabeth Graham Workshop Overview Fundamentals of using Spatial Analyst What analysis capabilities exist and where to find them How to build a simple site
Introduction to GIS 2011
 Introduction to GIS 2011 Digital Elevation Models CREATING A TIN SURFACE FROM CONTOUR LINES 1. Start ArcCatalog from either Desktop or Start Menu. 2. In ArcCatalog, create a new folder dem under your c:\introgis_2011
Copyright The McGraw-Hill Companies, Inc. Permission required for reproduction or display.
 Chapter 13. TERRAIN MAPPING AND ANALYSIS 13.1 Data for Terrain Mapping and Analysis 13.1.1 DEM 13.1.2 TIN Box 13.1 Terrain Data Format 13.2 Terrain Mapping 13.2.1 Contouring 13.2.2 Vertical Profiling 13.2.3
Digital Elevation Models (DEM)
") Digital Elevation Models (DEM) Digital representation of the terrain surface also referred to as Digital Terrain Models (DTM) Digital Elevation Models (DEM) How has relief depiction changed with digital
Digital Elevation Models (DEM) Digital representation of the terrain surface also referred to as Digital Terrain Models (DTM) Digital Elevation Models (DEM) How has relief depiction changed with digital
Learn the various 3D interpolation methods available in GMS
 v. 10.4 GMS 10.4 Tutorial Learn the various 3D interpolation methods available in GMS Objectives Explore the various 3D interpolation algorithms available in GMS, including IDW and kriging. Visualize the
Engineering Geology. Engineering Geology is backbone of civil engineering. Topographic Maps. Eng. Iqbal Marie
 Engineering Geology Engineering Geology is backbone of civil engineering Topographic Maps Eng. Iqbal Marie Maps: are a two dimensional representation, of an area or region. There are many types of maps,
Analytical and Computer Cartography Winter Lecture 9: Geometric Map Transformations
 Analytical and Computer Cartography Winter 2017 Lecture 9: Geometric Map Transformations Cartographic Transformations Attribute Data (e.g. classification) Locational properties (e.g. projection) Graphics
Spatial Interpolation & Geostatistics
 (Z i Z j ) 2 / 2 Spatial Interpolation & Geostatistics Lag Lag Mean Distance between pairs of points 11/3/2016 GEO327G/386G, UT Austin 1 Tobler s Law All places are related, but nearby places are related
Maps as Numbers: Data Models
 Maps as Numbers: Data Models vertices nodes tart node nd node arcs Reality Conceptual Models The Task An accurate, registered, digital map that can be queried and analyzed Translate: Real World Locations,
Chapter 1. Introduction
 Introduction 1 Chapter 1. Introduction We live in a three-dimensional world. Inevitably, any application that analyzes or visualizes this world relies on three-dimensional data. Inherent characteristics
Tutorial (Intermediate level): Dense Cloud Classification and DTM generation with Agisoft PhotoScan Pro 1.1
: Dense Cloud Classification and DTM generation with Agisoft PhotoScan Pro 1.1") Tutorial (Intermediate level): Dense Cloud Classification and DTM generation with Agisoft PhotoScan Pro 1.1 This tutorial illustrates how to perform dense point cloud classification in manual and automatic
Tutorial (Intermediate level): Dense Cloud Classification and DTM generation with Agisoft PhotoScan Pro 1.1 This tutorial illustrates how to perform dense point cloud classification in manual and automatic
GIS Visualization, 3D Visualization and Animation. Tomislav Sapic GIS Technologist Faculty of Natural Resources Management Lakehead University
 GIS Visualization, 3D Visualization and Animation Tomislav Sapic GIS Technologist Faculty of Natural Resources Management Lakehead University Definitions 3D Visualization: Presenting or observing spatial,
Graphic Display of Vector Object
 What is GIS? GIS stands for Geographic Information Systems, although the term Geographic Information Science is gaining popularity. A GIS is a software platform for storing, organizing, viewing, querying,
UPDATING ELEVATION DATA BASES
 UPDATING ELEVATION DATA BASES u MERGING OLD AND NEW DATA Poul Frederiksen Associate Professor Institute of Surveying and Photogrammetry Technical University of Denmark DK 2800 Lyngby, Denmark ISPRS Commission
Algorithms for GIS csci3225
 Algorithms for GIS csci3225 Laura Toma Bowdoin College Spatial data types and models Spatial data in GIS satellite imagery planar maps surfaces networks point cloud (LiDAR) Spatial data in GIS satellite
v Mesh Generation SMS Tutorials Prerequisites Requirements Time Objectives
 v. 12.3 SMS 12.3 Tutorial Mesh Generation Objectives This tutorial demostrates the fundamental tools used to generate a mesh in the SMS. Prerequisites SMS Overview SMS Map Module Requirements Mesh Module
Lab 12: Sampling and Interpolation
 Lab 12: Sampling and Interpolation What You ll Learn: -Systematic and random sampling -Majority filtering -Stratified sampling -A few basic interpolation methods Videos that show how to copy/paste data
RECOMMENDATION ITU-R P DIGITAL TOPOGRAPHIC DATABASES FOR PROPAGATION STUDIES. (Question ITU-R 202/3)
") Rec. ITU-R P.1058-1 1 RECOMMENDATION ITU-R P.1058-1 DIGITAL TOPOGRAPHIC DATABASES FOR PROPAGATION STUDIES (Question ITU-R 202/3) Rec. ITU-R P.1058-1 (1994-1997) The ITU Radiocommunication Assembly, considering
Rec. ITU-R P.1058-1 1 RECOMMENDATION ITU-R P.1058-1 DIGITAL TOPOGRAPHIC DATABASES FOR PROPAGATION STUDIES (Question ITU-R 202/3) Rec. ITU-R P.1058-1 (1994-1997) The ITU Radiocommunication Assembly, considering
2. POINT CLOUD DATA PROCESSING
 Point Cloud Generation from suas-mounted iphone Imagery: Performance Analysis A. D. Ladai, J. Miller Towill, Inc., 2300 Clayton Road, Suite 1200, Concord, CA 94520-2176, USA - (andras.ladai, jeffrey.miller)@towill.com
RASTER ANALYSIS S H A W N L. P E N M A N E A R T H D A T A A N A LY S I S C E N T E R U N I V E R S I T Y O F N E W M E X I C O
 RASTER ANALYSIS S H A W N L. P E N M A N E A R T H D A T A A N A LY S I S C E N T E R U N I V E R S I T Y O F N E W M E X I C O TOPICS COVERED Spatial Analyst basics Raster / Vector conversion Raster data
GEOGRAPHIC INFORMATION SYSTEMS Lecture 02: Feature Types and Data Models
 GEOGRAPHIC INFORMATION SYSTEMS Lecture 02: Feature Types and Data Models Feature Types and Data Models How Does a GIS Work? - a GIS operates on the premise that all of the features in the real world can
Import, view, edit, convert, and digitize triangulated irregular networks
 v. 10.1 WMS 10.1 Tutorial Import, view, edit, convert, and digitize triangulated irregular networks Objectives Import survey data in an XYZ format. Digitize elevation points using contour imagery. Edit
Surface Analysis. Data for Surface Analysis. What are Surfaces 4/22/2010
 Surface Analysis Cornell University Data for Surface Analysis Vector Triangulated Irregular Networks (TIN) a surface layer where space is partitioned into a set of non-overlapping triangles Attribute and
Geostatistics 3D GMS 7.0 TUTORIALS. 1 Introduction. 1.1 Contents
 GMS 7.0 TUTORIALS Geostatistics 3D 1 Introduction Three-dimensional geostatistics (interpolation) can be performed in GMS using the 3D Scatter Point module. The module is used to interpolate from sets
Watershed Modeling Advanced DEM Delineation
 v. 10.1 WMS 10.1 Tutorial Watershed Modeling Advanced DEM Delineation Techniques Model manmade and natural drainage features Objectives Learn to manipulate the default watershed boundaries by assigning
A METHOD TO PREDICT ACCURACY OF LEAST SQUARES SURFACE MATCHING FOR AIRBORNE LASER SCANNING DATA SETS
 A METHOD TO PREDICT ACCURACY OF LEAST SQUARES SURFACE MATCHING FOR AIRBORNE LASER SCANNING DATA SETS Robert Pâquet School of Engineering, University of Newcastle Callaghan, NSW 238, Australia (rpaquet@mail.newcastle.edu.au)
The 3D Analyst extension extends ArcGIS to support surface modeling and 3- dimensional visualization. 3D Shape Files
 NRM 435 Spring 2016 ArcGIS 3D Analyst Page#1 of 9 0B3D Analyst Extension The 3D Analyst extension extends ArcGIS to support surface modeling and 3- dimensional visualization. 3D Shape Files Analogous to
Neighbourhood Operations Specific Theory
 Neighbourhood Operations Specific Theory Neighbourhood operations are a method of analysing data in a GIS environment. They are especially important when a situation requires the analysis of relationships
Vector Data Analysis Working with Topographic Data. Vector data analysis working with topographic data.
 Vector Data Analysis Working with Topographic Data Vector data analysis working with topographic data. 1 Triangulated Irregular Network Triangulated Irregular Network 2 Triangulated Irregular Networks
Watershed Sciences 4930 & 6920 GEOGRAPHIC INFORMATION SYSTEMS
 HOUSEKEEPING Watershed Sciences 4930 & 6920 GEOGRAPHIC INFORMATION SYSTEMS CONTOURS! Self-Paced Lab Due Friday! WEEK SIX Lecture RASTER ANALYSES Joe Wheaton YOUR EXCERCISE Integer Elevations Rounded up
COMPARISON OF TWO METHODS FOR DERIVING SKELETON LINES OF TERRAIN
 COMPARISON OF TWO METHODS FOR DERIVING SKELETON LINES OF TERRAIN T. Gökgöz, F. Gülgen Yildiz Technical University, Dept. of Geodesy and Photogrammetry Engineering, 34349 Besiktas Istanbul, Turkey (gokgoz,
Computer Database Structure for Managing Data :-
 The Map as an Abstraction of Space :- We begin the process of abstraction by conceptualizing what we encounter as a group of points, lines, areas and surfaces. We make decision about which object to take
Topic 3: GIS Models 10/2/2017. What is a Model? What is a GIS Model. Geography 38/42:477 Advanced Geomatics
 Geography 38/42:477 Advanced Geomatics Topic 3: GIS Models What is a Model? Simplified representation of real world Physical, Schematic, Mathematical Map GIS database Reduce complexity and help us understand
Point clouds and DEMs
 Point clouds and DEMs J Ramón Arrowsmith School of Earth and Space Exploration Arizona State University Christopher J. Crosby UNAVCO Tutorial notes (April 2016) Point clouds and DEMs 1. Download tahoe.las
Purpose: To explore the raster grid and vector map element concepts in GIS.
 GIS INTRODUCTION TO RASTER GRIDS AND VECTOR MAP ELEMENTS c:wou:nssi:vecrasex.wpd Purpose: To explore the raster grid and vector map element concepts in GIS. PART A. RASTER GRID NETWORKS Task A- Examine
Massive Data Algorithmics
 In the name of Allah Massive Data Algorithmics An Introduction Overview MADALGO SCALGO Basic Concepts The TerraFlow Project STREAM The TerraStream Project TPIE MADALGO- Introduction Center for MAssive
+ = Spatial Analysis of Raster Data. 2 =Fault in shale 3 = Fault in limestone 4 = no Fault, shale 5 = no Fault, limestone. 2 = fault 4 = no fault
 Spatial Analysis of Raster Data 0 0 1 1 0 0 1 1 1 0 1 1 1 1 1 1 2 4 4 4 2 4 5 5 4 2 4 4 4 2 5 5 4 4 2 4 5 4 3 5 4 4 4 2 5 5 5 3 + = 0 = shale 1 = limestone 2 = fault 4 = no fault 2 =Fault in shale 3 =
Creating raster DEMs and DSMs from large lidar point collections. Summary. Coming up with a plan. Using the Point To Raster geoprocessing tool
 Page 1 of 5 Creating raster DEMs and DSMs from large lidar point collections ArcGIS 10 Summary Raster, or gridded, elevation models are one of the most common GIS data types. They can be used in many ways
A Case Study of Coal Resource Evaluation in the Canadian Rockies Using Digital Terrain Models
 A Case Study of Coal Resource Evaluation in the Canadian Rockies Using Digital Terrain Models By C.M. Gold and W.E. Kilby BACKGROUND DESCRIPTION The Problem The purpose of this study was to evaluate the
DIGITAL IMAGE ANALYSIS. Image Classification: Object-based Classification
 DIGITAL IMAGE ANALYSIS Image Classification: Object-based Classification Image classification Quantitative analysis used to automate the identification of features Spectral pattern recognition Unsupervised
Raster GIS applications
 Raster GIS applications Columns Rows Image: cell value = amount of reflection from surface DEM: cell value = elevation (also slope/aspect/hillshade/curvature) Thematic layer: cell value = category or measured
3. Data Structures for Image Analysis L AK S H M O U. E D U
 3. Data Structures for Image Analysis L AK S H M AN @ O U. E D U Different formulations Can be advantageous to treat a spatial grid as a: Levelset Matrix Markov chain Topographic map Relational structure
DETERMINATION OF THE OPTIMUM PATH ON THE EARTH S SURFACE. (extended abstract) Abstract
 Abstract") Proceedings of the 17th International Cartographic Association Conference, Barcelona, Spain, September 1995. DETERMINATION OF THE OPTIMUM PATH ON THE EARTH S SURFACE (extended abstract) Marinos Kavouras
Proceedings of the 17th International Cartographic Association Conference, Barcelona, Spain, September 1995. DETERMINATION OF THE OPTIMUM PATH ON THE EARTH S SURFACE (extended abstract) Marinos Kavouras