Group Sta*s*cs in MEG/EEG
|
|
|
- Gyles Patrick
- 5 years ago
- Views:
Transcription


1 Group Sta*s*cs in MEG/EEG Will Woods NIF Fellow Brain and Psychological Sciences Research Centre Swinburne University of Technology

2 A Cau*onary tale.
3 A Cau*onary tale.

4 A Cau*onary tale.
5 Overview Introduc*on to nonparametric sta*s*cs in neuroimaging Specific issues related to MEG beamforming Some non- standard examples

 First Level Analysis for a single")
6 Nonparametric Group Sta*s*cs Overview Single Group A minus B : Ac*ve Baseline or Ac*ve 1 Ac*ve 2 A - B Two- sample T- sta*s*c Map (normalized to Z- sta*s*c) First Level Analysis for a single individual

7 Nonparametric Group Sta*s*cs Overview Single Group Mul*ple individuals in group mul*ple first- level sta*s*cal maps P1 P2 P3 Pn. One- sample T- sta*s*c Map Second Level Analysis for the group
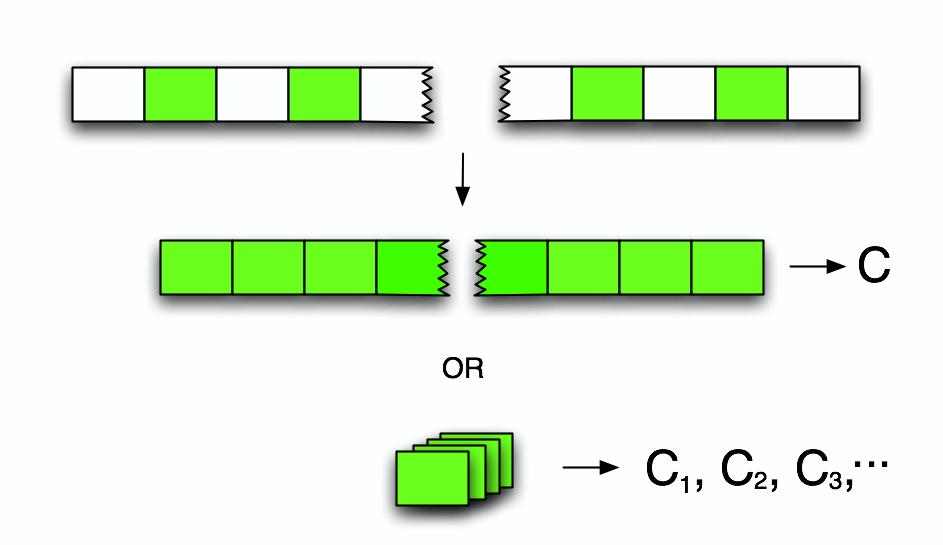
8 Nonparametric Group Sta*s*cs Single Group Overview Significance? Don t have to test against parametric T distribu*on use Non- parametric sta*s*cs - Null hypothesis is that condi*on labels (A,B) are arbitrary. Construct null distribu*on by repeatedly permu*ng (randomising) labels Procedure: Randomly choose some individuals and switch the labels on the data i.e. flip sign on two- sample T- sta*s*c (A- B) - > (B- A) = - (A- B) P1 P2 P3 Pn Permuted One- sample T- sta*s*c Map
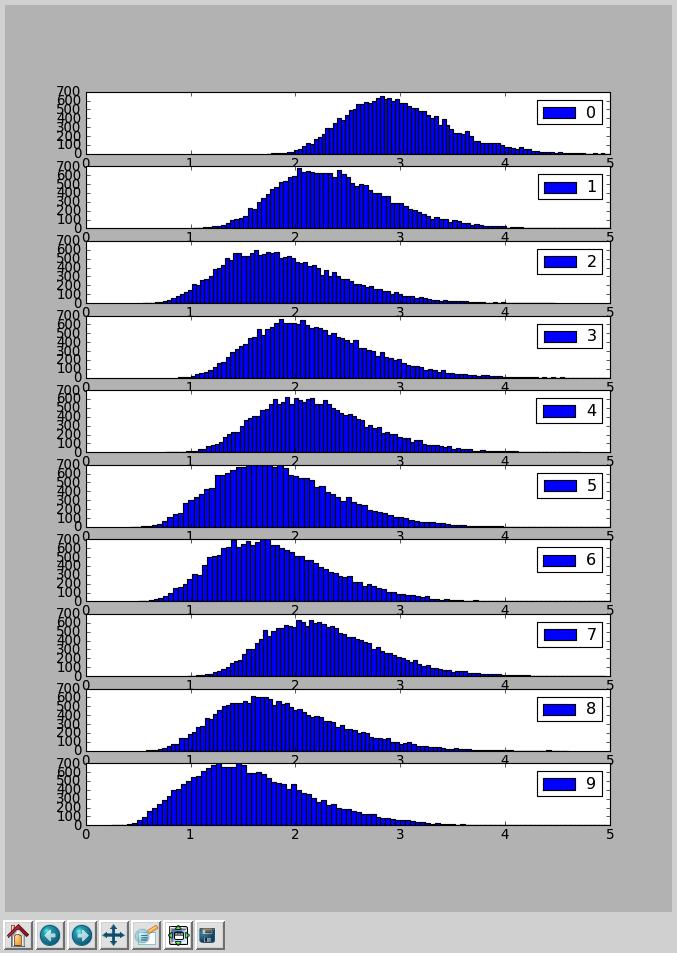
9 Nonparametric Group Sta*s*cs Single Group Overview Mul*ple comparisons problem - 10,000 s of voxels test each one separately? Use Maximum Sta*s*cs Omnibus null hypothesis: If the largest voxel is not significant, none of them are. In prac*ce, just record the largest voxel value in the permuta*on T- map. (single threshold) Repeat many *mes (100 s 1000 s) with different random label assignments. Histogram of values gives the null distribu*on against which we can test each of the voxels from the original, unpermuted, sta*s*cal image.

10 Maximum Sta*s*cs Test original data against Null distribu*on (Nichols)
11 Nonparametric Group Sta*s*cs Overview Two Groups First level (individual) analysis remains the same Group 1 Group 2 - Two- sample T- sta*s*c Map Don t switch labels at first level. Instead, shuffle members of groups. (Null hypothesis is that there is no difference between groups)
12 Nonparametric Group Sta*s*cs Cluster based sta*s*cs Overview Choose a primary threshold Record size of largest supra- threshold cluster in each permuta*on T- sta*s*c map Test all clusters in original T- map against cluster null distribu*on Measure size by number of voxels? Primary threshold

13 Nonparametric Group Sta*s*cs Cluster based sta*s*cs Overview Choose a primary threshold Record size of largest supra- threshold cluster in each permuta*on T- sta*s*c map Test all clusters in original T- map against cluster null distribu*on Measure size by number of voxels? Primary threshold
14 Nonparametric Group Sta*s*cs Cluster based sta*s*cs Overview Choose a primary threshold Record size of largest supra- threshold cluster in each permuta*on T- sta*s*c map Test all clusters in original T- map against cluster null distribu*on Measure size by Exceedence Mass Primary threshold
15 MEG Beamforming and Group Sta*s*cs
16 Beamforming Primer Beamformer uses the covariance of data
17 Beamforming Primer Beamformer uses the covariance of data Choose weights to minimise power of source
18 Beamforming Primer Beamformer uses the covariance of data Choose weights to minimise power of source Subject to constraint:

19 Beamforming Primer Beamformer uses the covariance of data Choose weights to minimise power of source Subject to constraint: Solution:
20 Covariance Matrix

21 Permuta*on Sta*s*cs Individual Two sample T sta*s*c Easy to do because each point k corresponds to the same anatomical loca*on for both condi*on A and condi*on B
22 Permuta*on Sta*s*cs Group For a regular grid there is no natural anatomical correspondence between grid points across par*cipants. Could interpolate over the whole brain volume for each par*cipant, then use fmri type volumetric procedures. Or..
23 Permuta*on Sta*s*cs Group MNI Standard Brain Structural Normalisa*on Affine or Nonlinear Transforma*on FSL SPM ANTS etc P1 P2 P3.
24 Permuta*on Sta*s*cs Group MNI Standard Brain Structural Normalisa*on Affine or Nonlinear Transforma*on FSL SPM ANTS etc P1 P2 P3.

25 Permuta*on Sta*s*cs Group MNI Standard Brain Structural Normalisa*on Affine or Nonlinear Transforma*on FSL SPM ANTS etc P1 P2 P3.
26 Permuta*on Sta*s*cs Group MNI Standard Brain Do sta*s*cs on grid point beamformer values Faster Not doing sta*s*cs on interpolated values P1 P2 P3.
27 Spoken Word Synaesthesia Asghar, Woods et al. YNiC Nature Neuroscience 2002 Nunn et al. fmri Study
28 Spoken Word Synaesthesia Asghar, Woods et al. YNiC Nature Neuroscience 2002 Nunn et al. fmri Study R Synaesthetes MEG - BETA Decrease R L V4/V8 (colour) V1/V2 (vision)


 V1/V2 (vision) Controls MEG -")
29 Spoken Word Synaesthesia Asghar, Woods et al. YNiC Nature Neuroscience 2002 Nunn et al. fmri Study Synaesthetes MEG - BETA Decrease R L R V4/V8 V4/V8 (colour) (colour) V1/V2 (vision) Controls MEG - ALPHA Decrease L V4/V8 (colour)
30 Cluster Sta*s*cs and Beamformers
31 Cluster Sta*s*cs and Beamformers
32 Cluster Sta*s*cs and Beamformers
33 Cluster Sta*s*cs and Beamformers Spa*al resolu*on is signal strength dependent
34 Cluster Sta*s*cs and Beamformers Primary Threshold Spa*al resolu*on is signal strength dependent
35 Cluster Sta*s*cs and Beamformers Cluster Threshold Spa*al resolu*on is signal strength dependent
36 Cluster Sta*s*cs and Beamformers Cluster Threshold Spa*al resolu*on is signal strength dependent
37 Cluster Sta*s*cs and Beamformers Cluster Threshold Spa*al resolu*on is signal strength dependent
38 Cluster Sta*s*cs and Beamformers Cluster Threshold Spa*al resolu*on is signal strength dependent Normalise cluster size with respect to the filter inverse FWHM
39 Mass Univariate Analysis Tutorial review Groppe et al 2011 (Matlab toolbox available) Look for clusters in *me and space (and frequency band)
40 Mass Univariate Analysis Groppe et al 2011

41 Mass Univariate Analysis Groppe et al 2011

42 Mass Univariate Analysis Groppe et al 2011
43 Threshold- Free Cluster Enhancement (TFCE) How to avoid the ambiguity of choosing a primary threshold for cluster sta*s*cs?

44 Threshold- Free Cluster Enhancement (TFCE) How to avoid the ambiguity of choosing a primary threshold for cluster sta*s*cs? Smith & Nichols 2009
45 Threshold- Free Cluster Enhancement (TFCE) How to avoid the ambiguity of choosing a primary threshold for cluster sta*s*cs? Do Single Threshold Maximum Sta*s*cs on TFCE signal Smith & Nichols 2009

46 Group Virtual Electrode Statistics W... W... W... W... W... W... W... W 4 W 3 W... W... W 2 W 248 W 1
")

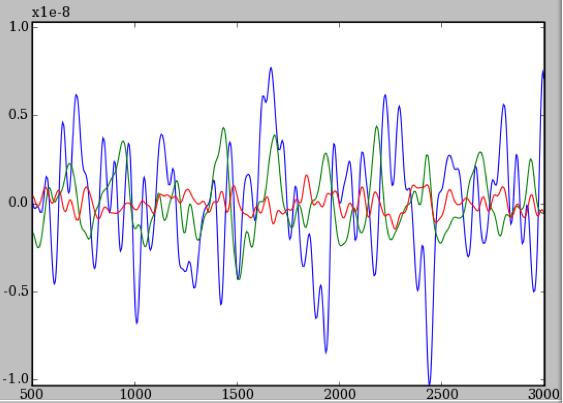
47 Stockwell Transform (*me v frequency plot) Average of n epochs Evoked Activity Total Activity
48 Time- Frequency Sta*s*cs Time / Freq power plots group analysis Baseline Ac*ve Difference?

49 Time- Frequency Sta*s*cs Baseline Ac*ve Remove Baseline mean for each frequency from Ac*ve Window
 or jackknifed variance (for")
50 Time- Frequency Sta*s*cs Induced Power Evoked Power Jackknife Variance es*mate Construct first level map of T sta*s*cs for each Time/Freq point using mean and variance across epochs (for induced) or jackknifed variance (for evoked)
51 Time- Frequency Sta*s*cs P1 P2 Pn. Two Group analysis usual procedure, shuffle par*cipants between groups Single group exchange Ac*ve, Passive labels Cannot flip sign (P - A) - (A P) Have to repeat baseline adjus*ng procedure at first level
52 Time- Frequency Sta*s*cs P1 P2 Pn. Two Group analysis usual procedure, shuffle par*cipants between groups Single group exchange Ac*ve, Passive labels Cannot flip sign (P - A) - (A P) Have to repeat baseline adjus*ng procedure at first level Use TFCE to generate a Cluster Enhanced Group Time/Freq map, and do Single Threshold analysis.

53 Spoken Word Synaesthesia Asghar, Woods et al. YNiC

54 Source Stability Index Beamformer Virtual electrode for each grid loca*on Single condi*on 1 / # 1 / # 1 / #
55 Source Stability Index Beamformer 1 / # 1 / # 1 / #
56 SSI Beamformer and Sta*s*cs Single condi*on measure of the amount of phase locking in a response Cannot shuffle labels between condi*ons Null distribu*on from surrogate data at first (individual) level Surrogate data generated by adding a single random phase angle to all frequency components of a given epoch Destroy phase locking (evoked) response while retaining all other structure.
57 SSI Beamformer and Sta*s*cs Group level open ques*on. Can generate surrogates at first level when doing second level group analysis (computa*onally intensive). No natural way to take simple first level sta*s*c (one- sided T) through to a group analysis because there are no condi*on labels to permute. Could just do first level procedure at group level with evoked *me series normalised by RMS power in each individual?
58 Detec*ng changes in Nonlinearity in underlying dynamics Con*nuous res*ng data divided into 2 sec epochs Use Tisean Matlab toolbox to test for nonlinearity Generate surrogate data for each epoch for every EEG electrode (or virtual electrode) Surrogate data constructed to destroy nonlinearity but retain all other structure Get rank of original data against surrogates for each epoch at first level : => Mean rank across epochs Standard Error not required (assuming sta*onary system proper*es)

59 Maximum Sta*s*cs - ROI
60 ROI Null Distribu*ons

61 Extreme Value Sta*s*cs?

62 Combining ROIs?

63 Combining ROIs?
64 wledgements York Neuroimaging Centre Gary Green Gareth Prendergast Michael Simpson Swinburne University of Technology David Liley Susan Rossell
Controlling for mul2ple comparisons in imaging analysis. Where we re going. Where we re going 8/15/16
 Controlling for mul2ple comparisons in imaging analysis Wednesday, Lecture 2 Jeane?e Mumford University of Wisconsin - Madison Where we re going Review of hypothesis tes2ng introduce mul2ple tes2ng problem
Power analysis. Wednesday, Lecture 3 Jeanette Mumford University of Wisconsin - Madison
 Power analysis Wednesday, Lecture 3 Jeanette Mumford University of Wisconsin - Madison Power Analysis-Why? To answer the question. How many subjects do I need for my study? How many runs per subject should
Group Sta/s/cs with BESA and BrainWave
 24/04/12 Group Sta/s/cs with BESA and Graciela Tesan, PhD CCD From raw data to p- values 1 MEG and EEG data preprocessing and analysis BESA Sta/s/cs: analyses of EEG ac/vity and MEG distributed sources
Introduc)on to fmri. Natalia Zaretskaya
on to fmri. Natalia Zaretskaya") Introduc)on to fmri Natalia Zaretskaya Content fmri signal fmri versus neural ac)vity A classical experiment: flickering checkerboard Preprocessing Univariate analysis Single- subject analysis Group analysis
Introduc)on to fmri Natalia Zaretskaya Content fmri signal fmri versus neural ac)vity A classical experiment: flickering checkerboard Preprocessing Univariate analysis Single- subject analysis Group analysis
New and best-practice approaches to thresholding
 New and best-practice approaches to thresholding Thomas Nichols, Ph.D. Department of Statistics & Warwick Manufacturing Group University of Warwick FIL SPM Course 17 May, 2012 1 Overview Why threshold?
Spatial Filtering Methods in MEG. Part 3: Template Normalization and Group Analysis"
 Spatial Filtering Methods in MEG Part 3: Template Normalization and Group Analysis" Douglas Cheyne, PhD" Program in Neurosciences and Mental Health" Hospital for Sick Children Research Institute " &" Department
Controlling for multiple comparisons in imaging analysis. Wednesday, Lecture 2 Jeanette Mumford University of Wisconsin - Madison
 Controlling for multiple comparisons in imaging analysis Wednesday, Lecture 2 Jeanette Mumford University of Wisconsin - Madison Motivation Run 100 hypothesis tests on null data using p
7/15/2016 ARE YOUR ANALYSES TOO WHY IS YOUR ANALYSIS PARAMETRIC? PARAMETRIC? That s not Normal!
 ARE YOUR ANALYSES TOO PARAMETRIC? That s not Normal! Martin M Monti http://montilab.psych.ucla.edu WHY IS YOUR ANALYSIS PARAMETRIC? i. Optimal power (defined as the probability to detect a real difference)
Correction for multiple comparisons. Cyril Pernet, PhD SBIRC/SINAPSE University of Edinburgh
 Correction for multiple comparisons Cyril Pernet, PhD SBIRC/SINAPSE University of Edinburgh Overview Multiple comparisons correction procedures Levels of inferences (set, cluster, voxel) Circularity issues
Source Reconstruction in MEG & EEG
 Source Reconstruction in MEG & EEG ~ From Brain-Waves to Neural Sources ~ Workshop Karolinska Institutet June 16 th 2017 Program for today Intro Overview of a source reconstruction pipeline Overview of
Medical Image Analysis
 Medical Image Analysis Instructor: Moo K. Chung mchung@stat.wisc.edu Lecture 10. Multiple Comparisons March 06, 2007 This lecture will show you how to construct P-value maps fmri Multiple Comparisons 4-Dimensional
SnPM is an SPM toolbox developed by Andrew Holmes & Tom Nichols
 1 of 14 3/30/2005 9:24 PM SnPM A Worked fmri Example SnPM is an SPM toolbox developed by Andrew Holmes & Tom Nichols This page... introduction example data background design setup computation viewing results
Multiple Testing and Thresholding
 Multiple Testing and Thresholding NITP, 2009 Thanks for the slides Tom Nichols! Overview Multiple Testing Problem Which of my 100,000 voxels are active? Two methods for controlling false positives Familywise
Multiple Testing and Thresholding
 Multiple Testing and Thresholding NITP, 2010 Thanks for the slides Tom Nichols! Overview Multiple Testing Problem Which of my 100,000 voxels are active? Two methods for controlling false positives Familywise
Multivariate pattern classification
 Multivariate pattern classification Thomas Wolbers Space & Ageing Laboratory (www.sal.mvm.ed.ac.uk) Centre for Cognitive and Neural Systems & Centre for Cognitive Ageing and Cognitive Epidemiology Outline
Group (Level 2) fmri Data Analysis - Lab 4
 fmri Data Analysis - Lab 4") Group (Level 2) fmri Data Analysis - Lab 4 Index Goals of this Lab Before Getting Started The Chosen Ten Checking Data Quality Create a Mean Anatomical of the Group Group Analysis: One-Sample T-Test Examine
Group (Level 2) fmri Data Analysis - Lab 4 Index Goals of this Lab Before Getting Started The Chosen Ten Checking Data Quality Create a Mean Anatomical of the Group Group Analysis: One-Sample T-Test Examine
Introduction to fmri. Pre-processing
 Introduction to fmri Pre-processing Tibor Auer Department of Psychology Research Fellow in MRI Data Types Anatomical data: T 1 -weighted, 3D, 1/subject or session - (ME)MPRAGE/FLASH sequence, undistorted
fmri Analysis Sackler Ins2tute 2011
 fmri Analysis Sackler Ins2tute 2011 How do we get from this to this? How do we get from this to this? And what are those colored blobs we re all trying to see, anyway? Raw fmri data straight from the scanner
Controlling for mul-ple comparisons in imaging analysis. Wednesday, Lecture 2 Jeane:e Mumford University of Wisconsin - Madison
 Controlling for mul-ple comparisons in imaging analysis Wednesday, Lecture 2 Jeane:e Mumford University of Wisconsin - Madison Where we re going Review of hypothesis tes-ng introduce mul-ple tes-ng problem
Multiple Testing and Thresholding
 Multiple Testing and Thresholding UCLA Advanced NeuroImaging Summer School, 2007 Thanks for the slides Tom Nichols! Overview Multiple Testing Problem Which of my 100,000 voxels are active? Two methods
Multivariate Pattern Classification. Thomas Wolbers Space and Aging Laboratory Centre for Cognitive and Neural Systems
 Multivariate Pattern Classification Thomas Wolbers Space and Aging Laboratory Centre for Cognitive and Neural Systems Outline WHY PATTERN CLASSIFICATION? PROCESSING STREAM PREPROCESSING / FEATURE REDUCTION
Statistical Analysis of Neuroimaging Data. Phebe Kemmer BIOS 516 Sept 24, 2015
 Statistical Analysis of Neuroimaging Data Phebe Kemmer BIOS 516 Sept 24, 2015 Review from last time Structural Imaging modalities MRI, CAT, DTI (diffusion tensor imaging) Functional Imaging modalities
Preprocessing II: Between Subjects John Ashburner
 Preprocessing II: Between Subjects John Ashburner Pre-processing Overview Statistics or whatever fmri time-series Anatomical MRI Template Smoothed Estimate Spatial Norm Motion Correct Smooth Coregister
NA-MIC National Alliance for Medical Image Computing fmri Data Analysis
 NA-MIC fmri Data Analysis Sonia Pujol, Ph.D. Wendy Plesniak, Ph.D. Randy Gollub, M.D., Ph.D. Acknowledgments NIH U54EB005149 Neuroimage Analysis Center NIH P41RR013218 FIRST Biomedical Informatics Research
Package permuco. February 14, Type Package
 Type Package Package permuco February 14, 2018 Title Permutation Tests for Regression, (Repeated Measures) ANOVA/ANCOVA and Comparison of Signals Version 1.0.1 Date 2018-09-01 Functions to compute p-values
Interpreting predictive models in terms of anatomically labelled regions
 Interpreting predictive models in terms of anatomically labelled regions Data Feature extraction/selection Model specification Accuracy and significance Model interpretation 2 Data Feature extraction/selection
Linear Models in Medical Imaging. John Kornak MI square February 22, 2011
 Linear Models in Medical Imaging John Kornak MI square February 22, 2011 Acknowledgement / Disclaimer Many of the slides in this lecture have been adapted from slides available in talks available on the
High Performance Computing in Neuroimaging using BROCCOLI. Anders Eklund, PhD Virginia Tech Carilion Research Institute
 High Performance Computing in Neuroimaging using BROCCOLI Anders Eklund, PhD Virginia Tech Carilion Research Institute Outline What is BROCCOLI? What is high performance computing and GPUs? Why are GPUs
Pa#ern Recogni-on for Neuroimaging Toolbox
 Pa#ern Recogni-on for Neuroimaging Toolbox Pa#ern Recogni-on Methods: Basics João M. Monteiro Based on slides from Jessica Schrouff and Janaina Mourão-Miranda PRoNTo course UCL, London, UK 2017 Outline
Function-Structure Integration in FreeSurfer
 Function-Structure Integration in FreeSurfer Outline Function-Structure Integration Function-Structure Registration in FreeSurfer fmri Analysis Preprocessing First-Level Analysis Higher-Level (Group) Analysis
Journal of Articles in Support of The Null Hypothesis
 Data Preprocessing Martin M. Monti, PhD UCLA Psychology NITP 2016 Typical (task-based) fmri analysis sequence Image Pre-processing Single Subject Analysis Group Analysis Journal of Articles in Support
Statistical inference on images
 7 Statistical inference on images The goal of statistical inference is to make decisions based on our data, while accounting for uncertainty due to noise in the data. From a broad perspective, statistical
How to make ROI files
 How to make ROI files Ver. 1.0 2012/08/07 Introduction Functional ROI Structural ROI Hand-made ROI History Contact 2 Introduction This manual explains how to make ROI (Region Of Interest) files that you
METAlab Graph Theoretic General Linear Model
 METAlab Graph Theoretic General Linear Model Software website: www.nitrc.org/projects/metalab_gtg/ Author: Jeffrey M. Spielberg (jmsp@bu.edu, http://sites.bu.edu/metalab/) Current version: Beta 0.32 (08.26.14)
BESA Research. CE certified software package for comprehensive, fast, and user-friendly analysis of EEG and MEG
 BESA Research CE certified software package for comprehensive, fast, and user-friendly analysis of EEG and MEG BESA Research choose the best analysis tool for your EEG and MEG data BESA Research is the
A Non-Parametric Approach
 Andrew P. Holmes. Ph.D., 1994. Chapter Six A Non-Parametric Approach In this chapter, a non-parametric approach to assessing functional mapping experiments is presented. A multiple comparisons randomisation
- Graphical editing of user montages for convenient data review - Import of user-defined file formats using generic reader
 Data review and processing Source montages and 3D whole-head mapping Onset of epileptic seizure with 3D whole-head maps and hemispheric comparison of density spectral arrays (DSA) Graphical display of
Linear Models in Medical Imaging. John Kornak MI square February 19, 2013
 Linear Models in Medical Imaging John Kornak MI square February 19, 2013 Acknowledgement / Disclaimer Many of the slides in this lecture have been adapted from slides available in talks available on the
Methods for data preprocessing
 Methods for data preprocessing John Ashburner Wellcome Trust Centre for Neuroimaging, 12 Queen Square, London, UK. Overview Voxel-Based Morphometry Morphometry in general Volumetrics VBM preprocessing
Sta$s$cs & Experimental Design with R. Barbara Kitchenham Keele University
 Sta$s$cs & Experimental Design with R Barbara Kitchenham Keele University 1 Analysis of Variance Mul$ple groups with Normally distributed data 2 Experimental Design LIST Factors you may be able to control
arxiv: v1 [stat.ap] 1 Jun 2016
![arxiv: v1 [stat.ap] 1 Jun 2016](/thumbs/81/83094240.jpg "arxiv: v1 [stat.ap] 1 Jun 2016") Permutation-based cluster size correction for voxel-based lesion-symptom mapping arxiv:1606.00475v1 [stat.ap] 1 Jun 2016 June 3, 2016 Daniel Mirman a,b,1 Jon-Frederick Landrigan a Spiro Kokolis a Sean
Permutation-based cluster size correction for voxel-based lesion-symptom mapping arxiv:1606.00475v1 [stat.ap] 1 Jun 2016 June 3, 2016 Daniel Mirman a,b,1 Jon-Frederick Landrigan a Spiro Kokolis a Sean
Multi-voxel pattern analysis: Decoding Mental States from fmri Activity Patterns
 Multi-voxel pattern analysis: Decoding Mental States from fmri Activity Patterns Artwork by Leon Zernitsky Jesse Rissman NITP Summer Program 2012 Part 1 of 2 Goals of Multi-voxel Pattern Analysis Decoding
M/EEG pre-processing 22/04/2014. GUI Script Batch. Clarification of terms SPM speak. What do we need? Why batch?
 22/04/2014 Clarification of terms SPM speak GUI Script Batch M/EEG pre-processing Vladimir Litvak Wellcome Trust Centre for Neuroimaging UCL Institute of Neurology Why batch? What do we need? As opposed
Introductory Concepts for Voxel-Based Statistical Analysis
 Introductory Concepts for Voxel-Based Statistical Analysis John Kornak University of California, San Francisco Department of Radiology and Biomedical Imaging Department of Epidemiology and Biostatistics
Linear Models in Medical Imaging. John Kornak MI square February 23, 2010
 Linear Models in Medical Imaging John Kornak MI square February 23, 2010 Acknowledgement / Disclaimer Many of the slides in this lecture have been adapted from slides available in talks available on the
Supplementary methods
 Supplementary methods This section provides additional technical details on the sample, the applied imaging and analysis steps and methods. Structural imaging Trained radiographers placed all participants
METAlab Graph Theoretic General Linear Model
 METAlab Graph Theoretic General Linear Model Software website: www.nitrc.org/projects/metalab_gtg/ Author: Jeffrey M. Spielberg (jmsp@bu.edu, http://sites.bu.edu/metalab/) Current version: Beta 0.36 (11.19.14)
Data Visualisation in SPM: An introduction
 Data Visualisation in SPM: An introduction Alexa Morcom Edinburgh SPM course, April 2010 Centre for Cognitive & Neural Systems/ Department of Psychology University of Edinburgh Visualising results remembered
EMPIRICALLY INVESTIGATING THE STATISTICAL VALIDITY OF SPM, FSL AND AFNI FOR SINGLE SUBJECT FMRI ANALYSIS
 EMPIRICALLY INVESTIGATING THE STATISTICAL VALIDITY OF SPM, FSL AND AFNI FOR SINGLE SUBJECT FMRI ANALYSIS Anders Eklund a,b,c, Thomas Nichols d, Mats Andersson a,c, Hans Knutsson a,c a Department of Biomedical
Representational similarity analysis. Dr Ian Charest,
 Representational similarity analysis Dr Ian Charest, Edinburgh, April 219 A space for neuroimaging studies Pattern across subjects Cross-subject correlation studies (e.g. social neuroscience) Raizada et
EPI Data Are Acquired Serially. EPI Data Are Acquired Serially 10/23/2011. Functional Connectivity Preprocessing. fmri Preprocessing
 Functional Connectivity Preprocessing Geometric distortion Head motion Geometric distortion Head motion EPI Data Are Acquired Serially EPI Data Are Acquired Serially descending 1 EPI Data Are Acquired
Cluster failure: Why fmri inferences for spatial extent have inflated false positive rates
 Supporting Information Appendix Cluster failure: Why fmri inferences for spatial extent have inflated false positive rates Anders Eklund, Thomas Nichols, Hans Knutsson Methods Resting state fmri data Resting
User s Documentation 2.0. BrainWave v User s Documentation -- Toronto, Canada
 User s Documentation 2.0 BrainWave v2.0 2012 -- User s Documentation -- Toronto, Canada http://cheynelab.utoronto.ca Table of Contents Getting Started... 5 Introduction... 5 System Requirements... 5 Disclaimer
Lecture 13: Tracking mo3on features op3cal flow
 Lecture 13: Tracking mo3on features op3cal flow Professor Fei- Fei Li Stanford Vision Lab Lecture 13-1! What we will learn today? Introduc3on Op3cal flow Feature tracking Applica3ons (Problem Set 3 (Q1))
The organization of the human cerebral cortex estimated by intrinsic functional connectivity
 1 The organization of the human cerebral cortex estimated by intrinsic functional connectivity Journal: Journal of Neurophysiology Author: B. T. Thomas Yeo, et al Link: https://www.ncbi.nlm.nih.gov/pubmed/21653723
Extending the GLM. Outline. Mixed effects motivation Evaluating mixed effects methods Three methods. Conclusions. Overview
 Extending the GLM So far, we have considered the GLM for one run in one subject The same logic can be applied to multiple runs and multiple subjects GLM Stats For any given region, we can evaluate the
Data Visualisation in SPM: An introduction
 Data Visualisation in SPM: An introduction Alexa Morcom Edinburgh SPM course, April 2015 SPMmip [-30, 3, -9] 3 Visualising results remembered vs. fixation contrast(s) < < After the results table - what
Form follows func-on. Which one of them can fly? And why? Why would anyone bother about brain structure, when we can do func5onal imaging?
 Why would anyone bother about brain structure, when we can do func5onal imaging? Form follows func-on Which one of them can fly? And why? h;p://animals.na5onalgeographic.com Why would anyone bother about
STA 4273H: Sta-s-cal Machine Learning
 STA 4273H: Sta-s-cal Machine Learning Russ Salakhutdinov Department of Statistics! rsalakhu@utstat.toronto.edu! h0p://www.cs.toronto.edu/~rsalakhu/ Lecture 3 Parametric Distribu>ons We want model the probability
Detecting Changes In Non-Isotropic Images
 Detecting Changes In Non-Isotropic Images K.J. Worsley 1, M. Andermann 1, T. Koulis 1, D. MacDonald, 2 and A.C. Evans 2 August 4, 1999 1 Department of Mathematics and Statistics, 2 Montreal Neurological
FMRI Pre-Processing and Model- Based Statistics
 FMRI Pre-Processing and Model- Based Statistics Brief intro to FMRI experiments and analysis FMRI pre-stats image processing Simple Single-Subject Statistics Multi-Level FMRI Analysis Advanced FMRI Analysis
Functional MRI in Clinical Research and Practice Preprocessing
 Functional MRI in Clinical Research and Practice Preprocessing fmri Preprocessing Slice timing correction Geometric distortion correction Head motion correction Temporal filtering Intensity normalization
Single Subject Demo Data Instructions 1) click "New" and answer "No" to the "spatially preprocess" question.
 click New and answer No to the spatially preprocess question.") (1) conn - Functional connectivity toolbox v1.0 Single Subject Demo Data Instructions 1) click "New" and answer "No" to the "spatially preprocess" question. 2) in "Basic" enter "1" subject, "6" seconds
(1) conn - Functional connectivity toolbox v1.0 Single Subject Demo Data Instructions 1) click "New" and answer "No" to the "spatially preprocess" question. 2) in "Basic" enter "1" subject, "6" seconds
Beamformer Source Analysis in MEG
 Beamformer Source Analysis in MEG Douglas Cheyne, PhD Program in Neurosciences and Mental Health Hospital for Sick Children Research Institute & Department of Medical Imaging University of Toronto CCD
Functional MRI data preprocessing. Cyril Pernet, PhD
 Functional MRI data preprocessing Cyril Pernet, PhD Data have been acquired, what s s next? time No matter the design, multiple volumes (made from multiple slices) have been acquired in time. Before getting
SPM8 for Basic and Clinical Investigators. Preprocessing. fmri Preprocessing
 SPM8 for Basic and Clinical Investigators Preprocessing fmri Preprocessing Slice timing correction Geometric distortion correction Head motion correction Temporal filtering Intensity normalization Spatial
Network statistics and thresholding
 Network statistics and thresholding Andrew Zalesky azalesky@unimelb.edu.au HBM Educational Course June 25, 2017 Network thresholding Unthresholded Moderate thresholding Severe thresholding Strong link
Improving the Interpretability of All-to-All Pairwise Source Connectivity Analysis in MEG With Nonhomogeneous Smoothing
 r Human Brain Mapping 32:426 437 (2011) r Improving the Interpretability of All-to-All Pairwise Source Connectivity Analysis in MEG With Nonhomogeneous Smoothing Jan-Mathijs Schoffelen* and Joachim Gross
1 Introduction Motivation and Aims Functional Imaging Computational Neuroanatomy... 12
 Contents 1 Introduction 10 1.1 Motivation and Aims....... 10 1.1.1 Functional Imaging.... 10 1.1.2 Computational Neuroanatomy... 12 1.2 Overview of Chapters... 14 2 Rigid Body Registration 18 2.1 Introduction.....
Mul$-objec$ve Visual Odometry Hsiang-Jen (Johnny) Chien and Reinhard Kle=e
 Chien and Reinhard Kle=e") Mul$-objec$ve Visual Odometry Hsiang-Jen (Johnny) Chien and Reinhard Kle=e Centre for Robo+cs & Vision Dept. of Electronic and Electric Engineering School of Engineering, Computer, and Mathema+cal Sciences
Mul$-objec$ve Visual Odometry Hsiang-Jen (Johnny) Chien and Reinhard Kle=e Centre for Robo+cs & Vision Dept. of Electronic and Electric Engineering School of Engineering, Computer, and Mathema+cal Sciences
Multiple comparisons problem and solutions
 Multiple comparisons problem and solutions James M. Kilner http://sites.google.com/site/kilnerlab/home What is the multiple comparisons problem How can it be avoided Ways to correct for the multiple comparisons
CONN fmri functional connectivity toolbox
 CONN fmri functional connectivity toolbox Gabrieli Lab. McGovern Institute for Brain Research Massachusetts Institute of Technology http://www.nitrc.org/projects/conn Susan Whitfield-Gabrieli Alfonso Nieto-Castanon
Basic fmri Design and Analysis. Preprocessing
 Basic fmri Design and Analysis Preprocessing fmri Preprocessing Slice timing correction Geometric distortion correction Head motion correction Temporal filtering Intensity normalization Spatial filtering
Resources for Nonparametric, Power and Meta-Analysis Practical SPM Course 2015, Zurich
 Resources for Nonparametric, Power and Meta-Analysis Practical SPM Course 2015, Zurich http://www.translationalneuromodeling.org/practical-sessions/ Preliminary Get this file: http://warwick.ac.uk/tenichols/zurich.pdf
Supplementary Online Content
 Supplementary Online Content Palacios EM, Sala-Llonch R, Junque C, Roig T, Tormos JM, Bargallo N, Vendrella P. Restingstate functional magnetic resonance imaging activity and connectivity and cognitive
Introduc)on to FreeSurfer h0p://surfer.nmr.mgh.harvard.edu. Jenni Pacheco.
on to FreeSurfer h0p://surfer.nmr.mgh.harvard.edu. Jenni Pacheco.") Introduc)on to FreeSurfer h0p://surfer.nmr.mgh.harvard.edu Jenni Pacheco jpacheco@mail.utexas.edu Outline Processing Stages Command line Stream Assemble Data (mris_preproc, mri_surf2surf) Design/Contrast
Introduc)on to FreeSurfer h0p://surfer.nmr.mgh.harvard.edu Jenni Pacheco jpacheco@mail.utexas.edu Outline Processing Stages Command line Stream Assemble Data (mris_preproc, mri_surf2surf) Design/Contrast
User Documentation. BrainWave v User s Documentation -- Toronto, Canada
 User Documentation BrainWave v1.5 2012 -- User s Documentation -- Toronto, Canada http://cheynelab.utoronto.ca Table of Contents Getting Started... 5 Introduction... 5 System Requirements... 5 Disclaimer
Introduction to Neuroimaging Janaina Mourao-Miranda
 Introduction to Neuroimaging Janaina Mourao-Miranda Neuroimaging techniques have changed the way neuroscientists address questions about functional anatomy, especially in relation to behavior and clinical
SPM99 fmri Data Analysis Workbook
 SPM99 fmri Data Analysis Workbook This file is a description of the steps needed to use SPM99 analyze a fmri data set from a single subject using a simple on/off activation paradigm. There are two parts
Nonparametric Permutation Tests For Functional Neuroimaging: APrimer with Examples
 Human Brain Mapping 15:1 25(2001) Nonparametric Permutation Tests For Functional Neuroimaging: APrimer with Examples Thomas E. Nichols 1 and Andrew P. Holmes 2,3 * 1 Department of Biostatistics, University
ASAP_2.0 (Automatic Software for ASL Processing) USER S MANUAL
 USER S MANUAL") ASAP_2.0 (Automatic Software for ASL Processing) USER S MANUAL ASAP was developed as part of the COST Action "Arterial Spin Labelling Initiative in Dementia (AID)" by: Department of Neuroimaging, Institute
ASAP_2.0 (Automatic Software for ASL Processing) USER S MANUAL ASAP was developed as part of the COST Action "Arterial Spin Labelling Initiative in Dementia (AID)" by: Department of Neuroimaging, Institute
Network Analysis Integra2ve Genomics module
 Network Analysis Integra2ve Genomics module Michael Inouye Centre for Systems Genomics University of Melbourne, Australia Summer Ins@tute in Sta@s@cal Gene@cs 2016 SeaBle, USA @minouye271 inouyelab.org
Ensemble- Based Characteriza4on of Uncertain Features Dennis McLaughlin, Rafal Wojcik
 Ensemble- Based Characteriza4on of Uncertain Features Dennis McLaughlin, Rafal Wojcik Hydrology TRMM TMI/PR satellite rainfall Neuroscience - - MRI Medicine - - CAT Geophysics Seismic Material tes4ng Laser
TMSEEG Tutorial. Version 4.0. This tutorial was written by: Sravya Atluri and Matthew Frehlich. Contact:
 TMSEEG Tutorial Version 4.0 This tutorial was written by: Sravya Atluri and Matthew Frehlich Contact: faranak.farzan@sfu.ca For more detail, please see the Method article describing the TMSEEG Toolbox:
Computational Neuroanatomy
 Computational Neuroanatomy John Ashburner john@fil.ion.ucl.ac.uk Smoothing Motion Correction Between Modality Co-registration Spatial Normalisation Segmentation Morphometry Overview fmri time-series kernel
Effect of age and dementia on topology of brain functional networks. Paul McCarthy, Luba Benuskova, Liz Franz University of Otago, New Zealand
 Effect of age and dementia on topology of brain functional networks Paul McCarthy, Luba Benuskova, Liz Franz University of Otago, New Zealand 1 Structural changes in aging brain Age-related changes in
Pattern Recognition for Neuroimaging Data
 Pattern Recognition for Neuroimaging Data Edinburgh, SPM course April 2013 C. Phillips, Cyclotron Research Centre, ULg, Belgium http://www.cyclotron.ulg.ac.be Overview Introduction Univariate & multivariate
Introduc)on to R. Eric Feigelson. Dept. of Astronomy & Astrophysics Center for Astrosta5s5cs Penn State University
on to R. Eric Feigelson. Dept. of Astronomy & Astrophysics Center for Astrosta5s5cs Penn State University") Introduc)on to R Eric Feigelson Dept. of Astronomy & Astrophysics Center for Astrosta5s5cs Penn State University edf@astro.psu.edu Space Telescope Science Ins5tute sta5s5cs mini- course Fall 2011 The R
Introduc)on to R Eric Feigelson Dept. of Astronomy & Astrophysics Center for Astrosta5s5cs Penn State University edf@astro.psu.edu Space Telescope Science Ins5tute sta5s5cs mini- course Fall 2011 The R
Can we interpret weight maps in terms of cognitive/clinical neuroscience? Jessica Schrouff
 Can we interpret weight maps in terms of cognitive/clinical neuroscience? Jessica Schrouff Computer Science Department, University College London, UK Laboratory of Behavioral and Cognitive Neuroscience,
Basic Introduction to Data Analysis. Block Design Demonstration. Robert Savoy
 Basic Introduction to Data Analysis Block Design Demonstration Robert Savoy Sample Block Design Experiment Demonstration Use of Visual and Motor Task Separability of Responses Combined Visual and Motor
SPM8 for Basic and Clinical Investigators. Preprocessing
 SPM8 for Basic and Clinical Investigators Preprocessing fmri Preprocessing Slice timing correction Geometric distortion correction Head motion correction Temporal filtering Intensity normalization Spatial
Linear Models in Medical Imaging. John Kornak MI square February 21, 2012
 Linear Models in Medical Imaging John Kornak MI square February 21, 2012 Acknowledgement / Disclaimer Many of the slides in this lecture have been adapted from slides available in talks available on the
Sta$s$cs & Experimental Design with R. Barbara Kitchenham Keele University
 Sta$s$cs & Experimental Design with R Barbara Kitchenham Keele University 1 Comparing two or more groups Part 5 2 Aim To cover standard approaches for independent and dependent groups For two groups Student
Graph Theoretic General Linear Model (GTG)
") Graph Theoretic General Linear Model (GTG) Software website: www.nitrc.org/projects/metalab_gtg/ Author: Jeffrey M. Spielberg (jmsp@bu.edu, http://sites.bu.edu/metalab/) Current version: Beta 0.38 (03.24.15)
Graph Theoretic General Linear Model (GTG) Software website: www.nitrc.org/projects/metalab_gtg/ Author: Jeffrey M. Spielberg (jmsp@bu.edu, http://sites.bu.edu/metalab/) Current version: Beta 0.38 (03.24.15)
C8: May 5, 2011 Version
 C8 Documentation Timothy J. Herron Human Cognitive Neurophysiology Laboratory, David L. Woods, Director Neurology, Research Service, United States Veterans Affairs Martinez, California, USA; 1. Overview
0.1. Setting up the system path to allow use of BIAC XML headers (BXH). Depending on the computer(s), you may only have to do this once.
. Depending on the computer(s), you may only have to do this once.") Week 3 Exercises Last week you began working with MR data, both in the form of anatomical images and functional time series. This week we will discuss some concepts related to the idea of fmri data as
Week 3 Exercises Last week you began working with MR data, both in the form of anatomical images and functional time series. This week we will discuss some concepts related to the idea of fmri data as
Introduc)on to Matlab
on to Matlab") Introduc)on to Matlab Marcus Kaiser (based on lecture notes form Vince Adams and Syed Bilal Ul Haq ) MATLAB MATrix LABoratory (started as interac)ve interface to Fortran rou)nes) Powerful, extensible,
Introduc)on to Matlab Marcus Kaiser (based on lecture notes form Vince Adams and Syed Bilal Ul Haq ) MATLAB MATrix LABoratory (started as interac)ve interface to Fortran rou)nes) Powerful, extensible,
SPM Introduction. SPM : Overview. SPM: Preprocessing SPM! SPM: Preprocessing. Scott Peltier. FMRI Laboratory University of Michigan
 SPM Introduction Scott Peltier FMRI Laboratory University of Michigan! Slides adapted from T. Nichols SPM! SPM : Overview Library of MATLAB and C functions Graphical user interface Four main components:
ADJUST: An Automatic EEG artifact Detector based on the Joint Use of Spatial and Temporal features
 ADJUST: An Automatic EEG artifact Detector based on the Joint Use of Spatial and Temporal features A Tutorial. Marco Buiatti 1 and Andrea Mognon 2 1 INSERM U992 Cognitive Neuroimaging Unit, Gif sur Yvette,
CSCI 599 Class Presenta/on. Zach Levine. Markov Chain Monte Carlo (MCMC) HMM Parameter Es/mates
 HMM Parameter Es/mates") CSCI 599 Class Presenta/on Zach Levine Markov Chain Monte Carlo (MCMC) HMM Parameter Es/mates April 26 th, 2012 Topics Covered in this Presenta2on A (Brief) Review of HMMs HMM Parameter Learning Expecta2on-
CSCI 599 Class Presenta/on Zach Levine Markov Chain Monte Carlo (MCMC) HMM Parameter Es/mates April 26 th, 2012 Topics Covered in this Presenta2on A (Brief) Review of HMMs HMM Parameter Learning Expecta2on-