GEO Joint Experiment for Crop Assessment and Monitoring (JECAM): Template for Research Progress Report
|
|
|
- Steven Wood
- 5 years ago
- Views:
Transcription
1 GEO Joint Experiment for Crop Assessment and Monitoring (JECAM): Date: 17/02/2015 JECAM Test Site Name: Brazil São Paulo Template for Research Progress Report Team Leader and Members: Guerric le Maire, CIRAD Yann Nouvellon, CIRAD ; Jean-Paul Laclau, CIRAD ; José-Luiz Stape, IPEF and UNESP ; Stéphane Dupuy, CIRAD Use of Information In addition to the report we would also like to use the information and images you provide to update the jecam.org website. Do you agree to this use of your information? Y, please ask if you need better quality images Project Objectives Have the original objectives for your site changed? Y/N Please briefly describe the areas that you are working on from the list below (i.e. topic, general methods, intended operational outcome, if any): Crop identification and Crop Area Estimation Site Description Location: Lat , Lon Topography: slope <5% in centroid area Soils: Ferralsols, 20% Clay (in centroid area) Drainage class/irrigation: Moderately to well drained, high water consumption for Eucalyptus stands, cropland sometimes irrigated Crop calendar: Eucalyptus: 6 years rotations ; Other crops and sugarcane: monitoring started in December 2014, but mainly sugarcane monoculture, oran Field size: 40 ha for Eucalyptus field, large fields for other crop classes Climate and weather: Humid Tropical (Aw Koppen), weather stations Agricultural methods used
2 Photograph(s) Many photographs have been taken during the December 2014 field campaign. Some samples are given in the attached powerpoint. Earth Observation (EO) Data Received/Used For each Mission/sensor: Landsat5 Space agency or Supplier: NASA Optical Number of scenes: 5 Range of dates: 08/09/2013; 11/11/2013; 30/01/2014;11/09/2014;29/10/2014 Beam modes/ incidence angles/ spatial resolutions:, 30 m MS + 15 m PAN Processing level: TOA reflectance Challenges, if any, in ordering and acquiring the data Challenges, if any, in processing and using the data Please provide sample pictures of the imagery provided in application: see below For each Mission/sensor: DEIMOS Space agency or Supplier: deimos imaging Optical Number of scenes: 3 Range of dates: 13/11/2013;05/04/2014;19/07/2014; Beam modes/ incidence angles/ spatial resolutions:, 20 m Processing level: TOA reflectance Challenges, if any, in ordering and acquiring the data Challenges, if any, in processing and using the data Please provide sample pictures of the imagery provided in application: see below


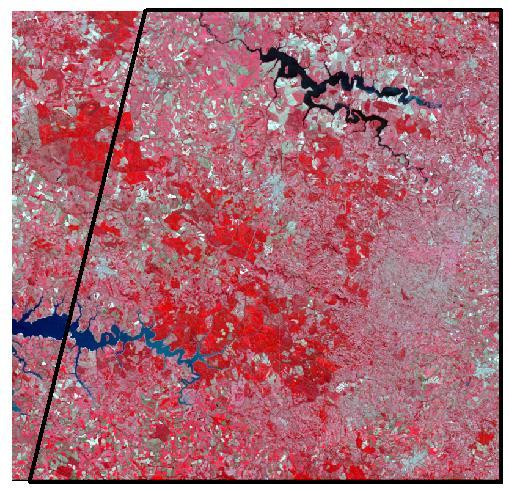
3 Landsat Landsat Deimos Landsat Deimos Deimos
4 Landsat Landsat

5 In situ Data Describe the in situ data collected, with methods and challenges, if any. We collected 847 GPS point in the field in December 2014, following the JECAM protocol and updated nomenclature for our site specificities. GPS points were chosen along roads to cover most part of the JECAM area (see figure below). GPS points were afterwards converted to polygons based on the images. The minimum homogeneous polygon of the 8 images described above was chosen. Illustration of the 847 polygons of the classified area The number of polygons for each class is given in the following table: Banana plantation 3 Built-up 53
6 Coffee plantation 14 Corn 30 Eucalypts plantation 160 Fallow 7 Forest 36 Orange tree plantation 63 Other 30 Pasture 127 Pines plantation 47 Rocks 11 Soybean 91 Sugarcane 154 Water 21 For communication purposes, please provide photographs of site work if available. Collaboration Have you been approached to participate in a collaborative project with other sites? Y/N If yes, please describe the nature of the collaboration ( i.e. Who, objective, brief status). SIGMA - JECAM experiment on medium to large field size agrosystems The main objective of this project is to test and compare classification methods for cropland area estimations based on MODIS data, and applied in different contrasted sites. These sites were selected within JECAM for their large field size agrosystems. The nature of the collaboration for the Brazil-SP site relies on data preparation and share, field expertise, review of the results obtained in this experiment, complementary measurements if necessary, etc. Results Describe your key the results, positive and negative. We used the 8 images described above to produce a land cover map of our JECAM site for December I give below a brief description of the method we used. First, a polygon segmentation of the images was performed under Trimble ecognition software. Then, 240
7 variables were computed for each polygon: we used all the bands reflectances of all images, and computed several vegetation indices. The randomforest algorithm was then used under R. The model was calibrated on the field data, and afterward applied on the entire image, giving the final landcover map. Some interesting outputs were also computed, as the classification stability, based on the membership probability. A confusion matrix is given below. The result is very good for sugarcane, eucalyptus, pines, forests, pastures and water bodies. Classification error is high for coffee plantations, maize and orange tree orchards. Banana Buildup surface Coffee Eucalyptus Maize Natural forest Orange tree Other Pasture Pinnus Soya beans Banana % Build-up % surface Coffee % Eucalyptus % Maize % Natural % forest Orange % tree Other % Pasture % Pinnus % Soya beans Sugar cane Water bodies Young fallow Sugar cane Water bodies Young fallow % % % % class error The classified surfaces of the JECAM site for December 2014 are given in the table below: Class area (ha) % of the total area Banana % Build-up surface % Coffee % Eucalyptus % Maize % Natural forest % Orange tree % Other % Pasture %
8 Pines % Rocks % Soybeans % Sugarcane % Water bodies % Young fallow % Some results are still unrealistic, like the coffee plantation, orange trees and maize area, but it is possible than next field campaigns will help to constrain more these classes. For communication purposes, please provide some graphic representation(s) of the results.
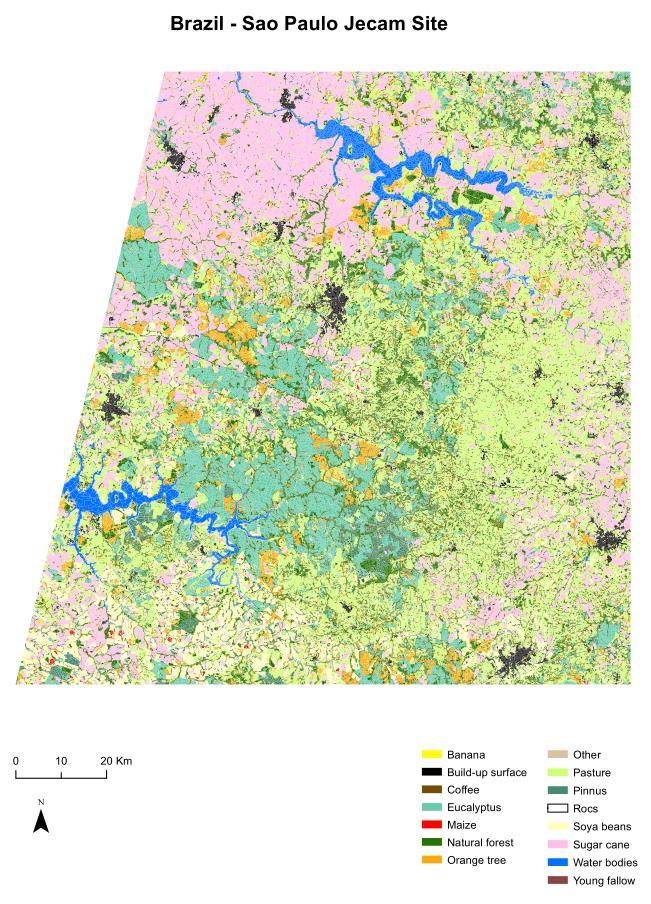
9 December 2014 classification
 are classified with")
10 December 2014 classification stability (better when close to 1). This reflects more or less the fact that cropland (South-West and East) are classified with less membership probability
11 To what extent have the project objectives been met? The objectives have been met for the moment. We will continue to improve the map by adding new training polygons by photointerpretation, and with new field campaign. The method seems well adapted for the main class, but we got difficulties for class with small number of samples, as expected. One issue is the other class, which groups all land use that were met only several times in the field visit. The question of adding this other class in the classification algorithm is still controversial. One major difficulty is cropland classes since there is not a common regional calendar (e.g some soybean fields are just sowed when others are harvested). Therefore, we will increase the frequency of field visit in 2015, with measurements expected every 2.5 months. The Random Forest method needs also further explorations when images are partly covered by clouds. Use of textural variables computed on the panchromatic channels may also enhance some results, especially in row-structured fields such as orange tree orchards. While the algorithm is in theory able to handle a large number of variable, it could be usefull to keep only the more important ones (e.g. through a PCA analysis for instance). Can this approach be called best practice? Even if some aspects could be enhanced (see above), this method seems reliable enough. More investigations for improving the classification and the validation will be necessary Have you modified the project objectives? If so, in what way? Plans for Next Growing Season Next growing season, will you maintain your current approach, or modify the approach? If you plan to modify, please describe your new approach. We will maintain the current approach, by doing field inventories every months on the south-western part of the JECAM area, mainly covered by croplands. Images acquisitions are also planned this year (in particular SPOT images) Do you anticipate ordering the same type/quantity of EO data next year? Y, included DEIMOS data if possible If not, what type and quantity of EO data do you plan to acquire? We could acquire radar images if other JECAM partners are interested Publications
12 Please list any publications from your JECAM related research since last year s report (presentations, peer reviewed papers, technical reports, etc). le Maire, G., Dupuy, S., Nouvellon, Y., Loos, R.A., & Hakamada, R. (2014). Mapping shortrotation plantations at regional scale using MODIS time series: Case of eucalypt plantations in Brazil. Remote Sensing of Environment, 152,
AN INTEGRATED APPROACH TO AGRICULTURAL CROP CLASSIFICATION USING SPOT5 HRV IMAGES
 AN INTEGRATED APPROACH TO AGRICULTURAL CROP CLASSIFICATION USING SPOT5 HRV IMAGES Chang Yi 1 1,2,*, Yaozhong Pan 1, 2, Jinshui Zhang 1, 2 College of Resources Science and Technology, Beijing Normal University,
Classification (or thematic) accuracy assessment. Lecture 8 March 11, 2005
 accuracy assessment. Lecture 8 March 11, 2005") Classification (or thematic) accuracy assessment Lecture 8 March 11, 2005 Why and how Remote sensing-derived thematic information are becoming increasingly important. Unfortunately, they contain errors.
Classification (or thematic) accuracy assessment Lecture 8 March 11, 2005 Why and how Remote sensing-derived thematic information are becoming increasingly important. Unfortunately, they contain errors.
This document will cover some of the key features available only in SMS Advanced, including:
 Key Differences between SMS Basic and SMS Advanced SMS Advanced includes all of the same functionality as the SMS Basic Software as well as adding numerous tools that provide management solutions for multiple
VALIDATION OF A NEW 30 METER GROUND SAMPLED GLOBAL DEM USING ICESAT LIDARA ELEVATION REFERENCE DATA
 VALIDATION OF A NEW 30 METER GROUND SAMPLED GLOBAL DEM USING ICESAT LIDARA ELEVATION REFERENCE DATA M. Lorraine Tighe Director, Geospatial Solutions Intermap Session: Photogrammetry & Image Processing
Digital Image Classification Geography 4354 Remote Sensing
 Digital Image Classification Geography 4354 Remote Sensing Lab 11 Dr. James Campbell December 10, 2001 Group #4 Mark Dougherty Paul Bartholomew Akisha Williams Dave Trible Seth McCoy Table of Contents:
Attribute Accuracy. Quantitative accuracy refers to the level of bias in estimating the values assigned such as estimated values of ph in a soil map.
 Attribute Accuracy Objectives (Entry) This basic concept of attribute accuracy has been introduced in the unit of quality and coverage. This unit will teach a basic technique to quantify the attribute
Classify Multi-Spectral Data Classify Geologic Terrains on Venus Apply Multi-Variate Statistics
 Classify Multi-Spectral Data Classify Geologic Terrains on Venus Apply Multi-Variate Statistics Operations What Do I Need? Classify Merge Combine Cross Scan Score Warp Respace Cover Subscene Rotate Translators
GEOBIA for ArcGIS (presentation) Jacek Urbanski
 Jacek Urbanski") GEOBIA for ArcGIS (presentation) Jacek Urbanski INTEGRATION OF GEOBIA WITH GIS FOR SEMI-AUTOMATIC LAND COVER MAPPING FROM LANDSAT 8 IMAGERY Presented at 5th GEOBIA conference 21 24 May in Thessaloniki.
GEOBIA for ArcGIS (presentation) Jacek Urbanski INTEGRATION OF GEOBIA WITH GIS FOR SEMI-AUTOMATIC LAND COVER MAPPING FROM LANDSAT 8 IMAGERY Presented at 5th GEOBIA conference 21 24 May in Thessaloniki.
Impact toolbox. Description, installation and tutorial
 Impact toolbox Description, installation and tutorial What is Impact? Impact tools is a Windows software developed at the European Commission Joint Research Centre (JRC), in Italy. Impact offers a series
Land Cover Classification Techniques
 Land Cover Classification Techniques supervised classification and random forests Developed by remote sensing specialists at the USFS Geospatial Technology and Applications Center (GTAC), located in Salt
An Introduction to Lidar & Forestry May 2013
 An Introduction to Lidar & Forestry May 2013 Introduction to Lidar & Forestry Lidar technology Derivatives from point clouds Applied to forestry Publish & Share Futures Lidar Light Detection And Ranging
N.J.P.L.S. An Introduction to LiDAR Concepts and Applications
 N.J.P.L.S. An Introduction to LiDAR Concepts and Applications Presentation Outline LIDAR Data Capture Advantages of Lidar Technology Basics Intensity and Multiple Returns Lidar Accuracy Airborne Laser
Procedure for Development of Crop Mask for Major Seasonal Crops in Punjab & Sindh Provinces of Pakistan
 [Type text] Procedure for Development of Crop Mask for Major Seasonal Crops in Punjab & Sindh Provinces of Pakistan Preface Agriculture sector contributes around 21% to GDP annually. Major contributing
Government of Alberta. Find Your Farm. Alberta Soil Information Viewer. Alberta Agriculture and Forestry [Date]
![Government of Alberta. Find Your Farm. Alberta Soil Information Viewer. Alberta Agriculture and Forestry [Date]](/thumbs/83/87435202.jpg "Government of Alberta. Find Your Farm. Alberta Soil Information Viewer. Alberta Agriculture and Forestry [Date]") Government of Alberta Find Your Farm Alberta Soil Information Viewer Alberta Agriculture and Forestry [Date] Contents Definitions... 1 Getting Started... 2 Area of Interest... 3 Search and Zoom... 4 By
Government of Alberta Find Your Farm Alberta Soil Information Viewer Alberta Agriculture and Forestry [Date] Contents Definitions... 1 Getting Started... 2 Area of Interest... 3 Search and Zoom... 4 By
ENVI THE PREMIER SOFTWARE FOR EXTRACTING INFORMATION FROM GEOSPATIAL DATA
 ENVI THE PREMIER SOFTWARE FOR EXTRACTING INFORMATION FROM GEOSPATIAL DATA HarrisGeospatial.com BENEFITS Use one solution to work with all your data types Access a complete suite of analysis tools Customize
Design based validation of the MODIS Global Burned Area Product
 Design based validation of the MODIS Global Burned Area Product Luigi Boschetti1, David Roy2, Chris Justice3, Steve Stehman4 1 University of Idaho, Department of Forest, Rangeland and Fire Sciences 2 South
Catapult Open. The Open Data Cube (ODC) A tool to increase the value and impact of global Earth observation satellite data
 A tool to increase the value and impact of global Earth observation satellite data") The Open Data Cube (ODC) A tool to increase the value and impact of global Earth observation satellite data SATELLITE APPLICATIONS CATAPULT Our Mission // To innovate for a better world, empowered by satellites.
The Open Data Cube (ODC) A tool to increase the value and impact of global Earth observation satellite data SATELLITE APPLICATIONS CATAPULT Our Mission // To innovate for a better world, empowered by satellites.
Manual MARS web viewer
 Manual MARS web viewer 08 July 2010 Document Change Log Issue Date Description of changes 0.1 03-FEB-2009 Initial version 0.2 13-MAR-2009 Manual for viewer version 16-3-2009 1.0 20-MAY-2009 Manual for
mechanical properties such that the waves emanated almost entirely polarisized. In a simple radar system, the same antenna is often arranged so that t
 EXTRACTING KEY FOR LANDCOVER CHANGE USING MULTITEMPORAL PALSAR IMAGES & ITS CALIBRATION TO RELEVANT OPTICAL IMAGES PI No 389 Fahmi Amhar, Antonius B. Wijanarto Geomatics Research Division National Coordinating
The ArcGIS Platform for Managing, Processing, and Sharing UAV Data
 The ArcGIS Platform for Managing, Processing, and Sharing UAV Data Cody Benkelman, Technical Product Manager - Imagery David Gadsden, Nonprofit Program Manager Esri Advancing GIS Strong and Growing..Serving
Synthetic Aperture Radar (SAR) Polarimetry for Wetland Mapping & Change Detection
 Polarimetry for Wetland Mapping & Change Detection") Synthetic Aperture Radar (SAR) Polarimetry for Wetland Mapping & Change Detection Jennifer M. Corcoran, M.S. Remote Sensing & Geospatial Analysis Laboratory Natural Resource Science & Management PhD Program
Synthetic Aperture Radar (SAR) Polarimetry for Wetland Mapping & Change Detection Jennifer M. Corcoran, M.S. Remote Sensing & Geospatial Analysis Laboratory Natural Resource Science & Management PhD Program
AUTOMATIC RECOGNITION OF RICE FIELDS FROM MULTITEMPORAL SATELLITE IMAGES
 AUTOMATIC RECOGNITION OF RICE FIELDS FROM MULTITEMPORAL SATELLITE IMAGES Y.H. Tseng, P.H. Hsu and I.H Chen Department of Surveying Engineering National Cheng Kung University Taiwan, Republic of China tseng@mail.ncku.edu.tw
Lab 9. Julia Janicki. Introduction
 Lab 9 Julia Janicki Introduction My goal for this project is to map a general land cover in the area of Alexandria in Egypt using supervised classification, specifically the Maximum Likelihood and Support
Image feature extraction from the experimental semivariogram and its application to texture classification
 Image feature extraction from the experimental semivariogram and its application to texture classification M. Durrieu*, L.A. Ruiz*, A. Balaguer** *Dpto. Ingeniería Cartográfica, Geodesia y Fotogrametría,
Development of Unmanned Aircraft System (UAS) for Agricultural Applications. Quarterly Progress Report
 for Agricultural Applications. Quarterly Progress Report") Development of Unmanned Aircraft System (UAS) for Agricultural Applications Quarterly Progress Report Reporting Period: October December 2016 January 30, 2017 Prepared by: Lynn Fenstermaker and Jayson
Development of Unmanned Aircraft System (UAS) for Agricultural Applications Quarterly Progress Report Reporting Period: October December 2016 January 30, 2017 Prepared by: Lynn Fenstermaker and Jayson
Prototyping GOES-R Albedo Algorithm Based on MODIS Data Tao He a, Shunlin Liang a, Dongdong Wang a
 Prototyping GOES-R Albedo Algorithm Based on MODIS Data Tao He a, Shunlin Liang a, Dongdong Wang a a. Department of Geography, University of Maryland, College Park, USA Hongyi Wu b b. University of Electronic
GEOMETRY AND RADIATION QUALITY EVALUATION OF GF-1 AND GF-2 SATELLITE IMAGERY. Yong Xie
 Prepared by CNSA Agenda Item: WG.3 GEOMETRY AND RADIATION QUALITY EVALUATION OF GF-1 AND GF-2 SATELLITE IMAGERY Yong Xie Institute of Remote Sensing and Digital Earth, Chinese Academy of Science GF-1 and
Image Analysis With the Definiens Software Suite
 Image Analysis With the Definiens Software Suite Definiens Enterprise Image Intelligence Andreas Kühnen, Senior Sales Manager Malte Sohlbach, Systems Engineering Manager August 2009 Definiens AG 1986 Prof.
OPERATIONAL SHIP DETECTION & RAPID URBAN MAPPING : EXPLORING DIVERSE METHODOLOGICAL APPROACHES IN OBJECT RECOGNTION AND SATELLITE IMAGE CLASSIFICATION
 Journées ORFEO Méthodo 10-11 Janvier 2008 OPERATIONAL SHIP DETECTION & RAPID URBAN MAPPING : EXPLORING DIVERSE METHODOLOGICAL APPROACHES IN OBJECT RECOGNTION AND SATELLITE IMAGE CLASSIFICATION Michel Petit,
APPENDIX E2. Vernal Pool Watershed Mapping
 APPENDIX E2 Vernal Pool Watershed Mapping MEMORANDUM To: U.S. Fish and Wildlife Service From: Tyler Friesen, Dudek Subject: SSHCP Vernal Pool Watershed Analysis Using LIDAR Data Date: February 6, 2014
DETECTION OF CHANGES IN ISTANBUL AREA WITH MEDIUM AND HIGH RESOLUTION SPACE IMAGES
 DETECTION OF CHANGES IN ISTANBUL AREA WITH MEDIUM AND HIGH RESOLUTION SPACE IMAGES S. Bayburt*, G.Büyüksalih*, I. Baz*, K. Jacobsen**, T. Kersten *** * BIMTAS, Tophanelioglu Cad. ISKI Hizmet Binasi No:62
L7 Raster Algorithms
 L7 Raster Algorithms NGEN6(TEK23) Algorithms in Geographical Information Systems by: Abdulghani Hasan, updated Nov 216 by Per-Ola Olsson Background Store and analyze the geographic information: Raster
Flood detection using radar data Basic principles
 Flood detection using radar data Basic principles André Twele, Sandro Martinis and Jan-Peter Mund German Remote Sensing Data Center (DFD) 1 Overview Introduction Basic principles of flood detection using
Calibration of IRS-1C PAN-camera
 Calibration of IRS-1C PAN-camera Karsten Jacobsen Institute for Photogrammetry and Engineering Surveys University of Hannover Germany Tel 0049 511 762 2485 Fax -2483 Email karsten@ipi.uni-hannover.de 1.
Introduction to the Google Earth Engine Workshop
 Introduction to the Google Earth Engine Workshop This workshop will introduce the user to the Graphical User Interface (GUI) version of the Google Earth Engine. It assumes the user has a basic understanding
CLASSIFICATION OF NONPHOTOGRAPHIC REMOTE SENSORS
 CLASSIFICATION OF NONPHOTOGRAPHIC REMOTE SENSORS PASSIVE ACTIVE DIGITAL CAMERA THERMAL (e.g. TIMS) VIDEO CAMERA MULTI- SPECTRAL SCANNERS VISIBLE & NIR MICROWAVE HYPERSPECTRAL (e.g. AVIRIS) SLAR Real Aperture
Uttam Kumar and Ramachandra T.V. Energy & Wetlands Research Group, Centre for Ecological Sciences, Indian Institute of Science, Bangalore
 Remote Sensing and GIS for Monitoring Urban Dynamics Uttam Kumar and Ramachandra T.V. Energy & Wetlands Research Group, Centre for Ecological Sciences, Indian Institute of Science, Bangalore 560 012. Remote
SEQUENTIAL CLASSIFIER TRAINING FOR RICE MAPPING WITH MULTITEMPORAL REMOTE SENSING IMAGERY
 ISPRS Annals of the Photogrammetry Remote Sensing and Spatial Information Sciences Volume IV-4/W2 2017 SEQUENTIAL CLASSIFIER TRAINING FOR RICE MAPPING WITH MULTITEMPORAL REMOTE SENSING IMAGERY Y. Guo a.
EVALUATION OF RECURRENT NEURAL NETWORKS FOR CROP RECOGNITION FROM MULTITEMPORAL REMOTE SENSING IMAGES ABSTRACT
 S B C Anais do XXVII Congresso Brasileiro de Cartografia e XXVI Exposicarta 6 a 9 de novembro de 2017, SBC, Rio de Janeiro - RJ, p. 800-804 EVALUATION OF RECURRENT NEURAL NETWORKS FOR CROP RECOGNITION
InSAR Operational and Processing Steps for DEM Generation
 InSAR Operational and Processing Steps for DEM Generation By F. I. Okeke Department of Geoinformatics and Surveying, University of Nigeria, Enugu Campus Tel: 2-80-5627286 Email:francisokeke@yahoo.com Promoting
This is the general guide for landuse mapping using mid-resolution remote sensing data
 This is the general guide for landuse mapping using mid-resolution remote sensing data February 11 2015 This document has been prepared for Training workshop on REDD+ Research Project in Peninsular Malaysia
Aerial photography: Principles. Visual interpretation of aerial imagery
 Aerial photography: Principles Visual interpretation of aerial imagery Overview Introduction Benefits of aerial imagery Image interpretation Elements Tasks Strategies Keys Accuracy assessment Benefits
ENVI ANALYTICS ANSWERS YOU CAN TRUST
 ENVI ANALYTICS ANSWERS YOU CAN TRUST HarrisGeospatial.com Since its launch in 1991, ENVI has enabled users to leverage remotely sensed data to better understand our complex world. Over the years, Harris
GPS/GIS Activities Summary
 GPS/GIS Activities Summary Group activities Outdoor activities Use of GPS receivers Use of computers Calculations Relevant to robotics Relevant to agriculture 1. Information technologies in agriculture
ADVANCED REMOTE SENSING TECHNIQUES FOR FORESTRY APPLICATIONS: A CASE STUDY IN SARAWAK (MALAYSIA)
") ADVANCED REMOTE SENSING TECHNIQUES FOR FORESTRY APPLICATIONS: A CASE STUDY IN SARAWAK (MALAYSIA) 1 Edmond NEZRY, 1 Francis YAKAM-SIMEN, 2 Paul ROMEIJN, 1 Iwan SUPIT, 3 Louis DEMARGNE 1 PRIVATEERS N.V.,
ADVANCED REMOTE SENSING TECHNIQUES FOR FORESTRY APPLICATIONS: A CASE STUDY IN SARAWAK (MALAYSIA) 1 Edmond NEZRY, 1 Francis YAKAM-SIMEN, 2 Paul ROMEIJN, 1 Iwan SUPIT, 3 Louis DEMARGNE 1 PRIVATEERS N.V.,
IMAGINE Objective. The Future of Feature Extraction, Update & Change Mapping
 IMAGINE ive The Future of Feature Extraction, Update & Change Mapping IMAGINE ive provides object based multi-scale image classification and feature extraction capabilities to reliably build and maintain
UAS based laser scanning for forest inventory and precision farming
 UAS based laser scanning for forest inventory and precision farming M. Pfennigbauer, U. Riegl, P. Rieger, P. Amon RIEGL Laser Measurement Systems GmbH, 3580 Horn, Austria Email: mpfennigbauer@riegl.com,
GEOGRAPHIC INFORMATION SYSTEMS Lecture 18: Spatial Modeling
 Spatial Analysis in GIS (cont d) GEOGRAPHIC INFORMATION SYSTEMS Lecture 18: Spatial Modeling - the basic types of analysis that can be accomplished with a GIS are outlined in The Esri Guide to GIS Analysis
Quality assessment of RS data. Remote Sensing (GRS-20306)
") Quality assessment of RS data Remote Sensing (GRS-20306) Quality assessment General definition for quality assessment (Wikipedia) includes evaluation, grading and measurement process to assess design,
Quality assessment of RS data Remote Sensing (GRS-20306) Quality assessment General definition for quality assessment (Wikipedia) includes evaluation, grading and measurement process to assess design,
Optical Theory Basics - 2 Atmospheric corrections and parameter retrieval
 Optical Theory Basics - 2 Atmospheric corrections and parameter retrieval Jose Moreno 3 September 2007, Lecture D1Lb2 OPTICAL THEORY-FUNDAMENTALS (2) Radiation laws: definitions and nomenclature Sources
CHAPTER 5 OBJECT ORIENTED IMAGE ANALYSIS
 85 CHAPTER 5 OBJECT ORIENTED IMAGE ANALYSIS 5.1 GENERAL Urban feature mapping is one of the important component for the planning, managing and monitoring the rapid urbanized growth. The present conventional
A Hybrid Entropy Decomposition and Support Vector Machine Method for Agricultural Crop Type Classification
 PIERS ONLINE, VOL. 3, NO. 5, 2007 620 A Hybrid Entropy Decomposition and Support Vector Machine Method for Agricultural Crop Type Classification Chue-Poh Tan 1, Hong-Tat Ewe 2, and Hean-Teik Chuah 1 1
SOME ISSUES RELATED WITH SUB-PIXEL CLASSIFICATION USING HYPERION DATA
 SOME ISSUES RELATED WITH SUB-PIXEL CLASSIFICATION USING HYPERION DATA A. Kumar a*, H. A. Min b, a Indian Institute of Remote Sensing, Dehradun, India. anil@iirs.gov.in b Satellite Data Processing and Digital
As a GIS technician, your job will be to take the available data and develop suitability maps for the site.
 Study Guide: Geographic Informations Systems Area: Land-use Analysis with ArcView 3.x Subject: Using Soil maps to Assess site suitability Objectives: Upon completing this study guide you should be able
Lesson 7: Gathering Stand-Level Information
 Lesson 7: Gathering Stand-Level Information Review and Introduction In previous lessons, you learned how to establish and take measurements in sample plots. Now we will begin to transition toward using
DATA FUSION AND INTEGRATION FOR MULTI-RESOLUTION ONLINE 3D ENVIRONMENTAL MONITORING
 DATA FUSION AND INTEGRATION FOR MULTI-RESOLUTION ONLINE 3D ENVIRONMENTAL MONITORING Yun Zhang, Pingping Xie, Hui Li Department of Geodesy and Geomatics Engineering, University of New Brunswick Fredericton,
Aardobservatie en Data-analyse Image processing
 Aardobservatie en Data-analyse Image processing 1 Image processing: Processing of digital images aiming at: - image correction (geometry, dropped lines, etc) - image calibration: DN into radiance or into
Introduction to GIS. Geographic Information Systems SOCR-377 9/24/2015. R. Khosla Fall Semester The real world. What in the world is GIS?
 Introduction to GIS Geographic Information Systems SOCR-377 What in the world is GIS? GIS is simultaneously the telescope, the microscope, the computer and the Xerox machine of regional analysis and synthesis
Absolute Calibration Correction Coefficients of GOES Imager Visible Channel: DCC Reference Reflectance with Aqua MODIS C6 Data
 Absolute Calibration Correction Coefficients of GOES Imager Visible Channel: DCC Reference Reflectance with Aqua MODIS C6 Data Fangfang Yu and Xiangqian Wu 01/08/2014 1 Outlines DCC reference reflectance
Rainforest Alliance. Spatial data requirements and guidance. June 2018 Version 1.1
 Rainforest Alliance Spatial data requirements and guidance June 2018 Version 1.1 More information? For more information about the Rainforest Alliance, visit www.rainforest-alliance.org or contact info@ra.org
Crop Classification with RapidEye and Radar Data
 Crop Classification with RapidEye and Radar Data U. Schulthess, M. Kunze and H. Weichelt DGPF Hannover - 2010/11/18
Assessment of Polarimetric and Spatial Features for Built-up Mapping using ALOS PALSAR Polarimetric SAR Data
 Assessment of Polarimetric and patial Features for Built-up Mapping using ALO PALAR Polarimetric AR Data hucheng YOU, China Key words: ALO PALAR, support vector machine, random forest, built-up mapping
CBS PROCEDURE ON REGIONAL REQUIREMENTS COORDINATION GROUPS. (Submitted by the Secretariat) Summary and Purpose of Document
 Summary and Purpose of Document") WORLD METEOROLOGICAL ORGANIZATION COMMISSION FOR BASIC SYSTEMS OPEN PROGRAMME AREA GROUP ON INTEGRATED OBSERVING SYSTEMS EXPERT TEAM ON SATELLITE UTILIZATION AND PRODUCTS SEVENTH SESSION GENEVA, SWITZERLAND,
WORLD METEOROLOGICAL ORGANIZATION COMMISSION FOR BASIC SYSTEMS OPEN PROGRAMME AREA GROUP ON INTEGRATED OBSERVING SYSTEMS EXPERT TEAM ON SATELLITE UTILIZATION AND PRODUCTS SEVENTH SESSION GENEVA, SWITZERLAND,
GLS Analysis. Dave Skole, Walter Chomentowski, and Jay Samek Michigan State University April 2010
 GLS Analysis Dave Skole, Walter Chomentowski, and Jay Samek Michigan State University April 2010 GLS data acquisition overview 2005 2000 1990 TOTAL SCENES 9390 8928 7446 TOTAL TROPICS 2323 1920 1866 MISSING
Machine Learning and Sensor Fusion for Precision Farming. Solmaz Hajmohammadi, Christopher Schardt, Noah Fahlgren, Arash Abbasi, Stefan Paulus
 Machine Learning and Sensor Fusion for Precision Farming Solmaz Hajmohammadi, Christopher Schardt, Noah Fahlgren, Arash Abbasi, Stefan Paulus Food Insecurity Increase in population 2.8 Billion more people
Hydrological network detection for SWOT data. S. Lobry, F. Cao, R. Fjortoft, JM Nicolas, F. Tupin
 Hydrological network detection for SWOT data S. Lobry, F. Cao, R. Fjortoft, JM Nicolas, F. Tupin IRS SPU avril 2016 SWOT mission Large water bodies detection Fine network detection Further works page 1
Using ArcGIS for Landcover Classification. Presented by CORE GIS May 8, 2012
 Using ArcGIS for Landcover Classification Presented by CORE GIS May 8, 2012 How to use ArcGIS for Image Classification 1. Find and download the right data 2. Have a look at the data (true color/false color)
Prof. Vidya Manian Dept. of Electrical l and Comptuer Engineering. INEL6007(Spring 2010) ECE, UPRM
 ECE, UPRM") Inel 6007 Introduction to Remote Sensing Chapter 5 Spectral Transforms Prof. Vidya Manian Dept. of Electrical l and Comptuer Engineering Chapter 5-1 MSI Representation Image Space: Spatial information
Inel 6007 Introduction to Remote Sensing Chapter 5 Spectral Transforms Prof. Vidya Manian Dept. of Electrical l and Comptuer Engineering Chapter 5-1 MSI Representation Image Space: Spatial information
2-band Enhanced Vegetation Index without a blue band and its application to AVHRR data
 2-band Enhanced Vegetation Index without a blue band and its application to AVHRR data Zhangyan Jiang*, Alfredo R. Huete, Youngwook Kim, Kamel Didan Department of Soil, Water, and Environmental Science,
Glacier Mapping and Monitoring
 Glacier Mapping and Monitoring Exercises Tobias Bolch Universität Zürich TU Dresden tobias.bolch@geo.uzh.ch Exercise 1: Visualizing multi-spectral images with Erdas Imagine 2011 a) View raster data: Open
Roberto Cardoso Ilacqua. QGis Handbook for Supervised Classification of Areas. Santo André
 Roberto Cardoso Ilacqua QGis Handbook for Supervised Classification of Areas Santo André 2017 Roberto Cardoso Ilacqua QGis Handbook for Supervised Classification of Areas This manual was designed to assist
LIDAR MAPPING FACT SHEET
 1. LIDAR THEORY What is lidar? Lidar is an acronym for light detection and ranging. In the mapping industry, this term is used to describe an airborne laser profiling system that produces location and
Benefits of Partnering with the Private Sector: Success Stories in Building Infrastructures. John Doherty Global Development Officer
 Benefits of Partnering with the Private Sector: Success Stories in Building Infrastructures John Doherty Global Development Officer Challenges Facing National Met Agencies Building Severe Weather Monitoring
Fifteenth ARM Science Team Meeting Proceedings, Daytona Beach, Florida, March 14-18, 2005
 Assessing the Impact of the Plane-Parallel Cloud Assumption used in Computing Shortwave Heating Rate Profiles for the Broadband Heating Rate Profile Project W. O Hirok Institute for Computational Earth
SAM and ANN classification of hyperspectral data of seminatural agriculture used areas
 Proceedings of the 28th EARSeL Symposium: Remote Sensing for a Changing Europe, Istambul, Turkey, June 2-5 2008. Millpress Science Publishers Zagajewski B., Olesiuk D., 2008. SAM and ANN classification
Optical/Thermal: Principles & Applications
 Optical/Thermal: Principles & Applications Jose F. Moreno University of Valencia, Spain Jose.Moreno@uv.es Lecture D1T2 1 July 2013 23/07/2013 1 OPTICAL PRINCIPLES AND APPLICATIONS Information content of
SWOT LAKE PRODUCT. Claire POTTIER(CNES) and P. Callahan (JPL) SWOT ADT project team J.F. Cretaux, T. Pavelsky SWOT ST Hydro leads
 and P. Callahan (JPL) SWOT ADT project team J.F. Cretaux, T. Pavelsky SWOT ST Hydro leads") SWOT LAKE PRODUCT Claire POTTIER(CNES) and P. Callahan (JPL) SWOT ADT project team J.F. Cretaux, T. Pavelsky SWOT ST Hydro leads Lake, Climate and Remote Sensing Workshop Toulouse June 1&2 2017 High Rate
SWOT LAKE PRODUCT Claire POTTIER(CNES) and P. Callahan (JPL) SWOT ADT project team J.F. Cretaux, T. Pavelsky SWOT ST Hydro leads Lake, Climate and Remote Sensing Workshop Toulouse June 1&2 2017 High Rate
FIELD-BASED CLASSIFICATION OF AGRICULTURAL CROPS USING MULTI-SCALE IMAGES
 FIELD-BASED CLASSIFICATION OF AGRICULTURAL CROPS USING MULTI-SCALE IMAGES A. OZDARICI a, M. TURKER b a Middle East Technical University (METU), Graduate School of Natural and Applied Sciences, Geodetic
2010 LiDAR Project. GIS User Group Meeting June 30, 2010
 2010 LiDAR Project GIS User Group Meeting June 30, 2010 LiDAR = Light Detection and Ranging Technology that utilizes lasers to determine the distance to an object or surface Measures the time delay between
2. Using the Hybrid-Maize Model
 2. Using the Hybrid-Maize Model 2.1. Installation System requirements: Free disk space: depending on weather data included. Full installation amounts to about 18.5 MB, including 6.8 MB of weather data
Hamilton County Enhances GIS Base Mapping with 1-foot Contours
 Hamilton County Enhances GIS Base Mapping with 1-foot Contours Presented by Larry Stout, Hamilton County GIS Manager Brad Fugate, Woolpert Inc. Today s Presentation Hamilton County s 2004 Base Mapping
InSAR DEM; why it is better?
 InSAR DEM; why it is better? What is a DEM? Digital Elevation Model (DEM) refers to the process of demonstrating terrain elevation characteristics in 3-D space, but very often it specifically means the
Pastures pro-rata coefficients Semi automatic classification in Italy AGEA
 Pastures pro-rata coefficients Semi automatic classification in Italy AGEA Background EC Regulation 640/2014 art. 10 allows MS to use pro-rata coefficients to calculate non eligible areas to be excluded
EVALUATION OF CONVENTIONAL DIGITAL CAMERA SCENES FOR THEMATIC INFORMATION EXTRACTION ABSTRACT
 EVALUATION OF CONVENTIONAL DIGITAL CAMERA SCENES FOR THEMATIC INFORMATION EXTRACTION H. S. Lim, M. Z. MatJafri and K. Abdullah School of Physics Universiti Sains Malaysia, 11800 Penang ABSTRACT A study
Lab #4 Introduction to Image Processing II and Map Accuracy Assessment
 FOR 324 Natural Resources Information Systems Lab #4 Introduction to Image Processing II and Map Accuracy Assessment (Adapted from the Idrisi Tutorial, Introduction Image Processing Exercises, Exercise
MODULE 1 BASIC LIDAR TECHNIQUES
 MODULE SCENARIO One of the first tasks a geographic information systems (GIS) department using lidar data should perform is to check the quality of the data delivered by the data provider. The department
Data Curation Practices at the Oak Ridge National Laboratory Distributed Active Archive Center
 Data Curation Practices at the Oak Ridge National Laboratory Distributed Active Archive Center Robert Cook, DAAC Scientist Environmental Sciences Division Oak Ridge National Laboratory Oak Ridge, TN cookrb@ornl.gov
Object Based Image Analysis: Introduction to ecognition
 Object Based Image Analysis: Introduction to ecognition ecognition Developer 9.0 Description: We will be using ecognition and a simple image to introduce students to the concepts of Object Based Image
A 3D Scanner Based Technology for Land Levelling
 A 3D Scanner Based Technology for Land Levelling Kunal Chakraborti, Rupam Ghosh Student, Dept of Civil Engineering, Modern Institute of Engineering & Technology, Bandel, Hooghly, West Bengal, India ABSTRACT:
Canasat Project accuracy assessment of sugarcane thematic maps
 Canasat Project accuracy assessment of sugarcane thematic maps Marcio Pupin Mello, Marcos Adami, Bernardo F. T. Rudorff and Daniel Alves Aguiar National Institute for Space Research (INPE), Remote Sensing
REDD+ FOR THE GUIANA SHIELD Technical Cooperation Project
 REDD+ FOR THE GUIANA SHIELD Technical Cooperation Project REDD+ for the Guiana Shield Mathieu Rahm, ONF international Impact of Gold mining training session, 24-28 November 2014 Cayenne French Guiana Methodology
EVALUATION OF THE THEMATIC INFORMATION CONTENT OF THE ASTER-VNIR IMAGERY IN URBAN AREAS BY CLASSIFICATION TECHNIQUES
 EVALUATION OF THE THEMATIC INFORMATION CONTENT OF THE ASTER-VNIR IMAGERY IN URBAN AREAS BY CLASSIFICATION TECHNIQUES T. G. Panagou a *, G. Ch. Miliaresis a a TEI, Dpt. of Topography, 3 P.Drakou Str., Thiva,
The Gain setting for Landsat 7 (High or Low Gain) depends on: Sensor Calibration - Application. the surface cover types of the earth and the sun angle
 depends on: Sensor Calibration - Application. the surface cover types of the earth and the sun angle") Sensor Calibration - Application Station Identifier ASN Scene Center atitude 34.840 (34 3'0.64"N) Day Night DAY Scene Center ongitude 33.03270 (33 0'7.72"E) WRS Path WRS Row 76 036 Corner Upper eft atitude
Sensor Calibration - Application Station Identifier ASN Scene Center atitude 34.840 (34 3'0.64"N) Day Night DAY Scene Center ongitude 33.03270 (33 0'7.72"E) WRS Path WRS Row 76 036 Corner Upper eft atitude
Luciana Alvim S. Romani (PI) Jurandir Zullo Jr. (Co-PI) Embrapa Agricultural Informatics. Cepagri/Unicamp Campinas, SP ( )
 Jurandir Zullo Jr. (Co-PI) Embrapa Agricultural Informatics. Cepagri/Unicamp Campinas, SP ( )") Digital Infrastructure and Novel Computational Methods for Analyzing and Mining Climate and Remote Sensing Large Databases to improve Agricultural Monitoring and Forecasting Luciana Alvim S. Romani (PI)
Digital Infrastructure and Novel Computational Methods for Analyzing and Mining Climate and Remote Sensing Large Databases to improve Agricultural Monitoring and Forecasting Luciana Alvim S. Romani (PI)
Developing an Interactive GIS Tool for Stream Classification in Northeast Puerto Rico
 Developing an Interactive GIS Tool for Stream Classification in Northeast Puerto Rico Lauren Stachowiak Advanced Topics in GIS Spring 2012 1 Table of Contents: Project Introduction-------------------------------------
Map Central for Clients How to manual March 2016
 Map Central for Clients How to manual March 2016 Prepared by : Helena Nermut Suite 2, 1st Floor 120 Upper Heidelberg Road Ivanhoe VIC 3079 P: 61 3 9490 5400 F: 61 3 9497 2008 E: ausinfo@pfolsen.com www.pfolsen.com/au
BLANK DATASHEETS & TEMPLATES
 BLANK DATASHEETS & TEMPLATES Inside you ll find... Monitoring Mini Plan Template Weed Survey Datasheet Photo Record Datasheet Vegetation Plots Datasheet Wetland WOF Datasheet Pressure Wetland WOF Datasheet
Geometric Accuracy Evaluation, DEM Generation and Validation for SPOT-5 Level 1B Stereo Scene
 Geometric Accuracy Evaluation, DEM Generation and Validation for SPOT-5 Level 1B Stereo Scene Buyuksalih, G.*, Oruc, M.*, Topan, H.*,.*, Jacobsen, K.** * Karaelmas University Zonguldak, Turkey **University
Terrestrial GPS setup Fundamentals of Airborne LiDAR Systems, Collection and Calibration. JAMIE YOUNG Senior Manager LiDAR Solutions
 Terrestrial GPS setup Fundamentals of Airborne LiDAR Systems, Collection and Calibration JAMIE YOUNG Senior Manager LiDAR Solutions Topics Terrestrial GPS reference Planning and Collection Considerations
Image Classification. RS Image Classification. Present by: Dr.Weerakaset Suanpaga
 Image Classification Present by: Dr.Weerakaset Suanpaga D.Eng(RS&GIS) 6.1 Concept of Classification Objectives of Classification Advantages of Multi-Spectral data for Classification Variation of Multi-Spectra