Allinea Unified Environment
|
|
|
- Ginger Casey
- 5 years ago
- Views:
Transcription
1 Allinea Unified Environment Allinea s unified tools for debugging and profiling HPC Codes Beau Paisley Allinea Software bpaisley@allinea.com


2

3 Today s Challenge Q: What is the impact of current trends in HPC on your application? Q: How can you make your science run well on the available system?? A: Development. Development implies both fixing problems and optimizing the computation.
4 CPU Cores Machine Size Growth 10,000,000 1,000, ,000 10,000 1, No. 1 No. 100 No. 500 Machine sizes are exploding Software scale grows as machines grow

5 Compilers Can t do it All,

6 Debugging in practice

7 Optimization in practice Insert timers Change code Run code Analyse result
8 Some Bug Types Bohrbug Steady, dependable bug Heisenbug Vanishes when you try to debug (observe) Mandelbug Complexity and obscurity of the cause is so great that it appears chaotic Schroedinbug First occurs after someone reads the source file and deduces that it never worked, after which the program ceases to work


9 Allinea Unified Environment A modern integrated environment for HPC developers Supporting the lifecycle of application development and improvement Allinea DDT : Productively debug code Allinea MAP : Enhance application performance Allinea Performance Reports: Characterize Application performance Designed for productivity Consistent easy to use tools Enables effective HPC development Improve system usage Fewer failed jobs Higher application performance

10 An Integrated Environment Share GUI, Shared Scalable Architecture Use Allinea MAP to find a bottleneck Flick to Allinea DDT to understand it Compare variables, expressions, call paths High memory usage? Use DDT to find out why Common interface and settings files
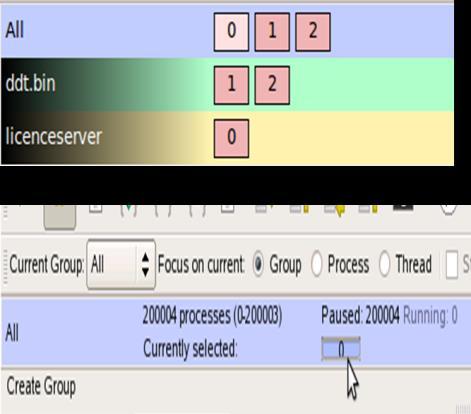
11 Allinea DDT Fix software problems - fast Graphical debugger designed for: C/C++, Fortran, UPC, CUDA, CUDA Fortran, OpenACC Multi-threaded code Multi-process code Accelerated codes GPUs, Intel Xeon Phi Debugging 1 to 700k processes Slash your time to debug : Reproduces and triggers your bugs instantly Helps you to fix them as swiftly as possible Helps you easily understand where issues come from quickly


12 Allinea DDT: Debugging that Scales


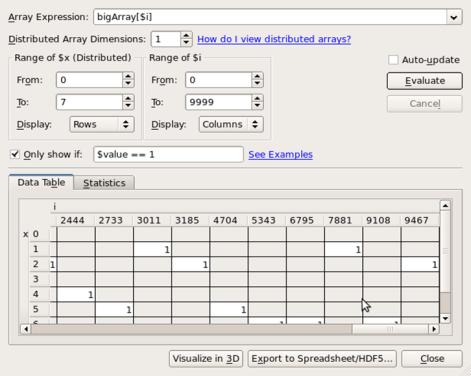


13 Top Features for HPC Debugging Parallel stack view Automated data comparison: sparklines Numerical and graphical data visualization Step, play, and breakpoints Offline debugging Tracepoints
14 Allinea MAP Increase Application Performance Parallel profiler designed for: C/C++, Fortran Multi-process code Interdependent or independent processes Multi-threaded code Monitor the main threads for each process Accelerated codes GPUs, Intel Xeon Phi Improve productivity : Helps you detect performance issues quickly and easily Tells you immediately where your time is spent in your source code Helps you to optimize your application efficiently


15 Find Performance Issues Quickly Look at the entire application on real data sets Visualize the entire run at full scale, not just reduced sets Zoom in to explore iterations, functions and loops Non-Destructive Profiling Less than 5% overhead No need to instrument your code Small output files (10-20Mb is typical) Understand the nature of bottlenecks Source code viewer pinpoints bottleneck locations CPU, MPI, I/Os and memory metrics identify the cause


16 Providing Visual Scalability Common horizontal axis Aggregate across all processes Highlight imbalance visually Always refer to source code

17 Allinea Performance Reports Effortless one-touch reports Add one command to your run script A one-page report is generated automatically Characterize and understand application performance With < 5% application slowdown


18 Top Features for HPC Code Optimization Allinea s tools provide extensive performance metrics, with low overhead Allinea s tools provide a graphical, easy-to-use presentation that is easily understood by scientists, engineers, and software developers Allinea MAP shows exactly which lines of source code are slow and why without modifications or instrumentation Allinea Performance Reports offers application level performance characterization and advice

19 Remote Access Clients for Mac, Windows and Linux Easier access to distant clusters Scalable debugging tree already cuts down network traffic Secure low-latency debugging and profiling clients Extends existing remote cluster support to cover No shared filesystem Remote/local source-viewing Support for multi-hop SSH and OTP systems Allinea DDT feature set available remotely Linux, Windows and OS/X clients Real native GUI no VNC or X-forwarding lag


20 What Our Users are Saying


21 Thank You Try it out at:
Understanding Dynamic Parallelism
 Understanding Dynamic Parallelism Know your code and know yourself Presenter: Mark O Connor, VP Product Management Agenda Introduction and Background Fixing a Dynamic Parallelism Bug Understanding Dynamic
Debugging HPC Applications. David Lecomber CTO, Allinea Software
 Debugging HPC Applications David Lecomber CTO, Allinea Software david@allinea.com Agenda Bugs and Debugging Debugging parallel applications Debugging OpenACC and other hybrid codes Debugging for Petascale
Debugging CUDA Applications with Allinea DDT. Ian Lumb Sr. Systems Engineer, Allinea Software Inc.
 Debugging CUDA Applications with Allinea DDT Ian Lumb Sr. Systems Engineer, Allinea Software Inc. ilumb@allinea.com GTC 2013, San Jose, March 20, 2013 Embracing GPUs GPUs a rival to traditional processors
Tools and Methodology for Ensuring HPC Programs Correctness and Performance. Beau Paisley
 Tools and Methodology for Ensuring HPC Programs Correctness and Performance Beau Paisley bpaisley@allinea.com About Allinea Over 15 years of business focused on parallel programming development tools Strong
Debugging for the hybrid-multicore age (A HPC Perspective) David Lecomber CTO, Allinea Software
 David Lecomber CTO, Allinea Software") Debugging for the hybrid-multicore age (A HPC Perspective) David Lecomber CTO, Allinea Software david@allinea.com Agenda What is HPC? How is scale affecting HPC? Achieving tool scalability Scale in practice
Debugging for the hybrid-multicore age (A HPC Perspective) David Lecomber CTO, Allinea Software david@allinea.com Agenda What is HPC? How is scale affecting HPC? Achieving tool scalability Scale in practice
GPU Debugging Made Easy. David Lecomber CTO, Allinea Software
 GPU Debugging Made Easy David Lecomber CTO, Allinea Software david@allinea.com Allinea Software HPC development tools company Leading in HPC software tools market Wide customer base Blue-chip engineering,
Developing, Debugging, and Optimizing GPU Codes for High Performance Computing with Allinea Forge
 Developing, Debugging, and Optimizing GPU Codes for High Performance Computing with Allinea Forge Ryan Hulguin Applications Engineer ryan.hulguin@arm.com Agenda Introduction Overview of Allinea Products
Development Tools for Parallel Computing. David Lecomber CTO, Allinea Software
 Development Tools for Parallel Computing David Lecomber CTO, Allinea Software david@allinea.com Agenda Introduction What is HPC Bugs and Debugging Debugging parallel applications Challenges for the future
Accelerate HPC Development with Allinea Performance Tools
 Accelerate HPC Development with Allinea Performance Tools 19 April 2016 VI-HPS, LRZ Florent Lebeau / Ryan Hulguin flebeau@allinea.com / rhulguin@allinea.com Agenda 09:00 09:15 Introduction 09:15 09:45
Debugging at Scale Lindon Locks
 Debugging at Scale Lindon Locks llocks@allinea.com Debugging at Scale At scale debugging - from 100 cores to 250,000 Problems faced by developers on real systems Alternative approaches to debugging and
Improving the Productivity of Scalable Application Development with TotalView May 18th, 2010
 Improving the Productivity of Scalable Application Development with TotalView May 18th, 2010 Chris Gottbrath Principal Product Manager Rogue Wave Major Product Offerings 2 TotalView Technologies Family
Addressing the Increasing Challenges of Debugging on Accelerated HPC Systems. Ed Hinkel Senior Sales Engineer
 Addressing the Increasing Challenges of Debugging on Accelerated HPC Systems Ed Hinkel Senior Sales Engineer Agenda Overview - Rogue Wave & TotalView GPU Debugging with TotalView Nvdia CUDA Intel Phi 2
STARTING THE DDT DEBUGGER ON MIO, AUN, & MC2. (Mouse over to the left to see thumbnails of all of the slides)
") STARTING THE DDT DEBUGGER ON MIO, AUN, & MC2 (Mouse over to the left to see thumbnails of all of the slides) ALLINEA DDT Allinea DDT is a powerful, easy-to-use graphical debugger capable of debugging a
STARTING THE DDT DEBUGGER ON MIO, AUN, & MC2 (Mouse over to the left to see thumbnails of all of the slides) ALLINEA DDT Allinea DDT is a powerful, easy-to-use graphical debugger capable of debugging a
Large Scale Debugging
 Large Scale Debugging Project Meeting Report - December 2015 Didier Nadeau Under the supervision of Michel Dagenais Distributed Open Reliable Systems Analysis Lab École Polytechnique de Montréal Table
CUDA Development Using NVIDIA Nsight, Eclipse Edition. David Goodwin
 CUDA Development Using NVIDIA Nsight, Eclipse Edition David Goodwin NVIDIA Nsight Eclipse Edition CUDA Integrated Development Environment Project Management Edit Build Debug Profile SC'12 2 Powered By
IBM High Performance Computing Toolkit
 IBM High Performance Computing Toolkit Pidad D'Souza (pidsouza@in.ibm.com) IBM, India Software Labs Top 500 : Application areas (November 2011) Systems Performance Source : http://www.top500.org/charts/list/34/apparea
Parallel Debugging with TotalView BSC-CNS
 Parallel Debugging with TotalView BSC-CNS AGENDA What debugging means? Debugging Tools in the RES Allinea DDT as alternative (RogueWave Software) What is TotalView Compiling Your Program Starting totalview
Productive Performance on the Cray XK System Using OpenACC Compilers and Tools
 Productive Performance on the Cray XK System Using OpenACC Compilers and Tools Luiz DeRose Sr. Principal Engineer Programming Environments Director Cray Inc. 1 The New Generation of Supercomputers Hybrid
ECMWF Workshop on High Performance Computing in Meteorology. 3 rd November Dean Stewart
 ECMWF Workshop on High Performance Computing in Meteorology 3 rd November 2010 Dean Stewart Agenda Company Overview Rogue Wave Product Overview IMSL Fortran TotalView Debugger Acumem ThreadSpotter 1 Copyright
Debugging Intel Xeon Phi KNC Tutorial
 Debugging Intel Xeon Phi KNC Tutorial Last revised on: 10/7/16 07:37 Overview: The Intel Xeon Phi Coprocessor 2 Debug Library Requirements 2 Debugging Host-Side Applications that Use the Intel Offload
Guillimin HPC Users Meeting July 14, 2016
 Guillimin HPC Users Meeting July 14, 2016 guillimin@calculquebec.ca McGill University / Calcul Québec / Compute Canada Montréal, QC Canada Outline Compute Canada News System Status Software Updates Training
How to run applications on Aziz supercomputer. Mohammad Rafi System Administrator Fujitsu Technology Solutions
 How to run applications on Aziz supercomputer Mohammad Rafi System Administrator Fujitsu Technology Solutions Agenda Overview Compute Nodes Storage Infrastructure Servers Cluster Stack Environment Modules
Reusing this material
 XEON PHI BASICS Reusing this material This work is licensed under a Creative Commons Attribution- NonCommercial-ShareAlike 4.0 International License. http://creativecommons.org/licenses/by-nc-sa/4.0/deed.en_us
Debugging and profiling of MPI programs
 Debugging and profiling of MPI programs The code examples: http://syam.sharcnet.ca/mpi_debugging.tgz Sergey Mashchenko (SHARCNET / Compute Ontario / Compute Canada) Outline Introduction MPI debugging MPI
Oracle Developer Studio Performance Analyzer
 Oracle Developer Studio Performance Analyzer The Oracle Developer Studio Performance Analyzer provides unparalleled insight into the behavior of your application, allowing you to identify bottlenecks and
Intel VTune Amplifier XE
 Intel VTune Amplifier XE Vladimir Tsymbal Performance, Analysis and Threading Lab 1 Agenda Intel VTune Amplifier XE Overview Features Data collectors Analysis types Key Concepts Collecting performance
Analyzing the Performance of IWAVE on a Cluster using HPCToolkit
 Analyzing the Performance of IWAVE on a Cluster using HPCToolkit John Mellor-Crummey and Laksono Adhianto Department of Computer Science Rice University {johnmc,laksono}@rice.edu TRIP Meeting March 30,
Intel VTune Performance Analyzer 9.1 for Windows* In-Depth
 Intel VTune Performance Analyzer 9.1 for Windows* In-Depth Contents Deliver Faster Code...................................... 3 Optimize Multicore Performance...3 Highlights...............................................
Performance analysis tools: Intel VTuneTM Amplifier and Advisor. Dr. Luigi Iapichino
 Performance analysis tools: Intel VTuneTM Amplifier and Advisor Dr. Luigi Iapichino luigi.iapichino@lrz.de Which tool do I use in my project? A roadmap to optimisation After having considered the MPI layer,
Memory & Thread Debugger
 Memory & Thread Debugger Here is What Will Be Covered Overview Memory/Thread analysis New Features Deep dive into debugger integrations Demo Call to action Intel Confidential 2 Analysis Tools for Diagnosis
Performance Tools for Technical Computing
 Christian Terboven terboven@rz.rwth-aachen.de Center for Computing and Communication RWTH Aachen University Intel Software Conference 2010 April 13th, Barcelona, Spain Agenda o Motivation and Methodology
Tutorial: Analyzing MPI Applications. Intel Trace Analyzer and Collector Intel VTune Amplifier XE
 Tutorial: Analyzing MPI Applications Intel Trace Analyzer and Collector Intel VTune Amplifier XE Contents Legal Information... 3 1. Overview... 4 1.1. Prerequisites... 5 1.1.1. Required Software... 5 1.1.2.
Parallel Programming and Debugging with CUDA C. Geoff Gerfin Sr. System Software Engineer
 Parallel Programming and Debugging with CUDA C Geoff Gerfin Sr. System Software Engineer CUDA - NVIDIA s Architecture for GPU Computing Broad Adoption Over 250M installed CUDA-enabled GPUs GPU Computing
Jackson Marusarz Software Technical Consulting Engineer
 Jackson Marusarz Software Technical Consulting Engineer What Will Be Covered Overview Memory/Thread analysis New Features Deep dive into debugger integrations Demo Call to action 2 Analysis Tools for Diagnosis
Debugging with TotalView
 Debugging with TotalView Le Yan HPC Consultant User Services Goals Learn how to start TotalView on Linux clusters Get familiar with TotalView graphic user interface Learn basic debugging functions of TotalView
The Eclipse Parallel Tools Platform
 May 1, 2012 Toward an Integrated Development Environment for Improved Software Engineering on Crays Agenda 1. What is the Eclipse Parallel Tools Platform (PTP) 2. Tour of features available in Eclipse/PTP
OpenACC Course. Office Hour #2 Q&A
 OpenACC Course Office Hour #2 Q&A Q1: How many threads does each GPU core have? A: GPU cores execute arithmetic instructions. Each core can execute one single precision floating point instruction per cycle
Performance Profiler. Klaus-Dieter Oertel Intel-SSG-DPD IT4I HPC Workshop, Ostrava,
 Performance Profiler Klaus-Dieter Oertel Intel-SSG-DPD IT4I HPC Workshop, Ostrava, 08-09-2016 Faster, Scalable Code, Faster Intel VTune Amplifier Performance Profiler Get Faster Code Faster With Accurate
Debugging and Optimizing Programs Accelerated with Intel Xeon Phi Coprocessors
 Debugging and Optimizing Programs Accelerated with Intel Xeon Phi Coprocessors Chris Gottbrath Rogue Wave Software Boulder, CO Chris.Gottbrath@roguewave.com Abstract Intel Xeon Phi coprocessors present
GPU Technology Conference Three Ways to Debug Parallel CUDA Applications: Interactive, Batch, and Corefile
 GPU Technology Conference 2015 Three Ways to Debug Parallel CUDA Applications: Interactive, Batch, and Corefile Three Ways to Debug Parallel CUDA Applications: Interactive, Batch, and Corefile What do
Welcomes PRACE/LinkSCEEM 2011 Winter School Jacques Philouze Vice President Sales & Marketing
 Welcomes PRACE/LinkSCEEM 2011 Winter School Jacques Philouze jacques@allinea.com Vice President Sales & Marketing Content Company Background Products in more depth Allinea OPT (Optimization and Profiling
HPC Architectures. Types of resource currently in use
 HPC Architectures Types of resource currently in use Reusing this material This work is licensed under a Creative Commons Attribution- NonCommercial-ShareAlike 4.0 International License. http://creativecommons.org/licenses/by-nc-sa/4.0/deed.en_us
Performance Analysis of Parallel Scientific Applications In Eclipse
 Performance Analysis of Parallel Scientific Applications In Eclipse EclipseCon 2015 Wyatt Spear, University of Oregon wspear@cs.uoregon.edu Supercomputing Big systems solving big problems Performance gains
Debugging, benchmarking, tuning i.e. software development tools. Martin Čuma Center for High Performance Computing University of Utah
 Debugging, benchmarking, tuning i.e. software development tools Martin Čuma Center for High Performance Computing University of Utah m.cuma@utah.edu SW development tools Development environments Compilers
Development tools to enable Multicore
 Development tools to enable Multicore From the desktop to the extreme A perspective on multicore looking in from HPC David Lecomber CTO, Allinea Software david@allinea.com Introduction The Multicore Challenge
LS-DYNA Best-Practices: Networking, MPI and Parallel File System Effect on LS-DYNA Performance
 11 th International LS-DYNA Users Conference Computing Technology LS-DYNA Best-Practices: Networking, MPI and Parallel File System Effect on LS-DYNA Performance Gilad Shainer 1, Tong Liu 2, Jeff Layton
PORTING CP2K TO THE INTEL XEON PHI. ARCHER Technical Forum, Wed 30 th July Iain Bethune
 PORTING CP2K TO THE INTEL XEON PHI ARCHER Technical Forum, Wed 30 th July Iain Bethune (ibethune@epcc.ed.ac.uk) Outline Xeon Phi Overview Porting CP2K to Xeon Phi Performance Results Lessons Learned Further
Intel C++ Compiler User's Guide With Support For The Streaming Simd Extensions 2
 Intel C++ Compiler User's Guide With Support For The Streaming Simd Extensions 2 This release of the Intel C++ Compiler 16.0 product is a Pre-Release, and as such is 64 architecture processor supporting
Introduction to Parallel Performance Engineering
 Introduction to Parallel Performance Engineering Markus Geimer, Brian Wylie Jülich Supercomputing Centre (with content used with permission from tutorials by Bernd Mohr/JSC and Luiz DeRose/Cray) Performance:
Introduction to debugging. Martin Čuma Center for High Performance Computing University of Utah
 Introduction to debugging Martin Čuma Center for High Performance Computing University of Utah m.cuma@utah.edu Overview Program errors Simple debugging Graphical debugging DDT and Totalview Intel tools
Welcome. HRSK Practical on Debugging, Zellescher Weg 12 Willers-Bau A106 Tel
 Center for Information Services and High Performance Computing (ZIH) Welcome HRSK Practical on Debugging, 03.04.2009 Zellescher Weg 12 Willers-Bau A106 Tel. +49 351-463 - 31945 Matthias Lieber (matthias.lieber@tu-dresden.de)
Code optimization. Geert Jan Bex
 Code optimization Geert Jan Bex (geertjan.bex@uhasselt.be) License: this presentation is released under the Creative Commons, see http://creativecommons.org/publicdomain/zero/1.0/ 1 CPU 2 Vectorization
AcuSolve Performance Benchmark and Profiling. October 2011
 AcuSolve Performance Benchmark and Profiling October 2011 Note The following research was performed under the HPC Advisory Council activities Participating vendors: Intel, Dell, Mellanox, Altair Compute
Using Intel VTune Amplifier XE and Inspector XE in.net environment
 Using Intel VTune Amplifier XE and Inspector XE in.net environment Levent Akyil Technical Computing, Analyzers and Runtime Software and Services group 1 Refresher - Intel VTune Amplifier XE Intel Inspector
Debugging on Intel Platforms
 White Paper Robert Mueller-Albrecht Developer Products Division Intel Corporation Debugging on Intel Platforms Introduction...3 Overview...3 Servers and Workstations...4 Support for Linux*, Mac OS X*,
Parallel Programming Libraries and implementations
 Parallel Programming Libraries and implementations Partners Funding Reusing this material This work is licensed under a Creative Commons Attribution- NonCommercial-ShareAlike 4.0 International License.
Introduction to Performance Tuning & Optimization Tools
 Introduction to Performance Tuning & Optimization Tools a[i] a[i+1] + a[i+2] a[i+3] b[i] b[i+1] b[i+2] b[i+3] = a[i]+b[i] a[i+1]+b[i+1] a[i+2]+b[i+2] a[i+3]+b[i+3] Ian A. Cosden, Ph.D. Manager, HPC Software
Debugging Programs Accelerated with Intel Xeon Phi Coprocessors
 Debugging Programs Accelerated with Intel Xeon Phi Coprocessors A White Paper by Rogue Wave Software. Rogue Wave Software 5500 Flatiron Parkway, Suite 200 Boulder, CO 80301, USA www.roguewave.com Debugging
The BioHPC Nucleus Cluster & Future Developments
 1 The BioHPC Nucleus Cluster & Future Developments Overview Today we ll talk about the BioHPC Nucleus HPC cluster with some technical details for those interested! How is it designed? What hardware does
Scalable Interaction with Parallel Applications
 Scalable Interaction with Parallel Applications Filippo Gioachin Chee Wai Lee Laxmikant V. Kalé Department of Computer Science University of Illinois at Urbana-Champaign Outline Overview Case Studies Charm++
NightStar. NightView Source Level Debugger. Real-Time Linux Debugging and Analysis Tools BROCHURE
 NightStar Real-Time Linux Debugging and Analysis Tools Concurrent s NightStar is a powerful, integrated tool set for debugging and analyzing time-critical Linux applications. NightStar tools run with minimal
DDT Debugging Techniques
 DDT Debugging Techniques Carlos Rosales carlos@tacc.utexas.edu Scaling to Petascale 2010 July 7, 2010 Debugging Parallel Programs Usual problems Memory access issues Special cases not accounted for in
Headline in Arial Bold 30pt. Visualisation using the Grid Jeff Adie Principal Systems Engineer, SAPK July 2008
 Headline in Arial Bold 30pt Visualisation using the Grid Jeff Adie Principal Systems Engineer, SAPK July 2008 Agenda Visualisation Today User Trends Technology Trends Grid Viz Nodes Software Ecosystem
Tools for Intel Xeon Phi: VTune & Advisor Dr. Fabio Baruffa - LRZ,
 Tools for Intel Xeon Phi: VTune & Advisor Dr. Fabio Baruffa - fabio.baruffa@lrz.de LRZ, 27.6.- 29.6.2016 Architecture Overview Intel Xeon Processor Intel Xeon Phi Coprocessor, 1st generation Intel Xeon
Using Intel VTune Amplifier XE for High Performance Computing
 Using Intel VTune Amplifier XE for High Performance Computing Vladimir Tsymbal Performance, Analysis and Threading Lab 1 The Majority of all HPC-Systems are Clusters Interconnect I/O I/O... I/O I/O Message
Performance analysis basics
 Performance analysis basics Christian Iwainsky Iwainsky@rz.rwth-aachen.de 25.3.2010 1 Overview 1. Motivation 2. Performance analysis basics 3. Measurement Techniques 2 Why bother with performance analysis
Our Workshop Environment
 Our Workshop Environment John Urbanic Parallel Computing Scientist Pittsburgh Supercomputing Center Copyright 2016 Our Environment This Week Your laptops or workstations: only used for portal access Bridges
KNL tools. Dr. Fabio Baruffa
 KNL tools Dr. Fabio Baruffa fabio.baruffa@lrz.de 2 Which tool do I use? A roadmap to optimization We will focus on tools developed by Intel, available to users of the LRZ systems. Again, we will skip the
TOOLS FOR IMPROVING CROSS-PLATFORM SOFTWARE DEVELOPMENT
 TOOLS FOR IMPROVING CROSS-PLATFORM SOFTWARE DEVELOPMENT Eric Kelmelis 28 March 2018 OVERVIEW BACKGROUND Evolution of processing hardware CROSS-PLATFORM KERNEL DEVELOPMENT Write once, target multiple hardware
Our Workshop Environment
 Our Workshop Environment John Urbanic Parallel Computing Scientist Pittsburgh Supercomputing Center Copyright 2017 Our Environment This Week Your laptops or workstations: only used for portal access Bridges
GPU ACCELERATED DATABASE MANAGEMENT SYSTEMS
 CIS 601 - Graduate Seminar Presentation 1 GPU ACCELERATED DATABASE MANAGEMENT SYSTEMS PRESENTED BY HARINATH AMASA CSU ID: 2697292 What we will talk about.. Current problems GPU What are GPU Databases GPU
The GPU-Cluster. Sandra Wienke Rechen- und Kommunikationszentrum (RZ) Fotos: Christian Iwainsky
 Fotos: Christian Iwainsky") The GPU-Cluster Sandra Wienke wienke@rz.rwth-aachen.de Fotos: Christian Iwainsky Rechen- und Kommunikationszentrum (RZ) The GPU-Cluster GPU-Cluster: 57 Nvidia Quadro 6000 (29 nodes) innovative computer
The GPU-Cluster Sandra Wienke wienke@rz.rwth-aachen.de Fotos: Christian Iwainsky Rechen- und Kommunikationszentrum (RZ) The GPU-Cluster GPU-Cluster: 57 Nvidia Quadro 6000 (29 nodes) innovative computer
Supplement: Visual C++ Debugging
 Supplement: Visual C++ Debugging For Introduction to C++ Programming By Y. Daniel Liang Note: The screen shots are taken from VC++ 2010. It is the same for the later version. 1 Introduction The debugger
Users and utilization of CERIT-SC infrastructure
 Users and utilization of CERIT-SC infrastructure Equipment CERIT-SC is an integral part of the national e-infrastructure operated by CESNET, and it leverages many of its services (e.g. management of user
Particle-in-Cell Simulations on Modern Computing Platforms. Viktor K. Decyk and Tajendra V. Singh UCLA
 Particle-in-Cell Simulations on Modern Computing Platforms Viktor K. Decyk and Tajendra V. Singh UCLA Outline of Presentation Abstraction of future computer hardware PIC on GPUs OpenCL and Cuda Fortran
Beyond Hardware IP An overview of Arm development solutions
 Beyond Hardware IP An overview of Arm development solutions 2018 Arm Limited Arm Technical Symposia 2018 Advanced first design cost (US$ million) IC design complexity and cost aren t slowing down 542.2
Debugging with GDB and DDT
 Debugging with GDB and DDT Ramses van Zon SciNet HPC Consortium University of Toronto June 13, 2014 1/41 Ontario HPC Summerschool 2014 Central Edition: Toronto Outline Debugging Basics Debugging with the
Intel VTune Amplifier XE. Dr. Michael Klemm Software and Services Group Developer Relations Division
 Intel VTune Amplifier XE Dr. Michael Klemm Software and Services Group Developer Relations Division Legal Disclaimer & Optimization Notice INFORMATION IN THIS DOCUMENT IS PROVIDED AS IS. NO LICENSE, EXPRESS
Performance Optimizations via Connect-IB and Dynamically Connected Transport Service for Maximum Performance on LS-DYNA
 Performance Optimizations via Connect-IB and Dynamically Connected Transport Service for Maximum Performance on LS-DYNA Pak Lui, Gilad Shainer, Brian Klaff Mellanox Technologies Abstract From concept to
Intel Parallel Studio XE 2015
 2015 Create faster code faster with this comprehensive parallel software development suite. Faster code: Boost applications performance that scales on today s and next-gen processors Create code faster:
Introduction to the SHARCNET Environment May-25 Pre-(summer)school webinar Speaker: Alex Razoumov University of Ontario Institute of Technology
school webinar Speaker: Alex Razoumov University of Ontario Institute of Technology") Introduction to the SHARCNET Environment 2010-May-25 Pre-(summer)school webinar Speaker: Alex Razoumov University of Ontario Institute of Technology available hardware and software resources our web portal
Introduction to the SHARCNET Environment 2010-May-25 Pre-(summer)school webinar Speaker: Alex Razoumov University of Ontario Institute of Technology available hardware and software resources our web portal
Eliminate Threading Errors to Improve Program Stability
 Eliminate Threading Errors to Improve Program Stability This guide will illustrate how the thread checking capabilities in Parallel Studio can be used to find crucial threading defects early in the development
The Cray Programming Environment. An Introduction
 The Cray Programming Environment An Introduction Vision Cray systems are designed to be High Productivity as well as High Performance Computers The Cray Programming Environment (PE) provides a simple consistent
Jackson Marusarz Intel Corporation
 Jackson Marusarz Intel Corporation Intel VTune Amplifier Quick Introduction Get the Data You Need Hotspot (Statistical call tree), Call counts (Statistical) Thread Profiling Concurrency and Lock & Waits
New User Seminar: Part 2 (best practices)
") New User Seminar: Part 2 (best practices) General Interest Seminar January 2015 Hugh Merz merz@sharcnet.ca Session Outline Submitting Jobs Minimizing queue waits Investigating jobs Checkpointing Efficiency
New User Seminar: Part 2 (best practices) General Interest Seminar January 2015 Hugh Merz merz@sharcnet.ca Session Outline Submitting Jobs Minimizing queue waits Investigating jobs Checkpointing Efficiency
RWTH GPU-Cluster. Sandra Wienke March Rechen- und Kommunikationszentrum (RZ) Fotos: Christian Iwainsky
 Fotos: Christian Iwainsky") RWTH GPU-Cluster Fotos: Christian Iwainsky Sandra Wienke wienke@rz.rwth-aachen.de March 2012 Rechen- und Kommunikationszentrum (RZ) The GPU-Cluster GPU-Cluster: 57 Nvidia Quadro 6000 (29 nodes) innovative
RWTH GPU-Cluster Fotos: Christian Iwainsky Sandra Wienke wienke@rz.rwth-aachen.de March 2012 Rechen- und Kommunikationszentrum (RZ) The GPU-Cluster GPU-Cluster: 57 Nvidia Quadro 6000 (29 nodes) innovative
ARCHER Single Node Optimisation
 ARCHER Single Node Optimisation Profiling Slides contributed by Cray and EPCC What is profiling? Analysing your code to find out the proportion of execution time spent in different routines. Essential
OpenACC 2.6 Proposed Features
 OpenACC 2.6 Proposed Features OpenACC.org June, 2017 1 Introduction This document summarizes features and changes being proposed for the next version of the OpenACC Application Programming Interface, tentatively
Chelsio Communications. Meeting Today s Datacenter Challenges. Produced by Tabor Custom Publishing in conjunction with: CUSTOM PUBLISHING
 Meeting Today s Datacenter Challenges Produced by Tabor Custom Publishing in conjunction with: 1 Introduction In this era of Big Data, today s HPC systems are faced with unprecedented growth in the complexity
Intel profiling tools and roofline model. Dr. Luigi Iapichino
 Intel profiling tools and roofline model Dr. Luigi Iapichino luigi.iapichino@lrz.de Which tool do I use in my project? A roadmap to optimization (and to the next hour) We will focus on tools developed
Intel Xeon Phi Coprocessors
 Intel Xeon Phi Coprocessors Reference: Parallel Programming and Optimization with Intel Xeon Phi Coprocessors, by A. Vladimirov and V. Karpusenko, 2013 Ring Bus on Intel Xeon Phi Example with 8 cores Xeon
HPC on Windows. Visual Studio 2010 and ISV Software
 HPC on Windows Visual Studio 2010 and ISV Software Christian Terboven 19.03.2012 / Aachen, Germany Stand: 16.03.2012 Version 2.3 Rechen- und Kommunikationszentrum (RZ) Agenda
FUJITSU PHI Turnkey Solution
 FUJITSU PHI Turnkey Solution Integrated ready to use XEON-PHI based platform Dr. Pierre Lagier ISC2014 - Leipzig PHI Turnkey Solution challenges System performance challenges Parallel IO best architecture
Facing the challenges of. New Approaches To Debugging Complex Codes! Ed Hinkel, Sales Engineer Rogue Wave Software
 Facing the challenges of or New Approaches To Debugging Complex Codes! Ed Hinkel, Sales Engineer Rogue Wave Software Agenda Introduction Rogue Wave! TotalView! Approaching the Debugging Challenge! 1 TVScript
Portable and Productive Performance with OpenACC Compilers and Tools. Luiz DeRose Sr. Principal Engineer Programming Environments Director Cray Inc.
 Portable and Productive Performance with OpenACC Compilers and Tools Luiz DeRose Sr. Principal Engineer Programming Environments Director Cray Inc. 1 Cray: Leadership in Computational Research Earth Sciences
Analyzing I/O Performance on a NEXTGenIO Class System
 Analyzing I/O Performance on a NEXTGenIO Class System holger.brunst@tu-dresden.de ZIH, Technische Universität Dresden LUG17, Indiana University, June 2 nd 2017 NEXTGenIO Fact Sheet Project Research & Innovation
Performance Analysis with Vampir
 Performance Analysis with Vampir Johannes Ziegenbalg Technische Universität Dresden Outline Part I: Welcome to the Vampir Tool Suite Event Trace Visualization The Vampir Displays Vampir & VampirServer
Intel Parallel Studio 2011
 THE ULTIMATE ALL-IN-ONE PERFORMANCE TOOLKIT Studio 2011 Product Brief Studio 2011 Accelerate Development of Reliable, High-Performance Serial and Threaded Applications for Multicore Studio 2011 is a comprehensive
GPUs and Emerging Architectures
 GPUs and Emerging Architectures Mike Giles mike.giles@maths.ox.ac.uk Mathematical Institute, Oxford University e-infrastructure South Consortium Oxford e-research Centre Emerging Architectures p. 1 CPUs
World s most advanced data center accelerator for PCIe-based servers
 NVIDIA TESLA P100 GPU ACCELERATOR World s most advanced data center accelerator for PCIe-based servers HPC data centers need to support the ever-growing demands of scientists and researchers while staying