Improving the Productivity of Scalable Application Development with TotalView May 18th, 2010
|
|
|
- Alexina Thornton
- 5 years ago
- Views:
Transcription


1 Improving the Productivity of Scalable Application Development with TotalView May 18th, 2010 Chris Gottbrath Principal Product Manager


2 Rogue Wave Major Product Offerings 2
3 TotalView Technologies Family of Products TotalView Highly scalable interactive GUI debugger Supports basic and advanced usage Used from workstations up to the largest HPC systems Makes developers more productive and reduces project risks Improves trace and automated debugging MemoryScape Parallel memory error detection and memory analysis Inductive user interface Easy for those use use tools less frequently Easily integrated into validation process ReplayEngine Parallel record and deterministic replay add-on for TotalView Radically simplifies many debugging tasks Allows straightforward investigation of otherwise stochastic bugs 3

4 What is TotalView? What is TotalView? Parallel and Multithreaded Debugging and Analysis Tool For scientists and engineers working with C/C++ and Fortran Makes developing, maintaining and supporting critical and cutting edge applications easier and less risky Major Features Supports Linux, Unix and Mac OS X Parallel Debugging MPI, Pthreads, OMP, UPC Includes a Remote Display Client freeing users to work from anywhere Memory Debugging with MemoryScape Optional Reverse Debugging with ReplayEngine Batch Debugging with TVSCript and the CLI Advantages Easy to learn graphical user interface with data visualization Wide variety of features so users can tackle unexpected bugs Consistent functionality and look and feel across a wide range of platforms Works robustly with open source and vendor compilers Native debugger core is highly scalable to large clusters, large code and massive datasets 4
5 How can TotalView help you? Debugging means examining a specific controlled instance of program execution Provides an answer to the question : What is my program really doing? Threads and/or MPI When you have Deadlocks and hangs Race conditions It provides Asynchronous thread control Powerful group mechanism Fortran and/or C++ Complex data structures Diving and recursive dive STL Collection Classes STLView Rich class hierarchies Powerful type-casting features Memory Analysis Leaks and Bounds Errors Automatic error detection tools Out of Memory Errors Analysis of heap memory usage by file function and line Data Analysis Numerical errors Extensible data visualization Slicing and filtering of arrays Powerful expression system Conditional watchpoints 5

6 TotalView Remote Display Client The Remote Display Client offers users the ability to easily set up and operate a TotalView debug session that is running on another system. Provides for a connection that is Easy Fast Secure The Remote Display Client is available for: Linux x86 Linux x86-64 Windows XP Windows Vista Mac OS X Leopard and Snow Leopard The Client also provides for submission of jobs to batch queuing systems PBS Pro and LoadLeveler 6


7 MPI in TotalView with Indirect Launch In the Parallel tab, select: 7 7 your MPI preference, number of tasks, and number of nodes. then add any additional starter arguments

8 Subset Attach TotalView does not need to be attached to the entire job You can be attached to different subsets at different times through the run You can attach to a subset, run till you see trouble and then 'fan out' to look at more processes if necessary. This greatly reduces overhead It also requires a smaller license if you have a TotalView Team license. 8

9 STLView STLView transforms templates into readable and understandable information 9 9

10 Pre-Release: C++View 10

11 Conditional Breakpoint 11 11

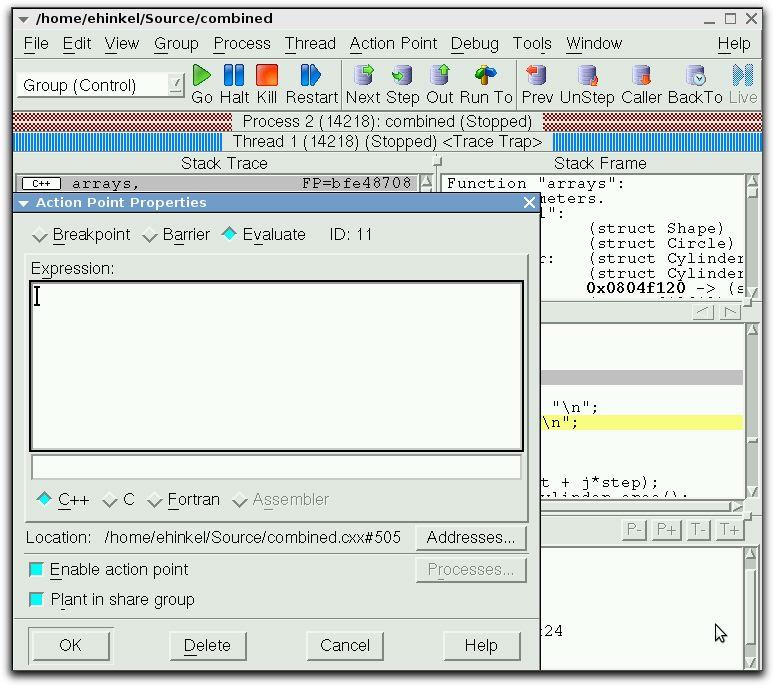
12 Evaluation Breakpoint Test Fixes on the Fly! Test small source code patches Call functions Set variables Test conditions C/C++ or Fortran Can t use C++ constructors Use program variables Can t modify variables or call functions with replay engine 12 12
13 Batch Debugging with TVScript TVScript Defines events Breakpoints, memory errors, etc.. Actions to take in response to these events Print variables or create memory reports Runs a serial or MPI program towards completion With no user interaction More powerful and flexible than Printf-style debugging Use to prepare and guide interactive debugging Use whenever jobs need to be submitted into a managed environment Can be used to automate test/verify environments 13
14 tvscript Example The following tells tvscript to report the contents of the foreign_addr structure each time the program gets to line 85 -create_actionpoint "#85=>print foreign_addr Typical output blocks sample with tvscript:!!!!!!!!!!!!!!!!!!!!!!!!!!!!!!!!!!!!!!!!!!!!!!!!!!!!!!!!!!!!!!!!!!!!!!!!!!!!!!!! Print!! Process:!./server (Debugger Process ID: 1, System ID: 12110)! Thread:! Debugger ID: 1.1, System ID: ! Time Stamp:! :04:09! Triggered from event:! actionpoint! Results:! foreign_addr = {! sin_family = 0x0002 (2)! sin_port = 0x1fb6 (8118)! sin_addr = {! s_addr = 0x6658a8c0 ( )! }! sin_zero = ""! }!!!!!!!!!!!!!!!!!!!!!!!!!!!!!!!!!!!!!!!!!!!!!!!!!!!!!!!!!!!!!!!!!!!!!!!!!!!!!!! 14
15 tvscript tvscript lets you define what events to act on, and what actions to take Typical events Action_point Any_memory_event Guard_corruption error Typical actions Display_backtrace [-level level-num] [num_levels] [options] List_leaks Save_memory Print [-slice {slice_exp] {variable exp} tvscript also supports external script files, utilizing TCL within a CLI file allowing the generation of even more complex actions to events 15

16 What is MemoryScape? Simple to use, intuitive memory debugging 16 What is MemoryScape? Streamlined Lightweight Intuitive Collaborative Memory Debugging Features Shows Memory errors Memory status Memory leaks Buffer overflows MPI memory debugging Remote memory debugging Technical Advantages Low overhead No Instrumentation Interface Inductive Collaboration Multi-process ~

17 Heap Graphical View ~

18 MemoryScape Reporting Allocations and Leaks Filtered HTML Collaboration Text Scripting Heap Memory File Export/Reload Diff-style comparison 18

19 What is ReplayEngine? Enhances debugging experience Add-on to TotalView Captures execution history Record all external input to program Records internal sources of non-determinism Replays execution history Examine any part of the execution history Step as easily back through code as you do forwards Jump to points of interest Simple extension to TotalView No recompilation or instrumentation The user just says where they want to go Explore data and state in the past just like a live process Supported on Linux x86 and x86-64 Supports MPI, Pthreads, and OpenMP 19
20 ReplayEngine Parallel Support MPI ReplayEngine treats MPI communication as input. The history of a single process can be explored without altering the state of any other process. MPI Support Threads MPICH and MPICH 2 OpenMPI and LAM-MPI MVAPICH and MVAPICH2 Intel MPI HP-MPI SGI MPT OpenMP and pthreads are both supported Threads are serialized and once recorded the sequencing of threads is immutable. 20
21 ReplayEngine Recent Enhancements Recording and Replaying high I/O and long running applications The user specifies a buffer size limit for recorded history. ReplayEngine records all events as the program runs till this buffer gets full. Lots of I/O (specifically input) Long running apps If the buffer fills up the oldest history is discarded, more recent history is available for replay. Backwards continue command Breakpoints and watchpoints can be set and enabled at any point Run back to the last time any breakpoint or watchpoint would have triggered Works with expression points and expression watchpoints Support for programs that make use of shared memory This can be through explicit usage of mmap(map_shared) or through the use of libraries that make use of shared memory Certain MPIs use shared memory for low latency MPICH2 nemesis OpenMPI (certain drivers) Intel MPI Support for Cray XT running CLE Requires: TotalView 8.8 or later and TotalView Support

 C or C++ code and the device (GPU) CUDA code.")

22 TotalView debugger for CUDA What is TotalView? Parallel and Multi-threaded Debugging and Analysis Tool For developers, scientists and engineers using C/C++ Makes developing, maintaining and supporting critical and cutting edge applications easier and less risky Debugging CUDA Currently being extended to support CUDA programming on NVIDIA Tesla and Fermi cards Native debugging of both the host (CPU) C or C++ code and the device (GPU) CUDA code. Participate in the Early Experience Program to help influence the product direction Other Major TotalView Features Supports Linux, Unix and Mac OS X Parallel Debugging for Clusters and Many-Core Memory Debugging with MemoryScape Batch Debugging with TVScript and the CLI Advantages Easy to learn graphical user interface with data visualization Wide variety of features so users can tackle unexpected bugs 22
23 GP-GPU Early Experience Program Way for users to participate in the development of TotalView for CUDA Provide input into development efforts Review and help refine usage models How to group threads and provide status data without overwhelming the user How to manage and control device threads How to display data from 10k + threads How to debug accelerated clusters using MPI and CUDA Get early access to pre-release software before it is available to the public NDA program Sign up now Contact :Chris.Gottbrath@totalviewtech.com 23
24 Questions and comments? IMSL, Py-IMSL, PV-WAVE, Source Pro, and TotalView info Free Fully Featured Evaluation Licenses Available on the Web Videos, White Papers, Product Documentation TotalView Early Experience Program : GP-GPU track Sign up at chris.gottbrath@totalviewtech.com 24
ECMWF Workshop on High Performance Computing in Meteorology. 3 rd November Dean Stewart
 ECMWF Workshop on High Performance Computing in Meteorology 3 rd November 2010 Dean Stewart Agenda Company Overview Rogue Wave Product Overview IMSL Fortran TotalView Debugger Acumem ThreadSpotter 1 Copyright
Facing the challenges of. New Approaches To Debugging Complex Codes! Ed Hinkel, Sales Engineer Rogue Wave Software
 Facing the challenges of or New Approaches To Debugging Complex Codes! Ed Hinkel, Sales Engineer Rogue Wave Software Agenda Introduction Rogue Wave! TotalView! Approaching the Debugging Challenge! 1 TVScript
Addressing the Increasing Challenges of Debugging on Accelerated HPC Systems. Ed Hinkel Senior Sales Engineer
 Addressing the Increasing Challenges of Debugging on Accelerated HPC Systems Ed Hinkel Senior Sales Engineer Agenda Overview - Rogue Wave & TotalView GPU Debugging with TotalView Nvdia CUDA Intel Phi 2
Debugging Programs Accelerated with Intel Xeon Phi Coprocessors
 Debugging Programs Accelerated with Intel Xeon Phi Coprocessors A White Paper by Rogue Wave Software. Rogue Wave Software 5500 Flatiron Parkway, Suite 200 Boulder, CO 80301, USA www.roguewave.com Debugging
Debugging and Optimizing Programs Accelerated with Intel Xeon Phi Coprocessors
 Debugging and Optimizing Programs Accelerated with Intel Xeon Phi Coprocessors Chris Gottbrath Rogue Wave Software Boulder, CO Chris.Gottbrath@roguewave.com Abstract Intel Xeon Phi coprocessors present
Scalable Debugging with TotalView on Blue Gene. John DelSignore, CTO TotalView Technologies
 Scalable Debugging with TotalView on Blue Gene John DelSignore, CTO TotalView Technologies Agenda TotalView on Blue Gene A little history Current status Recent TotalView improvements ReplayEngine (reverse
TotalView Training. Developing parallel, data-intensive applications is hard. We make it easier. Copyright 2012 Rogue Wave Software, Inc.
 TotalView Training Developing parallel, data-intensive applications is hard. We make it easier. 1 Agenda Introduction Startup Remote Display Debugging UI Navigation and Process Control Action Points Data
TotalView on IBM PowerLE and CORAL Sierra/Summit
 TotalView on IBM PowerLE and CORAL Sierra/Summit Martin Bakal ScicomP 5/25/2016 Agenda Corporate Overview Coral Milestones TotalView New architecture Demo Questions Company snapshot We are the largest
Parallel Debugging with TotalView BSC-CNS
 Parallel Debugging with TotalView BSC-CNS AGENDA What debugging means? Debugging Tools in the RES Allinea DDT as alternative (RogueWave Software) What is TotalView Compiling Your Program Starting totalview
GPU Technology Conference Three Ways to Debug Parallel CUDA Applications: Interactive, Batch, and Corefile
 GPU Technology Conference 2015 Three Ways to Debug Parallel CUDA Applications: Interactive, Batch, and Corefile Three Ways to Debug Parallel CUDA Applications: Interactive, Batch, and Corefile What do
TotalView Training. Dean Stewart. Rogue Wave Software. Cray XE6 Performance Workshop July 12th, Copyright 2012 Rogue Wave Software, Inc.
 TotalView Training Dean Stewart Rogue Wave Software Cray XE6 Performance Workshop July 12th, 2012 1 Agenda 2 Introduction Startup Remote Display Debugging UI Navigation and Process Control Action Points
DETERMINISTICALLY TROUBLESHOOTING NETWORK DISTRIBUTED APPLICATIONS
 DETERMINISTICALLY TROUBLESHOOTING NETWORK DISTRIBUTED APPLICATIONS Debugging is all about understanding what the software is really doing. Computers are unforgiving readers; they never pay attention to
Allinea Unified Environment
 Allinea Unified Environment Allinea s unified tools for debugging and profiling HPC Codes Beau Paisley Allinea Software bpaisley@allinea.com 720.583.0380 Today s Challenge Q: What is the impact of current
TotalView Release Notes
 Platform Changes The following new platforms are now supported by TotalView: NVIDIA CUDA 5.0 and 5.5 Mac OS X Mavericks (10.9) Ubuntu 12.04, 12.10 and 13.04 Fedora 19 The following platforms are no longer
Welcomes PRACE/LinkSCEEM 2011 Winter School Jacques Philouze Vice President Sales & Marketing
 Welcomes PRACE/LinkSCEEM 2011 Winter School Jacques Philouze jacques@allinea.com Vice President Sales & Marketing Content Company Background Products in more depth Allinea OPT (Optimization and Profiling
Debugging scalable hybrid and accelerated applications on the Cray XC30 and CS300 with TotalView
 Debugging scalable hybrid and accelerated applications on the Cray XC30 and CS300 with TotalView Agenda Introduction Rogue Wave Update OpenLogic Klocwork Totalview Overview NVIDIA and Xeon Phi Memory Debugging
TotalView. Debugging Tool Presentation. Josip Jakić
 TotalView Debugging Tool Presentation Josip Jakić josipjakic@ipb.ac.rs Agenda Introduction Getting started with TotalView Primary windows Basic functions Further functions Debugging parallel programs Topics
Basic Topics. TotalView Source Code Debugger
 Debugging Heterogeneous HPC Applications with Totalview Cray Users Group 2013, Napa, CA TotalView Source Code Debugger Chris Gottbrath, Product Manager May 6 th, 2013 John Hollis 2 Agenda Basic Topics
Debugging with TotalView
 Debugging with TotalView Le Yan HPC Consultant User Services Goals Learn how to start TotalView on Linux clusters Get familiar with TotalView graphic user interface Learn basic debugging functions of TotalView
DDT Debugging Techniques
 DDT Debugging Techniques Carlos Rosales carlos@tacc.utexas.edu Scaling to Petascale 2010 July 7, 2010 Debugging Parallel Programs Usual problems Memory access issues Special cases not accounted for in
TotalView Debugger New Features Guide. version 8.4.0
 TotalView Debugger New Features Guide version 8.4.0 Copyright 2007, 2008 by TotalView Technologies. All rights reserved Copyright 1998 2007 by Etnus LLC. All rights reserved. Copyright 1996 1998 by Dolphin
GPU Debugging Made Easy. David Lecomber CTO, Allinea Software
 GPU Debugging Made Easy David Lecomber CTO, Allinea Software david@allinea.com Allinea Software HPC development tools company Leading in HPC software tools market Wide customer base Blue-chip engineering,
Introduction to debugging. Martin Čuma Center for High Performance Computing University of Utah
 Introduction to debugging Martin Čuma Center for High Performance Computing University of Utah m.cuma@utah.edu Overview Program errors Simple debugging Graphical debugging DDT and Totalview Intel tools
TotalView Release Notes
 These release notes contain a summary of new features and enhancements, late-breaking product issues, migration from earlier releases, and bug fixes. PLEASE NOTE: The version of this document in the product
NightStar. NightView Source Level Debugger. Real-Time Linux Debugging and Analysis Tools BROCHURE
 NightStar Real-Time Linux Debugging and Analysis Tools Concurrent s NightStar is a powerful, integrated tool set for debugging and analyzing time-critical Linux applications. NightStar tools run with minimal
TotalView Users Guide. version 8.8
 TotalView Users Guide version 8.8 Copyright 2007 2010 by TotalView Technologies. All rights reserved Copyright 1998 2007 by Etnus LLC. All rights reserved. Copyright 1996 1998 by Dolphin Interconnect Solutions,
TotalView Release Notes
 These release notes contain a summary of new features and enhancements, late-breaking product issues, migration from earlier releases, and bug fixes. PLEASE NOTE: The version of this document in the product
Guillimin HPC Users Meeting July 14, 2016
 Guillimin HPC Users Meeting July 14, 2016 guillimin@calculquebec.ca McGill University / Calcul Québec / Compute Canada Montréal, QC Canada Outline Compute Canada News System Status Software Updates Training
Debugging Intel Xeon Phi KNC Tutorial
 Debugging Intel Xeon Phi KNC Tutorial Last revised on: 10/7/16 07:37 Overview: The Intel Xeon Phi Coprocessor 2 Debug Library Requirements 2 Debugging Host-Side Applications that Use the Intel Offload
Moab Workload Manager on Cray XT3
 Moab Workload Manager on Cray XT3 presented by Don Maxwell (ORNL) Michael Jackson (Cluster Resources, Inc.) MOAB Workload Manager on Cray XT3 Why MOAB? Requirements Features Support/Futures 2 Why Moab?
DDT: A visual, parallel debugger on Ra
 DDT: A visual, parallel debugger on Ra David M. Larue dlarue@mines.edu High Performance & Research Computing Campus Computing, Communications, and Information Technologies Colorado School of Mines March,
Debugging HPC Applications. David Lecomber CTO, Allinea Software
 Debugging HPC Applications David Lecomber CTO, Allinea Software david@allinea.com Agenda Bugs and Debugging Debugging parallel applications Debugging OpenACC and other hybrid codes Debugging for Petascale
TotalView Release Notes
 These release notes contain a summary of new features and enhancements, late-breaking product issues, migration from earlier releases, and bug fixes. PLEASE NOTE: The version of this document in the product
Debugging at Scale Lindon Locks
 Debugging at Scale Lindon Locks llocks@allinea.com Debugging at Scale At scale debugging - from 100 cores to 250,000 Problems faced by developers on real systems Alternative approaches to debugging and
TotalView 2018 Release Notes
 These release notes contain a summary of new features and enhancements, late-breaking product issues, migration from earlier releases, and bug fixes. PLEASE NOTE: The version of this document in the product
Eliminate Threading Errors to Improve Program Stability
 Introduction This guide will illustrate how the thread checking capabilities in Intel Parallel Studio XE can be used to find crucial threading defects early in the development cycle. It provides detailed
STARTING THE DDT DEBUGGER ON MIO, AUN, & MC2. (Mouse over to the left to see thumbnails of all of the slides)
") STARTING THE DDT DEBUGGER ON MIO, AUN, & MC2 (Mouse over to the left to see thumbnails of all of the slides) ALLINEA DDT Allinea DDT is a powerful, easy-to-use graphical debugger capable of debugging a
STARTING THE DDT DEBUGGER ON MIO, AUN, & MC2 (Mouse over to the left to see thumbnails of all of the slides) ALLINEA DDT Allinea DDT is a powerful, easy-to-use graphical debugger capable of debugging a
TotalView. Users Guide. August 2001 Version 5.0
 TotalView Users Guide August 2001 Version 5.0 Copyright 1999 2001 by Etnus LLC. All rights reserved. Copyright 1998 1999 by Etnus Inc. All rights reserved. Copyright 1996 1998 by Dolphin Interconnect Solutions,
Debugging with Totalview. Martin Čuma Center for High Performance Computing University of Utah
 Debugging with Totalview Martin Čuma Center for High Performance Computing University of Utah mcuma@chpc.utah.edu Overview Totalview introduction. Basic operation. Serial debugging. Parallel debugging.
Understanding Dynamic Parallelism
 Understanding Dynamic Parallelism Know your code and know yourself Presenter: Mark O Connor, VP Product Management Agenda Introduction and Background Fixing a Dynamic Parallelism Bug Understanding Dynamic
Intel Parallel Studio XE 2015
 2015 Create faster code faster with this comprehensive parallel software development suite. Faster code: Boost applications performance that scales on today s and next-gen processors Create code faster:
Debugging with GDB and DDT
 Debugging with GDB and DDT Ramses van Zon SciNet HPC Consortium University of Toronto June 28, 2012 1/41 Ontario HPC Summerschool 2012 Central Edition: Toronto Outline Debugging Basics Debugging with the
Debugging on Intel Platforms
 White Paper Robert Mueller-Albrecht Developer Products Division Intel Corporation Debugging on Intel Platforms Introduction...3 Overview...3 Servers and Workstations...4 Support for Linux*, Mac OS X*,
Debugging CUDA Applications with Allinea DDT. Ian Lumb Sr. Systems Engineer, Allinea Software Inc.
 Debugging CUDA Applications with Allinea DDT Ian Lumb Sr. Systems Engineer, Allinea Software Inc. ilumb@allinea.com GTC 2013, San Jose, March 20, 2013 Embracing GPUs GPUs a rival to traditional processors
Copyright Khronos Group, Page Graphic Remedy. All Rights Reserved
 Avi Shapira Graphic Remedy Copyright Khronos Group, 2009 - Page 1 2004 2009 Graphic Remedy. All Rights Reserved Debugging and profiling 3D applications are both hard and time consuming tasks Companies
Eliminate Threading Errors to Improve Program Stability
 Eliminate Threading Errors to Improve Program Stability This guide will illustrate how the thread checking capabilities in Parallel Studio can be used to find crucial threading defects early in the development
An Introduction to the SPEC High Performance Group and their Benchmark Suites
 An Introduction to the SPEC High Performance Group and their Benchmark Suites Robert Henschel Manager, Scientific Applications and Performance Tuning Secretary, SPEC High Performance Group Research Technologies
Debugging for the hybrid-multicore age (A HPC Perspective) David Lecomber CTO, Allinea Software
 David Lecomber CTO, Allinea Software") Debugging for the hybrid-multicore age (A HPC Perspective) David Lecomber CTO, Allinea Software david@allinea.com Agenda What is HPC? How is scale affecting HPC? Achieving tool scalability Scale in practice
Debugging for the hybrid-multicore age (A HPC Perspective) David Lecomber CTO, Allinea Software david@allinea.com Agenda What is HPC? How is scale affecting HPC? Achieving tool scalability Scale in practice
Developing, Debugging, and Optimizing GPU Codes for High Performance Computing with Allinea Forge
 Developing, Debugging, and Optimizing GPU Codes for High Performance Computing with Allinea Forge Ryan Hulguin Applications Engineer ryan.hulguin@arm.com Agenda Introduction Overview of Allinea Products
Memory & Thread Debugger
 Memory & Thread Debugger Here is What Will Be Covered Overview Memory/Thread analysis New Features Deep dive into debugger integrations Demo Call to action Intel Confidential 2 Analysis Tools for Diagnosis
Using Intel VTune Amplifier XE and Inspector XE in.net environment
 Using Intel VTune Amplifier XE and Inspector XE in.net environment Levent Akyil Technical Computing, Analyzers and Runtime Software and Services group 1 Refresher - Intel VTune Amplifier XE Intel Inspector
Welcome. HRSK Practical on Debugging, Zellescher Weg 12 Willers-Bau A106 Tel
 Center for Information Services and High Performance Computing (ZIH) Welcome HRSK Practical on Debugging, 03.04.2009 Zellescher Weg 12 Willers-Bau A106 Tel. +49 351-463 - 31945 Matthias Lieber (matthias.lieber@tu-dresden.de)
Jackson Marusarz Software Technical Consulting Engineer
 Jackson Marusarz Software Technical Consulting Engineer What Will Be Covered Overview Memory/Thread analysis New Features Deep dive into debugger integrations Demo Call to action 2 Analysis Tools for Diagnosis
Eliminate Memory Errors to Improve Program Stability
 Introduction INTEL PARALLEL STUDIO XE EVALUATION GUIDE This guide will illustrate how Intel Parallel Studio XE memory checking capabilities can find crucial memory defects early in the development cycle.
Allinea DDT Debugger. Dan Mazur, McGill HPC March 5,
 Allinea DDT Debugger Dan Mazur, McGill HPC daniel.mazur@mcgill.ca guillimin@calculquebec.ca March 5, 2015 1 Outline Introduction and motivation Guillimin login and DDT configuration Compiling for a debugger
Hands-on Workshop on How To Debug Codes at the Institute
 Hands-on Workshop on How To Debug Codes at the Institute H. Birali Runesha, Shuxia Zhang and Ben Lynch (612) 626 0802 (help) help@msi.umn.edu October 13, 2005 Outline Debuggers at the Institute Totalview
This guide will show you how to use Intel Inspector XE to identify and fix resource leak errors in your programs before they start causing problems.
 Introduction A resource leak refers to a type of resource consumption in which the program cannot release resources it has acquired. Typically the result of a bug, common resource issues, such as memory
Performance Tools for Technical Computing
 Christian Terboven terboven@rz.rwth-aachen.de Center for Computing and Communication RWTH Aachen University Intel Software Conference 2010 April 13th, Barcelona, Spain Agenda o Motivation and Methodology
Implementation of Parallelization
 Implementation of Parallelization OpenMP, PThreads and MPI Jascha Schewtschenko Institute of Cosmology and Gravitation, University of Portsmouth May 9, 2018 JAS (ICG, Portsmouth) Implementation of Parallelization
DEBUGGING ON FERMI PREPARING A DEBUGGABLE APPLICATION GDB. GDB on front-end nodes
 DEBUGGING ON FERMI Debugging your application on a system based on a BG/Q architecture like FERMI could be an hard task due to the following problems: the core files generated by a crashing job on FERMI
Bright Cluster Manager Advanced HPC cluster management made easy. Martijn de Vries CTO Bright Computing
 Bright Cluster Manager Advanced HPC cluster management made easy Martijn de Vries CTO Bright Computing About Bright Computing Bright Computing 1. Develops and supports Bright Cluster Manager for HPC systems
IBM High Performance Computing Toolkit
 IBM High Performance Computing Toolkit Pidad D'Souza (pidsouza@in.ibm.com) IBM, India Software Labs Top 500 : Application areas (November 2011) Systems Performance Source : http://www.top500.org/charts/list/34/apparea
The Cray Programming Environment. An Introduction
 The Cray Programming Environment An Introduction Vision Cray systems are designed to be High Productivity as well as High Performance Computers The Cray Programming Environment (PE) provides a simple consistent
Parallel Programming Libraries and implementations
 Parallel Programming Libraries and implementations Partners Funding Reusing this material This work is licensed under a Creative Commons Attribution- NonCommercial-ShareAlike 4.0 International License.
HPC Middle East. KFUPM HPC Workshop April Mohamed Mekias HPC Solutions Consultant. Agenda
 KFUPM HPC Workshop April 29-30 2015 Mohamed Mekias HPC Solutions Consultant Agenda 1 Agenda-Day 1 HPC Overview What is a cluster? Shared v.s. Distributed Parallel v.s. Massively Parallel Interconnects
Introduction to Parallel Programming. Martin Čuma Center for High Performance Computing University of Utah
 Introduction to Parallel Programming Martin Čuma Center for High Performance Computing University of Utah mcuma@chpc.utah.edu Overview Types of parallel computers. Parallel programming options. How to
Trends and Challenges in Multicore Programming
 Trends and Challenges in Multicore Programming Eva Burrows Bergen Language Design Laboratory (BLDL) Department of Informatics, University of Bergen Bergen, March 17, 2010 Outline The Roadmap of Multicores
RWTH GPU-Cluster. Sandra Wienke March Rechen- und Kommunikationszentrum (RZ) Fotos: Christian Iwainsky
 Fotos: Christian Iwainsky") RWTH GPU-Cluster Fotos: Christian Iwainsky Sandra Wienke wienke@rz.rwth-aachen.de March 2012 Rechen- und Kommunikationszentrum (RZ) The GPU-Cluster GPU-Cluster: 57 Nvidia Quadro 6000 (29 nodes) innovative
RWTH GPU-Cluster Fotos: Christian Iwainsky Sandra Wienke wienke@rz.rwth-aachen.de March 2012 Rechen- und Kommunikationszentrum (RZ) The GPU-Cluster GPU-Cluster: 57 Nvidia Quadro 6000 (29 nodes) innovative
MPI + X programming. UTK resources: Rho Cluster with GPGPU George Bosilca CS462
 MPI + X programming UTK resources: Rho Cluster with GPGPU https://newton.utk.edu/doc/documentation/systems/rhocluster George Bosilca CS462 MPI Each programming paradigm only covers a particular spectrum
Cray RS Programming Environment
 Cray RS Programming Environment Gail Alverson Cray Inc. Cray Proprietary Red Storm Red Storm is a supercomputer system leveraging over 10,000 AMD Opteron processors connected by an innovative high speed,
Eliminate Memory Errors to Improve Program Stability
 Eliminate Memory Errors to Improve Program Stability This guide will illustrate how Parallel Studio memory checking capabilities can find crucial memory defects early in the development cycle. It provides
The GPU-Cluster. Sandra Wienke Rechen- und Kommunikationszentrum (RZ) Fotos: Christian Iwainsky
 Fotos: Christian Iwainsky") The GPU-Cluster Sandra Wienke wienke@rz.rwth-aachen.de Fotos: Christian Iwainsky Rechen- und Kommunikationszentrum (RZ) The GPU-Cluster GPU-Cluster: 57 Nvidia Quadro 6000 (29 nodes) innovative computer
The GPU-Cluster Sandra Wienke wienke@rz.rwth-aachen.de Fotos: Christian Iwainsky Rechen- und Kommunikationszentrum (RZ) The GPU-Cluster GPU-Cluster: 57 Nvidia Quadro 6000 (29 nodes) innovative computer
Le Yan Louisiana Optical Network Initiative. 8/3/2009 Scaling to Petascale Virtual Summer School
 Parallel Debugging Techniques Le Yan Louisiana Optical Network Initiative 8/3/2009 Scaling to Petascale Virtual Summer School Outline Overview of parallel debugging Challenges Tools Strategies Gtf Get
Debugging with GDB and DDT
 Debugging with GDB and DDT Ramses van Zon SciNet HPC Consortium University of Toronto June 13, 2014 1/41 Ontario HPC Summerschool 2014 Central Edition: Toronto Outline Debugging Basics Debugging with the
Introduction to Parallel Programming. Martin Čuma Center for High Performance Computing University of Utah
 Introduction to Parallel Programming Martin Čuma Center for High Performance Computing University of Utah mcuma@chpc.utah.edu Overview Types of parallel computers. Parallel programming options. How to
Parallel Programming. Libraries and Implementations
 Parallel Programming Libraries and Implementations Reusing this material This work is licensed under a Creative Commons Attribution- NonCommercial-ShareAlike 4.0 International License. http://creativecommons.org/licenses/by-nc-sa/4.0/deed.en_us
Chapter 4: Threads. Chapter 4: Threads
 Chapter 4: Threads Silberschatz, Galvin and Gagne 2013 Chapter 4: Threads Overview Multicore Programming Multithreading Models Thread Libraries Implicit Threading Threading Issues Operating System Examples
PROGRAMMING MODEL EXAMPLES
 ( Cray Inc 2015) PROGRAMMING MODEL EXAMPLES DEMONSTRATION EXAMPLES OF VARIOUS PROGRAMMING MODELS OVERVIEW Building an application to use multiple processors (cores, cpus, nodes) can be done in various
TotalView. User Guide. June 2004 Version 6.5
 TotalView User Guide June 2004 Version 6.5 Copyright 1999 2004 by Etnus LLC. All rights reserved. Copyright 1998 1999 by Etnus, Inc. Copyright 1996 1998 by Dolphin Interconnect Solutions, Inc. Copyright
Batch environment PBS (Running applications on the Cray XC30) 1/18/2016
 1/18/2016") Batch environment PBS (Running applications on the Cray XC30) 1/18/2016 1 Running on compute nodes By default, users do not log in and run applications on the compute nodes directly. Instead they launch
Batch environment PBS (Running applications on the Cray XC30) 1/18/2016 1 Running on compute nodes By default, users do not log in and run applications on the compute nodes directly. Instead they launch
Debugging with TotalView
 Debugging with TotalView Dieter an Mey Center for Computing and Communication Aachen University of Technology anmey@rz.rwth-aachen.de 1 TotalView, Dieter an Mey, SunHPC 2006 Debugging on Sun dbx line mode
AutoTune Workshop. Michael Gerndt Technische Universität München
 AutoTune Workshop Michael Gerndt Technische Universität München AutoTune Project Automatic Online Tuning of HPC Applications High PERFORMANCE Computing HPC application developers Compute centers: Energy
Productive Performance on the Cray XK System Using OpenACC Compilers and Tools
 Productive Performance on the Cray XK System Using OpenACC Compilers and Tools Luiz DeRose Sr. Principal Engineer Programming Environments Director Cray Inc. 1 The New Generation of Supercomputers Hybrid
HPCC - Hrothgar. Getting Started User Guide TotalView. High Performance Computing Center Texas Tech University
 HPCC - Hrothgar Getting Started User Guide TotalView High Performance Computing Center Texas Tech University HPCC - Hrothgar 2 Table of Contents *This user guide is under development... 3 1. Introduction...
Outline. Threads. Single and Multithreaded Processes. Benefits of Threads. Eike Ritter 1. Modified: October 16, 2012
 Eike Ritter 1 Modified: October 16, 2012 Lecture 8: Operating Systems with C/C++ School of Computer Science, University of Birmingham, UK 1 Based on material by Matt Smart and Nick Blundell Outline 1 Concurrent
OPERATING SYSTEM. Chapter 4: Threads
 OPERATING SYSTEM Chapter 4: Threads Chapter 4: Threads Overview Multicore Programming Multithreading Models Thread Libraries Implicit Threading Threading Issues Operating System Examples Objectives To
Analyzing the Performance of IWAVE on a Cluster using HPCToolkit
 Analyzing the Performance of IWAVE on a Cluster using HPCToolkit John Mellor-Crummey and Laksono Adhianto Department of Computer Science Rice University {johnmc,laksono}@rice.edu TRIP Meeting March 30,
Writing MPI Programs for Odyssey. Teresa Kaltz, PhD Research Computing
 Writing MPI Programs for Odyssey Teresa Kaltz, PhD Research Computing 1 FAS IT Research Computing Provide compute resources to FAS and SEAS for research purposes Leverage FAS IT infrastructure Architect
Oracle Developer Studio Performance Analyzer
 Oracle Developer Studio Performance Analyzer The Oracle Developer Studio Performance Analyzer provides unparalleled insight into the behavior of your application, allowing you to identify bottlenecks and
Accelerate HPC Development with Allinea Performance Tools
 Accelerate HPC Development with Allinea Performance Tools 19 April 2016 VI-HPS, LRZ Florent Lebeau / Ryan Hulguin flebeau@allinea.com / rhulguin@allinea.com Agenda 09:00 09:15 Introduction 09:15 09:45
Parallel Programming and Debugging with CUDA C. Geoff Gerfin Sr. System Software Engineer
 Parallel Programming and Debugging with CUDA C Geoff Gerfin Sr. System Software Engineer CUDA - NVIDIA s Architecture for GPU Computing Broad Adoption Over 250M installed CUDA-enabled GPUs GPU Computing
Evolving HPCToolkit John Mellor-Crummey Department of Computer Science Rice University Scalable Tools Workshop 7 August 2017
 Evolving HPCToolkit John Mellor-Crummey Department of Computer Science Rice University http://hpctoolkit.org Scalable Tools Workshop 7 August 2017 HPCToolkit 1 HPCToolkit Workflow source code compile &
Chapter 4: Threads. Chapter 4: Threads. Overview Multicore Programming Multithreading Models Thread Libraries Implicit Threading Threading Issues
 Chapter 4: Threads Silberschatz, Galvin and Gagne 2013 Chapter 4: Threads Overview Multicore Programming Multithreading Models Thread Libraries Implicit Threading Threading Issues 4.2 Silberschatz, Galvin
6.1 Multiprocessor Computing Environment
 6 Parallel Computing 6.1 Multiprocessor Computing Environment The high-performance computing environment used in this book for optimization of very large building structures is the Origin 2000 multiprocessor,
TotalView. User Guide. September 2003 Version 6.3
 TotalView User Guide September 2003 Version 6.3 Copyright 1999 2003 by Etnus LLC. All rights reserved. Copyright 1998 1999 by Etnus, Inc. Copyright 1996 1998 by Dolphin Interconnect Solutions, Inc. Copyright
Copyright Khronos Group Page 1. Vulkan Overview. June 2015
 Copyright Khronos Group 2015 - Page 1 Vulkan Overview June 2015 Copyright Khronos Group 2015 - Page 2 Khronos Connects Software to Silicon Open Consortium creating OPEN STANDARD APIs for hardware acceleration
Tools and Methodology for Ensuring HPC Programs Correctness and Performance. Beau Paisley
 Tools and Methodology for Ensuring HPC Programs Correctness and Performance Beau Paisley bpaisley@allinea.com About Allinea Over 15 years of business focused on parallel programming development tools Strong
PROGRAMOVÁNÍ V C++ CVIČENÍ. Michal Brabec
 PROGRAMOVÁNÍ V C++ CVIČENÍ Michal Brabec PARALLELISM CATEGORIES CPU? SSE Multiprocessor SIMT - GPU 2 / 17 PARALLELISM V C++ Weak support in the language itself, powerful libraries Many different parallelization
Our new HPC-Cluster An overview
 Our new HPC-Cluster An overview Christian Hagen Universität Regensburg Regensburg, 15.05.2009 Outline 1 Layout 2 Hardware 3 Software 4 Getting an account 5 Compiling 6 Queueing system 7 Parallelization
Running applications on the Cray XC30
 Running applications on the Cray XC30 Running on compute nodes By default, users do not access compute nodes directly. Instead they launch jobs on compute nodes using one of three available modes: 1. Extreme