Continuous Monitoring Data in AWQMS. A Comprehensive Review as of 8/20/2018
|
|
|
- Kelly Carter
- 5 years ago
- Views:
Transcription


1 Continuous Monitoring Data in AWQMS A Comprehensive Review as of 8/20/2018 The newer versions of AWQMS have significant enhancements both in terms of data storage and user interface; and there are more enhancements for continuous data coming in the next version of AWQMS. 1. Improved equipment meta-data tracking and added the concept of equipment limits and deployments in relation to continuous results. Equipment is under the metadata menu in AWQMS. Figure 1 My organization's continuous monitoring equipment list. Figure 2 Opening up the detection limits list for a piece of continuous monitoring equipment Figure 3 The detection limits list for a piece of continuous monitoring equipment


2 Figure 4 Opening the deployments list for a piece of continuous monitoring equipment Figure 5 The deployments list for a piece of continous monitoring equipment 2. Redesigned data structures and business objects to separate storage of continuous results from discrete results in the AWQMS database. This was critical for both data storage optimization and application speed reasons. a. Included a new, much more efficient import capability for continuous results. Figure 6 Navigating to the new import mechanism for continuous monitoring data
3 b. Example File and Import Configuration Figure 7 Example of continuous data for DO and Water Temperature (has ~4,300 results over approximately a month and a half period)

4 Figure 8 A continuous monitoring data import configuration Figure 9 Navigating to the new import mechanism for continuous monitoring data


5 Figure 10 Getting ready to import the file of continuous monitoring data Figure 11 Importing the continuous monitoring data


6 Figure 12 Import successful with no errors; migrating the data. Figure 13 Dataset migrated into the AWQMS database successfully with no errors. 3. Enhanced the "only send summary statistics for continuous data to WQX" option to provide more flexibility; a. Included addition of a new outbound web service specifically for getting AWQMS continuous monitoring data)


7


8 4. Made major revisions to the graphs, Google Maps, exports and some reports in the AWQMS data analysis tools to improve their usefulness with continuous data. Example: Single Parameter Line Graph Figure 14 Navigating to the Data Analysis Tools Figure 15 Selecting the Single Parameter Line Graph


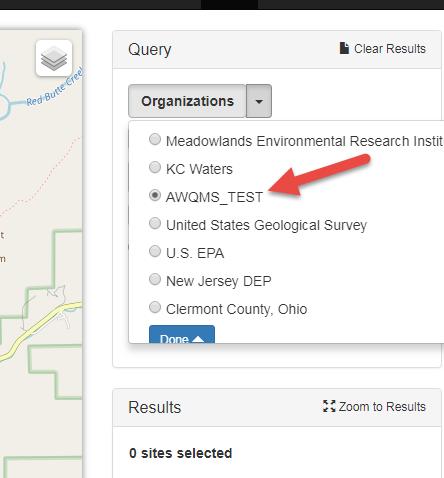
9 Figure 16 Choosing the default search criteria for running the Single Parameter Line Graph Figure 17 Determining the dataset to analyze - Step 1: Decide which locations


10 Figure 18 Determining the dataset to analyze - select and accept the locations Figure 19 Navigating to step 2: Other Search Criteria Figure 20 Narrowing in on the desired data set for analysis


11 Figure 21 Step 3: What parameters do I have data for at that location within that time frame? Figure 22 Step 3: Choose the Parameter of Interest, select applicable criteria, generate the graph Figure 23 Graph of the continuous monitoring Water Temperature (degrees F) results
12 Figure 24 Changing the color scheme
13 Figure 25 Changing the header text

14 Figure 26 Changing the header text (continued)
15 Figure 27 You can save the image as a PDF or Other file format; and export the data to Excel


16 Figure 28 Displaying the AWQMS Graphs Help Figure 29 Displaying the AWQMS Graphs Help pop-up (continued)

17 Figure 30 Hover you mouse over a point to view additional information Figure 31 Hover your mouse over a series name in the legend to highlight the series on the graph
18 Figure 32 Click on a series name in the legend to hide/show the series in the graph (currently, Zirconia10 location is hidden) Figure 33 Scrolling the mouse wheel forward zooms in on the graph

19 Figure 34 While zoomed in you can click and drag to reposition your view of the graph Figure 35 Scrolling the mouse wheel backward zooms out on the graph
20 Figure 36 Hold down the Shift key and then click and drag with your mouse to zoom to a specific area Example: Same data with multi-parameter line graph (Single Monitoring Location)

21 Figure 37 Zoomed in on a specific area of the graph Figure 38 Navigating back to the Data Analysis Tools Page

22 Figure 39 Navigating to the Multi-Parameter Line Graph Page


23 Figure 40 Select the "Latest Search Criteria" to run this graph for the same dataset Figure 41 Adding Dissolved Oxygen to the graph and navigating to the Options tab


24 Figure 42 Adding a second scale and creating the graph Figure 43 Changed the color scheme and the header

25 Figure 44 Turning on the data grid capability

26 Figure 45 Selecting a point in a series and then viewing the surrounding data Example 3 Box and Whisker Plot


27 Figure 46 Navigating to the Box and Whiskers Plot in the Data Analysis Tools page Figure 47 Selecting "Latest Search Criteria" to run the analysis on the same data set


28 Figure 48 Selecting the parameter to graph and navigating to the Options tab Figure 49 Generating one box plot per month
.")
29 Figure 50 The monthly box plot for Water Temperature (F) (Mouse hovered over the May, 2017 series) 5. Easy Batch Delete of Continuous Data (so you can re-import it without duplicates). Figure 51 Navigating to the Continuous Results Batch Deletion page


30 Figure 52 Deleting a batch of continuous monitoring data for a given date range and monitoring location Figure 53 Deleting our continuous result data set
.")
31 Figure 54 The continuous data was successfully deleted We are also currently working on: 1. An enhancement to allow for improved integrated review and QC of continuous data during the import process (or even after the fact). The plan is to include an ability to adjust values for drift and capture rationale behind the adjustment. See Appendix A for more information about what is envisioned. 2. AWQMS Sensor Observation (web) Services (SOS) to allow integration of AWQMS as a "Data Appliance" in the EPA Interoperable Watersheds Network (IWN), if desired. We are mostly done with these but are debugging them. We are awaiting some troubleshooting assistance from EPA personnel. See Appendix B for more information.
32 Appendix A AWQMS Integration with EPA s Interoperable Watersheds Network (IWN) AWQMS-Cloud environment will be registered in the EPA central catalog and sensor discovery tool. AWQMS will implement web services and become a Data Appliance


33

34

35
36 Appendix B An Improved Process for Continuous Monitoring Data An Improved Process for Continuous Monitoring Data AWQMS users can currently bring continuous data into the system in at least two ways: manually triggered batch file imports of continuous sample data automatic batch file imports of continuous sample data retrieved periodically from a logger over the Internet (in the case of Bishop Paiute). Manually Triggered Batch Import Allowed values for Result Status are: Rejected Reported result has not been accepted Not released to public Preliminary Internal use only Not released to public Unreviewed Reported result has not been reviewed Is available to the public Provisional Reported result has not been verified, not undergone all Is available to the public QC procedures. Validated Reported result has been verified and reviewed Is available to the public Accepted Reported result has been accepted Is available to the public Final Publishable, released to public Is available to the public Unreviewed was added specifically as a way to be able to have continuous data be both preliminary but also publicly visible. The assumption is that, for CMD batch-imported data, the result status is currently brought into the system as either Preliminary or Unreviewed and would eventually be changed to some other result status such as Final by either reviewing/updating the result values one by one (which is never going to happen) or by reimporting a modified copy of the original dataset. There are obvious flaws and inefficiencies with this approach that we ll handle below. Data is currently sanity checked as it is imported into the system. First, the parameter for each result value imported into the system is compared against the user-specified Expected Parameter list in the organization s QC Thresholds list. Note that, in AWQMS, a parameter is more than just the characteristic name; it s the combination of the characteristic name, method speciation, sample fraction, and measurement unit. If an unexpected parameter (e.g. degrees F when we expect degrees C) is imported into the system a warning is generated that the user can review during the import process. Although a warning is generated, the data point is still allowed into the system. Next, the result values are checked as to whether they exceed user-provided minimum and/or maximum reasonable values for the given parameter (QC Threshold(s)). For each exceedance, a warning is generated. What other sanity/quality checks could/should the system be able to perform? Dramatic swing from last N data points? (Maybe in the future need to re-watch the Aq. video) Would there be any point in providing notifications for errors/warnings during a manually triggered batch file import? (Probably not, as they can see the errors in the data set summary page). For either type of sanity check, the system can be configured to error; rather than warn. In the case of errors, the data point would only be allowed into the system if it's corrected to be within tolerances; or if the status is changed to 'Rejected'. Do they want to change their settings to error, rather than only to warn? Not at this time

37 There is a user preference available to allow automatic migration of imported data that has no errors or warnings. However, that isn t quite what is needed. Ideally, the system would automatically migrate all of the values into the system and then: set the status of the values that passed both sanity checks as Provisional (or maybe there could be a perparameter preference in the QC thresholds page [E.g. ph the last thing we want to show the public is that our ph meter is reading 15]); Ask: couldn t this be handled by setting the QC threshold tighter? (as opposed to a parameter by parameter )? set the status of any values that didn t pass either or both sanity checks as Preliminary (or maybe there could be a preference); flag the values that didn t pass either or both sanity checks with warnings for whichever checks they didn t pass. Ideally, the user would be able to see that they have errors/warnings through multiple convenient methods: During the import / migrate process; similarly to how the user can immediately resolve domain value or other such errors. After the fact. For example, they kick off the import/migrate and then shut down their computer and leave on vacation for a week. I could envision the user either going back to the dataset summary page for the specific import/migrate or going to a new My Notifications page to see what is on their hot list. This last part might come in later as part of integrating in the auto-polling. Also, the envisioned My Notifications page. Maybe that is the same thing as a filtered version of the existing Event Log; but it would have links to the migrated data. The user could review the data for a parameter at a site over a date range and be able to easily see from the resulting data grid which values are still flagged as needing review.
: They should be able to compare the")
38 Regardless of how the user navigates to a given error or warning notification, the user would be able to see the details of the data point and which specific sanity checks the value didn t pass. Additionally, the user would be able to see the data point in context of the surrounding data points for the same parameter (on a graph and in a grid of data): They should be able to compare the parameter series against another co-sampled parameter (so they can see if other parameters are also off, or maybe if, say, the temperature affected the DO). Ideally, be able to plot a best fit trend line for the primary series. Future vision thing

39
.")
40 The user would be able to perform the following actions on the data point. Unflag it as needing attention Change the result status (e.g. Rejected) Provide a review comment. A comment would only be needed if they are changing the status to Rejected or Preliminary. Provide or calculate an adjusted value (e.g. to account for drift). [Ryan, consider a status history child table with a comment field]
 are already captured. However, it doesn t currently capture who changed what when. Is that needed?")
41 Ideally, the user would be able to perform those actions on multiple user-selected data points at a time; so they don t have to do the same thing point by point. Created by and last changed by (and date) are already captured. However, it doesn t currently capture who changed what when. Is that needed? Automatically Retrieved and Imported Periodic Logger Files (Only one pilot tribe in R 9 thus far) The result status is currently brought into the system as Unreviewed. Currently, if an unexpected parameter (any) error occurs, the value is not migrated into AWQMS but the value is included in a rejection file that can be reviewed, fixed, and reimported manually later. If a QC exceedance occurs, the data point is migrated into the AWQMS database with a status of Unreviewed and an notification is sent out to up to 3 recipients. Ideally, the values that exceed the QC threshold(s) for their parameters would be flagged as Needs Review and could be found and handled either through a My Notifications hot list, or through reviewing the data for a given site/parameter as described above. (and set the status to whatever the org decides in their preferences (e.g.
42 preliminary ). They say this is sometimes a parameter by parameter decision. Might need to be in the QC thresholds list. - What about missing data? (Currently no way to handle within the system). This is not an issue for this discussion. Not something they say they ever do. Adjustment of Continuous Data Based on Pre/Post Calibration Value Differences (Drift Correction) One tribe says they re-calibrate their dedicated continuous probes every 4 to 6 weeks. They take a pre-cleaning reading, they then do a field cleaning of the dedicated field sensor/probes. They then take a near-simultaneous reading with both a clean, calibrated probe/sensor and the dedicated, field-cleaned probe/sensor. That determines the amount of bio-fouling drift since last calibration. Then they bring both sondes w/sensors back to the lab and they calibrate the dedicated sensors. Difference between the initial reading and the second reading is the bio-fouling drift. Time Drift Since Last Calibration = Difference between the standard solution value and the actual reading in the solution at the lab (prior to pushing the calibrate button). Cumulative Drift = Time Drift since last calibration + Bio-Fouling Drift. One tribe says they currently don t load their calibration data into AWQMS. Ideally, they could load/enter their data into AWQMS and then AWQMS would automatically calculate and apply the needed drift correction. This might necessitate changes to allow for tagging of discrete values as calibration data (maybe using activity type.) There might be a need to be able log calibration events and then the associated readings. At a minimum, though, they need to be able to enter drift corrections from calibration point to calibration point. - Are there other types of drift we should be thinking about? E.g a comparison of voltage reading VS what we know the reading should be I think that was in the Aquarius video. Right now this is the only type of drift we are thinking about.
43
User Guide for Explorer Users
 User Guide for Explorer Users Version 2015.1 Hubble Suite (Edition 2) Document Information....................................................... 1 Notices.........................................................................
User s Guide: BIOS Online Mapping Tool to access the California Freshwater Species Database
 User s Guide: BIOS Online Mapping Tool to access the California Freshwater Species Database Last updated: December 2017 Tutorial created by: The Nature Conservancy Topics covered Part 1: Exporting a tabular
Space Management_. Tips and Tricks_ UniSA All Staff
 Space Management_ Tips and Tricks_ UniSA All Staff Contents Click to go to that location in the document: Favourite views... 3 Quick find Room on plan... 4 Quick link to Room record... 5 View plan details
How to use the SATURN Observation Network: Endurance Stations Site: Table of Contents
 How to use the SATURN Observation Network: Endurance Stations Site: Table of Contents Preface... 2 Introduction to the SATURN Interface... 3 Fixed station user interface... 5 The Recent Tab... 6 Reading
RITIS Training Module 4 Script
 RITIS Training Module 4 Script Welcome to the Regional Integrated Information System or RITIS Module 04 CBT. To begin, select the start button or press Shift+N on your keyboard. This training module will
Getting Started. Ohm Portal. v2_ec01b38. Buddy Platform, Limited Ltd.
 Getting Started Ohm Portal v2_ec01b38 Buddy Platform, Limited Ltd. GU/US/18/09 Ohm Portal Get Started Guide Workspace Basics Workspace Basics Navigation Hierarchy An Organization is the top level in the
cief Data Analysis Chapter Overview Chapter 12:
 page 285 Chapter 12: cief Data Analysis Chapter Overview Analysis Screen Overview Opening Run Files How Run Data is Displayed Viewing Run Data Data Notifications and Warnings Checking Your Results Group
Publications Database
 Getting Started Guide Publications Database To w a r d s a S u s t a i n a b l e A s i a - P a c i f i c!1 Table of Contents Introduction 3 Conventions 3 Getting Started 4 Suggesting a Topic 11 Appendix
RITIS Training Module 9 Script
 RITIS Training Module 9 Script Welcome to the Regional Integrated Information System or RITIS Module 09 CBT. To begin, select the start button or press Shift+N on your keyboard. This training module will
PRODUCT PAGE PHASES and EXPERIENCE DESCRIPTION
 PHASES and EXPERIENCE DESCRIPTION This is a table containing the Feature, Phase, Function/Event and User Story for Product Pages. Each section of the page is addressed and each element within that section.
MaintScape Training Course Table of Contents
 MaintScape Training Course Table of Contents Table of Contents... 1 Training Course Requirements... 3 Overview and Main Modules... 3 Search Window... 4 Reports are produced from the Search Window... 6
User Manual Mobile client User Interface Version 5.0. Powered by
 User Manual Mobile client User Interface Version 5.0 Powered by Cartographic browser Gomap 4 1 Access control 5 1.1 Public access 5 1.2 Secured access 5 1.3 Multiple applications 5 2 Organisation 6 3 Parameters
Exercise 3: Query, Visualize, and Edit Data Using ODM Tools
 Exercise 3: Query, Visualize, and Edit Data Using ODM Tools Jeffery S. Horsburgh 1 4-25-2012 Objectives In this exercise you will learn how Query, Visualize, and Edit data in an ODM database using the
Lab 3: Digitizing in ArcGIS Pro
 Lab 3: Digitizing in ArcGIS Pro What You ll Learn: In this Lab you ll be introduced to basic digitizing techniques using ArcGIS Pro. You should read Chapter 4 in the GIS Fundamentals textbook before starting
GOOGLE APPS. If you have difficulty using this program, please contact IT Personnel by phone at
 : GOOGLE APPS Application: Usage: Program Link: Contact: is an electronic collaboration tool. As needed by any staff member http://www.google.com or http://drive.google.com If you have difficulty using
Each primary search has an auto-fill that will filter out results as the user continues to type.
 The Town of Farmville has recently requested a GIS parcel viewer and Timmons Group, based out of Richmond, VA, was selected to design and host this new website. This website allows users to look up parcel
ClockIt-Online User Guide
 ClockIt-Online User guide V5.4 Page 1 Content Purpose...4 Terminology...4 Logging in...5 Dashboard...6 Navigation...6 My account...8 Company duty roster...9 Open shifts...11 Prerequisite...11 Applying
OIW-EX Series of Oil In Water Analyzers MiView Handbook Document code: OIW-HBO-0013 Version: EX July 2013
 OIW-EX Series of Oil In Water Analyzers MiView Handbook Document code: OIW-HBO-0013 Version: EX-004 17 July 2013 Tel: +44 (0) 28 9332 8922 Document History Change No. Version No. Description Month & Year
Gradebook Entering, Sorting, and Filtering Student Scores March 10, 2017
 Gradebook Entering, Sorting, and Filtering Student Scores March 10, 2017 1. Entering Student Scores 2. Exclude Student from Assignment 3. Missing Assignments 4. Scores by Class 5. Sorting 6. Show Filters
Banner Gets a Facelift Coming this October
 Banner Gets a Facelift Coming this October 1 Benefits: No more Banner-specific password. Just log in with your regular credentials (NetID and password same that you use to log onto your computer, into
QuickStart Training Guide: The Accounting Review Role
 Accounting Review Role Final Approval of Expense Reports If you are an Accountant who is using ExpensAble Corporate to make final approval of employees expense reports, this information is for you. This
my energy. my usage. mymeter. Take control of your energy use with tools made just for you.
 my energy. my usage. mymeter. Take control of your energy use with tools made just for you. 1. New Users: Create your MyMeter Account Your prior user id and password from the Power of One Portal will not
My Sysco Reporting Job Aid for CMU Customers. My Sysco Reporting. For CMU Customers (Serviced by Program Sales)
") My Sysco Reporting For CMU Customers (Serviced by Program Sales) 1 Accessing My Sysco Reporting... 2 Logging In... 2 The Reporting Dashboard... 3 My Sysco Reporting Process... 6 Generating a Report...
My Sysco Reporting For CMU Customers (Serviced by Program Sales) 1 Accessing My Sysco Reporting... 2 Logging In... 2 The Reporting Dashboard... 3 My Sysco Reporting Process... 6 Generating a Report...
Taskbar: Working with Several Windows at Once
 Taskbar: Working with Several Windows at Once Your Best Friend at the Bottom of the Screen How to Make the Most of Your Taskbar The taskbar is the wide bar that stretches across the bottom of your screen,
Introduction to Excel
 Introduction to Excel Written by Jon Agnone Center for Social Science Computation & Research 145 Savery Hall University of Washington Seattle WA 98195 U.S.A. (206)543-8110 November 2004 http://julius.csscr.washington.edu/pdf/excel.pdf
Data. Selecting Data. Sorting Data
 1 of 1 Data Selecting Data To select a large range of cells: Click on the first cell in the area you want to select Scroll down to the last cell and hold down the Shift key while you click on it. This
B3 data QAQC software User s guide. Getting started
 B3 data QAQC software User s guide B3 is software intended to enable comprehensive and traceable quality assurance and quality control for large environmental datasets collected at regular time intervals,
Software Release Notes
 Software Release Notes 24-February-2017 The Version and Build Number can be found in the Help menu, About ViewPoint window. Note: Build Release Date is encoded in the Build # in yyyymmdd format. For details
Using the GLOBE Visualization System
 Using the GLOBE Visualization System Hold the mouse over the GLOBE Data menu, then click on Visualize and Retrieve Data. Or, use the quick link shown below. Click on Enter the Visualization System link.
Wordpress Training Manual
 The Dashboard... 2 If this is your first time logging in:... 2 How do I change my password or email address?... 3 Search Engine Optimization (SEO)... 4 SEO for Pages... 4 SEO for Images... 5 Managing Pages...
DataMaster for Windows
 DataMaster for Windows Version 3.0 April 2004 Mid America Computer Corp. 111 Admiral Drive Blair, NE 68008-0700 (402) 426-6222 Copyright 2003-2004 Mid America Computer Corp. All rights reserved. Table
OX App Suite 7.10 Highlights
 OX App Suite 7.10 Highlights The User Experience Enhancement Release Stephan Specketer May 2018 OX App Suite 7.10 Major release 1+ years in the making Major improvements in functionality OR codebase Lots
RITIS Training Module 10 Script. To return to the Florida Analytics main page, select Florida Analytics Tools in the upper left corner of the page.
 RITIS Training Module 10 Script Welcome to the Regional Integrated Transportation Information System or RITIS Module 10 CBT. To begin, select the start button or press Shift+N on your keyboard. To return
Tutorial 1: Finding and Displaying Spatial Data Using ArcGIS
 Tutorial 1: Finding and Displaying Spatial Data Using ArcGIS This tutorial will introduce you to the following: Websites where you may browse to find geospatial information Identifying spatial data, usable
Provider Portal Handbook
 Provider Portal Handbook WELCOME! Welcome to AlphaMCS, a next generation Managed Care System designed specifically to meet the needs of Managed Care Organizations and the behavioral healthcare providers
Life after Lotus Notes
 Welcome to Gmail What's different, at a glance... Now that you've switched from Lotus Notes to Google Apps, here are some tips on beginning to use Gmail as your new mail program. In Lotus Notes, you...
FastAttach Release Notes
 FastAttach Release Notes Release Summary Version 4.1 Main Screen. Redesigned to organize your work list and improve efficiency. A host of new features have been integrated into the FastAttach Main screen,
Result Point v3 User Manual, Revision Accelerated Technology Laboratories, Inc. All rights reserved.
 User Manual Result Point v3 User Manual, Revision 2 Result Point User Manual Table of Contents WELCOME...1 LOGGING IN...1 RETRIEVING YOUR PASSWORD... 1 CHANGING YOUR PASSWORD... 1 CLIENT INTERFACE...2
Web Client User Guide
 ImageTag, Inc. 2016 Contents Introduction... 2 Logging Into Your KwikTag Client... 3 KwikTag Tabs and Your Landing Page... 4 Drawers Tab Features and Functions... 7 My Lists... 7 The KwikTag Library...
Designing & Creating your GIS Poster
 Designing & Creating your GIS Poster Revised by Carolyn Talmadge, 11/26/2018 First think about your audience and purpose, then design your poster! Here are instructions for setting up your poster using
CDSN Fact Sheet: Getting Started Uploading & Analyzing Data June 2015
 Colorado Data Sharing Network (CDSN) A Project of the Colorado Water Quality Monitoring Council P.O. Box 2058 Ridgway, CO 81432 970 258 0836 cdsn@coloradowaterdata.org www.coloradowaterdata.org CDSN Fact
BASIC NAVIGATION & VIEWS...
 Content Overview VISUAL TOUR... 5 NEW FEATURES IN OUTLOOK 2010... 6 BASIC NAVIGATION & VIEWS... 7 SETTING PREFERENCES... 7 Creating an Outlook Shortcut... 7 Choosing a Startup View... 7 CUSTOMIZING INBOX
Supplier SAP SNC User Guide
 Supplier SAP SNC User Guide Version 1.0 July 29, 2014 AGCO Corporation Page 1 1 Introduction AGCO has chosen SAP Supplier Network Collaboration (SNC) to improve visibility and capability in North America
Scholastic Oracle Cloud Supplier Portal User Guide
 Scholastic Oracle Cloud Supplier Portal User Guide Table of Contents Introduction to the Supplier Portal... 3 What is the Supplier Portal?... 3 Navigating the Supplier portal... 3 Logging in... 3 Homepage
The Ultimate Web Accessibility Checklist
 The Ultimate Web Accessibility Checklist Introduction Web Accessibility guidelines accepted through most of the world are based on the World Wide Web Consortium s (W3C) Web Content Accessibility Guidelines
OnCOR Silverlight Viewer Guide
 Getting Around There are many ways to move around the map! The simplest option is to use your mouse in the map area. If you hold the left button down, then click and drag, you can pan the map to a new
Migrating Call Intelligence Settings for New CTC Clients
 Information Bulletin CDK Global, LLC. 1950 Hassell Road Hoffman Estates, IL 60169-6308 Migrating Call Intelligence Settings for New CTC Clients Converting to a New Phone System... 2 Overview of Important
IBM Rational Rhapsody Gateway Add On. User Guide
 User Guide Rhapsody IBM Rational Rhapsody Gateway Add On User Guide License Agreement No part of this publication may be reproduced, transmitted, stored in a retrieval system, nor translated into any
Remodeling Your Office A New Look for the SAS Add-In for Microsoft Office
 Paper SAS1864-2018 Remodeling Your Office A New Look for the SAS Add-In for Microsoft Office ABSTRACT Tim Beese, SAS Institute Inc., Cary, NC Millions of people spend their weekdays in an office. Occasionally
Photoshop Fundamentals
 Lesson 3 Photoshop Fundamentals Photoshop Fundamentals How to Navigate your Document Zooming in and out To zoom in and out on your Photoshop document, hold down the Command key (Ctrl on Win) and press
ABA Advantage Web Portal User Guide
 ABA Advantage Web Portal User Guide Version v2.1.18.4092 Page 1 of 63 1.0 Signing in Version v2.1.18.4092 Page 2 of 63 1.0 Signing in Table of Contents 1.0 Signing in... 6 2.0 Clients... 7 2.1 Clients
PROBLEM AND SOLUTION OVERVIEW
 PROBLEM AND SOLUTION OVERVIEW Currently, very few people have systems in place to track water usage. At this time, there is no easy or convenient way to collect this information. As a consequence of this,
NCSS Statistical Software
 Chapter 245 Introduction This procedure generates R control charts for variables. The format of the control charts is fully customizable. The data for the subgroups can be in a single column or in multiple
DwyerLog Logger Interface Software
 DwyerLog Logger Interface Software USER S GUIDE Version 1.4x March 21, 2013 Dwyer Instruments, Inc 102 Indiana Hwy 212 Michigan City, IN 46360 Phone: (219) 879-8868 Fax: (219) 872-9057 http://www.dwyer-inst.com
Quality Gates User guide
 Quality Gates 3.3.5 User guide 06/2013 1 Table of Content 1 - Introduction... 4 2 - Navigation... 5 2.1 Navigation tool bar... 5 2.2 Navigation tree... 5 2.3 Folder Tree... 6 2.4 Test history... 7 3 -
3D Character Creation for the Unreal Game Engine Using Adobe Fuse
 3D Character Creation for the Unreal Game Engine Using Adobe Fuse Developed by: Gaming Research Integration for Learning Laboratory (GRILL ) DISTRIBUTION A: Approved for public release; distribution unlimited.
SDB QUICK START GUIDE
 SDB QUICK START GUIDE This document contains proprietary information. Please do not reveal any of its contents to anyone not directly responsible for evaluating it without first obtaining written permission
What's different, at a glance...
 Welcome to DCU Apps Email Now that you've switched from Mozilla Thunderbird to DCU Apps, here are some tips on beginning to use DCU Apps Email as your new mail program. What's different, at a glance...
Welcome to the Rainfall Atlas of Hawai i interactive map!
 Welcome to the Rainfall Atlas of Hawai i interactive map! This guide will walk you through all of the capabilities of the interactive map so that you can make the most of all it has to offer. Conditions
User Guide. Cloud Connect App Board
 User Guide Cloud Connect App Board 2017-03-03 Contents 1. Orientation... 3 1.1 Introduction... 3 1.1.1 Thing overview... 3 1.2 Access and logging in... 3 1.2.1 Access... 3 1.2.2 Sign up and Log in... 3
Kentucky River Watershed Watch Data Portal Workshop
 Kentucky River Watershed Watch Data Portal Workshop KRWW Annual Conference, February 6, 2016 Malissa McAlister, Bethany Overfield, Doug Curl Lower Howard's Creek Tributary Learn Your Way Around the Watershed
Working with Charts Stratum.Viewer 6
 Working with Charts Stratum.Viewer 6 Getting Started Tasks Additional Information Access to Charts Introduction to Charts Overview of Chart Types Quick Start - Adding a Chart to a View Create a Chart with
Deckblatt. APL Operator Guide SIMATIC PCS 7. Application description June Applikationen & Tools. Answers for industry.
 Deckblatt SIMATIC PCS 7 Application description June 2011 Applikationen & Tools Answers for industry. Industry Automation and Drive Technologies Service & Support Portal This article is taken from the
OBIEE. Oracle Business Intelligence Enterprise Edition. Rensselaer Business Intelligence Finance Author Training
 OBIEE Oracle Business Intelligence Enterprise Edition Rensselaer Business Intelligence Finance Author Training TABLE OF CONTENTS INTRODUCTION... 1 USER INTERFACE... 1 HOW TO LAUNCH OBIEE... 1 TERMINOLOGY...
Cadrage Director s Viewfinder USER MANUAL
 For ios & Android User Manual February 2018 Current App Versions: ios: 3.0.1 Android: 4.0 www.cadrage.at Table of contents GET STARTED QUICKLY 4 BASIC FUNCTIONALITY 6 Introduction 6 The Main View 6 Prime
Timed Organizer User s Manual
 Timed Email Organizer User s Manual Quick Start Guide... 3 Welcome... 4 Main Rules Window... 5 Status Bar... 6 Close... 7 Save As... 7 Add/Edit Rules... 7 Conditions... 9 Actions... 12 Delete Rules...
Microsoft Excel 2007 Lesson 7: Charts and Comments
 Microsoft Excel 2007 Lesson 7: Charts and Comments Open Example.xlsx if it is not already open. Click on the Example 3 tab to see the worksheet for this lesson. This is essentially the same worksheet that
What s New in the GM EPC
 What s New in the GM EPC The GM Next Gen EPC has numerous new features designed to make finding the right part faster and easier. For detailed instructions on using each feature, select User Guide from
Contents. Batch & Import Guide. Batch Overview 2. Import 157. Batch and Import: The Big Picture 2 Batch Configuration 11 Batch Entry 131
 Batch & Import Guide Last Updated: 08/10/2016 for ResearchPoint 4.91 Contents Batch Overview 2 Batch and Import: The Big Picture 2 Batch Configuration 11 Batch Entry 131 Import 157 Configure Import File
Troubleshooting in Microsoft Excel 2002
 Page 1 of 8 Troubleshooting in Microsoft Excel 2002 Result: To understand how to work with the Excel software to enter data, navigate the page, and print materials. Tabs Look at the tabs at the bottom
Scholastic Oracle Cloud Supplier Portal User Guide
 Scholastic Oracle Cloud Supplier Portal User Guide Table of Contents Introduction to the Supplier Portal... 3 What is the Supplier Portal?... 3 Navigating the Supplier portal... 3 Logging in... 3 Homepage
Rev. B 12/16/2015 Downers Grove Public Library Page 1 of 40
 Objectives... 3 Introduction... 3 Excel Ribbon Components... 3 File Tab... 4 Quick Access Toolbar... 5 Excel Worksheet Components... 8 Navigating Through a Worksheet... 9 Downloading Templates... 9 Using
Table of Contents. Copyright JAVS
 1 Table of Contents Introduction to...4 Getting Started...5 Login...5 Interface at a glance...5 Creating a new session...10 New Session Window...10 Parties and Exhibits...12 Entering Exhibits...12 Entering
Institutional Reporting and Analysis (IRA) For help, blitz "Financial Reports", or
 For help, blitz Financial Reports, or") Institutional Reporting and Analysis (IRA) 1 Training Agenda Introduction to the IRA Reporting Tool Logging onto the system (4-5) Navigating the Dashboard (6-10) Running Reports (11-12) Working with Reports
Institutional Reporting and Analysis (IRA) 1 Training Agenda Introduction to the IRA Reporting Tool Logging onto the system (4-5) Navigating the Dashboard (6-10) Running Reports (11-12) Working with Reports
IBM Rational Rhapsody Gateway Add On. User Manual
 User Manual Rhapsody IBM Rational Rhapsody Gateway Add On User Manual License Agreement No part of this publication may be reproduced, transmitted, stored in a retrieval system, nor translated into any
Instructions for using Borg and Ide CONNECT. Referring Provider Portal. Version 3.5.
 Instructions for using Borg and Ide CONNECT Referring Provider Portal www.borgideconnect.com Version 3.5 Topic Table of Name Contents Description Getting Started...1 Home Page and Finding Patient Exams...2
Windows XP. A Quick Tour of Windows XP Features
 Windows XP A Quick Tour of Windows XP Features Windows XP Windows XP is an operating system, which comes in several versions: Home, Media, Professional. The Windows XP computer uses a graphics-based operating
MindSphere. Fleet Manager. Introduction to "Fleet Manager" 1. User interface for "Fleet Manager" 2. User rights in "Fleet Manager" 3
 Introduction to "Fleet Manager" 1 User interface for "Fleet Manager" 2 MindSphere User rights in "" 3 Asset navigation 4 Using extensions 5 System Manual 08/2018 V1801.K0730 Legal information Warning notice
Ticketing Table of Contents:
 Table of Contents: Manage Tickets Configure 362 Chapter 8 - Sadjadi et al. Introduction While deployed agents provide extremely useful information regarding the state of all managed machine, facilitating
Page 1 of 11
 1800 990 432 Page 1 of 11 Table of Contents Registering Your Business... 3 Eligibility Criteria... 3 Navigating to the Regional Buy Portal... 3 Navigating the Registration Process... 3 The Registration
User Guide for TASKE Contact Web Interface
 User Guide for TASKE Contact Web Interface For Avaya Communication Manager with Application Enablement Services Version: 8.9 Date: 2011-06 This document is provided to you for informational purposes only.
CREE SMARTCAST TECHNOLOGY. SMARTCAST LIGHTING NETWORK WITH BACnet CAPABILITY GUIDE
 Welcome to the SmartCast Lighting Network with BACnet Capability Guide! This is the place to come for answers to all your Cree-related BACnet questions. We ll answer them here or point you to other Cree
Photoshop World 2018
 Photoshop World 2018 Unlocking the Power of Lightroom CC on the Web with Rob Sylvan Learn how to leverage the cloud-based nature of Lightroom CC to share your photos in a way that will give anyone with
Manual. User Reference Guide. Analysis Application (EMG) Electromyography Analysis
 Electromyography Analysis") Phone: (888) 765-9735 WWW.MINDWARETECH.COM User Reference Guide Manual Analysis Application Electromyography Analysis (EMG) Copyright 2014 by MindWare Technologies LTD. All Rights Reserved. 1 Phone: (614)
Phone: (888) 765-9735 WWW.MINDWARETECH.COM User Reference Guide Manual Analysis Application Electromyography Analysis (EMG) Copyright 2014 by MindWare Technologies LTD. All Rights Reserved. 1 Phone: (614)
Online Reports Portal User Guide
 ACT WorkKeys Online Reports Portal User Guide www.act.org How to Contact ACT For operational questions regarding ACT WorkKeys : Address ACT WorkKeys Operations 301 ACT Drive PO Box 168 Iowa City, IA 52243-0168
This book will help you quickly create your first documents, spreadsheets, and slideshows.
 Getting Started Welcome to iwork 08 Preface This book will help you quickly create your first documents, spreadsheets, and slideshows. iwork 08 includes three applications that integrate seamlessly with
0Acknowledgement. This application has been developed with the cooperation of the Inter-agency Group for Child Mortality Estimation.
 r4 0Acknowledgement This application has been developed with the cooperation of the Inter-agency Group for Child Mortality Estimation. 1Contents Introduction... 6 User Levels... 6 Learning CME Info...
2015 Entrinsik, Inc.
 2015 Entrinsik, Inc. Table of Contents Chapter 1: Creating a Dashboard... 3 Creating a New Dashboard... 4 Choosing a Data Provider... 5 Scheduling Background Refresh... 10 Chapter 2: Adding Graphs and
Java/RealJ Troubleshooting Guide
 Java/RealJ Troubleshooting Guide by Bob Clark / Sharon Curtis / Simon Jones, September 2000 Some of these tips you will come across during your practical sessions, however we felt it would be helpful to
Excel Basics Rice Digital Media Commons Guide Written for Microsoft Excel 2010 Windows Edition by Eric Miller
 Excel Basics Rice Digital Media Commons Guide Written for Microsoft Excel 2010 Windows Edition by Eric Miller Table of Contents Introduction!... 1 Part 1: Entering Data!... 2 1.a: Typing!... 2 1.b: Editing
MindSphere. Fleet Manager. Introduction to "Fleet Manager" 1. User interface for "Fleet Manager" 2. User rights in "Fleet Manager" 3.
 Introduction to "Fleet Manager" 1 User interface for "Fleet Manager" 2 MindSphere User rights in "Fleet Manager" 3 Asset navigation 4 Using extensions 5 System Manual V1801.K0507 V1801.K0214 Legal information
SMC Cloud. Start-up Guide. (Instructions for Field Installers, Support and Administrator) APPLICABILITY & EFFECTIVITY
 APPLICABILITY & EFFECTIVITY") SMC Cloud Start-up Guide (Instructions for Field Installers, Support and Administrator) APPLICABILITY & EFFECTIVITY Explains SMC Cloud registration and use. The instructions are effective for the above
SMC Cloud Start-up Guide (Instructions for Field Installers, Support and Administrator) APPLICABILITY & EFFECTIVITY Explains SMC Cloud registration and use. The instructions are effective for the above
CTU Database revised June 2001
 CTU Database revised June 2001 The UH Cancer Center CTU Database is a web based application. You should be able to use this application from any web browser, though it was designed for IE8, it has been
CHAPTER 1 COPYRIGHTED MATERIAL. Finding Your Way in the Inventor Interface
 CHAPTER 1 Finding Your Way in the Inventor Interface COPYRIGHTED MATERIAL Understanding Inventor s interface behavior Opening existing files Creating new files Modifying the look and feel of Inventor Managing
AT&T REPORTING AND MANAGEMENT TOOL (ARMT) USER GUIDE VERSION
 USER GUIDE VERSION") AT&T REPORTING AND MANAGEMENT TOOL (ARMT) USER GUIDE VERSION 3.11.3 2018 AT&T Intellectual Property. All rights reserved. AT&T and the AT&T logo are trademarks of AT&T Intellectual Property. All other
AT&T REPORTING AND MANAGEMENT TOOL (ARMT) USER GUIDE VERSION 3.11.3 2018 AT&T Intellectual Property. All rights reserved. AT&T and the AT&T logo are trademarks of AT&T Intellectual Property. All other
Training Manual and Help File
 Training Manual and Help File 30.06.2011 Update Manage Grow Welcome to your new Juniper Website Management System with CMS Introduction The Juniper Website Management System with CMS (Website Content Management
NJUNS 2018 USER GUIDE
 NJUNS 2018 USER GUIDE Key Differences in the New System... 4 Data Migration... 4 Login... 5 Dashboard... 5 Header Menu... 5 Working with Tickets... 6 Tickets... 6 Adjust the number of Rows displayed per
How to view details for your project and view the project map
 Tutorial How to view details for your project and view the project map Objectives This tutorial shows how to access EPANET model details and visualize model results using the Map page. Prerequisites Login
Copyright JAVS
 1 Copyright JAVS 2013 2 Contents Introduction... 4 Set Up... 5 Interface Overview... 6 Application Settings... 7 General Tab... 7 Audio Device Tab... 8 Custom Fields Tab... 9 Quick Notes Tab... 10 Starting
Karlen Communications Track Changes and Comments in Word. Karen McCall, M.Ed.
 Karlen Communications Track Changes and Comments in Word Karen McCall, M.Ed. Table of Contents Introduction... 3 Track Changes... 3 Track Changes Options... 4 The Revisions Pane... 10 Accepting and Rejecting