What s New Essential Studio User Interface Edition, 2011 Volume 4
|
|
|
- Hillary Burns
- 6 years ago
- Views:
Transcription

1 What s New Essential Studio User Interface Edition, 2011 Volume 4
2 Contents ASP.NET MVC Mobile... 6 Essential Chart for ASP.NET MVC Mobile... 6 Chart Control... 6 Essential Tools for ASP.NET MVC Mobile Header Control Footer Control Menu Control Dialog Control ProgressBar Control ListBox Control Tab Control Rating Control Scroll Panel Control Slider Control ToolBar Control ASP.NET Essential Tools for ASP.NET Client-Side Events for the TreeView Control Essential Chart for ASP.NET ToolTips for Chart Axis Labels Localization Support Essential Diagram for ASP.NET Show or Hide Text in Symbol Palette Essential Gauge for ASP.NET HTML 5-Based Gauge Control ASP.NET MVC Essential PDF Viewer for ASP.NET MVC Essential Grid for ASP.NET MVC External Form Edit Mode Stacked Headers Auto-Wrap in Column Cells P a g e
3 Essential Tools for ASP.NET MVC Rotator Improvements Essential Chart for ASP.NET MVC Essential Chart with HTML Localization Support Essential Diagram for ASP.NET MVC Persistence Support for Diagrams Multiple Selection Z-Order Commands Adding Custom Shapes WPF Common to All WPF Products WPF 4 Manipulation Metro Theme Essential Chart for WPF TimeLine Control Essential Tools for WPF Multiple Selection in Property Grid Essential Diagram for WPF Serializing the Symbol Palette Symbol Designer Import Symbols Expanded Decorator Support Line Routing Essential Gantt for WPF Filter and Sort the Task List Baseline Table View Virtualization Essential Spreadsheet for WPF Center across Selection Alignment Support Document Settings Advanced Encryption and Decryption P a g e
4 PDF Export Text Wrap Support Import from ADO.NET DataTable Essential Maps for WPF Data Binding Support Path Support Virtualization Importing and Exporting Map Elements Silverlight Essential Gantt for Silverlight Baseline Table View Support Filter and Sort the Task List Virtualization Essential Diagram for Silverlight Serializing the Symbol Palette Line Routing Polyline and Poly-Orthogonal Lines Underline Option for Label Text Essential Spreadsheet for Silverlight Center across Selection Alignment Support Document Settings Advanced Encryption and Decryption PDF Export Text Wrap Support Essential Maps for Silverlight Path Support Data Binding Support Importing and Exporting Map Elements Virtualization Windows Forms Essential Grid for Windows Forms Visual Styles P a g e
5 Essential Tools for Windows Forms SplitButton Control Essential Chart for Windows Forms Localization Support ToolTips for Chart Axis Labels Windows Phone Essential Tools for Windows Phone Jumplists Range Slider Control Toolbar Control Color Picker Control Timespan Picker Control ToolTip Control Dialog Control Essential Maps for Windows Phone Importing and Exporting Map Elements Path Support Data Binding Support Virtualization P a g e
6 ASP.NET MVC Mobile Essential Chart for ASP.NET MVC Mobile Chart Control Essential Chart for Mobile MVC is a lightweight, HTML 5 canvas element-based chart control that is easily configurable. It provides high quality, visually rich business charts on mobile platforms. Essential Chart provides support for the following chart types. Line charts A line chart is a chart where data points on the graph are joined by a curved line. They are ideal for representing series data and displaying trends in data at equal intervals. Line Chart Step line charts A step line chart is a chart in which data points on the graph are joined using straight lines. 6 P a g e
7 Step Line Chart Spline charts A spline chart is a chart in which data points are joined by a Bezier curve. Spline Chart Pie charts Pie charts are ideal for displaying proportionate values that are expressed in either percentage or fractional formats. 7 P a g e

8 Pie Chart Column charts Column charts, which are the most commonly used charts, display data points as vertical bars. In this respect they are similar to bar charts which display data points as horizontal bars rather than vertical. 8 P a g e


9 Column Chart Area charts An area chart is a line chart in which the chart area is given a solid color or a gradient brush to emphasize the relationships between the pieces of charted data. Area Chart 9 P a g e


10 Step area charts A step area chart is a step line chart in which the chart area is given a solid color or a gradient brush to emphasize the relationships between different pieces of charted information. Step Line Area Chart Spline area charts Spline area charts are spline charts in which the chart area is given a solid color or a gradient brush to emphasize the relationships between individual data. Spline Area Chart 10 P a g e


11 Essential Chart for MVC Mobile also provides support for following features. ToolTips Essential Chart for Mobile MVC supports rich ToolTips to display information for a series of points. ToolTips associated with all the chart regions are visible when the pointer hovers on the corresponding region. Chart ToolTip Client-side events Essential Chart for Mobile MVC supports client-side events to interact with the chart control. Data Series Highlighted through Client-Side Event 11 P a g e

12 Data binding support The Mobile MVC chart control supports binding data from various data sources, namely JSON binding, list binding, and client-data binding. Data-Bound Chart Symbol features Symbols are visual indicators to represent the location of data points in the graph. Chart with Custom Symbols 12 P a g e

13 Gridlines and ticks The Mobile MVC chart control has support for major ticks, minor ticks, and gridlines for extensive chart axis customization. Essential Tools for ASP.NET MVC Mobile Chart with Gridlines and Ticks Header Control The Header control displays header content for mobile applications. It provides customization options to set captions, show or hide captions, and set custom content as a template for left and right (forward and back) navigation buttons. It features four built-in skins to enhance its look and feel. Header Control 13 P a g e
 navigation buttons.")
14 Footer Control The Footer control displays header content for mobile applications. It provides customization options to set captions, show or hide captions, and set custom content as a template for left and right (forward and back) navigation buttons. It features four built-in skins to enhance its look and feel. Footer control Menu Control The Menu control for Mobile MVC is a tool that helps you create stunning interactive menus that display items in a list based on their relationships with each other. It supports data binding, templates, and even rendering for sub-items to create hierarchical menus. The Menu control supports both horizontal and vertical layout modes, and features four built-in themes to enhance its look and feel. Menu Control 14 P a g e


15 Dialog Control The Dialog control implements a modal dialog box-like window inside which any HTML content can be placed, including form content, messages, images, and text. Dialog boxes can be dragged within a browser, and feature four built-in themes that enhance their look and feel. Customized Dialog Control ProgressBar Control The ProgressBar control allows you to graphically represent the progress of an ongoing process. Because it is a client-side control, information can be loaded quickly. The control s orientation, dimensions, and text are customizable, and it features four built-in skins that enhance its look and feel. Progress Bar ListBox Control The ListBox control provides a dynamic and interactive list view interface for displaying data, data navigation, results lists, and data entry. The ListBox control supports server data binding, JSON binding, and Web service binding. It also supports client-side filtering, and comes with various built-in skins to enhance the look and feel for end users. 15 P a g e


16 ListBox Control Tab Control The Tab control provides a dynamic, interactive menu-driven tabbed interface. Tab content can be text, images, graphics, or HTML. If more items are added to the tab bar than can be displayed, a More item automatically appears at the end of the tab bar. When end users touch the More item, all the items that did not fit on the tab bar are displayed. The Tab control supports data binding for tab items and provides two types of tab styles opened and closed. The tab control comes with various built-in skins that enhance the look and feel. Tab Controls 16 P a g e

17 Rating Control The Rating control provides an intuitive rating experience that allows end users to select a number of stars to represent a rating. Developers can specify the initial rating, the maximum rating to allow, and the alignment and direction of the stars. The Rating control also allows developers to specify a custom shape instead of stars. It ships with four built-in skins, and is rendered on the HTML 5 canvas surface. Customized Rating Controls Scroll Panel Control This feature provides an interactive scroll panel control that wraps all its contents in a scrollable area. Objects with continuous text, pictures, or any other content can be scrolled or viewed even if they don t fit into the space on the mobile display. The ScrollPanel control supports four built-in skins that enhance its look and feel. Text and Images in a Scroll Panel Control 17 P a g e


18 Slider Control The Slider control provides a dynamic and interactive slider bar that allows users to visually select a specific value or a range of values within a value range by dragging or selecting a drag handle. The drag handles are used to select a range of maximum and minimum values, and the increment by which they are able to move can be customized. It supports both horizontal and vertical orientations, and various tick marks and slider handles. It provides HTML 5 ToolTips to display the current value of the slider. The Slider control features four built-in skins that enhance the look and feel. Slider Control ToolBar Control This feature allows you to customize and display a list of command items in a standard toolbar interface. Toolbars can be populated from the Items collection. It also supports data binding and templates for toolbar items, and features four built-in themes. Toolbar Control 18 P a g e

19 ASP.NET Essential Tools for ASP.NET Client-Side Events for the TreeView Control New client-side events and features have been added to the TreeView control help to control its behavior efficiently. Essential Chart for ASP.NET ToolTips for Chart Axis Labels This feature enables users to add ToolTips to chart axis labels. For instance, if a chart axis label s text is truncated because its content is too long, the ToolTip for the label can show the full text. You can also customize ToolTips to show any content you want. Customized Chart Axis Label ToolTip Localization Support With localization support, the text and formats used by a chart will reflect the current locale of the application. 19 P a g e


20 Localized Chart Context Menu Essential Diagram for ASP.NET Show or Hide Text in Symbol Palette This feature allows you to show or hide text added to nodes in the symbol palette. This way text attached to all the elements of the palette can be shown or hidden according to your preference. Symbol Palette with Text Shown Symbol Palette with Text Hidden 20 P a g e


21 Essential Gauge for ASP.NET HTML 5-Based Gauge Control A gauge is a data visualization control that can be used to display several data points or data ranges in a concise and compact area. The gauge control can be divided into the following types: Linear gauge Circular gauge Digital gauge Rolling gauge Linear gauges measure values of scales and represent them in the form of a slider along a linear scale, similar to a thermometer. The customization options for linear gauges include horizontal and vertical orientations, three different frame types, twelve pointer types, range indicators, labels, and a multitude of skins. Vertical Linear Gauge Horizontal Linear Gauge 21 P a g e


22 Pentagon Pointer Type Trapezoid Pointer Type Gauge with Range Indicator Customized Labels VS2010 Skin Office2007 Skin Circular gauges can display several data points or data ranges in a concise and compact area. Data in the control can be easily read and quickly understood by users of any level. Circular gauges have numerous advanced features. Multiple scales and pointers can be implemented within a single gauge. All pointers, as well as their respective scales, can be customized at run time. A circular gauge can have both needle and marker pointer types, and features many built-in options for each. The circular gauge also features customizable range indicators, reverse scales, labels, and fourteen stunning skins for better, professional displays. 22 P a g e


23 Customized Circular Gauge Multiple Scales and Pointers in a Gauge Needle Pointer Type Marker Pointer Type Customized Range Indicators Customized Labels VS2010 Skin Almond Skin Olive Skin 23 P a g e
24 Digital gauges display alphanumeric data. This can be observed in digital clocks and virtual displays showing alphanumeric output. It is has both the seven-segment and fourteen-segment display options. Rolling gauges are controls that can display values as segments while allowing data to be presented in a rolling manner. You can specify the number of segments, and customize the type of segments to be used. Multiple segments can be customized at once with ease, since each segment can be altered using the index assigned to it. 24 P a g e

25 ASP.NET MVC Essential PDF Viewer for ASP.NET MVC Essential PDF Viewer for ASP.NET MVC is a brand new component that gives users the ability to view and print PDF files from MVC applications without any reliance on Adobe. Users can embed Essential PDF Viewer within a.net application, or use it as a stand-alone application. It supports various PDF objects such as text, lines, curves, color spaces, and.jpeg images with DCTDecode and FlateDecode filters. Essential Grid for ASP.NET MVC PDF File Rendered in Essential PDF Viewer External Form Edit Mode Editing grid data through external forms allows you to focus on and edit one data entry at a time while allowing you to see what the other data entries in the grid are. You can use a customized template for the external editing form. You may add new fields and customized dimensions to the editing form. The changes made in the form are reflected in the grid data as they are saved. 25 P a g e


26 The position of the external form can be customized according to your preference to any side of the grid, above or below it; you can also hide or show the external edit form, as shown in the following figures. External Editing Form in the Top-Right of the Grid External Editing Form in the Bottom-Left of the Grid 26 P a g e


27 External Editing Form with Customized Template Stacked Headers Stacked headers allow users to have additional header rows that span across multiple grid columns. Users can group columns under such headers. This feature helps better organize grid data as users will be able to clearly see which dimensions of data relate to the same topic. Related columns in the same grid can be grouped under a single heading so that data in those columns will be seen as part of a whole. In the following figure, Order Details and Ship Details are stacked headers. Stacked Headers in a Grid Auto-Wrap in Column Cells When the content in a cell exceeds the width of the column it is in, this feature automatically wraps the text in the cell. This way, you will not need to double-click on a cell to see the entirety its content. You can resize the width of columns according to your needs; however, grids have a minimum specification 27 P a g e

28 for the width of columns. Depending on the properties that are enabled, you will either not be able to resize the column beyond that minimum width, or the content in the cell will be clipped. Unwrapped Content in a Grid Wrapped Text in a Grid 28 P a g e


29 Essential Tools for ASP.NET MVC Rotator Improvements The Rotator control now allows you to animate items for an improved user experience, plug in data to the rotator with the new data binding feature, show items in a random order, and integrate a pager with the rotator to view the items in the rotator seamlessly. Rotator Control with Pager Mode Enabled Rotator Control in Slider Mode 29 P a g e

30 Essential Chart for ASP.NET MVC Essential Chart with HTML 5 Essential Chart with HTML 5 is a lightweight, canvas-based chart control that utilizes HTML 5 to implement a very high performance and interactive chart control. Localization Support The user interface of a chart can be customized so that it is locale-specific. Essential Diagram for ASP.NET MVC Persistence Support for Diagrams This feature allows users to persist the skeleton and common feature-related properties of a diagram in an.xml file. This feature only includes platform-independent data for nodes and their properties (size, position, etc.), not platform-specific contents. This feature also supports basic controls such as buttons, images, and text boxes. Multiple Selection This feature allows you to select multiple diagram nodes and line connectors at the same time, using multiple selectors. You can then move, resize, or delete the nodes and connectors you have selected Selected Nodes and Connectors Z-Order Commands The ordering commands allow you to change the z-order (order of objects along the z-axis) value of the selected objects (nodes and connectors) on the page. Objects can be made to move backward or forward on the axis so that they get displayed over or beneath other objects in the case that two or more objects overlap. 30 P a g e


 Send")

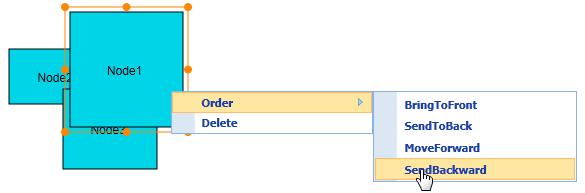
31 Before (Left) and After (Right) Bring to Front Operation Before (Left) and After (Right) Send to Back Operation Before (Left) and After (Right) Move Forward Operation Before (Left) and After (Right) Send Backward Operation 31 P a g e


32 Adding Custom Shapes This feature allows you to add your own custom shapes as nodes to the diagram page or as a shape to the symbol palette. You can also drag the custom shapes from the symbol palette to the diagram page. Custom Shapes Added Directly to a Diagram Page Custom Shapes Added to the Symbol Palette 32 P a g e

33 WPF Common to All WPF Products WPF 4 Manipulation WPF 4 controls now support multi-touch interaction, making them very usable in touch-screen devices. Metro Theme A new Metro theme based on the look and feel of Windows Phone is available in all our WPF controls. Essential Chart for WPF TimeLine Control The TimeLine control can be used to view specific time frames in a chart by allowing users to select a range of data. It can be integrated with other controls like Essential Chart, Essential Grid, and Essential Gantt for selecting and viewing data that falls inside a specific time frame. It has a rich UI for users to interact with. Essential Tools for WPF Viewing a Selected Time Frame in a Chart Multiple Selection in Property Grid This feature displays the properties that are common among multiple selected objects, and when a single selected object is bound, property grid will display all the properties of the selected object. 33 P a g e
34 Essential Diagram for WPF Serializing the Symbol Palette Symbol palettes can be serialized and saved as.xaml files and loaded back into a diagram at a later point in time. Symbol Designer This is a new tool for creating, designing, and editing symbol palettes that can be used in a diagram builder application. Import Symbols Symbols from Microsoft Expression Blend and Visio, and Syncfusion Essential Diagram for Windows Forms can now be imported into a diagram symbol palette. Expanded Decorator Support Decorator shapes can be customized in such a way that each line segment of a line connector can have a decorator. Line Routing This feature avoids overlapping links and nodes. If a line connector is drawn between two nodes and crosses other nodes, the line will be automatically rerouted around interfering nodes. Essential Gantt for WPF Filter and Sort the Task List This feature allows users to sort and filter tasks in the grid view of a Gantt chart. Data can be sorted or filtered in alphabetical order. Baseline Table View This feature is used to display the variance between a baseline and the current progress of a task in the table view of a Gantt chart. This column is added dynamically when the user chooses to view the variance of the progress. Virtualization Virtualization support has been added to improve the performance of Essential Gantt. Essential Spreadsheet for WPF Center across Selection Alignment Support This feature groups the text between two cells, similar to merged cells in Excel, to be aligned at the center to form one single cell. Document Settings Users are now able to edit spreadsheet options such as author, tags, category, and more. 34 P a g e
35 Advanced Encryption and Decryption Using a password, users are able to encrypt and decrypt spreadsheets for the sake of privacy. PDF Export Users are now able to export spreadsheet contents to PDF. Text Wrap Support Users are now able to wrap text in a cell if they choose. Import from ADO.NET DataTable Essential Spreadsheet now allows you to directly import data into a spreadsheet from ADO.NET DataTables and convert the data to an Excel-readable format. Essential Maps for WPF Data Binding Support Essential Maps now offers data binding support for labels, symbols, and paths. This allows labels, symbols, and paths to be generated from a bound ItemSource collection. Path Support Essential Maps can now display a path from one point to another, allowing maps to illustrate, for example, train, road, air, or sea routes. Using paths, a map can be used to create a street-level view. Paths have numerous features. They can be changed automatically when the shapefile contains polylines. They can be added by users, contain labels, and have customized styles. Zooming and panning in maps with paths is supported, and paths are drawn dynamically. Street-Level View Created with Paths 35 P a g e
36 Virtualization Virtualization support has been added to Essential Maps to improve performance. Importing and Exporting Map Elements Map elements such as paths, labels, and symbols can be persisted through an.xml file via serialization. 36 P a g e
37 Silverlight Essential Gantt for Silverlight Baseline Table View Support This feature is used to display the variance between a baseline and the current progress of a task in the table view of a Gantt chart. This column is added dynamically when the user chooses to view the variance of the progress. Filter and Sort the Task List This feature allows users to sort and filter tasks in the grid view of a Gantt chart. Data can be sorted or filtered in alphabetical order. Virtualization Virtualization support has been added to improve the performance of Essential Gantt. Essential Diagram for Silverlight Serializing the Symbol Palette Symbol palettes can be serialized and saved as.xml files and loaded back into a diagram at a later point in time. Line Routing This feature avoids overlapping links and nodes. If a line connector is drawn between two nodes and crosses other nodes, the line will be automatically rerouted around interfering nodes. Polyline and Poly-Orthogonal Lines Polylines and orthogonal lines are alternatives to straight line connectors. They are very useful when there are other nodes between two nodes that are being connected. End users can clearly indicate what kind of polylines (by specifying exact points of directional changes) or orthogonal lines should be used to connect nodes. Underline Option for Label Text Users are able to underline labels for nodes and lines. Essential Spreadsheet for Silverlight Center across Selection Alignment Support This feature groups the text between two cells, similar to merged cells in Excel, to be aligned at the center to form one single cell. Document Settings Users are now able to edit spreadsheet options such as author, tags, category, and more. Advanced Encryption and Decryption Using a password, users are able to encrypt and decrypt spreadsheets for the sake of privacy. 37 P a g e
38 PDF Export Users are now able to export spreadsheet contents to PDF. Text Wrap Support Users are now able to wrap text in a cell if they choose. Essential Maps for Silverlight Path Support Essential Maps can now display a path from one point to another, allowing maps to illustrate, for example, train, road, air, or sea routes. Using paths, a map can be used to create a street-level view. Paths have numerous features. They can be changed automatically when the shapefile contains polylines. They can be added by users, contain labels, and have customized styles. Zooming and panning in maps with paths is supported, and paths are drawn dynamically. Street-Level View Created with Paths Data Binding Support Essential Maps now offers data binding support for labels, symbols, and paths. This allows labels, symbols, and paths to be generated from a bound ItemSource collection. Importing and Exporting Map Elements Map elements such as paths, labels, and symbols can be persisted through an.xml file via serialization. Virtualization Virtualization support has been added to Essential Maps to improve performance. 38 P a g e

39 Windows Forms Essential Grid for Windows Forms Visual Styles This feature enables you to apply visual styles to a grid and its associated controls. You can apply visual styles to the grid, grid scrollbar, and cell-embedded controls like push buttons. It is not mandatory to specify the theme for every control individually. Essential Tools for Windows Forms Applying Visual Styles to a Grid SplitButton Control The SplitButton control allows you to create a drop-down button-like interface that is a combination of a regular button and a drop-down list, giving you a single element with multiple options. The default value is set as the button s caption, and the other values are listed in the button s drop-down list. 39 P a g e


40 Customized Split Button Customized Split Button Split Button in Checked State Drop-down Split Button Essential Chart for Windows Forms Localization Support The user interface of a chart can be customized to display chart data according to the language and culture specific to a particular country or region. This is done through easily added resource files. Context menu items, exception messages, and some toolbar items can also be localized. Localized Chart Context Menu 40 P a g e

41 ToolTips for Chart Axis Labels This feature enables users to add customized ToolTips to chart axis labels. For instance, if a chart axis label s text is too long to display in the space provided, the ToolTip for the label can show the full text. Custom Chart Axis Label ToolTip 41 P a g e

42 Windows Phone Essential Tools for Windows Phone Jumplists This control allows users to jump to a specific category in a list instead of having to scroll through the body of it. For example, when you want to select a contact, you can jump to contacts starting with specific letters. Jump buttons will be enabled or disabled based on the item s availability. Jumplist Category Menu Jumplist Items 42 P a g e

43 Range Slider Control Using this control you can set a price range to select products, or specify a time range to filter sale reports for a specific period of time. You can set the range by dragging the thumb or clicking on the slider bar. You can orient the slider vertical or horizontal as needed. You can also customize the appearance of the slider. Range Slider in Horizontal Mode Range Slider in Vertical Mode Toolbar Control The toolbar control common in desktop apps is now available for Windows Phone. A toolbar is a graphical presentation of frequently used commands optimized for efficient access. 43 P a g e


44 Sample Toolbars Color Picker Control A color picker control enables you to select a desired color from a predefined color palette. You can use this control to customize elements such as background, foreground, image border color, and so on. You can define the colors by editing the RGB or alpha values. 44 P a g e

45 Color Picker in Portrait Orientation Timespan Picker Control The Timespan Picker control enables you to provide the option to select a time span in your applications. This control is useful for reminder functionalities and count-down timers. Supported timespan elements include day, hour, minute, and second. You can customize the timespan format as needed. 45 P a g e
46 Timespan Picker Timespan Picker in Edit Mode ToolTip Control This control allows you to display more information about a UI element. Since there is no mouse hover event in the phone environment, ToolTips are displayed on tap event. You can customize the content and appearance of ToolTips. 46 P a g e

47 Cloud-Shaped ToolTip Ellipse-Shaped ToolTip Dialog Control The Dialog control can act as either a modal or modeless dialog for displaying information. You can display alert and prompt dialogs using this tool. When a modal dialog is displayed, it will prevent the user from interacting with the parent application. 47 P a g e


48 Custom Dialog Prompt Dialog Essential Maps for Windows Phone Importing and Exporting Map Elements Essential Maps for Windows Phone now supports saving and loading maps as.xml files for viewing at a later time, and exporting maps as images. 48 P a g e

49 Map Persisted as an XML File Path Support This feature enables you to draw paths in a map to depict routes, for example. You can add paths to a map by specifying the points, and add labels to those paths. While performing zoom and pan operations, paths are automatically updated. You can customize the path style. This feature can be used to create a street-level view in a map. 49 P a g e
50 Paths Added to a Map Data Binding Support Essential Maps now provides data binding support for labels, symbols, and paths, allowing you to add these things to a map from a data source. 50 P a g e
51 Data-Bound Map Virtualization Virtualization renders only the visible portion of a map, thereby tremendously improving the rendering speed of the map while zooming and scrolling. 51 P a g e
Road Map for Essential Studio 2011 Volume 4
 Road Map for Essential Studio 2011 Volume 4 Essential Studio User Interface Edition... 4 ASP.NET...4 Essential Tools for ASP.NET... 4 Essential Chart for ASP.NET... 4 Essential Diagram for ASP.NET... 4
Road Map for Essential Studio 2010 Volume 1
 Road Map for Essential Studio 2010 Volume 1 Essential Studio User Interface Edition... 4 Essential Grid... 4 Essential Grid ASP.NET... 4 Essential Grid ASP.NET MVC... 4 Essential Grid Windows Forms...
Road Map. For Essential Studio Volume 3
 Road Map For Essential Studio 2013 Volume 3 Essential Studio User Interface Controls... 4 JavaScript... 4 UI Suite of JavaScript Controls... 4 WinRT... 4 Grid for WinRT... 4 Diagram for WinRT... 5 Chart
SYNCFUSION ESSENTIAL STUDIO ENTERPRISE EDITION
 Move beyond simply coding applications to delivering business innovation with Syncfusion's award-winning.net components and controls. Syncfusion tools help developers create elegant user interfaces, business
What s New Essential Studio User Interface Edition
 What s New Essential Studio User Interface Edition Table of Contents Essential Grid... 3 Grid for ASP.NET... 3 Grid for ASP.NET MVC... 3 Grid for Silverlight... 9 Grid for WPF... 10 Essential Tools...
Road Map for Essential Studio 2011 Volume 2
 Road Map for Essential Studio 2011 Volume 2 Essential Studio User Interface Edition... 3 Windows Phone... 3 Essential Tools for WP7... 3 Essential Chart for WP7... 3 Essential Gauge for WP7... 3 ASP.NET...
SYNCFUSION ESSENTIAL STUDIO ENTERPRISE EDITION
 Move beyond simply coding applications to delivering business innovation with Syncfusion's award-winning.net components and new JavaScript libraries. Syncfusion tools help developers create elegant user
Working with Charts Stratum.Viewer 6
 Working with Charts Stratum.Viewer 6 Getting Started Tasks Additional Information Access to Charts Introduction to Charts Overview of Chart Types Quick Start - Adding a Chart to a View Create a Chart with
What s New Essential Studio User Interface Edition, 2011 Volume 2
 What s New Essential Studio User Interface Edition, 2011 Volume 2 Contents Windows Phone 7...5 Essential Tools for Windows Phone 7: Editors Package...5 NumericUpDown Control...5 Enabling Editing...6 Intervals...7
Desktop Studio: Charts. Version: 7.3
 Desktop Studio: Charts Version: 7.3 Copyright 2015 Intellicus Technologies This document and its content is copyrighted material of Intellicus Technologies. The content may not be copied or derived from,
Desktop Studio: Charts
 Desktop Studio: Charts Intellicus Enterprise Reporting and BI Platform Intellicus Technologies info@intellicus.com www.intellicus.com Working with Charts i Copyright 2011 Intellicus Technologies This document
Tree and Data Grid for Micro Charts User Guide
 COMPONENTS FOR XCELSIUS Tree and Data Grid for Micro Charts User Guide Version 1.1 Inovista Copyright 2009 All Rights Reserved Page 1 TABLE OF CONTENTS Components for Xcelsius... 1 Introduction... 4 Data
ESSENTIAL STUDIO 2014 V O L U M E 2
 ESSENTIAL STUDIO 2014 V O L U M E 2 Essential Studio Controls... 4 WinRT... 4 Universal App Support... 4 MaskEdit for WinRT... 4 Schedule for WinRT... 4 DataGrid for WinRT... 4 Chart for WinRT... 5 Gauge
Table of Contents 1-4. User Guide 5. Getting Started 6. Report Portal 6. Creating Your First Report Previewing Reports 11-13
 Table of Contents Table of Contents 1-4 User Guide 5 Getting Started 6 Report Portal 6 Creating Your First Report 6-11 Previewing Reports 11-13 Previewing Reports in HTML5 Viewer 13-18 Report Concepts
XD++ Professional Edition -- it is designed for building professional flow diagramming applications only.
 UCanCode XD++ MFC Library is the World's leading diagramming component / diagramming solution for Visual Studio. It is is a fully managed, extensible and powerful diagramming framework, which can help
Lesson 19 Organizing and Enhancing Worksheets
 Organizing and Enhancing Worksheets Computer Literacy BASICS: A Comprehensive Guide to IC 3, 5 th Edition 1 Objectives Hide, show, and freeze columns and rows. Create, rename, and delete worksheets. Change
Press the Plus + key to zoom in. Press the Minus - key to zoom out. Scroll the mouse wheel away from you to zoom in; towards you to zoom out.
 Navigate Around the Map Interactive maps provide many choices for displaying information, searching for more details, and moving around the map. Most navigation uses the mouse, but at times you may also
SAS Visual Analytics 8.2: Working with Report Content
 SAS Visual Analytics 8.2: Working with Report Content About Objects After selecting your data source and data items, add one or more objects to display the results. SAS Visual Analytics provides objects
Kendo UI. Builder by Progress : Using Kendo UI Designer
 Kendo UI Builder by Progress : Using Kendo UI Designer Copyright 2017 Telerik AD. All rights reserved. December 2017 Last updated with new content: Version 2.1 Updated: 2017/12/22 3 Copyright 4 Contents
Using Microsoft Office 2003 Intermediate Word Handout INFORMATION TECHNOLOGY SERVICES California State University, Los Angeles Version 1.
 Using Microsoft Office 2003 Intermediate Word Handout INFORMATION TECHNOLOGY SERVICES California State University, Los Angeles Version 1.2 Summer 2010 Table of Contents Intermediate Microsoft Word 2003...
Contents. Introduction 13. Putting The Smart Method to Work 16. Session One: Basic Skills 23
 Contents Introduction 13 Feedback... 13 Downloading the sample files... 13 Problem resolution... 13 Typographical Conventions Used In This Book... 14 Putting The Smart Method to Work 16 Excel version and
Microsoft Excel 2016 / 2013 Basic & Intermediate
 Microsoft Excel 2016 / 2013 Basic & Intermediate Duration: 2 Days Introduction Basic Level This course covers the very basics of the Excel spreadsheet. It is suitable for complete beginners without prior
What can Word 2013 do?
 Mary Ann Wallner What can Word 2013 do? Provide the right tool for: Every aspect of document creation Desktop publishing Web publishing 2 Windows 7: Click Start Choose Microsoft Office > Microsoft Word
Keynote 08 Basics Website:
 Website: http://etc.usf.edu/te/ Keynote is Apple's presentation application. Keynote is installed as part of the iwork suite, which also includes the word processing program Pages and the spreadsheet program
Microsoft Word 2010 : Tables
 Microsoft Word 2010 : Tables A table is a structure of vertical columns and horizontal rows. Each column and row will have a heading. Heading 1 Heading 2 At the intersection of each column and row is a
Introduction Accessing MICS Compiler Learning MICS Compiler CHAPTER 1: Searching for Data Surveys Indicators...
 Acknowledgement MICS Compiler is a web application that has been developed by UNICEF to provide access to Multiple Indicator Cluster Survey data. The system is built on DevInfo technology. 3 Contents Introduction...
Creating a Basic Chart in Excel 2007
 Creating a Basic Chart in Excel 2007 A chart is a pictorial representation of the data you enter in a worksheet. Often, a chart can be a more descriptive way of representing your data. As a result, those
Chapter 4. Microsoft Excel
 Chapter 4 Microsoft Excel Topic Introduction Spreadsheet Basic Screen Layout Modifying a Worksheet Formatting Cells Formulas and Functions Sorting and Filling Borders and Shading Charts Introduction A
Office Applications II Lesson Objectives
 Office Applications II Lesson Unit 1: MICROSOFT EXCEL SPREADSHEETS BASICS What is a Spreadsheet and What Are Its Uses? Define spreadsheets Define the Microsoft Excel application List business, consumer,
ActiveReports 12 Server 1
 ActiveReports 12 Server 1 Table of Contents Table of Contents 1-2 ActiveReports 12 Server Designer User Guide 3 Report Portal 3-7 Mobile Report Portal 7-11 Get Started with ActiveReports Web Designer 11-12
Numbers Basics Website:
 Website: http://etc.usf.edu/te/ Numbers is Apple's new spreadsheet application. It is installed as part of the iwork suite, which also includes the word processing program Pages and the presentation program
Contents. Introduction 15. How to use this course 18. Session One: Basic Skills 21. Session Two: Doing Useful Work with Excel 65
 Contents Introduction 15 Downloading the sample files... 15 Problem resolution... 15 The Excel version and locale that were used to write this book... 15 Typographical Conventions Used in This Book...
MS Word 2010 An Introduction
 MS Word 2010 An Introduction Table of Contents The MS Word 2010 Environment... 1 The Word Window Frame... 1 The File Tab... 1 The Quick Access Toolbar... 4 To Customize the Quick Access Toolbar:... 4
Creating Reports in Access 2007 Table of Contents GUIDE TO DESIGNING REPORTS... 3 DECIDE HOW TO LAY OUT YOUR REPORT... 3 MAKE A SKETCH OF YOUR
 Creating Reports in Access 2007 Table of Contents GUIDE TO DESIGNING REPORTS... 3 DECIDE HOW TO LAY OUT YOUR REPORT... 3 MAKE A SKETCH OF YOUR REPORT... 3 DECIDE WHICH DATA TO PUT IN EACH REPORT SECTION...
Microsoft Office PowerPoint 2013 Courses 24 Hours
 Microsoft Office PowerPoint 2013 Courses 24 Hours COURSE OUTLINES FOUNDATION LEVEL COURSE OUTLINE Using PowerPoint 2013 Opening PowerPoint 2013 Opening a Presentation Navigating between Slides Using the
Book 5. Chapter 1: Slides with SmartArt & Pictures... 1 Working with SmartArt Formatting Pictures Adjust Group Buttons Picture Styles Group Buttons
 Chapter 1: Slides with SmartArt & Pictures... 1 Working with SmartArt Formatting Pictures Adjust Group Buttons Picture Styles Group Buttons Chapter 2: Slides with Charts & Shapes... 12 Working with Charts
What s New for WinRT. Essential Studio Enterprise Edition 2013 Volume 2
 What s New for WinRT Essential Studio Enterprise Edition 2013 Volume 2 Contents WinRT (XAML)... 3 Essential Grid... 3 Cell Types and Cell Formatting... 3 Freeze Group Caption Row... 3 On-Demand Paging...
Microsoft How to Series
 Microsoft How to Series Getting Started with EXCEL 2007 A B C D E F Tabs Introduction to the Excel 2007 Interface The Excel 2007 Interface is comprised of several elements, with four main parts: Office
Microsoft Office Excel
 Microsoft Office 2007 - Excel Help Click on the Microsoft Office Excel Help button in the top right corner. Type the desired word in the search box and then press the Enter key. Choose the desired topic
SPARK. User Manual Ver ITLAQ Technologies
 SPARK Forms Builder for Office 365 User Manual Ver. 3.5.50.102 0 ITLAQ Technologies www.itlaq.com Table of Contents 1 The Form Designer Workspace... 3 1.1 Form Toolbox... 3 1.1.1 Hiding/ Unhiding/ Minimizing
EXCEL 2003 DISCLAIMER:
 EXCEL 2003 DISCLAIMER: This reference guide is meant for experienced Microsoft Excel users. It provides a list of quick tips and shortcuts for familiar features. This guide does NOT replace training or
A Guide to Quark Author Web Edition 2015
 A Guide to Quark Author Web Edition 2015 CONTENTS Contents Getting Started...4 About Quark Author - Web Edition...4 Smart documents...4 Introduction to the Quark Author - Web Edition User Guide...4 Quark
Word Tutorial 3. Creating a Multiple- Page Report COMPREHENSIVE
 Word Tutorial 3 Creating a Multiple- Page Report COMPREHENSIVE Objectives Format headings with Quick Styles Insert a manual page break Create and edit a table Sort rows in a table Modify a table s structure
GraphWorX64 Productivity Tips
 Description: Overview of the most important productivity tools in GraphWorX64 General Requirement: Basic knowledge of GraphWorX64. Introduction GraphWorX64 has a very powerful development environment in
course notes quick reference guide
 course notes quick reference guide Microsoft Excel 2010 Welcome to Excel 2010 Excel 2010 is the premier spreadsheet application from Microsoft. Excel 2010 makes it easier to analyze data quickly with new
OX Documents Release v Feature Overview
 OX Documents Release v7.8.4 Feature Overview 1 Objective of this Document... 3 1.1 The Purpose of this Document... 3 2 General Improvements... 4 2.1 Security First: Working with Encrypted Files (OX Guard)...
Telerik Corp. Test Studio Standalone & Visual Studio Plug-In Quick-Start Guide
 Test Studio Standalone & Visual Studio Plug-In Quick-Start Guide Contents Create your First Test... 3 Standalone Web Test... 3 Standalone WPF Test... 6 Standalone Silverlight Test... 8 Visual Studio Plug-In
Microsoft Visio 2016 Foundation. Microsoft Visio 2016 Foundation Level North American Edition SAMPLE
 Microsoft Visio 2016 Foundation Microsoft Visio 2016 Foundation Level North American Edition Visio 2016 Foundation - Page 2 2015 Cheltenham Group Pty. Ltd. All trademarks acknowledged. E&OE. No part of
WORD Creating Objects: Tables, Charts and More
 WORD 2007 Creating Objects: Tables, Charts and More Microsoft Office 2007 TABLE OF CONTENTS TABLES... 1 TABLE LAYOUT... 1 TABLE DESIGN... 2 CHARTS... 4 PICTURES AND DRAWINGS... 8 USING DRAWINGS... 8 Drawing
Glossary. advance: to move forward
 Computer Computer Skills Glossary Skills Glossary advance: to move forward alignment tab: the tab in the Format Cells dialog box that allows you to choose how the data in the cells will be aligned (left,
Report Designer Report Types Table Report Multi-Column Report Label Report Parameterized Report Cross-Tab Report Drill-Down Report Chart with Static
 Table of Contents Report Designer Report Types Table Report Multi-Column Report Label Report Parameterized Report Cross-Tab Report Drill-Down Report Chart with Static Series Chart with Dynamic Series Master-Detail
Components for Xcelsius. Micro Components
 Components for Xcelsius Micro Components Inovista Micro Components for Xcelsius Inovista provides a full range of spark lines, micro charts, icons, text and shape indicators that can be deployed to create
Quick Access Toolbar. You click on it to see these options: New, Open, Save, Save As, Print, Prepare, Send, Publish and Close.
 Opening Microsoft Word 2007 in the practical room UNIT-III 1 KNREDDY 1. Nyelvi beállítások az Office 2007-hez (Language settings for Office 2007 (not 2003)) English. 2. Double click on the Word 2007 icon
IBM TRIRIGA Application Platform Version 3.3. Graphics User Guide. Copyright IBM Corp i
 IBM TRIRIGA Application Platform Version 3.3 Graphics User Guide Copyright IBM Corp. 2011 i Note Before using this information and the product it supports, read the information in Notices on page 33. This
BIM II IC3 & MOS Certification Pacing Guide
 BIM II IC3 & MOS Certification Pacing Guide 1st 9 Weeks IC3 Certification Computer Fundamentals Mobile Devices Using cell phones, voicemail, SMS, notifications Hardware Device types, storage, networking,
Using Microsoft Word. Working With Objects
 Using Microsoft Word Many Word documents will require elements that were created in programs other than Word, such as the picture to the right. Nontext elements in a document are referred to as Objects
SharePoint List Booster Features
 SharePoint List Booster Features Contents Overview... 5 Supported Environment... 5 User Interface... 5 Disabling List Booster, Hiding List Booster Menu and Disabling Cross Page Queries for specific List
INFRAGISTICS WPF 15.2 Service Release Notes September 2016
 INFRAGISTICS WPF 15.2 Service Release Notes September 2016 Raise the Bar on Both BI and Desktop UI with Infragistics WPF Controls Infragistics WPF controls provide breadth and depth in enabling developers
Excel 2010 Level 1: The Excel Environment
 Excel 2010 Level 1: The Excel Environment Table of Contents The Excel 2010 Environment... 1 The Excel Window... 1 File Tab... 1 The Quick Access Toolbar... 4 Access the Customize the Quick Access Toolbar
Excel 2003 Tutorial II
 This tutorial was adapted from a tutorial by see its complete version at http://www.fgcu.edu/support/office2000/excel/index.html Excel 2003 Tutorial II Charts Chart Wizard Chart toolbar Resizing a chart
To be able to create charts that graphically represent your worksheet data, you will: Create column charts on chart sheets by using the F11 key.
 L E S S O N 1 Creating charts Suggested teaching time 55-65 minutes Lesson objectives To be able to create charts that graphically represent your worksheet data, you will: a b c Create column charts on
11.1 Create Speaker Notes Print a Presentation Package a Presentation PowerPoint Tips... 44
 Contents 1 Getting Started... 1 1.1 Presentations... 1 1.2 Microsoft Office Button... 1 1.3 Ribbon... 2 1.4 Mini Toolbar... 2 1.5 Navigation... 3 1.6 Slide Views... 4 2 Customize PowerPoint... 5 2.1 Popular...
Microsoft Excel 2010 Basic
 Microsoft Excel 2010 Basic Introduction to MS Excel 2010 Microsoft Excel 2010 is a spreadsheet software in the new Microsoft 2010 Office Suite. Excel allows you to store, manipulate and analyze data in
Creating and Modifying Charts
 Creating and Modifying Charts Introduction When you re ready to share data with others, a worksheet might not be the most effective way to present the information. A page full of numbers, even if formatted
Creating a Spreadsheet by Using Excel
 The Excel window...40 Viewing worksheets...41 Entering data...41 Change the cell data format...42 Select cells...42 Move or copy cells...43 Delete or clear cells...43 Enter a series...44 Find or replace
SAS Visual Analytics 8.2: Getting Started with Reports
 SAS Visual Analytics 8.2: Getting Started with Reports Introduction Reporting The SAS Visual Analytics tools give you everything you need to produce and distribute clear and compelling reports. SAS Visual
Table of Contents. Windows Interface Elements (Home Page) Contents. Select Chart... Elements
 Contents. Select Chart... Elements") Contents Table of Contents Windows Interface Elements (Home Page) 1 Charting... 8 Chart Wizard... 9 Chart Type... Page 11 Appearance... Page 12 Series Page... 14 Data Page... 16 Chart Page... 19 Diagram
Contents Table of Contents Windows Interface Elements (Home Page) 1 Charting... 8 Chart Wizard... 9 Chart Type... Page 11 Appearance... Page 12 Series Page... 14 Data Page... 16 Chart Page... 19 Diagram
SAS Web Report Studio 3.1
 SAS Web Report Studio 3.1 User s Guide SAS Documentation The correct bibliographic citation for this manual is as follows: SAS Institute Inc. 2006. SAS Web Report Studio 3.1: User s Guide. Cary, NC: SAS
Gloucester County Library System EXCEL 2007
 Gloucester County Library System EXCEL 2007 Introduction What is Excel? Microsoft E x c e l is an electronic s preadsheet program. I t is capable o f performing many diff e r e n t t y p e s o f c a l
Fusion. CBR Fusion MLS Level 1 Core Functions. Class Handout
 Fusion 1 CBR Fusion MLS Level 1 Core Functions Class Handout GETTING STARTED IN FUSION Logging On and Off To log on to Fusion MLS: 1. Type your user name in the User ID box. 2. Type your password in the
IBM Forms V8.0 IBM Forms Classic - Forms Designer IBM Corporation
 IBM Forms V8.0 IBM Forms Classic - Forms Designer Agenda IBM Forms Designer Overview IBM Forms Designer Views IBM Forms Designer Features 2 IBM Forms 8.0 Designer What's New Mixed orientation printing
Your Total Training Resource. Microsoft OneNote. To Schedule / Need Additional Information
 Microsoft OneNote It's your very own digital notebook, so you can keep notes, ideas, web pages, photos, even audio and video all in one place. Whether you're at home, in the office, or on the move, you
Using Chart components
 Using Chart components Page 1 of 5 Using Chart components Charts allow you to represent data visually to make it easy for users to see comparisons, patterns, and trends. Xcelsius includes the following
Microsoft Excel 2010 Part 2: Intermediate Excel
 CALIFORNIA STATE UNIVERSITY, LOS ANGELES INFORMATION TECHNOLOGY SERVICES Microsoft Excel 2010 Part 2: Intermediate Excel Spring 2014, Version 1.0 Table of Contents Introduction...3 Working with Rows and
How to create interactive documents
 Adobe InDesign Guide How to create interactive documents You can use Adobe InDesign to create dynamic web content or interactive documents. InDesign supports export to web-ready HTML or interactive PDF.
Introduction to tabs and tables
 L E S S O N 5 Introduction to tabs and tables Suggested teaching time 40-50 minutes Lesson objectives To work with tab stops and tables in your document, you will: a b c Identify, set, edit, and remove
INTRODUCTION 4 WHAT S NEW IN USING SEAVUS PROJECT VIEWER 5 BENEFITS OF USING SEAVUS PROJECT VIEWER 5 MENUS 7 TOOLBARS 19 RIBBONS 27
 Contents Contents INTRODUCTION 4 WHAT S NEW IN USING SEAVUS PROJECT VIEWER 5 BENEFITS OF USING SEAVUS PROJECT VIEWER 5 MENUS 7 TOOLBARS 19 RIBBONS 27 WALKTHROUGH SEAVUS PROJECT VIEWER RIBBONS 35 VIEWS
COURSE CONTENT EXCEL BASIC ONE DAY
 COURSE CONTENT EXCEL BASIC ONE DAY SOME OF THE BENEFITS OF USING A SPREADSHEET STARTING EXCEL GETTING YOURSELF ORIENTATED WITH THE EXCEL SCREEN THE OFFICE BUTTON/FILE TAB THE TITLE BAR THE RIBBONS GROUPS
KODAK Software User s Guide. Software Version 9.0
 KODAK Create@Home Software User s Guide Software Version 9.0 Table of Contents 1 Welcome to KODAK Create@Home Software Features... 1-1 Supported File Formats... 1-1 System Requirements... 1-1 Software
DOT.NET MODULE 6: SILVERLIGHT
 UNIT 1 Introducing Silverlight DOT.NET MODULE 6: SILVERLIGHT 1. Silverlight and Visual Studio 2. Understanding Silverlight Websites 3. Creating a Stand-Alone Silverlight Project 4. Creating a Simple Silverlight
Quick Reference Card Business Objects Toolbar Design Mode
 Icon Description Open in a new window Pin/Unpin this tab Close this tab File Toolbar New create a new document Open Open a document Select a Folder Select a Document Select Open Save Click the button to
FactoryLink 7. Version 7.0. Client Builder Reference Manual
 FactoryLink 7 Version 7.0 Client Builder Reference Manual Copyright 2000 United States Data Corporation. All rights reserved. NOTICE: The information contained in this document (and other media provided
BusinessObjects Frequently Asked Questions
 BusinessObjects Frequently Asked Questions Contents Is there a quick way of printing together several reports from the same document?... 2 Is there a way of controlling the text wrap of a cell?... 2 How
Answer: D. Answer: B. Answer: C. Answer: C. Answer: B
 1. Which of the following software programs is used to create a collection of slides that may contain text, charts, pictures, sound movies, or multimedia, and is often called a presentation graphics program?
Insight: Measurement Tool. User Guide
 OMERO Beta v2.2: Measurement Tool User Guide - 1 - October 2007 Insight: Measurement Tool User Guide Open Microscopy Environment: http://www.openmicroscopy.org OMERO Beta v2.2: Measurement Tool User Guide
button Double-click any tab on the Ribbon to minimize it. To expand, click the Expand the Ribbon button
 PROCEDURES LESSON 1: CREATING WD DOCUMENTS WITH HEADERS AND FOOTERS Starting Word 1 Click the Start button 2 Click All Programs 3 Click the Microsoft Office folder icon 4 Click Microsoft Word 2010 1 Click
Business Intelligence and Reporting Tools
 Business Intelligence and Reporting Tools Release 1.0 Requirements Document Version 1.0 November 8, 2004 Contents Eclipse Business Intelligence and Reporting Tools Project Requirements...2 Project Overview...2
Spreadsheets Microsoft Office Button Ribbon
 Getting started with Excel 2007 you will notice that there are many similar features to previous versions. You will also notice that there are many new features that you ll be able to utilize. There are
Keynote Basics Website:
 Keynote Basics Website: http://etc.usf.edu/te/ Keynote is Apple's presentation application. Keynote is installed as part of the iwork suite, which also includes the word processing program Pages. If you
Microsoft PowerPoint 2016 Basics Unit 9 Final Review - Student Notes Directions: Fill in the blanks.
 Directions: Fill in the blanks. 1. PowerPoint Window Layout 2. File Tab When clicked, opens - automatically opens the Info option by default Holds the following options: - Info - New - Open - Save - Save
MindManager Browser Application Release Notes
 MindManager Browser Application Release Notes September 22, 2017 Release version: 2.0 MindManager Browser Application Version 2.0... 2 General Information... 2 New in Version 2.0... 2 Supported Features...
Creating Charts in Office 2007 Table of Contents
 Table of Contents Microsoft Charts... 1 Inserting a Chart in Excel... 1 Tip Shortcut Key to Create a Default Chart in Excel... 2 Activating Your Chart... 2 Resizing an Embedded Chart... 2 Moving a Chart...
Cognos. Active Reports Development. Presented by: Craig Randell
 Cognos Active Reports Development Presented by: Craig Randell Objectives: Understand the purpose and benefits of Active Reports Through theory and demonstration introduce the different Active Report Components
Arkansas Curriculum Framework for Computer Applications II
 A Correlation of DDC Learning Microsoft Office 2010 Advanced Skills 2011 To the Arkansas Curriculum Framework for Table of Contents Unit 1: Spreadsheet Formatting and Changing the Appearance of a Worksheet
HOUR 12. Adding a Chart
 HOUR 12 Adding a Chart The highlights of this hour are as follows: Reasons for using a chart The chart elements The chart types How to create charts with the Chart Wizard How to work with charts How to
CHRIST THE KING BOYS MATRIC HR. SEC. SCHOOL, KUMBAKONAM CHAPTER 2 TEXT FORMATTING
 CHAPTER 2 TEXT FORMATTING 1. Explain how to create a Bulleted and Numbered List in Star Office Writer? One way to create a list of points or topics in a document is to create a bulleted list. A bullet
Business Office Specialist
 EXAM INFORMATION Items 49 Points 82 Prerequisites NONE Grade Level 10-12 Course Length ONE SEMESTER Career Cluster BUSINESS MANAGEMENT AND ADMINISTRATION DESCRIPTION This course applies advanced concepts
Using Sitecore 5.3.1
 Using Sitecore 5.3.1 An End-User s Guide to Using and Administrating Sitecore Author: Sitecore Corporation Date: December 12, 2007 Release: Rev. 1.0 Language: English Sitecore is a registered trademark.
MindManager HTML5 Export Release Notes
 MindManager HTML5 Export Release Notes April 7, 2017 Release version: 1.3 MindManager HTML5 Export Version 1.3... 2 General Information... 2 New In This Version... 2 Supported Features... 3 Elements...
Introduction to Microsoft Office PowerPoint 2010
 Introduction to Microsoft Office PowerPoint 2010 TABLE OF CONTENTS Open PowerPoint 2010... 1 About the Editing Screen... 1 Create a Title Slide... 6 Save Your Presentation... 6 Create a New Slide... 7