|
|
|
- Blake Edwards
- 6 years ago
- Views:
Transcription
1
2
3
4
5
6
7
8


9 Prepareed For: Prepareed By:
10 Services provided pursuant to this agreement are intended solely for the use and benefit of Pro-ROV Services and The Marin Municipal Water District. No other person or entity shall be entitled to rely on the services, opinions, recommendations, plans or specifications provided pursuant to this agreement without the express written consent of CLE Engineering.
11 TABLE OF CONTENTS Page No. 1. INTRODUCTION Purpose and Scope 5 2. METHODS Survey Control Datums Multibeam Bathymetric Survey Equipment Survey Vessel Multibeam Echo Sounder Motion Reference Unit RTK-GPS Speed of Sound Measurements Singlebeam Bathymetric Survey Data Collection Lidar Data 9 3. QUALITY ASSURANCE / QUALITY CONTROl Survey Control Point Check In Multibeam Bathymetric Surveys Survey Planning Patch Tests Patch Tests Results Fathometer Barcheck Results Lidar Data Integration SURVEY RESULTS Data Collection Time Periods Survey Data Coverage Data Reduction Multibeam Data Singlebeam Data Bathymetric Survey Data Accuracy Assessment Cartography Volumetric Analysis REFEENCES Figures 21 Appendix A Appendix B Appendix C Appendix D Appendix E Equipment Specifications Multibeam Calibration Report Singlebeam Barcheck Contour Maps Stage Storage Table - 3 -
12 List of Acronyms Abbreviation Definition DEM Digital Elevation Model HARN High Accuracy Reference Network LiDAR Light Detection and Ranging IHO International Hydrographic Organization MBES Multibeam Echosounder System MRU Motion Reference Unit NAD83 North American Datum NAVD88 North American Vertical Datum of 1988 NGS National Geodetic Survey NGS PID National Geodetic Survey Point Identification NGVD29 National Geodetic Vertical Datum of 1929 OPUS Online Positioning User Service PPK Post-Process Kinematic RTK-GPS Real-Time Kinematic GPS SAV Sub-aquatic Vegetation TIN Triangulated Irregular Network UTM Universal Transverse Mercator WSE Water Surface Elevation - 4 -
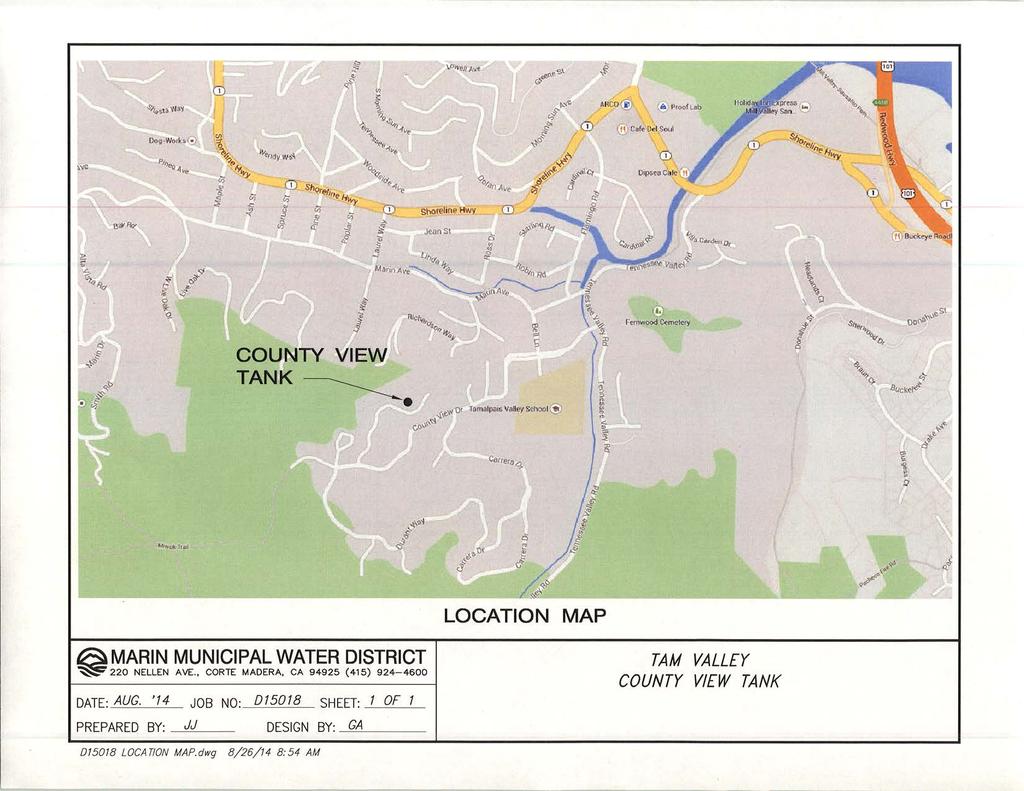
13 1. INTRODUCTION Bon Tempe Lake is one of 5 reservoirs located within the northern watershed of Mt. Tamalpais, west of the town of San Anselmo, CA. (Figure 1). The reservoir is located on Lagunitas Creek and is surrounded by Alpine lake to the west, Lake Lagunitas to the south and Phoenix Lake to the east. A detailed map of the reservoir has never been produced and thus a detailed analysis of the reservoir storage capacity is also lacking. The recent surveys and volumetric analysis have updated a critical need in terms of reservoir management. 1.1 PURPOSE AND SCOPE CLE Engineering (CLE- San Rafael, CA) was contracted by Pro-ROV Services and the Marin Municipal Water District (District) to collect high resolution bathymetric data throughout Bon Temp Reservoir located in unincorporated Marin County, CA. The purpose of the bathymetric survey is to 1) create a 1 Ft. contour interval map and, 2) perform a volumetric analysis of the reservoir with the goal of constructing a stage storage curve for the District. The bathymetric survey data was combined with high-resolution topographic LiDAR as well as Real- Time Kinematic GPS (RTK-GPS) data collected by the CLE field team. This supplemental topographic data was combined with the bathymetric data in order to create a seamless Digital Elevation Model (DEM) for the entire reservoir basin from the lowest elevation within the reservoir to the crest of the Bon Tempe spillway. This document outlines methods, procedures and results of the hydrographic surveys, DEM construction and volumetric analysis
14 2. METHODS 2.1 SURVEY CONTROL CLE Utilized a survey control network established by the Districts Survey Department. Figure 2 shows the location of control points utilized and Table 1 shows the X, Y and Z of each mark. Table 1 Control Points Utilized Point Id Northing Easting Elevation Notes CP Found cp base pt CP Found cp check in pt unknown Found cp check in pt. This point was a found point (on the dam crest) and does not correspond to points within the Districts survey database Datums NAD83 ( epoch) is used for horizontal values, and NAVD88 utilizing Geoid model 12A, is used for vertical values. The projection is the California Coordinate System Zone 3, Lambert Projection. Table 2 Survey Datums Horizontal GEOID Epoch H. Coordinate System Vertical Datum Units Datum Model Ca. State Plane (III) NAD NAVD 88 Geoid 12a US Ft. Lambert Projection (CCS) 2.2 MULTIBEAM BATHYMETRIC SURVEY EQUIPMENT CLE utilized a 26 Ft. custom-built survey vessel outfitted with a state-of-the-art multibeam system. A multibeam system is comprised of five components integrated into one robust, survey solution: 1) MBES transducer, 2) MBES processor, 3) motion reference unit (MRU), 4) RTK-GPS for positioning, 5) sound velocity probe and 6) data acquisition computer Survey Vessel The survey vessel (owned and operated by CLE) was outfitted with a Kongsburg EM3002 shallow water multibeam system which is comprised of a transducer head, a topside processing unit connected to a Intel / Windows based CPU and associated software; Hypack Version 2012 for navigation, sonar acquisition and patch tests. The 7101 system was integrated with an F-180 heading / heave / pitch / roll sensor ( motion reference unit - MRU) and a Real-Time Kinematic GPS (RTK-GPS) unit (Leica System 1200) for position and ellipsoid height updates. All specifications can be found in Appendix A The survey hardware (multibeam transducer, MRU, GPS antennas) was mounted on the same over-theside mount, which was designed and engineered specifically for multibeam operations. The advantage to - 6 -
15 no need to construct virtual lever-arms which are often a source of error. The field crew consisted of Jere Visali (Pro-ROV), James Kulpa (CLE), Darren Gewant, (CLE) and Kevin Tweed (CLE) Multibeam Echo Sounder The EM3002 is an advanced multibeam echo sounder with extremely high resolution and dynamically focused beams. It is very well suited for detailed reservoir mapping and inspection in water depths from 1 meter to approximately 150 meters. Due to its electronic pitch compensation system and roll stabilized beams, system performance is extremely stable in foul weather and rough water conditions. The spacing between soundings as well as the acoustic footprints, are set nearly constant over the swath in order to provide a uniform and high detection mapping performance. Dynamic focusing of all receive beams optimizes the system performance and resolution for short range applications. The EM3002 produces a swath of sonar approximately 3 to 4 times the water depth and collects approximately 10 soundings per square meter. Sound velocity was measured constantly at the transducer head using an Odom Digibar Pro sound velocity meter Motion Reference Unit The EM3002 transducer uses a Mills Cross type transducer array whereby a single wide angle transmit pulse (approx. 150 degrees) is emitted and an array of electronic receive beamformers process the return signal into an number of detected bottom depth points. In the case of the EM3002 echo sounder, 511 depths are detected and digitized per ping. Unlike a singlebeam echo sounder, depths from multibeam units are calculated from signal returns at extremely steep grazing angles from nadir. It is these outer beams that are most influenced by vessel motion and attitude. To compensate for the motion of the vessel, an accelerometer based motion reference unit (MRU) is installed on the vessel (in this case, it was installed above the transducer) to provide realtime heave, pitch, and roll measurements (50 Hertz) to the processing unit of the multibeam echo sounder. CLE utilized a CODA F-180 MRU which provides the survey markets one of the most accurate and reliable motion and heading data updated at a maximum rate of 75 Hz. The CODA F-180 consists of a single electronic box housing the internal electronic motion sensors coupled with two DGPS antennas which aid in position and heading calculations. The CODA F-180 was mounted in-line with the sonar transducer which provides a robust way to configure the geometry opposed to mounting the unit offset from the axis of the multibeam transducer and thus requiring the implementation of a long virtual lever arms
16 2.2.4 RTK-GPS The most common problem in accurately measuring the seafloor with any sonar-based system is the calculation of the tidal elevation offset. Commonly a tide staff or electronic gauge is deployed in one location near the survey site and is used to calculate the tides, or other types of water surface elevation changes (wind wave setup, reservoir draw-down) for the entire survey area. However, it is widely understood that non-linear tidal phenomena, phase lags and tidal gradients can drastically influence the water surface elevation (WSE) spatially throughout the survey area and therefore the use of a single point measurement is often unreliable. To avoid these potential WSE errors which can translate into significant departures from the true bottom depth, the survey crew utilized geodetic GPS with RTK baseline processing that is integrated with the multibeam and inertial navigation instruments. The motion and Geoid 12 compensated positions and orthometric elevations of the RTK-GPS data stream are tagged with each sonar ping. In effect, the RTK- GPS mounted on the hydrographic survey vessel acts as a roving tide gauge collecting the most accurate tidal measurements throughout the survey area. The survey team utilized a Leica System 1200 RTK base station and rover unit (mounted directly over the MRU and MB transducer) coupled with a Pacific Crest UHF radio modem. The RTK base station was set over CP3 for the duration of the survey (Section 2.1). In order to correct raw sounding data for tidal height changes, transducer ellipsoid heights were collected at a rate of 10Htz and stored into a Hypack proprietary file called an RTK tides file. A geoid separation value was then applied to this file in order to transform the fathometer elevations from ellipsoidal heights to orthometric heights (Ft. NAVD 88) Speed of Sound Measurements Fathometers calculate water depth by using algorithms based on the speed of sound through the water column. The survey crew utilized an Odom Digibar Pro speed of sound probe to measure sound velocity multiple times during each survey day (see Appendix A for specifications). Mounted near the end of the sound velocity probe is a high frequency "sing-around" transducer and its associated reflector. This precisely spaced pair is used to measure the velocity of sound in water by transmitting and receiving a signal across their known separation distance. 2.3 SINGLEBEAM BATHYMETRIC SURVEY DATA COLLECTION The numerous arms of the reservoir are characterized by extremely shallow waters and areas of subaquatic vegetation (SAV). Multibeam survey sonars are not well-suited for collecting data in shallow water and in areas where SAV is present. The field team anticipated this and mobilized specialized bathymetric survey technologies that are designed to collect data in this type of environment. Singlebeam data were also collected in order to provide in-fill gap data in areas where the multibeam point cloud and LiDAR point cloud do not overlap
17 The singlebeam surveys utilized Class 1 methods and accuracies as outlined in the Army Corps of Engineers January 2002 Hydrographic Surveying Manual (EM ). Bathymetric data were collected using an Odom Hydrotrac CVM survey-grade fathometer with a 3-degree, 200-kHz transducer. The transducer was mounted in a fathometer well (housing a mineral oil bath) that is located mid-ship through the hull in the keel. The Odom CVM records individual sonar returns from each surface that is encountered. Thus, the full spectrum of each sonar ping return is recorded. This includes the first return form the top of the SAV stand, and subsequent returns from the reservoir bottom (Figure 4). The full-spectrum echograms are than available to the Hydrographer during post-processing in order to analysis the sonar returns that are from the reservoir bottom and not sonar pings from the top of SAV. Position data were collected using the Leica System 1200 RTK-GPS mounted above the fathometer (no offset). Survey vessel motion (heave, pitch and roll) was measured using a TSS CMS-25 motion sensor (the motion sensor was also attached to the top of the fathometer). Vessel motion data were logged separately for inspection during data processing. Heave correction data were applied to the raw sounding data during reduction. Heading, pitch and roll were applied to the raw sounding data in order to correct for sounding positions for vessel pitch which can result in significant sounding positioning errors if the proper motion measurements are not applied (known as beam-steering). Squat corrections were added automatically to the raw sounding data depending on vessel speed and fuel consumption through the Hypack dynamic draft driver. The on-board data stream was collected using a Panasonic Toughbook CPU running Hypack Max (Version 2012) survey planning, data collection and reduction software. 2.4 LIDAR DATA In order to accurately calculated reservoir volumes to the limit of the spillway elevation, additional survey data was needed in order to supplement the bathymetric data. The bathymetric survey ensonified the reservoir basin from approximately the water line down, and since the water surface elevation was below the spillway, there is a data gap from the spillway to the waterline. LiDAR, which is an acronym for Light Detection and Ranging is a topographic survey technology that utilizes light in the form of a pulsed laser to measure ranges to topographic features. The returned light pulses, combined with the MRU data and position data, generate precise, three-dimensional information about the shape of the earth. In order to supplement the bathymetric data, CLE utilized LiDAR data collected by an MDL Dynascan laser scanner (See Appendix X for sensor specifications). The Dynascan is a fully integrated high speed laser scanner, high accuracy RTK-GPS positioning system and inertial measurement unit. CLE subcontracted a survey technician from MDL, in order to assist with LiDAR acquisition and QA/QC
18 3. QUALITY ASSURANCE / QUALITY CONTROL 3.1 SURVEY CONTROL POINT CHECK IN Quality assurance protocols call for a check-in survey (before each hydro survey day) to a known point in order to ensure proper equipment programming and instrument calibration. Table 3 presents reported and surveyed northings, eastings, and elevations for the survey benchmarks, CP3, CP4 and the unknown dam BM, on each survey date. As stated in Section 2.1, the found BM on the dam is unknown in terms of the County s database Table 3. Daily GPS Check-in Shots Mark Survey Date Reported Ca. Zone 3 (NAD 83) Northing (US Ft.) Easting (US Ft.) Reported Elevation NAVD 1988 (US Ft.) Daily Check-in Survey Results Ca. Zone 3 (NAD 83) US Northing (US Ft.) Easting (US Ft.) Surveyed Elevation NAVD 1988 (US Ft.) CP4 6/12/ dambm 6/12/14 n/a n/a n/a CP4 6/13/ dambm 6/13/14 n/a n/a n/a CP4 8/14/ dambm 8/14/14 n/a n/a n/a CP4 8/ All topographic survey shots were captured when the combined horizontal and vertical error value was 0.07 or less. This detailed, raw point metadata is available upon request. The daily tie surveys met all quality control standards. 3.2 MULTIBEAM BATHYMETRIC SURVEYS Multibeam swath sonar systems combine a complex array of instruments and sensors, consisting of the transducer, motion sensor, gyrocompass, and geodetic GPS system. Standards developed by the International Hydrographic Organization (IHO USACE Standards for Hydrographic Surveys, and the NOS Hydrographic Surveys Specifications and Deliverables for shallow water (<30 m) hydrography (IHO 1987; USACE 2003; NOS 2003) are used as the protocol for calibration. Proper alignment of these instruments with one another and with the vessel s reference frame is critical to achieve the high-accuracy required by the project. Calculation of the horizontal and vertical offsets between each of the sensors is followed by a series of lake-based measurements known as patch tests. The patch test is performed to calculate several residual biases influenced by the dynamics of the survey vessel and the alignment of the instruments. Results of the patch test are used to calculate a pitch, roll and heading offset and positioning time delay or navigation latency. Additional calibration measures are performed in the field including comparison of nadir depths with a lead line and frequent sound velocity profiles (SVP). Numerous daily sound velocity
19 measurements were taken throughout the water column in the deepest area of the site. The entire sound velocity profile was then loaded into the Corrections Parameters within Hypack Hysweep acquisition software Survey Planning The generation of pre-determined survey vessel navigation lines is essential if near 100% bottom coverage is the goal. Since the sonar swath width is directly related to water column depths it is important that the navigation lines in a line plan are spaced such that the ends of the sonar swath on each survey line overlap at least 50% of the adjacent lines. This overlapping of survey swaths is not only essential for coverage, it is a key QA / QC tool in that bottom elevations can be compared from two different survey swaths run in opposite directions at different times Patch Tests To ensure data quality, the installation and subsequent calibration of the integrated multibeam echo sounder system is dependent on a proper system alignment. EDS uses Hypack hydrographic data processing software which provides a facility for accurately representing system alignment. The Hypack Vessel File (HVF) allows for the Hydrographer to easily define the survey sensor configuration for accurate processing of virtually any survey platform. Sensor offsets and errors are time tagged which allows for the HVF to be utilized for the life of the survey vessel and evolve as changes are made to the survey platform. The Hyapck Vessel Editor also provides a 3D view of the vessel and survey sensors for visualization of the sensor offsets. Multibeam echo sounder calibrations must be designed carefully and individually in consideration of systems, vessel, location, environmental conditions and survey requirements. The calibration procedure should determine or verify system offsets and calibration correctors (residual system biases) for draft (static and dynamic), horizontal position control (RTK-GPS), navigation timing error, heading, roll, and pitch. These procedures are used to measure static navigation timing error, transducer pitch offset, transducer roll offset, and transducer azimuth offset (yaw). Patch tests are performed after initial mobilization, and periodically thereafter if sensors are modified during the survey, to quantify any residual biases from the initial system alignment. During this calibration series, four separate tests are performed to determine residual alignment biases for: Position Time Delay (Latency) Pitch Offset Roll Offset Yaw/Azimuthal Offset
20 GPS Latency Measurement A latency test consisting of a set of two identical survey lines run over a sloping area at varying speeds to calculate the delay between position fix and transmission. Any offset detected will cause positional errors if not corrected. The error is independent of the multibeam system. Roll Offset Measurement The roll calibration patch test is conducted by running a single line twice, in opposite directions over flat seabed. A short, wide, across-track swath of the overlapping data is used for a comparative analysis and software-applied adjustment. Pitch Offset Measurement Pitch calibration tests consist of running a set of two identical survey lines run inverse to each other at varying speeds over a sloping seafloor or over a known object to detect sonar and MRU alignment relative to vertical. Any misalignment can cause depth and position errors across the swath (Figure 6). Yaw Offset Measurement A Yaw calibration test is run using a set of adjacent survey lines run at the same speed over a known object on the seafloor in order to calculate sonar and MRU alignment relative to vertical. A Yaw offset can cause depth and position errors across the swath Patch Tests Results The following offsets were calculated and applied in Hypack for processing: Table 4 Patch Test Results Patch Test Calibration Offset Latency 0.0 seconds Roll 1.03 Pitch Yaw The impact of applying the patch test calibrations can be seen in the results of the surfaces shown in Appendix B which contains a full patch test calibration report and results Fathometer Barcheck Results There are two standard procedures used to check the accuracy of the survey fathometer whether it be the multibeam transducer or the singlebeam transducer; 1) speed of sound profiles and 2) fathometer barcheck calibrations. Fathometers calculate water depth by using algorithms based on the speed of sound through the water column. Depth-integrated sound velocity measurements were taken three times each day throughout the survey footprint utilizing an Odom Digi-Bar Pro speed of sound probe. The sound velocity profile was then programmed directly into the fathometer for the singlebeam system, and entered directly into Hypack Hysweep MB Acquisition program for the multibeam system
21 The second protocol is a barcheck calibration which is performed on the fathometer before and after each survey. This procedure consists of lowering a 36 inch diameter, weighted steel plate below the fathometer transducer and recording the actual depth of the disc (via markings on a cable) and the fathometer output (output was corrected for the transducer depth offset). Appendix C contains the results of the singlebeam barcheck calibrations. All barcheck calibrations measured were within 0.10 Ft or less for each checked depth. The multibeam transducer was checked using the aforementioned barcheck device and using a 25 Ft. stadia rod to take a sounding directly at the nadir of the transducer. Appendix C contains scanned images of the field notes relating to the daily barchecks. 3.3 LIDAR DATA INTEGRATION In order to check the accuracy of the LiDAR dataset especially in dense vegetation (Thule), the LiDAR data was compared with RTK-GPS derived ground shots in order to make sure the LiDAR bare earth data was indeed ground data and not top of vegetation elevations. Figure 4 shows a test patch of LiDAR data combined with ground-based RTK-GPS shots. In order to collect topographic data within this zone, field personnel utilized a Leica System 1200 RTK- GPS system, configured with hardware and software that enabled the use of the Russian Global Navigation Satellite System (GLONASS) satellite network. Utilization of GLONASS-enabled receivers increases the number of available satellites from an average of 7 10 to an average of 15 20, thus enabling survey-grade lock in areas that have a limited view of the sky such as near hillsides and tall vegetation. RTK surveying requires dual frequency LI/L2 GPS receivers: one receiver is set over a known point (base) and the other receiver (rover) collects position and elevation data as well as point metadata as the field surveyor travels along a pre-determined survey transect. The base station receiver relays satellite correction information to the rover via a multi frequency Pacific Crest PDL radio modem
22 4.1 DATA COLLECTION TIME PERIODS 4. SURVEY RESULTS Table 5 outlines all fieldwork dates and associated environmental conditions. Table 5 Survey Metadata Survey Date Survey Activities Notes June 12, 2014 MB survey day 1 Weather: slight SW wind (1 5 knts). Surface = smooth. June 13, 2014 MB survey day 2 Weather: slight SW wind (1 5 knts). Surface = slight chop August 14, 2014 LiDAR acquisition and RTK-GPS topo data collection Weather: slight SW wind (1 5 knts). Surface = smooth. Aug 22, 2014 Singlebeam acquisition and RTK- GPS topo data collection Weather: SW wind knts. Surface chop. 4.2 SURVEY DATA COVERAGE The final dataset consists of 3 datasets (MB bathy, SB Bathy and topo) merged in to one surface. This section present the coverage of each dataset and bathymetric survey data gaps as a result of SAV, submerged dead trees and shallow water. As stated in Section 2.3, the multibeam data collection effort occurred in June, when the water level was higher. The field team purposefully waited for the water level to drop in order to collect the LiDAR data with the logic that the LiDAR data point cloud will overlap the multibeam point cloud. There were gaps between the two datasets due to rock outcroppings and extremely shallow areas during the time of the multibeam data collection thus the need for the singlebeam gap in-fill. Survey vessel tracklines can be seen in Figure 5 and point cloud coverage can be seen in Figure DATA REDUCTION Multibeam Data Hypack Hysweep multibeam processing software was used to process the multibeam data. The raw data reduction module was used to process raw information gathered from each instrument including the following data inputs: sonar, heading, GPS, MRU, sound velocity, instrument offsets, and collective time stamps. The MRU data includes rotational motion about all three axis as well as heave due to surface waves, all tied directly to the ellipsoid, virtually eliminating positional and motion-related artifacts traditionally found in multibeam data that tended to obscure fine, geomorphic details. After the motion and position data were inspected, the raw sonar data for each survey line were then combined with motion and sound velocity data. Each survey line is then individually examined for inconsistent and irregular soundings (EDS does not employ the use of automated filters during this process). At this point during data processing, anomalies are rejected and cleaned from the data set. Once the data set is thoroughly cleaned it is exported from the Hypack software as a 1.5 meter grid with a median sounding value located at the center point of each grid (XYZ text file format)
23 The final data quality review and analysis is completed using the AutoCAD Civil 3D (version 2012) desktop software. The XYZ text file is imported into Civil 3D and converted to a point feature class and raster dataset. The final density level of the data points within all of the survey areas is a 5 foot grid that was derived from data on a 1 foot grid. Raster and point data are reviewed for any remaining anomalies and exported as the final data set Singlebeam Data In order to reduce each raw singlebeam bathymetric survey line into an XYZ dataset, each survey line was imported into the Single Beam Editor in Hypack (Version 2012). The Single Beam Editor enables all of the survey variables and ancillary data sets (RTK tides, heave values and sensor offsets) to be reviewed and applied to each survey line. Each survey line is then reviewed in detail and erroneous bathymetric points (spikes and other outliers) are deleted or interpolated into the survey line. RTK position and elevation quality values are also reviewed. Once each line has been reviewed and edited, all of the lines for each survey day are then exported into a Hypack Edited file. The edited file is then reviewed in the Hypack Shell for position and elevation quality. Where survey lines intersect (cross lines), a review of the overlapping soundings from each line is analyzed using the Cross Check Statistics program in Hypack. In areas of SAV, the full spectrum of each returned sonar ping is reviewed in the Hypack Echogram editor (Figure 3). Manual digitizing is then sometimes required to pick the channel bottom if the automated process picks the top of the SAV. These digitized points are then reviewed against RTK- GPS shots taken on the bottom as a QA tool in the area to make sure the digitized bottom elevations are accurate. Once the Edited Hypack file has passed the final review, the data is then filtered using the Sounding Selection algorithm in Hypack in order to reduce the soundings to one point at four foot intervals along each survey transect. After sounding selection, the resultant dataset is then exported to an XYZ text file Bathymetric Survey Data Accuracy Assessment The field accuracy assessment indicated that the bathymetric survey results met the tolerances for IHO Special Order, the highest accuracy class specified by the IHO ( 44_5E.pdf). The CLE hydrographic team collected two forms of data used in the accuracy assessment: 1) actual RTK-GPS (with the RTK rover on a 25 Ft. rod) derived survey shots of the bottom at the boat house and 2) Singlebeam survey data collected in select areas of the multibeam dataset. Table 6 summarize the RTK-GPS / MBES overlap and differences
24 Table 6 Accuracy Assessment Results RTK-GPS MBES-Derived Test Point Elevation Elevation DEM Elevation Singlebeam Elevation CARTOGRAPHY Due to the large quantity of data to be integrated into a Triangulated Irregular Network (TIN), a 3.2 Ft. x 3.2 Ft. foot grid was setup in AutoCAD Civil 3D (version 2014). Adjacent grid data was temporarily combined in order to generate accurate contours at the grid border. Boundaries were drawn at the interface between the topographic LIDAR data and hydrographic multibeam data in order to avoid conflicting data and mesh the data together. The surface model was then examined for invalid survey points, and any data that seemed incorrect and did not agree with adjacent survey data was removed. The data was then combined into a single TIN surface model containing the topographic LiDAR and RTK-GPS as well as the bathymetric dataset. The TIN model was then edited for erroneous triangles and surfaces. Once the editing was complete, contours were generated at 1 foot intervals from these surface models. The surface models were then exported to DEM format on a 5 Ft. grid. Appendix D contains the AutoCAD contour plates that have also been delivered as a separate printed deliverable (ARCH D size) and Figure 7 shows the shaded relief TIN on ortho aerials. 4.5 VOLUMETRIC ANALYSIS Reservoir pool volumes and surface area analysis was undertaken utilizing Hypack (Version 2013) Hydrographic Data Analysis package. A clean 3.2 Ft. x 3.2 Ft. point cloud was exported from AutoCAD Civil 3D after cleaning and editing (Section 4.5) and imported in to the Hypack Tin and Volumes algorithm. A new TIN was then created in Hypack and imported into the TIN to Level volumes program. The parameters of the volume calculations were then entered: 638 Ft. NAVD 88 to 720 Ft. NAVD 88 (the lowest and the top of spillway elevations resepctfully) with a step of 1.0 Ft. Hypack constructs a level surface at the 638 Ft. elevation and then calculates the pool size from the 638 Ft. level down to the aforementioned TIN as well as the surface area of the 638 Ft. level to the sides of the TIN for pool surface area. Figure 8 shows the resultant stage-storage chart, and Appendix E contains the updated stage-storage table. The Hypack-based volumetric analysis was also checked against specific WSE volumes calculated utilizing AutoCAD Civil 3D. A cleaned surface TIN in AutoCAD was used to calculate volumes utilizing a datum surface. A datum surface is a level surface created at a specific WSE, and then compared to the base surface (the Original TIN model)
25 5. REFERENCES California Data Exchange Center, 2009, CA Department of Water Resources, 2013 ( Heimann, D.C., 2001, Numerical simulation of streamflow distribution, sediment transport, and sediment deposition along Long Branch Creek in NE Missouri: USGS Water-Resources Investigations Report International Hydrographic Organization, IHO Standards for Hydrographic Surveys, Special Publication No. 44, 4 th Edition. U.S. Army Corps of Engineers Hydrographic Survey Manual, Engineering and Design Manual No. EM , Washington D.C
26 FIGURES


27 Alpine Lake Bon Tempe Lake VAFB Mooring Harbor Lake Lagunitas Bon Tempe Reservoir Bathymetric and Topographic Surveys Marin County, CA Location Map Background Image: NAIP 2013 June August 2014 Figure 1

28 dambm CP 4 Bon Tempe Lake VAFB Mooring Harbor CP 3 Lake Lagunitas Bon Tempe Reservoir Bathymetric and Topographic Surveys Marin County, CA Control Point Location Map Background Image: NAIP 2013 June August 2014 Figure 2

29 dambm CP 4 Bon Tempe Lake VAFB Mooring Harbor Lake Lagunitas Bon Tempe Reservoir Bathymetric and Topographic Surveys Marin County, CA Sub-Aquatic Vegetation Echogram Background Image: NAIP 2013 June August 2014 Figure 3

30 dambm CP 4 Bon Tempe Lake VAFB Mooring Harbor Lake Lagunitas Background Image: NAIP 2013 Blue = LiDAR Data Green = RTK-GPS ground shots Bon Tempe Reservoir Bathymetric and Topographic Surveys Marin County, CA RTK-GPS vs LiDAR Data June August 2014 Figure 4

31 dambm CP 4 Bon Tempe Lake VAFB Mooring Harbor Blue = LiDAR Data Green = RTK-GPS Ground Shots Red = Singlebeam Tracklines Black = Multibeam Tracklines Background Image: NAIP 2013 Lake Lagunitas Bon Tempe Reservoir Bathymetric and Topographic Surveys Marin County, CA Trackline Coverage June August 2014 Figure 5

32 dambm Bon Tempe Lake VAFB Mooring Harbor Blue = LiDAR Data Green = RTK-GPS Ground Red = Singlebeam Tracklines Black = Multibeam Point Cloud Background Image: NAIP 2013 Bon Tempe Reservoir Bathymetric and Topographic Surveys Marin County, CA Trackline Coverage June August 2014 Figure 6

33 dambm Bon Tempe Lake VAFB Mooring Harbor Bon Tempe Reservoir Bathymetric and Topographic Surveys Marin County, CA Shaded Relief Background Image: NAIP 2013 June August 2014 Figure 7
34 APPENDIX A Equipment Specifications
 (855-164771 / Rev.E / 20.06.")
35 EM 3002 Multibeam echo sounder The new generation high performance shallow water multibeam (EM 3000 data from Storegga Slide off the Norwegian coast. Courtesy of Norsk Hydro) ( / Rev.E / )
36 System description Key facts The EM 3002 is a new advanced multibeam echo sounder with extremely high resolution and dynamically focused beams. It is very well suited for detailed seafloor mapping and inspection with water depths from less than 1 meter up to typically 200 meters in cold oceanic conditions. Maximum depth capability is strongly dependant on water temperature and salinity - up to 300 meters is possible under favorable conditions. Due to its electronic pitch compensation system and roll stabilized beams, the system performance is stable also in foul weather conditions. The spacing between soundings as well as the acoustic footprints can be set nearly constant over the swath in order to provide a uniform and high detection and mapping performance. Dynamic focusing of all receive beams optimizes the system performance and resolution for short range applications such as underwater inspections. Typical applications Mapping of harbours, inland waterways and shipping channels with critical keel clearance Inspection of underwater infrastructure Detection and mapping of debris and other underwater objects Detailed surveys related to underwater construction work or dredging Environmental seabed and habitat mapping Mapping of biomass in the water column Features The EM 3002 system uses frequencies in the 300 khz band. This is an ideal frequency for shallow water applications, as the high frequency ensures narrow beams with small physical dimensions. At the same time, 300 khz secures a high maximum range capability and robustness under conditions with high contents of particles in the water. EM 3002 uses a powerful sonar processor unit in combination with 1 or 2 compact sonar heads. The Full swath width accuracy to the latest IHO standard Swath width up to 10 x water depth (EM 3002D) or 200 m (cold oceanic water) Depth range from < 1 meter to > 200 meters Bottom detection by phase or amplitude high computing power of the EM 3002 sonar processor makes it possible to apply sophisticated and exact signal processing algorithms for beamforming, beam stabilisation, and bottom detection. In High Density processing mode the system has close to uniform acoustic footprints and resolution over the whole swath width, and therefore a much improved capability to detect objects and other details on the bottom. EM 3002 will in addition to bathymetric soundings, produce an acoustic image of the seabed. The image is obtained by combining the acoustic return signals inside each beam, thus improving signal to noise ratio considerably, as well as eliminating several artifacts related to conventional sidescan sonars. The acoustic image is compensated for the transmission source level, receiver sensitivity and signal attenuation in the water column, so that reliable bottom backscatter levels in db are obtained. The image is also compensated for acoustic ray bending, and thus completely geo-referenced, so that preparation of a sonar mosaic for a survey area based upon data from several survey lines is easy. Objects observed on the seabed image are correctly located and their positions can be readily derived. List of options Dual sonar heads - EM 3002D Logging of water column data Software for Automatic Calibration CUBE terrain modeling SW Extended depth raiting for transducer(s): 1500 m Extended length of transducer cable: 30 or 45 m Bracket for portable mounting of sonar head(s) Flight case for safe transportation of 1 sonar head w/cable Flight case for processing unit and operators workstation 100% bottom coverage even at more than 10 knots vessel speed Real-time ray bending and attitude compensation Seabed image (sidescan) data output Sonar heads for 500 or 1500 meters depth rating Water column data display window + logging (optional)

37 0 S 1 S 2 S V + 3,3 V Multibeam EM 3002 Echo Sounder POWER Operator Station The Operator Station is a rugged zed PC workstation running on either Linux or Microsoft Windows XP. The Operator Station software, SIS, has extensive functionality such as 3D graphics, real-time data cleaning and electronic map background. The EM 3002 can be set up to use other operational software than SIS, for example QINCy or Costal Oceanographics HYPACK Max, and is also supported by software from Triton Elics International, EIVA and others. Storage media Operator Station Interfaces: Sound Speed Sensor Tide Center depth output Optional, may also be connected to the ship's ethernet. Note that Kongsberg Maritime AS does not take any responsibility for system malfunction caused by third-party software. Advanced functions Bottom detection uses a combination of amplitude and phase processing in order to provide a high sounding accuracy over the whole swath width. All beams are stabilized for pitch and roll movements of the survey vessel, by electronically steering the transmit beam as well as the receive beams. Internal Ethernet Serial interfaces: Positioning systems Attitude (roll, pitch and heave) Heading Clock Processing Unit Ethernet (CD21510) Dynamic focusing of the receive beams is applied in order to obtain improved resolution inside the acoustic near-field of the transducer. Special interfaces: Trigger input/output Clock synchronization Supply voltage: 115 or 230 Vac 50/60 Hz Sonar Head Second Sonar Head (optional) Typical system configuration with desktop Operator Station, Processing Unit and one or two Sonar Heads. Swath coverage with one sonar head reaches 130 degrees, but can be manually limited while still maintaining all beams inside the active swath. For deeper waters the swath width will be reduced due to reduced signal-to-noise margin. The system will automatically re-locate all beams to be within the active swath. With two sonar heads the swath width will reach 200 degrees to allow for inspection of constructions up to the water surface, as well as for efficient mapping of beaches, rivers and canals. On a flat shallow seabed the swathwidth can be about 10 x depth. Operator controlled equidistant or equiangular beam spacing. The image of a sunken wreck at 20 m depth.
38 Technical specifications Operational specifications Frequencies...293, 300, 307 khz Number of soundings per ping: Single sonar head... Max 254 Dual sonar heads... Max 508 Maximum ping rate...40 Hz Maximum angular coverage: Single sonar head degrees Dual sonar heads degrees Pitch stabilisation...yes Roll stabilisation...yes Heave compensation...yes Pulse length μs Range sampling rate...14, 14.3, 14.6 khz Depth resolution...1 cm Transducer geometry...mills cross Beam spacing... Equidistant or equiangular Beamforming: Time delay with shading Dynamically focused receive beams Seabed image data Composed from beamformed signal amplitudes Range resolution 5 cm. Compensated for source level and receiver sensitivity, as well as attenuation and spherical spreading in the water column. Amplitude resolution: 0.5 db. External sensors Position Heading Motion sensor (Pitch, roll and heave) Sound velocity profile Sound velocity at transducer. Clock synchronisation (1 PPS) Environmental and EMC specifications The system meets all requirements of the IACS E10 specification.the Operator Station, LCD monitor and Processing Unit are all IP22 rated. Dimensions and weights Sonar head: Shape...Cylindrical Housing material... Titanium Diameter mm Height mm Weight kg in air, 15 kg in water Pressure rating m (1500 m option) transducer cable length m Sonar Processing Unit: Width mm Depth mm Height mm Weight kg Operator Station: Width mm Depth mm Height mm Weight...20 kg 19 industrial LCD monitor: Width mm Depth mm Height mm Weight...12 kg Resolution x 1024 pixels All surface units are rack mountable. Dimensions exclude handles and brackets. Kongsberg Maritime is engaged in continuous development of its products, and reserves the right to alter the specifications without further notice. Kongsberg Maritime AS Strandpromenaden 50 P.O.Box 111 N-3191 Horten, Norway Telephone: Telefax: subsea@kongsberg.com
 survey standards Reduced installation time Easy to use Highly competitive price Expert 24x7 Technical Support Accurate, reliable MOTION and")
39 /F180 series Benefits er Lowce Prri2013 Precision position, roll, pitch, heading and heave in a single compact unit fo Maximum accuracy under all conditions Continuous output during GNSS dropouts Adherence to International Hydrographic Organization (IHO) survey standards Reduced installation time Easy to use Highly competitive price Expert 24x7 Technical Support Accurate, reliable MOTION and positioning data in a compact package The F180 series of GNSS aided inertial attitude and positioning systems are high quality, compact packages for the hydrographic survey market. Refined to meet the exacting requirements of the multibeam survey market, the F180 series systems are easy to install, easy to use and produce highly accurate positioning, heading and MOTION data in the most dynamic offshore conditions. The light, yet robust equipment has proved to be a reliable and cost effective solution on marine survey vessels of all sizes. iheavetm (Intelligent Heave) processing is included as standard to accurately measure swell amplitudes of up to 70 seconds period. A GLONASS upgrade is available to allow your F180 series system to utilise additional satellites, especially useful in areas where the sky view is partially obscured. Additionally, for extremely rapid vessel deployments, we produce a PreCalibrated housing accessory to significantly reduce the installation and calibration phases of operation. Features Survey grade GNSS, gyro, attitude and heave sensor in one box High accuracy position, heading, heave, pitch and roll at up to 100Hz Tightly integrated GNSS and inertial components result in increased accuracy and reduced settling times when compared to outputs from separate sensors Continuous output during GNSS dropouts Compatible with HYPACK, QINSy and other navigation packages Standard formats and interfaces iheavetm (intelligent heave processing) available as standard for improved heave accuracy Intuitive MOTION Control software included as standard Optional upgrade to GLONASS or Pre-calibrated housing Optional INSightTM software allows for generation of post processed solution Applications Hydrographic survey Bridge, dam, harbour inspection Dredging Offshore renewable energy Environmental survey Shipping channel survey Sales: Sales Americas: Technical Support Americas: Technical Support: More Information: sales@codaoctopus.com


40 /F180 series F180 series Systems F180-LT TM F180 F185 TM Entry level system with L1, DGPS, WAAS and EGNOS to allow maximum 60cm positional accuracy As F180-LT TM but with RTK on primary antenna to allow maximum positional accuracy of 20cm As F180 but with L1 and L2 on primary antenna to allow maximum positional accuracy of 1cm F185+ TM As F185 TM but with L1 and L2 on both antennas for rapid heading initialisation F190 TM As F185 TM but with integrated Marinestar receiver providing global corrections of 10cm where 1cm RTK is not available F190+ TM As F190 TM but with L1 and L2 on both antennas for rapid heading initialisation Upgrades are available between models at any time. Upgrades are available to F180R TM series Remote IMU system see separate data sheet. GLONASS and Pre-calibrated housing upgrades can be applied to any model. Dynamic Performance Positional Accuracy 0.01m with L1/L2 RTK correction (CEP) (F185 TM /F185+ TM /F190 TM /F190+ TM ) 0.10m with Marinestar subscription (F190 TM /F190+ TM ) 0.20m with L1 RTK correction (F180 ) 0.40m with DGPS correction (all models) 0.60m with SBAS correction (all models) 1.50m no correction (all models) Roll and Pitch (1σ) True Heading (1σ) 0.05 (2m baseline) (4m baseline) Heave (1σ) 5cm or 5% (on-line) 3.5cm or 3.5% (iheave TM ) Velocity (1σ) m/s Physical Dimensions 120x234x80mm (4.73 x 9.2 x 3.15 ) Weight 2.5kg (5.5 lb) Power 9-18Vdc, 25 watts ( Vac adapter supplied) Antenna Cables 15m standard (30m optional) Operating Temperature -10 to 60 C Humidity Splash proof Vibration 0.1g 2 /Hz, Hz Interfaces Ethernet 100MBit Full control and configuration, high speed data output (MCOM) with direct output to QINSy and HYPACK Serial Port 1 User configurable for position, heading and attitude strings. Choose from: TSS1, TSSHHRP, EM1000, EM3000, MCOM, GGA, GGK, GST, HDT, PASHR, PRDID, RMC, ROT, VTG, UTC, ZDA Serial Port 2 As Serial Port 1 Serial Port3 Correction input (DGPS, RTK) Formats: RTCM 2.1/2.2/2.3/3.0/3.1; CMR; CMR+ Other 1 PPS on BNC PC System Requirements Operating System Windows 8 / 7 / Vista / XP SP2 both 32 and 64 bit Beautiful rocky coastline off the west coast of Scotland. Data collected using an F185R+ and an R2Sonic This data was acquired in very challenging conditions - a sea state 4 with typical swell of 4.0m with up to +-16 degrees of pitch and roll. The extremely accurate performance of the F185R+ meant no editing of MBES data required. Image courtesy of Aspect Land & Hydrographic Surveys. F180 (Reg, Us Pat & TM off), F180-LT TM, F185 TM, F185+ TM, F190 TM, F190+ TM, iheave TM & INSight TM are trademarks of CodaOctopus. HYPACK is a registered trademark of HYPACK, Inc. Windows is a registered trademark of Microsoft The information in this publication was correct when it was published but specifications may change without notice. Photos are included for illustrative purposes only and actual items may differ in appearance. Coda Octopus does not assume responsibility for typographical or photographical errors. Issue 1 (03-13). Scan Code to find out more Sales: Sales Americas: Technical Support Americas: Technical Support: More Information: sales@codaoctopus.com
41 APPENDIX B MB Calibration report
42 Bon Tempe Reservoir June PATCH TEST LOCATION: Mid Reservoir NW shoreline VESSEL / SYSTEM: 26 ft Otter, EM F-180, Leica 1200 RTK K. Tweed, D. Gewant System Calibration Report A Patch Test calibration routine is performed to measure and account for installation offsets in angular relations of the Motion Sensor, Sonar Head, and GPS Antenna. The Roll Calibration is conducted by running a single line twice, in opposite directions over flat seabed. A short, wide, across-track swath of the overlapping data is used for a comparative analysis and software-applied adjustment. Before Roll Calibration: After Roll Calibration:
43 The Pitch Calibration is conducted by running a single line twice, in opposite directions, over sloped seafloor or a target that has noticeable relief above flat seabed. A long, narrow, along-track swath of overlapping data from under nadir is used for comparative analysis and software-applied adjustment. Before Pitch Calibration: After Pitch Calibration:


44 The Yaw Calibration is conducted by running parallel lines, in the same direction, over sloped seafloor or a target that has noticeable relief above flat seabed. A long, narrow, along-track swath of overlapping data from between the lines is used for comparative analysis and software-applied adjustment. Before Yaw Calibration: After Yaw Calibration: The following offsets were calculated and applied in HyPACK for processing: Roll Offset: Pitch Offset: Yaw Offset: 1.03 Degrees Degrees Degrees


45 The impact of this calibration routine can be seen in the results of the surfaces below: Before Calibration: After Calibration
46 APPENDIX C Barchecks


47 Bon Tempe Lake VAFB Mooring Harbor Bon Tempe Reservoir Bathymetric and Topographic Surveys Marin County, CA Barcheck Results Background Image: NAIP 2013 June August 2014
48 APPENDIX D AutoCAD Contour Chart


49 HYDROGRAPHIC NOTES: JUNE 2014 BON TEMPE RESERVOIR MARIN COUNTY, CA Bathymetric and Topographic Surveys VOLUMETRIC ANALYSIS CONSULTANT REVISIONS GEODETIC INFORMATION DATUM: NAD 83 PROJECTION: CALIF. STATE PLANE ZONE III VERTICAL DATUM: NAVD 88 Feet HORIZONTAL SCALE 1" = 120' FEET VERTICAL SCALE : N/A MARIN MUNICIPAL WATER DISTRICT 220 Nellen Avenue Corte Madera, CA LEGEND Index Contour - 5 Ft. Intermediate Contour - 1 Ft. SHEET TITLE BATHYMETRIC and TOPOGRAPHIC SURVEY DRAWN BY CHART NUMBER vad CHECKED BY jk PROJECT NO DATE 9/3/2014 SHEET 1 of 1
50 APPENDIX E Stage Storage Table
51 Water-Surface Area (Acres) Elevation (Ft. NAVD88) ,000 1,500 2,000 2,500 3,000 3,500 4,000 4,500 5,000 Capacity (Acre-Ft.) Storage Capacity (Acre-Ft.) Pool Surface Area (Acres) Bon Tempe Reservoir Marin Municipal Water District Water-Surface Area and Storage Capacity Curves Based on June 2014 Bathymetric Surveys and August LiDAR Surveys
52 Reservoir Volumes and Associated Surface Area Water Surface Water Surface Elevation Pool Volume Pool Surface Area Elevation Pool Volume Pool Surface Area Ft. NAVD 88 Acre Ft. Acres Ft. NAVD 88 Acre Ft. Acres , , , , , , , , , , , , , , , , , , , , , , , , , , , , , , , , , , , CLE Engineering
53
54
55
56
57
58
59
60
61
62
63
64
65
66
67
68
69
70
71
72
73
74
75
76
77
78
79
80
81
82
83
84
85
86
87
88
89
90
91
92

93 gettman schow SITE PLAN 2 66'5.626" N 19 27'12" E 1 S23 41'08"W 84.32' 25'-0" MMWD R.O.W. S03 20'33"W ' 52 De Luca Place San Rafael, CA fax SURPLUS PARCEL 144'10.701" N 81 22'00" W PORTION OF M.M.W.D. PARCEL S.F ' S89 17'37"E ' EXISTING HOUSE EXISTING GARAGE 25'-0" MMWD R.O.W. EXISTING S36 37'23"W 45.61' ASPHALT DRIVEWAY S36 07'39"W 46.76' S 89 17'32" E A.P.N MMWD R.O.W. TOTAL SITE AREA = 38,672 SQ FT MMWD R.O.W. AREA = 8,874 SQ FT S75 06'00"W 15.00' =14 11'00" R=125.00' L=30.94' E S C A L O N D R I V E 3 SCHOW PROPERTY Proposed Lot Line Adjustment S 29 01'50" W 94'2.382" N29 05'00"W ' 13 ESCALON DRIVE A.P. # N02 00'00"E ' N19 35'00"E 35.00' MILL VALLEY CALIFORNIA Project No Drawn by: KG 1 SITE PLAN 1/16" = 1'-0" N PROJECT NORTH TRUE NORTH Date: 2/26/2013 Revised: 4/3/2013 Scale: As Noted SITE PLAN A1 02/26/2013

94 Page 1 of 1 12/3/2013 LOCATION MAP 13 ESCALON DRIVE ALTO TANK SITE Copyright Infrastructure Vaults: Created by RGM April 2012 for Brian Richards using known facilities that were located within a vault as the initial point location. Further edited by Brian. Facility Sites: Created by RGM April 2012 for Brian Richards using known APNs that were located at a facility site as the initial point location. Further edited by Brian.
95
96
97
98
99
100
101
102
103
104
105
106
107
108
109
110
111
112
113
114
115 MARIN MUNICIPAL WATER DISTRICT FORBES HILL RESERVOIR COVER REPLACEMENT PROJECT CONSTRUCTION MANAGEMENT PROGRESS REPORT No. 1 September 2014
116 SUMMARY OF CONSTRUCTION STATUS Contractor: Aztec Consultants Base Contract Amount... $ 3,042, Change Orders Executed $ 0.00 Total Contract Cost $ 3,042, Contract Amount Earned...$ 120, Progress Payment for September 2014 (includes retention) $ 120, Retention Withheld...$ 6, Previous Progress Payments (excludes retention). $ 0.00 Estimated Percent Complete. 4% Schedule Notice to Proceed... July 31, 2014 Base Contract Duration consecutive days Original Completion Date... April 30, 2015 Time Extension Authorized... 0 days Revised Duration consecutive days Revised Completion Date... April 30, 2015 Weather Days (included in base duration) days Weather Days Expended (included in time expended)... 0 days Time Expended Days Percent Time Expended... 22%
117 Construction Manager s Summary 1. Schedule The Project Baseline schedule was developed this month by the Contractor and submitted for review by the Construction Manager. The schedule appears to be realistic and similar in structure and duration as the pre-bid schedule developed by the Covello Group. The Contractor resubmitted the Baseline Schedule after revision to address the Construction Manager s comments on the original submittal. As expected, the critical path of the schedule runs through the fabrication and installation of the new Aluminum Cover, and the installation, cleaning, and testing of the new Liner. Construction progress to date is on schedule. 2. Work Progress GENERAL Mobilization The Contractor mobilized to the site, bringing out both theirs and the CM trailers. Electrical power was supplied to the trailers from the Reservoir Pump House. MERA Undergrounding Welco Underground Construction, as sub to Aztec, completed the installation of the new electrical and telecom conduits via horizontal directional drilling installation methods. Pullboxes were installed as required by PG&E and AT&T. The concrete housekeeping pad was poured and the new electrical metering pedestal was set in place. Conduits were run aboveground on at the MERA facility to the new and existing electrical boxes. Reservoir Drainage Ditch The perimeter drainage ditch was excavated around the entire circumference of the reservoir. Forms were built for roughly ½ of the new ditch, from STA 5+00 to STA Contract Changes No Change Orders have been executed to date. The Construction Manager is in the process of drafting two $0 change orders to document no-cost changes to the Contract Drawings that were completed at the Contractor s request. Change Order No. 01 includes using horizontal directional drilling methods to install the new electrical and telecom conduits as opposed to open-cut trenching methods as shown on the plan. Change Order No. 02 includes installing Engineer-approved rebar reinforcing in the new drainage ditch instead of the originally specified welded-wire mesh. 4. Testing No testing was completed this month. 5. Anticipated Work for Next Month Work in October is anticipated to include the following items: 1. Installation of the new telecom junction boxes on the interior and exterior of the MERA facility. 3
118 2. Pulling of new electrical conductors from the electrical pole on Santa Margarita Blvd to the new meter pedestal, and installation of the new PG&E meter. 3. Cutover of power supply from overhead electrical lines to the new underground for the MERA facility. 4. Forming and pouring of the concrete drainage ditch. 5. Draining of the reservoir by MMWD. 6. Demolition of the existing liner and inspection of the existing concrete reservoir floor slab. 7. Demolition of existing drain piping in the tunnel. 4
119 PROJECT ADMINISTRATION SUBMITTAL STATUS Received Returned To Date To Date Pending First Time Shop Drawing Submittals Request for Information CHANGE ORDER SUMMARY Number Amount Change Orders Executed in September 0 $0 Change Orders Executed to Date 0 $0 Percent to Date of Original Contract 0% WEATHER RELATED DELAYS Days Base Contract Allowance 20 Weather Related Days in September 0 Weather Related Days to Date 0 5


120 CONSTRUCTION PHOTOS Horizontal Directional Drilling for Electrical Underground Meter Pedestal Housekeeping Pad 6


121 Excavating New Drainage Ditch Forms for New Drainage Ditch 7
SHALLOW SOUNDING BATHYMETRIC USING MULTIBEAM ECHOSOUNDER AND TOPOGRAPHIC LASER SCANNER
 SHALLOW SOUNDING BATHYMETRIC USING MULTIBEAM ECHOSOUNDER AND TOPOGRAPHIC LASER SCANNER BY : NURSUGI, TRI PATMASARI & KHAFID GEOSPASIAL INFORMATION AGENCY AMSTERDAM, 11-14 NOVEMBER 2014 Indonesia coastline
Patch Test & Stability Check Report
 Patch Test & Stability Check Report Storebælt, 2009 SB Cable Project CT Offshore Final Report November, 2009 SB Cable Project November 2009 8-10 Teglbaekvej DK-8361 Hasselager Aarhus, Denmark Tel: +45
GEOACOUSTICS GEOSWATH PLUS DATA PROCESSING WITH CARIS HIPS 8.1
 GEOACOUSTICS GEOSWATH PLUS DATA PROCESSING WITH CARIS HIPS 8.1 IN SUPPORT OF SANDY SUPPLEMENTAL RESEARCH Val Schmidt and Kevin Jerram University of New Hampshire Center for Coastal and Ocean Mapping Sunken
Checking the values using backscatter data
 A Technique for using Backscatter Imagery to Calibrate your Multibeam sonar Harold Orlinsky Harold@Hypack.com Checking the values using backscatter data The collection of Backscatter is co located with
Prepared for: CALIFORNIA COAST COMMISSION c/o Dr. Stephen Schroeter 45 Fremont Street, Suite 2000 San Francisco, CA
 REVIEW OF MULTIBEAM SONAR SURVEYS WHEELER REEF NORTH, SAN CLEMENTE, CALIFORNIA TO EVALUATE ACCURACY AND PRECISION OF REEF FOOTPRINT DETERMINATIONS AND CHANGES BETWEEN 2008 AND 2009 SURVEYS Prepared for:
Inertial Systems. Ekinox Series TACTICAL GRADE MEMS. Motion Sensing & Navigation IMU AHRS MRU INS VG
 Ekinox Series TACTICAL GRADE MEMS Inertial Systems IMU AHRS MRU INS VG ITAR Free 0.05 RMS Motion Sensing & Navigation AEROSPACE GROUND MARINE Ekinox Series R&D specialists usually compromise between high
Delph. Seabed Mapping Software Suite FEATURES ABOUT DELPH SOFTWARE SUITE BENEFITS APPLICATIONS
 Delph Seabed Mapping Software Suite Delph Seismic, Delph Sonar and Delph Mag are complete software packages with dedicated acquisition, processing and interpretation components. They operate with any sidescan
Central Coast LIDAR Project, 2011 Delivery 1 QC Analysis LIDAR QC Report February 17 th, 2012
 O R E G O N D E P A R T M E N T O F G E O L O G Y A N D M I N E R A L I N D U S T R I E S OLC Central Coast Delivery 1 Acceptance Report. Department of Geology & Mineral Industries 800 NE Oregon St, Suite
InteLAS Family of Mobile LiDAR Systems
 InteLAS Family of Mobile LiDAR Systems September 2015 What we do ilinks Geosolutions LLC Hydrographic surveying and seabed modeling Topographic surveying and mobile mapping Systems engineering and integration
An Introduction to Lidar & Forestry May 2013
 An Introduction to Lidar & Forestry May 2013 Introduction to Lidar & Forestry Lidar technology Derivatives from point clouds Applied to forestry Publish & Share Futures Lidar Light Detection And Ranging
SeaBat T50-P Product Description
 SeaBat T50-P Ultra-High Resolution Multibeam Echosounder December 2015 Table of Contents System Overview... 4 Introduction... 4 Typical Applications... 4 Warranty... 4 System Architecture... 5 SeaBat T50-P...
HYPACK HYPACK SURVEY DESIGN: HYPACK SURVEY: HYPACK EDITING: FINAL PRODUCTS: HYPACK HYPACK
 HYPACK HYPACK is one of the most widely used hydrographic surveying packages in the world, with over 3,000 users. It provides the surveyor with all of the tools needed to design their survey, collect data,
OLC Wasco County: Delivery One.
 OLC Wasco County: Delivery One www.quantumspatial.com January 2, 2014 Trimble R7 Receiver set up over GPS monument WASCO_02. Data collected for: Oregon Department of Geology and Mineral Industries 800
The Results of Limiting MRU Updates In Multibeam Data by Pat Sanders, HYPACK, Inc.
 The Results of Limiting MRU Updates In Multibeam Data by Pat Sanders, HYPACK, Inc. Abstract: Some Motion Reference Units (MRUs) can deliver heave- pitch- roll data at rates up to 100Hz. This paper investigates
2017 OLC Silver Creek
 2017 OLC Silver Creek December 15, 2017 www.quantumspatial.com Data collected for: Oregon Department of Geology and Mineral Industries 800 NE Oregon Street Suite 965 Portland, OR 97232 Prepared by: Quantum
LiDAR Technical Report NE Washington LiDAR Production 2017
 LiDAR Technical Report NE Washington LiDAR Production 2017 Presented to: Washington DNR 1111 Washington Street SE Olympia, Washington 98504 Submitted by: 860 McKinley St Eugene, OR 97402 July 26, 2017
Ocean High Technology Institute, Inc. Tadahiko Katsura Japan Hydrographic Association
 Technical Aspects of Marine Scientific Research for Continental Shelf Outer Limits: Advanced Method of Multi-beam Data Processing to Obtain Detailed and Precise Bathymetry Yasutaka Yokoi Ocean High Technology
LiDAR Remote Sensing Data Collection: Yaquina and Elk Creek Watershed, Leaf-On Acquisition
 LiDAR Remote Sensing Data Collection: Yaquina and Elk Creek Watershed, Leaf-On Acquisition Submitted by: 4605 NE Fremont, Suite 211 Portland, Oregon 97213 April, 2006 Table of Contents LIGHT DETECTION
Software for Hydrographic Data Processing
 Software for Hydrographic Data Processing Data courtesy of Dr. T. Komatsu, Tokyo University Ocean Research Institute CleanSweep provides a fast, user friendly environment for processing hydrographic survey
Light Detection and Ranging (LiDAR)
") Light Detection and Ranging (LiDAR) http://code.google.com/creative/radiohead/ Types of aerial sensors passive active 1 Active sensors for mapping terrain Radar transmits microwaves in pulses determines
Light Detection and Ranging (LiDAR) http://code.google.com/creative/radiohead/ Types of aerial sensors passive active 1 Active sensors for mapping terrain Radar transmits microwaves in pulses determines
Operator Manual. M3 Sonar. Portable Hydrographic System
 Operator Manual M3 Sonar Portable Hydrographic System M3 Sonar Portable Hydrographic System (PHS) Operator Manual Release 1.0 This manual provides you with the basic information required to operate the
APN-078: Configuring SPAN for Hydrographic Applications in OEM7
 APN-078: Configuring SPAN for Hydrographic Applications in OEM7 1 Table of Contents 1 Overview... 3 2 ALIGN Calibration... 4 2.1 ALIGN Calibration Procedure... 5 4. SPAN Configuration for Hydrographic
DYNAMIC POSITIONING CONFERENCE September 16-17, Sensors
 DYNAMIC POSITIONING CONFERENCE September 16-17, 2003 Sensors An Integrated acoustic positioning and inertial navigation system Jan Erik Faugstadmo, Hans Petter Jacobsen Kongsberg Simrad, Norway Revisions
LiDAR Remote Sensing Data Collection: Salmon River Study Area, Oregon
 LiDAR Remote Sensing Data Collection: Salmon River Study Area, Oregon Submitted to: Barbara Ellis-Sugai USDA Forest Service Siuslaw National Forest 4077 SW Research Way Corvallis, Oregon 541.750.7056 Submitted
Airborne LiDAR Data Acquisition for Forestry Applications. Mischa Hey WSI (Corvallis, OR)
") Airborne LiDAR Data Acquisition for Forestry Applications Mischa Hey WSI (Corvallis, OR) WSI Services Corvallis, OR Airborne Mapping: Light Detection and Ranging (LiDAR) Thermal Infrared Imagery 4-Band
Airborne LiDAR Data Acquisition for Forestry Applications Mischa Hey WSI (Corvallis, OR) WSI Services Corvallis, OR Airborne Mapping: Light Detection and Ranging (LiDAR) Thermal Infrared Imagery 4-Band
Evaluating the Performance of a Vehicle Pose Measurement System
 Evaluating the Performance of a Vehicle Pose Measurement System Harry Scott Sandor Szabo National Institute of Standards and Technology Abstract A method is presented for evaluating the performance of
CLASSIFICATION OF NONPHOTOGRAPHIC REMOTE SENSORS
 CLASSIFICATION OF NONPHOTOGRAPHIC REMOTE SENSORS PASSIVE ACTIVE DIGITAL CAMERA THERMAL (e.g. TIMS) VIDEO CAMERA MULTI- SPECTRAL SCANNERS VISIBLE & NIR MICROWAVE HYPERSPECTRAL (e.g. AVIRIS) SLAR Real Aperture
About LIDAR Data. What Are LIDAR Data? How LIDAR Data Are Collected
 1 of 6 10/7/2006 3:24 PM Project Overview Data Description GIS Tutorials Applications Coastal County Maps Data Tools Data Sets & Metadata Other Links About this CD-ROM Partners About LIDAR Data What Are
2. POINT CLOUD DATA PROCESSING
 Point Cloud Generation from suas-mounted iphone Imagery: Performance Analysis A. D. Ladai, J. Miller Towill, Inc., 2300 Clayton Road, Suite 1200, Concord, CA 94520-2176, USA - (andras.ladai, jeffrey.miller)@towill.com
LiDAR & Orthophoto Data Report
 LiDAR & Orthophoto Data Report Tofino Flood Plain Mapping Data collected and prepared for: District of Tofino, BC 121 3 rd Street Tofino, BC V0R 2Z0 Eagle Mapping Ltd. #201 2071 Kingsway Ave Port Coquitlam,
Sandy River, OR Bathymetric Lidar Project, 2012 Delivery QC Analysis Lidar QC Report March 26 th, 2013
 O R E G O N D E P A R T M E N T O F G E O L O G Y A N D M I N E R A L I N D U S T R I E S OLC Sandy River, OR Bathymetric Lidar Project Delivery Acceptance Report. Department of Geology & Mineral Industries
Lidar Technical Report
 Lidar Technical Report Oregon Department of Forestry Sites Presented to: Oregon Department of Forestry 2600 State Street, Building E Salem, OR 97310 Submitted by: 3410 West 11st Ave. Eugene, OR 97402 April
Perspective-MB. -- Bathymetry Processing Guide. Kongsberg.ALL Addendum
 Perspective-MB -- Bathymetry Processing Guide Kongsberg.ALL Addendum By: Tony M. Ramirez November, 2013 Triton Imaging Inc. Engineering Office 2121 41 st Avenue, Suite 211 Capitola, CA 95010 USA +1-831-722-7373
1. LiDAR System Description and Specifications
 High Point Density LiDAR Survey of Mayapan, MX PI: Timothy S. Hare, Ph.D. Timothy S. Hare, Ph.D. Associate Professor of Anthropology Institute for Regional Analysis and Public Policy Morehead State University
Mapping Project Report Table of Contents
 LiDAR Estimation of Forest Leaf Structure, Terrain, and Hydrophysiology Airborne Mapping Project Report Principal Investigator: Katherine Windfeldt University of Minnesota-Twin cities 115 Green Hall 1530
MEMS technology quality requirements as applied to multibeam echosounder. Jerzy DEMKOWICZ, Krzysztof BIKONIS
 MEMS technology quality requirements as applied to multibeam echosounder Jerzy DEMKOWICZ, Krzysztof BIKONIS Gdansk University of Technology Gdansk, Narutowicza str. 11/12, Poland demjot@eti.pg.gda.pl Small,
Aerial and Mobile LiDAR Data Fusion
 Creating Value Delivering Solutions Aerial and Mobile LiDAR Data Fusion Dr. Srini Dharmapuri, CP, PMP What You Will Learn About LiDAR Fusion Mobile and Aerial LiDAR Technology Components & Parameters Project
LiDAR REMOTE SENSING DATA COLLECTION BISCUIT FIRE STUDY AREA, OREGON
 LiDAR REMOTE SENSING DATA COLLECTION BISCUIT FIRE STUDY AREA, OREGON Oblique view in the Biscuit Fire Study Area: Above Ground ESRI Grid (1-meter resolution) derived from all LiDAR points Submitted to:
Merlin vessel-based lidar system
 Brochure: Merlin vessel-based lidar system Merlin vessel-based lidar system Map the full environment in one pass Scanning the full marine environment in a single operation reduces the amount of time crew
HYDROFEST 2005 CAPABILITIES OF A MODERN BATHYMETRIC LIDAR SYSTEM - THE SHOALS 1000T SYSTEM. Bill Gilmour Fugro Pelagos Inc, San Diego, CA, USA
 HYDROFEST 2005 CAPABILITIES OF A MODERN BATHYMETRIC LIDAR SYSTEM - THE SHOALS 1000T SYSTEM Bill Gilmour Fugro Pelagos Inc, San Diego, CA, USA ACKNOWLEDGEMENTS FUGRO PELAGOS INC. David Millar Carol Lockhart
2017 OLC Siskiyou. September 27,
 2017 OLC Siskiyou September 27, 2017 www.quantumspatial.com Data collected for: Oregon Department of Geology and Mineral Industries 800 NE Oregon Street Suite 965 Portland, OR 97232 Prepared by: Quantum
An Overview of Applanix.
 An Overview of Applanix The Company The Industry Leader in Developing Aided Inertial Technology Founded on Canadian Aerospace and Defense Industry Expertise Providing Precise Position and Orientation Systems
Project Report Nooksack South Fork Lummi Indian Nation. Report Presented to:
 June 5, 2005 Project Report Nooksack South Fork Lummi Indian Nation Contract #2291-H Report Presented to: Lummi Indian Nation Natural Resources Department 2616 Kwina Road Bellingham, WA 98226 Point of
Presented at the FIG Working Week 2017, May 29 - June 2, 2017 in Helsinki, Finland
 Presented at the FIG Working Week 2017, May 29 - June 2, 2017 in Helsinki, Finland OUTLINE I INTRODUCTION II GNSS MEASUREMENTS AND METHODOLOGY III IV TEST RESULTS AND DISCUSSION Concluding Remarks ONE
Orthophotography and LiDAR Terrain Data Collection Rogue River, Oregon Final Report
 Orthophotography and LiDAR Terrain Data Collection Rogue River, Oregon Final Report Prepared by Sky Research, Inc. 445 Dead Indian Memorial Road Ashland, OR 97520 Prepared for Rogue Valley Council of Governments
TAKING LIDAR SUBSEA. Adam Lowry, Nov 2016
 TAKING LIDAR SUBSEA Adam Lowry, Nov 2016 3D AT DEPTH Based in the technology hub of Boulder, Colorado, 3D at Depth is dedicated to the development of underwater laser measurement sensors and software Patented
Rogue River LIDAR Project, 2012 Delivery 1 QC Analysis LIDAR QC Report September 6 th, 2012
 O R E G O N D E P A R T M E N T O F G E O L O G Y A N D M I N E R A L I N D U S T R I E S OLC Rogue River Delivery 1 Acceptance Report. Department of Geology & Mineral Industries 800 NE Oregon St, Suite
> > Cut training costs: The low-maintenance Merlin. > > Add value: By expanding your product offering,
 45 27 39.384 N 9 07 30.145 E Merlin Vessel-based lidar system Map the full environment in one pass Scanning the full marine environment in a single operation reduces the amount of time crew spend in hazardous
Lewis County Public Works Department (County) GIS Mapping Division 350 N. Market Blvd. Chehalis, WA Phone: Fax:
 GIS Mapping Division 350 N. Market Blvd. Chehalis, WA Phone: Fax:") March 31, 2005 Project Report Lewis County, WA Contract #2262-H Report Presented to: Lewis County Public Works Department (County) GIS Mapping Division 350 N. Market Blvd. Chehalis, WA 98532-2626 Phone:
March 31, 2005 Project Report Lewis County, WA Contract #2262-H Report Presented to: Lewis County Public Works Department (County) GIS Mapping Division 350 N. Market Blvd. Chehalis, WA 98532-2626 Phone:
The YellowScan Surveyor: 5cm Accuracy Demonstrated
 The YellowScan Surveyor: 5cm Accuracy Demonstrated Pierre Chaponnière1 and Tristan Allouis2 1 Application Engineer, YellowScan 2 CTO, YellowScan Introduction YellowScan Surveyor, the very latest lightweight
Technical English -I 5 th week SURVEYING AND MAPPING
 Technical English -I 5 th week SURVEYING AND MAPPING What is surveying? It is the art of defining the positions of natural and man-made made features on the Earth s surface. Basic Tasks and Features in
CODEVINTEC. Caris Hydrographic Survey. CARIS HIPS and SIPS CARIS Onboard. Bathy DataBASE 4.4. Bathy DataBASE Server 4.3. BASE Editor 4.
 45 27 39.384 N 9 07 30.145 E Caris Hydrographic Survey Photo: João Ventura da Cruz CARIS HIPS and SIPS 10.4 page 2 CARIS Onboard page 4 Bathy DataBASE 4.4 page 6 Bathy DataBASE Server 4.3 page 7 BASE Editor
LIDAR REMOTE SENSING DATA COLLECTION: DOGAMI, CAMP CREEK PROJECT AREA
 LIDAR REMOTE SENSING DATA COLLECTION DEPARTMENT OF GEOLOGY AND MINERAL INDUSTRIES CAMP CREEK, OREGON NOVEMBER 26, 2008 Submitted to: Department of Geology and Mineral Industries 800 NE Oregon Street, Suite
Sedimentation in Aquilla Lake Hill County, Texas
 Sedimentation in Aquilla Lake Hill County, Texas by Lorena Roque Martinez, GIS and GPS Applications in Earth Sciences (GEO 327G) Introduction The Texas Water Development Board (TWDB) is in charge of offering
APPENDIX E2. Vernal Pool Watershed Mapping
 APPENDIX E2 Vernal Pool Watershed Mapping MEMORANDUM To: U.S. Fish and Wildlife Service From: Tyler Friesen, Dudek Subject: SSHCP Vernal Pool Watershed Analysis Using LIDAR Data Date: February 6, 2014
Alaska Department of Transportation Roads to Resources Project LiDAR & Imagery Quality Assurance Report Juneau Access South Corridor
 Alaska Department of Transportation Roads to Resources Project LiDAR & Imagery Quality Assurance Report Juneau Access South Corridor Written by Rick Guritz Alaska Satellite Facility Nov. 24, 2015 Contents
N.J.P.L.S. An Introduction to LiDAR Concepts and Applications
 N.J.P.L.S. An Introduction to LiDAR Concepts and Applications Presentation Outline LIDAR Data Capture Advantages of Lidar Technology Basics Intensity and Multiple Returns Lidar Accuracy Airborne Laser
W D-0049/004 EN
 September 21, 2011 Contact Ground Survey Report, Lidar Accuracy Report, & Project Report New Madrid Seismic Zone Northeast of Memphis, Tennessee Contract Number: W91278-09D-0049/004 EN Project: C-10-026
Qinertia THE NEXT GENERATION INS/GNSS POST-PROCESSING SOFTWARE. For all mobile surveying applications
 Qinertia THE NEXT GENERATION /GNSS POST-PROCESSING SOFTWARE For all mobile surveying applications Survey Efficiently, Survey Anywhere, Survey Serenely. QINERTIA has been designed to help surveyors get
QINSy. A Total Hydrographic Solution!
 QINSy A Total Hydrographic Solution! QINSy provides a user-friendly, turnkey solution for all types of marine navigation, positioning and surveying activities. From survey planning, to data collection,
TLS Parameters, Workflows and Field Methods
 TLS Parameters, Workflows and Field Methods Marianne Okal, UNAVCO June 20 th, 2014 How a Lidar instrument works (Recap) Transmits laser signals and measures the reflected light to create 3D point clouds.
TechnicalNotes. Trimble Total Control Software
 TechnicalNotes Trimble Total Control Software POWERFUL GEODETIC CONTROL FOR ALL SURVEY PROJECTS A survey is only as good as its control elements. Trimble Total Control software puts you in total control
600M SPECTRE FIBEROPTIC ROV SYSTEM
 Science Class ROV 600M SPECTRE FIBEROPTIC ROV SYSTEM General Specifications Dimensions: 60.0 L x 35.0 W x 33.0 H Weight: 795 pounds Payload: 30-75 pounds Tilt Assembly: 270 Pan - 90 Tilt Forward Thrust:
A Method to Create a Single Photon LiDAR based Hydro-flattened DEM
 A Method to Create a Single Photon LiDAR based Hydro-flattened DEM Sagar Deshpande 1 and Alper Yilmaz 2 1 Surveying Engineering, Ferris State University 2 Department of Civil, Environmental, and Geodetic
Geometric Rectification of Remote Sensing Images
 Geometric Rectification of Remote Sensing Images Airborne TerrestriaL Applications Sensor (ATLAS) Nine flight paths were recorded over the city of Providence. 1 True color ATLAS image (bands 4, 2, 1 in
Navigational Aids 1 st Semester/2007/TF 7:30 PM -9:00 PM
 Glossary of Navigation Terms accelerometer. A device that senses inertial reaction to measure linear or angular acceleration. In its simplest form, it consists of a case-mounted spring and mass arrangement
STATUS QUO REPORT ON ENC ACTIVITIES
 NETWORK OF DANUBE WATERWAY ADMINISTRATIONS South-East European Transnational Cooperation Programme STATUS QUO REPORT ON ENC ACTIVITIES BG - EAEMDR Document ID: O 5.25 Activity: 5.2 Author / Project Partner:
Third Rock from the Sun
 Geodesy 101 AHD LiDAR Best Practice The Mystery of LiDAR Best Practice Glenn Jones SSSi GIS in the Coastal Environment Batemans Bay November 9, 2010 Light Detection and Ranging (LiDAR) Basic principles
High-Precision Positioning Unit 2.2 Student Exercise: Calculating Topographic Change
 High-Precision Positioning Unit 2.2 Student Exercise: Calculating Topographic Change Ian Lauer and Ben Crosby (Idaho State University) Change is an inevitable part of our natural world and varies as a
Transducer and LBL calibration - Integrated functions in HiPAP systems
 Transducer and LBL calibration - Integrated functions in HiPAP systems Dynamic Positioning Conference, Houston, September 17-18 2002 arranged by 1 Calibration of transducer alignment and of LBL array This
Quinnipiac Post Flight Aerial Acquisition Report
 Quinnipiac Post Flight Aerial Acquisition Report August 2011 Post-Flight Aerial Acquisition and Calibration Report FEMA REGION 1 Quinnipiac Watershed, Connecticut, Massachusesetts FEDERAL EMERGENCY MANAGEMENT
IP-S2 HD. High Definition 3D Mobile Mapping System
 IP-S2 HD High Definition 3D Mobile Mapping System Integrated, turnkey solution Georeferenced, Time-Stamped, Point Clouds and Imagery High Density, Long Range LiDAR sensor for ultimate in visual detail
Gregory Walsh, Ph.D. San Ramon, CA January 25, 2011
 Leica ScanStation:: Calibration and QA Gregory Walsh, Ph.D. San Ramon, CA January 25, 2011 1. Summary Leica Geosystems, in creating the Leica Scanstation family of products, has designed and conducted
Table of Contents. 1. Overview... 1
 LIDAR REMOTE SENSING DATA COLLECTION: Diiabllo Canyon,, CA Prreparred by: : Prreparred fforr: : WSII Corrval lliss Offffi ice 5117 SW 2 nndd Stt,, Suitte 400 Corrval lliss,, OR 97333 Updaatteed Maayy 33,,,
S SERIES MULTIBEAM FOR SURVEY & MAPPING
 MAP IT ALL S SERIES DISCOVER A NEW WORLD WITH THE LATEST INNOVATION FROM WASSP Outstanding performance, versatility and value. That s what you expect and exactly what you get with the new S3 sonar from
Hysweep Survey Interfacing Notes
 Hysweep Survey Interfacing Notes Table of Contents: Table of Contents:...1 Update History:...3 Analog Sidescan...4 Applanix POS/MV Network...5 Applanix POS/MV Serial...8 Atlas Bomasweep...9 Atlas Fansweep
10 Years of Implied Metrology. Stewart Cannon 4D Nav
 10 Years of Implied Metrology Stewart Cannon 4D Nav Green Canyon Area of Gulf of Mexico 150 miles south of New Orleans First oil 2007 Oil and Gas exported via Caesar and Cleopatra pipeline systems Two
LIDAR an Introduction and Overview
 LIDAR an Introduction and Overview Rooster Rock State Park & Crown Point. Oregon DOGAMI Lidar Project Presented by Keith Marcoe GEOG581, Fall 2007. Portland State University. Light Detection And Ranging
Reconnaissance Survey for Hydroelectric Turbine Sites
 Reconnaissance Survey for Hydroelectric Turbine Sites YUKON RIVER AT RUBY, ALASKA May 20, 2009 Version 3.1 Prepared for The Yukon River Inter-Tribal Watershed Council Prepared by: TerraSond Ltd. 1617 S.
Operator Manual SIS. Seafloor Information System
 Operator Manual SIS Seafloor Information System Seafloor Information System SIS Operator Manual Release 3.6 164709/G September 2009 Document history Document number: 164709 Rev. F April 2007 Operator
A SENSOR FUSION APPROACH TO COASTAL MAPPING
 A SENSOR FUSION APPROACH TO COASTAL MAPPING Maryellen Sault, NOAA, National Ocean Service, National Geodetic Survey Christopher Parrish, NOAA, National Ocean Service, National Geodetic Survey Stephen White,
Product Guide UPDATED. Look into NovAtel s Precise Positioning Engines and Enclosures
 Look into NovAtel s Precise Positioning Engines and Enclosures See why NovAtel s extensive product line, including L1 and L1/L2 positioning UPDATED engines and enclosures, is on the leading edge of positioning
Geocoder: An Efficient Backscatter Map Constructor
 Geocoder: An Efficient Backscatter Map Constructor Luciano Fonseca, Brian Calder Center for Coastal and Ocean Mapping, University of New Hampshire Durham, NH 03824 ABSTRACT: The acoustic backscatter acquired
William E. Dietrich Professor 313 McCone Phone Fax (fax)
") February 13, 2007. Contact information William E. Dietrich Professor 313 McCone Phone 510-642-2633 Fax 510-643-9980 (fax) bill@eps.berkeley.edu Project location: Northwest of the Golden Gate Bridge, San
February 13, 2007. Contact information William E. Dietrich Professor 313 McCone Phone 510-642-2633 Fax 510-643-9980 (fax) bill@eps.berkeley.edu Project location: Northwest of the Golden Gate Bridge, San
NEXTMap World 10 Digital Elevation Model
 NEXTMap Digital Elevation Model Intermap Technologies, Inc. 8310 South Valley Highway, Suite 400 Englewood, CO 80112 10012015 NEXTMap (top) provides an improvement in vertical accuracy and brings out greater
Seabed Mapping with LiDAR
 Seabed Mapping with LiDAR 2011 Jakarta David Jonas Lt Cdr Rupert Forester-Bennett RN (ret( ret d) October 18 th 2011 Mapping in South East Asia Field Survey Aerial Photography LiDAR Pleased to Introduce
Teledyne PDS. Cutter Dredge. Version March Teledyne RESON B.V. Stuttgartstraat AS Rotterdam The Netherlands
 Cutter Dredge Teledyne PDS Version 2.1.1 March 2017 Teledyne RESON B.V. Stuttgartstraat 42-44 3047 AS Rotterdam The Netherlands Tel.: +31 (0)10 245 15 00 www.teledyne-reson.com Teledyne RESON has made
Phone: Fax: Table of Contents
 Geomorphic Characterization of Precarious Rock Zones LIDAR Mapping Project Report Principal Investigator: David E. Haddad Arizona State University ASU School of Earth and Space
Exterior Orientation Parameters
 Exterior Orientation Parameters PERS 12/2001 pp 1321-1332 Karsten Jacobsen, Institute for Photogrammetry and GeoInformation, University of Hannover, Germany The georeference of any photogrammetric product
BLM Fire Project, 2013 QC Analysis Lidar and Orthophoto QC Report November 25th, 2013
 O R E G O N D E P A R T M E N T O F G E O L O G Y 1937 A N D M I N E R A L I N D U S T R I E S Department of Geology & Mineral Industries 800 NE Oregon St, Suite 965 Portland, OR 97232 BLM Fire Project,
Windstorm Simulation & Modeling Project
 Windstorm Simulation & Modeling Project Airborne LIDAR Data and Digital Elevation Models in Broward County, Florida Data Quality Report and Description of Deliverable Datasets Prepared for: The Broward
A Total Hydrographic Solution!
 A Total Hydrographic Solution! QINSy A Total Hydrographic Solution! QINSy 7 provides a user-friendly turnkey solution for all types of marine navigation, positioning and surveying activities. From survey
Wednesday, July 15, Author: Eldris Ferrer Gonzalez, M.Sc. Engineering CSA Group
 Twenty ninth Annual ESRI International User Conference Wednesday, July 15, 2009 Author: Eldris Ferrer Gonzalez, M.Sc. Engineering CSA Group Introduction to Valenciano Project LIDAR Survey for Valenciano
SINGLE BEAM SURVEY USING EIVA SOFTWARE
 SINGLE BEAM SURVEY USING EIVA SOFTWARE Amirul Izam Fauzi, Othman Mohd Yusof, Eddy Junaidy Emran Centre of Studies for Surveying Science and Geomatics, Faculty of Architecture, Planning and Surveying, Universiti
PHOTOGRAMMETRIC SOLUTIONS OF NON-STANDARD PHOTOGRAMMETRIC BLOCKS INTRODUCTION
 PHOTOGRAMMETRIC SOLUTIONS OF NON-STANDARD PHOTOGRAMMETRIC BLOCKS Dor Yalon Co-Founder & CTO Icaros, Inc. ABSTRACT The use of small and medium format sensors for traditional photogrammetry presents a number
INS aided subsurface positioning for ROV surveys
 INS aided subsurface positioning for ROV surveys M. van de Munt, Allseas Engineering B.V., The Netherlands R van der Velden, Allseas Engineering B.V., The Netherlands K. Epke, Allseas Engineering B.V.,
Airborne Laser Scanning: Remote Sensing with LiDAR
 Airborne Laser Scanning: Remote Sensing with LiDAR ALS / LIDAR OUTLINE Laser remote sensing background Basic components of an ALS/LIDAR system Two distinct families of ALS systems Waveform Discrete Return
High-performance mean currents and turbulence, wave height and direction
 High-performance mean currents and turbulence, wave height and direction The ADCP is the optimal tool for turbulence measurements. With a maximum sampling frequency of 16 Hz, it gives the scientific community
Project Report Sauk-Suiattle Indian Tribe. Report Presented to:
 July 28, 2005 Project Report Sauk-Suiattle Indian Tribe Contract #2294-H Report Presented to: Sauk-Suiattle Indian Tribe 5318 Chief Brown Lane Darrington, WA 98241 Phone: (360) 436-0738 Fax: (360) 436-1092
Teledyne PDS. Multibeam Calibration. Version January Teledyne RESON B.V. Stuttgartstraat AS Rotterdam The Netherlands
 Multibeam Calibration Teledyne PDS Version 2.0.4 January 2017 Teledyne RESON B.V. Stuttgartstraat 42-44 3047 AS Rotterdam The Netherlands Tel.: +31 (0)10 245 15 00 www.teledyne-reson.com Teledyne RESON