Computer Graphics. - Volume Rendering - Philipp Slusallek
|
|
|
- Harriet Palmer
- 5 years ago
- Views:
Transcription
1 Computer Graphics - Volume Rendering - Philipp Slusallek
2 Overview Motivation Volume Representation Indirect Volume Rendering Volume Classification Direct Volume Rendering
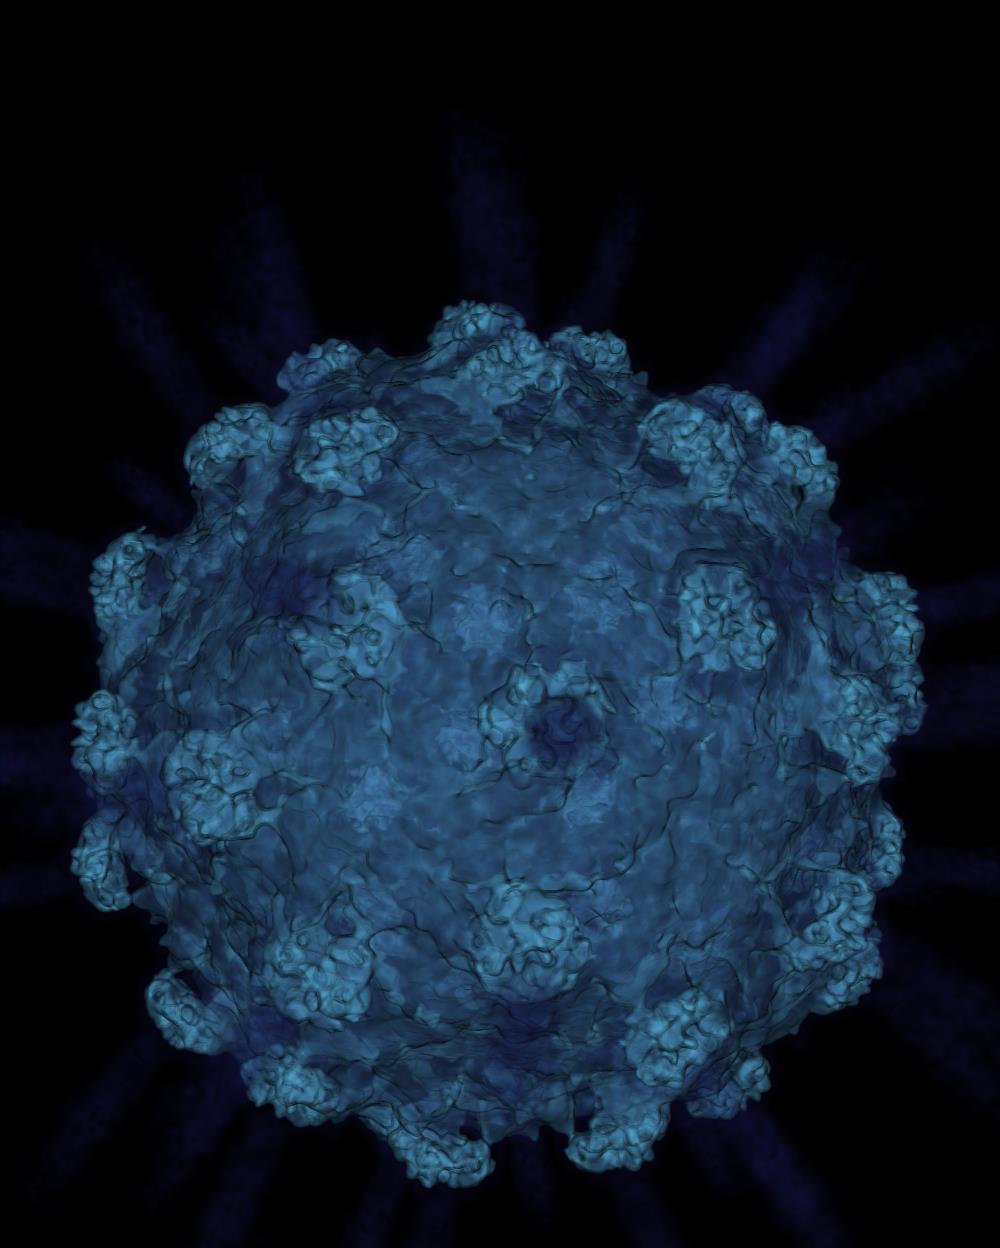
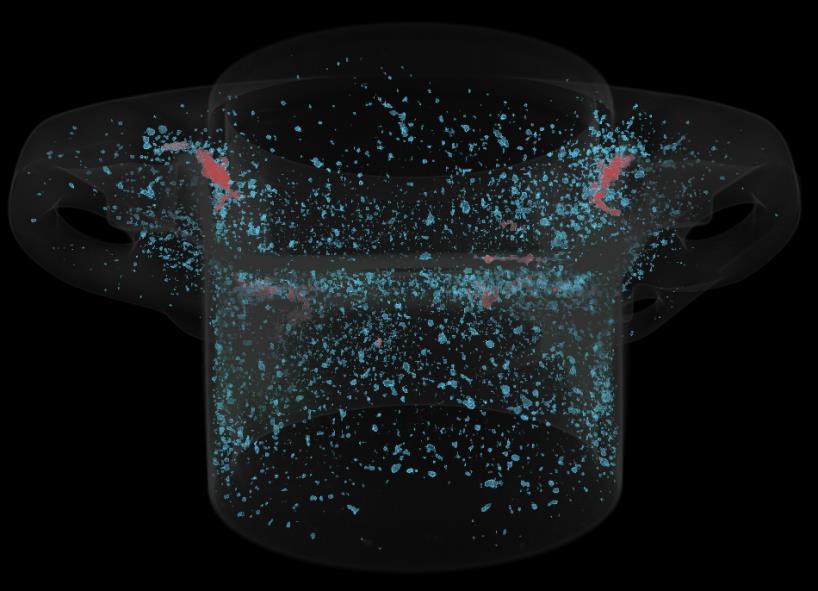
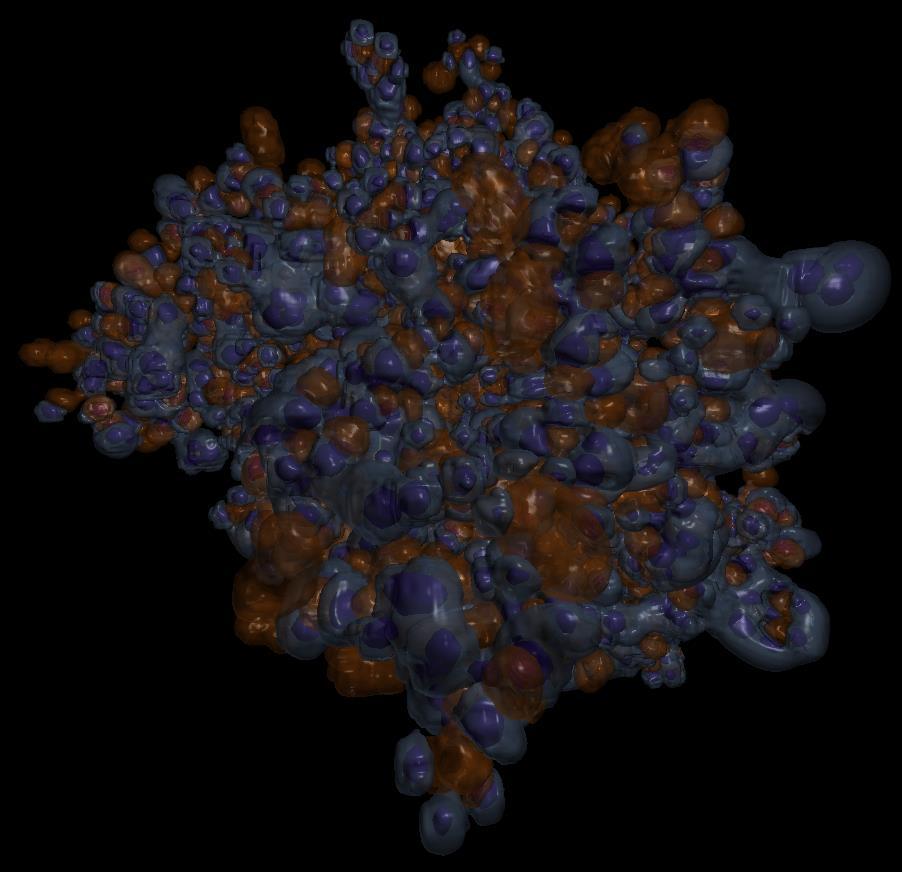
3 Applications: Bioinformatics Image by [Chimera 08]

![07]](/docs-images/82/86455461/images/4-1.jpg)
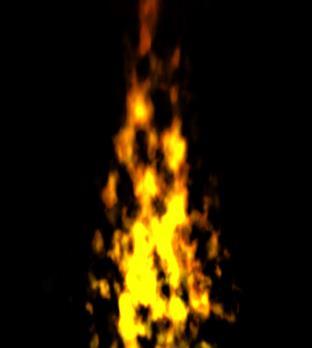
4 Image by [Salama 07] Applications: Entertainment
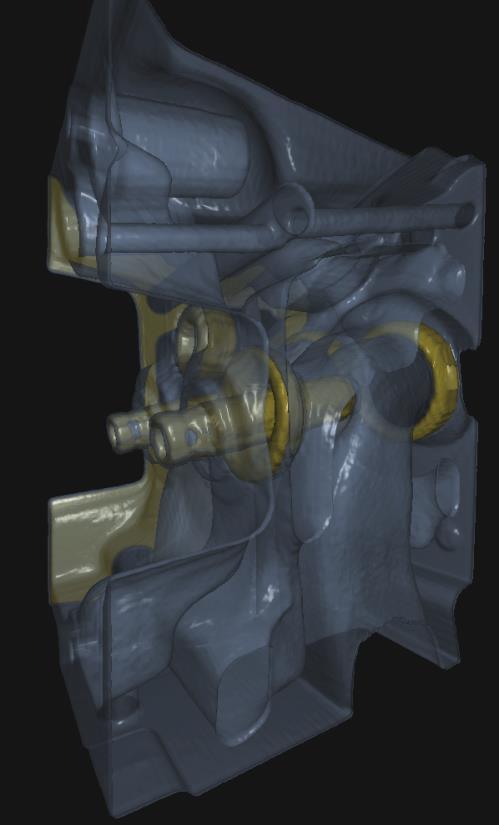
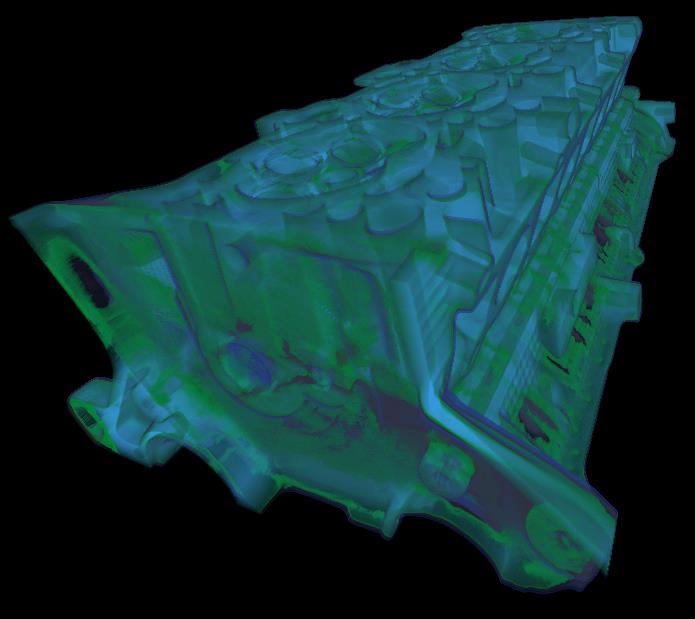
5 Applications: Industrial
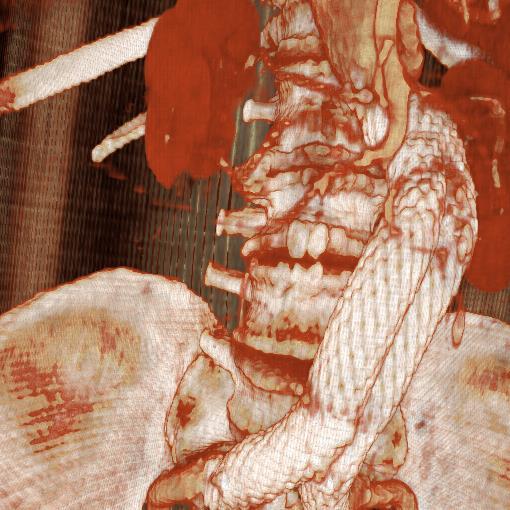
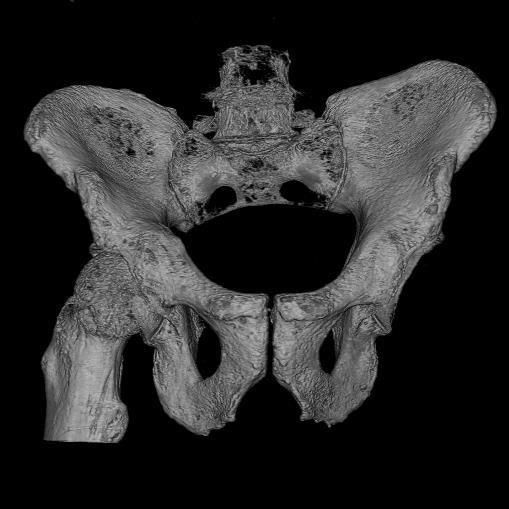
6 Applications: Medical
7 Applications: Simulations Image by [RTVG 08]
8 Volume Processing Pipeline Acquisition Measure or computation the data Filtering Picking desired features, cleaning, noise-reduction, re-sampling, reconstruction, classification,... Mapping Map N-dimensional data to visual primitives Rendering Generate the image Post-processing Enhancements (gamma correction, tone mapping)
9 Volume Acquisition Measuring Computer Tomography (CT, X-Ray), Magnetic Resonance Imaging (MRI, e-spin) Positron-Emission Tomography (PET) Ultrasound, sonar Electron microscopy Confocal microscopy Cryo-EM/Light-Tomography Simulations Essentially everything > 2D Visualization of mathematical objects
10 Filtering Raw data usually unsuitable Selection of relevant aspects Cleaning & repairing Correcting incomplete, out-of-scale values Noise reduction and removal Classification Adaptation of format Re-sampling (often to Cartesian grids) Transformations Volume reconstructing of 3D data from projection
11 Mapping Create something visible Interpretation of measurement values Mapping to geometric primitives Mapping to parameters (colors, absorption coefficients,...) Rendering Surface extraction vs. direct volume rendering Single volume vs multiple (possibly overlapping) Object-based vs. image-based rendering Forward- or backward mappings (rasterization/rt)
12 Volume Rendering Our input? Representation of volume Our output? Colors for given samples (pixels) Our tasks? Map weird values to optical properties Project 1D data values within 3D context to 2D image plane
13 VOLUME ACQUISITION AND REPRESENTATION
 MRI (Magnetic Resonance Imaging) Based on magnetic/spin response of hydrogen atoms in water Better contrast between different soft tissues (e.")
14 Data Acquisition Simulated Data Fluid dynamics Heat transfer etc Generally Scientific Visualization Measured Data CT (Computed Tomography) scanner Reconstructed from rotated series of two-dimensional X-ray images Good contrast between high and low density media (e.g. fat and bones) MRI (Magnetic Resonance Imaging) Based on magnetic/spin response of hydrogen atoms in water Better contrast between different soft tissues (e.g. brain, muscles, heart) PET (Positron Emission Tomography) And many others (also here on campus, e.g. material science)
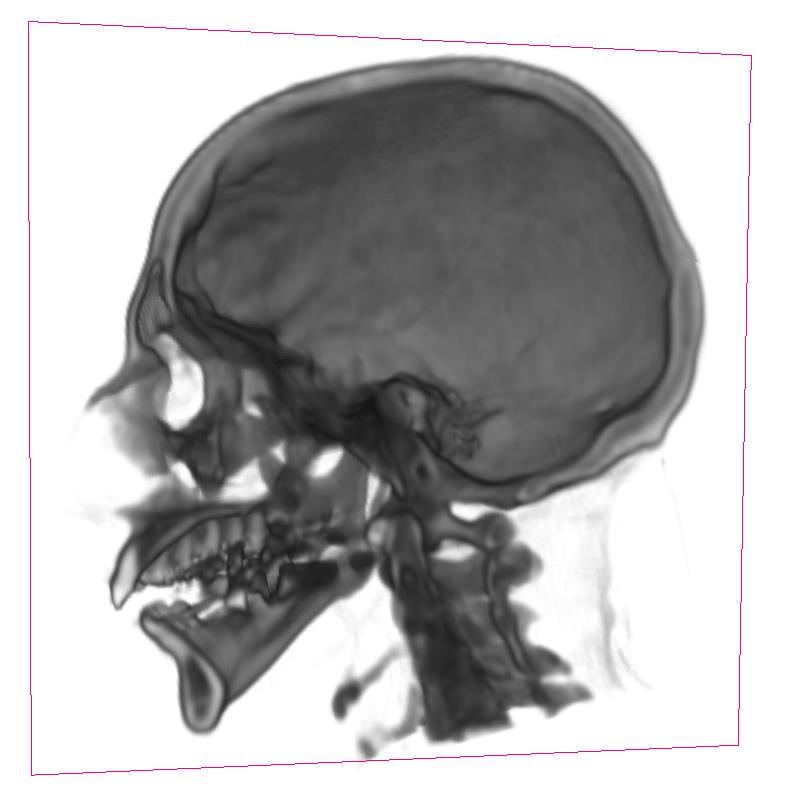
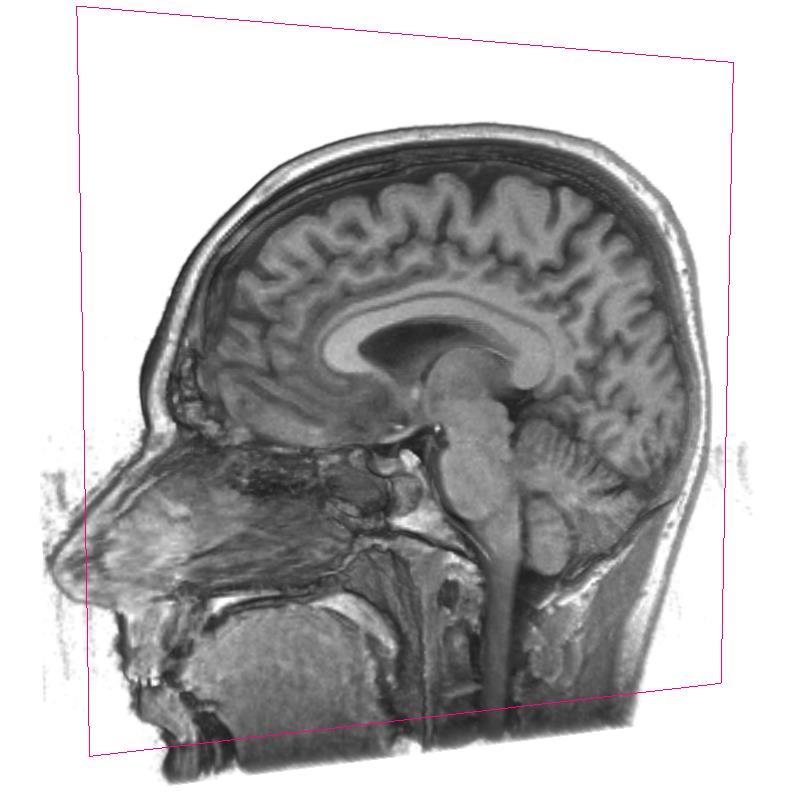
15 Data Acquisition CT vs. MRI
16 Volume Representations Definition 3D field of values: Essentially a 3D scalar or color texture Sometimes higher dimensional data (e.g. vector/tensor fields) Sampled representation 3D lattice of sample points (akin to an image but in 3D) Typically equal-distance in each directions Generally point cloud in space Point neighborhood information (topology) Data values at the points Procedural Mathematical description of values in space Sum of Gaussians (e.g. in quantum mechanics) Perlin noise (e.g. for non-homogeneous fog) Always convertible to sampled representation But with loss of information

17 Volume Organization Rectilinear Grids Common for scanned data May have different spacings Curvilinear Grids Warped rectilinear grids Unstructured Meshes Common for simulated data E.g. tetrahedral meshes Point clouds No topological/connection information Neighborhood computed on the fly
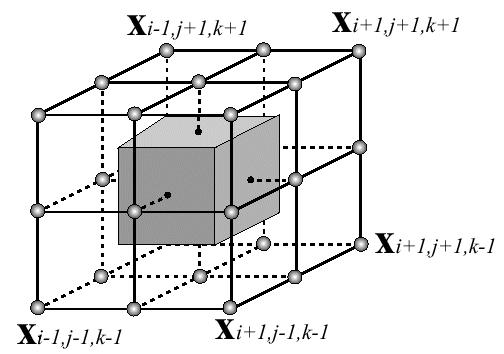
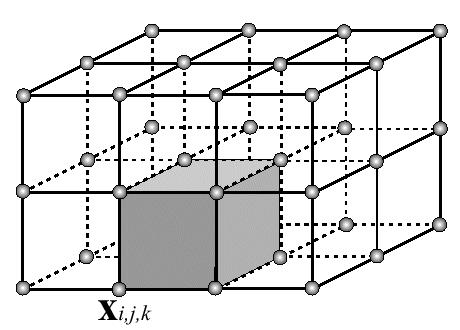
18 Reconstruction Filter Nearest Neighbor Cell-centered sample values Tri-Linear Interpolation Node-centered sample values
19 Tri-Linear Interpolation Compute Coefficients wx = (x x0) / (x1 x0) wy = (y y0) / (y1 y0) wz = (z z0) / (z1 z0) 3-D Scalar Field per Voxel f(x, y, z) = (1 - wz) (1 - wy) (1 - wx) c000 + (1 - wz) (1 - wy) wx c100 + (1 - wz) wy (1 - wx) c010 + (1 - wz) wy wx c110 + wz (1 - wy) (1 - wx) c001 + wz (1 - wy) wx c101 + wz wy (1 - wx) c011 + wz wy wx c111 z y x
20 Tri-Linear Interpolation Successive Linear Interpolations Along X c00 = (1 - wx) c000 + wx c100 c01 = (1 - wx) c001 + wx c101 c10 = (1 - wx) c010 + wx c110 c11 = (1 - wx) c011 + wx c111 Along Y c0 = (1 - wy) c00 + wy c10 c1 = (1 - wy) c01 + wy c11 Along Z c = (1 - wz) c0 + wz c1 z y Order of dimensions does not matter x
21 VOLUME MAPPING
22 Mapping / Classification Definition Map scalar data values to optical properties E.g. Optical density Albedo Emission Instances Analytical function Discrete representation Array of sample colors corresponding to sample data values Interpolate colors for data values in between sample points

23 Mapping / Classification Physical Mapping Physically-based mapping via optical properties of material Concentration of soot to optical density, albedo, etc Temperature to emitted blackbody radiation Allows for realistic rendering, often intuitively interpretable by us
 Mapping may have no physical interpretation Assigning color to pressure, electrostatic potential, electron density, Highlight specific features of the data Isolate bones")
24 Mapping / Classification Empirical or task-specific mapping (Transfer Function) User-defined mapping from data to colors Typically stored as an array sample correspondences (color map transfer function) Mapping may have no physical interpretation Assigning color to pressure, electrostatic potential, electron density, Highlight specific features of the data Isolate bones from fat

25 Pre/Post-Classification Pre-Classification First classify data values in sample cells Then interpolate classified optical properties Post-Classification First interpolate data values, then classify interpolated values


26 Cinematic Rendering Nominated for Deutsche Zukunftspreis 2017 Klaus Engel & Robert Schneider, Siemens Healthineers
27 DIRECT VOLUME RENDERING
28 Direct Volume Rendering Definition Directly render the volumetric data (only) as translucent material

29 Scattering in a Volume


30 Beer s Law Volumetric Attenuation Assume constant optical density κ 01 Transmittance: T x 0, x 1 = e κ 01(x 1 x 0 ) Transmitted radiance: L o x 0, ω = T x 0, x 1 L o x 1, ω x1 x0
31 Analytical Form Volumetric Attenuation Assume constant optical density κ 01 (extinction coefficient) Transmittance: T x 0, x 1 = e κ 01(x 1 x 0 ) Transmitted radiance: T x 0, x 1 L o x 1, ω Volumetric Contributions Also assume (constant) volume radiance L v x, ω [Watt/(sr m^3)] Contributed radiance: 1 T x 0, x 1 L v x 01, ω Volumetric Equation Radiance reaching the observer Emission within segment + transmitted background radiance L o x 0, ω = 1 T x 0, x 1 L v x 01, ω + T x 0, x 1 L o x 1, ω
32 Ambient Homogenous Fog Constant-Optical Density Volumetric Contributions Assume constant volumetric albedo ρ v x Assume constant ambient lighting L a (everywhere, no shadowing) Leads to constant volume radiance L v x, ω = L a ρ v Pervasive Fog Entry at camera, exit at intersection, or inf. x Algorithm 0 Compute surface illumination L o x 1, ω Modulate shadow visibility by transmittance between surface and light source Compute volume transmittance T x 0, x 1 and attenuate surface radiance Add contributions from volume radiance x 1

33 Ambient Homogeneous Fog Pros Simple Efficient Cons No true light contributions No volumetric shadows
34 Ray-Marching Riemann Summation Non-constant optical density / non-constant volume radiance Sample volume at discrete locations Assume constant density and volume radiance in each interval

35 Ray-Marching Homogeneous Segments L o x 0, ω = 1 e κ 01Δx L v x 01, ω + e κ 01Δx L o x 1, ω L o x 1, ω = 1 e κ 12Δx L v x 12, ω + e κ 12Δx L o x 2, ω L o x 2, ω = x0 x1 Recursive Substitution x2 x3 L o x 0, ω = 1 e κ 01Δx L v x 01, ω + e κ 01Δx 1 e κ 12Δx L v x 12, ω + e κ 12Δx = 1 e κ 01Δx L v x 01, ω + e κ 01Δx 1 e κ 12Δx L v x 12, ω + e κ 01Δx e κ 12Δx = n 1 i 1 e κ j,j+1δx 1 e κ i,i+1δx L v x i,i+1, ω + n 1 e κ j,j+1δx L o x n, ω i=0 j=0 j=0
36 Ray-Marching (front to back) L = 0; T = 1; t = 0; // t_enter; while(t < t_exit) dt = min(t_step, t_exit - t); P = ray.origin + (t + dt/2) * ray.direction; b = exp(- volume.density(p) * dt); L += T * (1 - b) * Lv(P); T *= b; // Optional early termination t += t_step; L += T * trace(ray.origin + t_exit * ray.direction, ray.direction); return L;
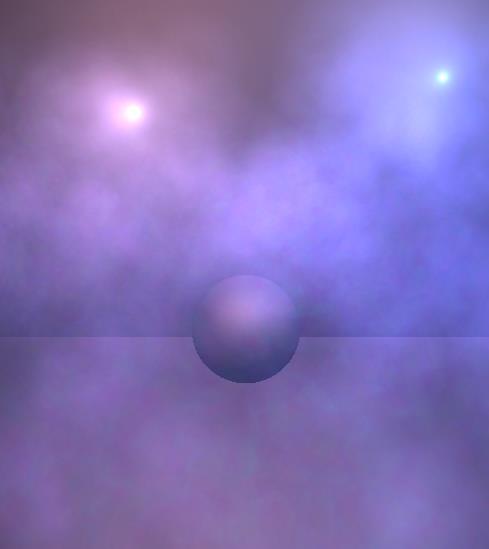
37 Homogeneous Fog Constant-optical density Non-constant volume radiance Similar to surface reflected radiance (i.e. rendering equation) Use phase function ρ x, Δω, (e.g. ρ v ) instead of BRDF*cosine 4 π Modulate shadow visibility by transmittance
38 Homogeneous Fog E.g. Anisotropic Point Light Modulate visibility at surfaces by transmittance L rl x, ω o = I( ω) x y 2 V x, y T(x, y)f r ω x, y, x, ω o cos θ i Modulate visibility at each volume sample by transmittance L v x, ω o = I( ω) x y 2 V x, y T(x, y) ρ v 4 π


39 Homogeneous Fog Inverse Square Law Volumetric Shadows Projective Light
40 Heterogeneous Fog Assumptions Non-constant-optical density Non-constant volume radiance Shadow visibility modulated by transmittance Ray-marched shadow rays at surface Ray-marched shadow rays at each volume sample!! T x 0, x n = n 1 j=0 e κ j,j+1δx
41 Heterogeneous Fog

42 Ray-Casting Early Ray Termination Abort ray-marching when subsequent contributions are negligible if (T < epsilon) return L; Very effective in dense volumes Also avoids ray-marching to infinity Grid Traversal 3-D DDA Ray-marching Adaptive Marching Bulk integration over homogeneous regions (e.g. octree, bricks) Pre-compute and store maximum step size separately Increasing step size with decreasing accumulated transmittance Vertex Connection and Merging & Joint Path Sampling [Siggraph 14]

43 Full Volumetric Light Simulation Taking into account multiple scattering in the volume

44 Full Volumetric Light Simulation Including Shadows, Caustics, etc.
Volume Rendering. Lecture 21
 Volume Rendering Lecture 21 Acknowledgements These slides are collected from many sources. A particularly valuable source is the IEEE Visualization conference tutorials. Sources from: Roger Crawfis, Klaus
CS 5630/6630 Scientific Visualization. Volume Rendering I: Overview
 CS 5630/6630 Scientific Visualization Volume Rendering I: Overview Motivation Isosurfacing is limited It is binary A hard, distinct boundary is not always appropriate Slice Isosurface Volume Rendering
Scalar Data. Alark Joshi
 Scalar Data Alark Joshi Announcements Pick two papers to present Email me your top 3/4 choices. FIFO allotment Contact your clients Blog summaries: http://cs.boisestate.edu/~alark/cs564/participants.html
Volume visualization. Volume visualization. Volume visualization methods. Sources of volume visualization. Sources of volume visualization
 Volume visualization Volume visualization Volumes are special cases of scalar data: regular 3D grids of scalars, typically interpreted as density values. Each data value is assumed to describe a cubic
Scalar Data. Visualization Torsten Möller. Weiskopf/Machiraju/Möller
 Scalar Data Visualization Torsten Möller Weiskopf/Machiraju/Möller Overview Basic strategies Function plots and height fields Isolines Color coding Volume visualization (overview) Classification Segmentation
Direct Volume Rendering. Overview
 Direct Volume Rendering Department of Computer Science University of New Hampshire Durham, NH 03824 Based on: Brodlie and Wood, Recent Advances in Visualization of Volumetric Data, Eurographics 2000 State
Overview. Direct Volume Rendering. Volume Rendering Integral. Volume Rendering Integral Approximation
 Overview Direct Volume Rendering Department of Computer Science University of New Hampshire Durham, NH 03824 Based on: Brodlie and Wood, Recent Advances in Visualization of Volumetric Data, Eurographics
Visualization. Images are used to aid in understanding of data. Height Fields and Contours Scalar Fields Volume Rendering Vector Fields [chapter 26]
![Visualization. Images are used to aid in understanding of data. Height Fields and Contours Scalar Fields Volume Rendering Vector Fields [chapter 26]](/thumbs/74/70771954.jpg "Visualization. Images are used to aid in understanding of data. Height Fields and Contours Scalar Fields Volume Rendering Vector Fields [chapter 26]") Visualization Images are used to aid in understanding of data Height Fields and Contours Scalar Fields Volume Rendering Vector Fields [chapter 26] Tumor SCI, Utah Scientific Visualization Visualize large
Visualization Images are used to aid in understanding of data Height Fields and Contours Scalar Fields Volume Rendering Vector Fields [chapter 26] Tumor SCI, Utah Scientific Visualization Visualize large
- Volume Rendering -
 Computer Graphics - Volume Rendering - Pascal Grittmann, Jaroslav Křivánek Using pictures from: Monte Carlo Methods for Physically Based Volume Rendering; SIGGRAPH 2018 Course; Jan Novák, Iliyan Georgiev,
- Volume Rendering -
 Computer Graphics - Volume Rendering - Pascal Grittmann Using pictures from: Monte Carlo Methods for Physically Based Volume Rendering; SIGGRAPH 2018 Course; Jan Novák, Iliyan Georgiev, Johannes Hanika,
Today. Participating media. Participating media. Rendering Algorithms: Participating Media and. Subsurface scattering
 Today Rendering Algorithms: Participating Media and Subsurface Scattering Introduction Rendering participating media Rendering subsurface scattering Spring 2009 Matthias Zwicker Participating media Participating
11/1/13. Visualization. Scientific Visualization. Types of Data. Height Field. Contour Curves. Meshes
 CSCI 420 Computer Graphics Lecture 26 Visualization Height Fields and Contours Scalar Fields Volume Rendering Vector Fields [Angel Ch. 2.11] Jernej Barbic University of Southern California Scientific Visualization
Visualization. CSCI 420 Computer Graphics Lecture 26
 CSCI 420 Computer Graphics Lecture 26 Visualization Height Fields and Contours Scalar Fields Volume Rendering Vector Fields [Angel Ch. 11] Jernej Barbic University of Southern California 1 Scientific Visualization
Scalar Data. CMPT 467/767 Visualization Torsten Möller. Weiskopf/Machiraju/Möller
 Scalar Data CMPT 467/767 Visualization Torsten Möller Weiskopf/Machiraju/Möller Overview Basic strategies Function plots and height fields Isolines Color coding Volume visualization (overview) Classification
Raycasting. Ronald Peikert SciVis Raycasting 3-1
 Raycasting Ronald Peikert SciVis 2007 - Raycasting 3-1 Direct volume rendering Volume rendering (sometimes called direct volume rendering) stands for methods that generate images directly from 3D scalar
Visualization Computer Graphics I Lecture 20
 15-462 Computer Graphics I Lecture 20 Visualization Height Fields and Contours Scalar Fields Volume Rendering Vector Fields [Angel Ch. 12] April 15, 2003 Frank Pfenning Carnegie Mellon University http://www.cs.cmu.edu/~fp/courses/graphics/
Height Fields and Contours Scalar Fields Volume Rendering Vector Fields [Angel Ch. 12] April 23, 2002 Frank Pfenning Carnegie Mellon University
![Height Fields and Contours Scalar Fields Volume Rendering Vector Fields [Angel Ch. 12] April 23, 2002 Frank Pfenning Carnegie Mellon University](/thumbs/90/102611276.jpg "Height Fields and Contours Scalar Fields Volume Rendering Vector Fields [Angel Ch. 12] April 23, 2002 Frank Pfenning Carnegie Mellon University") 15-462 Computer Graphics I Lecture 21 Visualization Height Fields and Contours Scalar Fields Volume Rendering Vector Fields [Angel Ch. 12] April 23, 2002 Frank Pfenning Carnegie Mellon University http://www.cs.cmu.edu/~fp/courses/graphics/
15-462 Computer Graphics I Lecture 21 Visualization Height Fields and Contours Scalar Fields Volume Rendering Vector Fields [Angel Ch. 12] April 23, 2002 Frank Pfenning Carnegie Mellon University http://www.cs.cmu.edu/~fp/courses/graphics/
BME I5000: Biomedical Imaging
 1 Lucas Parra, CCNY BME I5000: Biomedical Imaging Lecture 4 Computed Tomography Lucas C. Parra, parra@ccny.cuny.edu some slides inspired by lecture notes of Andreas H. Hilscher at Columbia University.
Volume Rendering. Computer Animation and Visualisation Lecture 9. Taku Komura. Institute for Perception, Action & Behaviour School of Informatics
 Volume Rendering Computer Animation and Visualisation Lecture 9 Taku Komura Institute for Perception, Action & Behaviour School of Informatics Volume Rendering 1 Volume Data Usually, a data uniformly distributed
Volume Visualization
 Volume Visualization Part 1 (out of 3) Overview: Volume Visualization Introduction to volume visualization On volume data Surface vs. volume rendering Overview: Techniques Simple methods Slicing, cuberille
Interactive Methods in Scientific Visualization
 Interactive Methods in Scientific Visualization GPU Volume Raycasting Christof Rezk-Salama University of Siegen, Germany Volume Rendering in a Nutshell Image Plane Eye Data Set Back-to-front iteration
Volume Visualization. Part 1 (out of 3) Volume Data. Where do the data come from? 3D Data Space How are volume data organized?
 Volume Data. Where do the data come from? 3D Data Space How are volume data organized?") Volume Data Volume Visualization Part 1 (out of 3) Where do the data come from? Medical Application Computed Tomographie (CT) Magnetic Resonance Imaging (MR) Materials testing Industrial-CT Simulation
Volume Data Volume Visualization Part 1 (out of 3) Where do the data come from? Medical Application Computed Tomographie (CT) Magnetic Resonance Imaging (MR) Materials testing Industrial-CT Simulation
Volume Rendering - Introduction. Markus Hadwiger Visual Computing Center King Abdullah University of Science and Technology
 Volume Rendering - Introduction Markus Hadwiger Visual Computing Center King Abdullah University of Science and Technology Volume Visualization 2D visualization: slice images (or multi-planar reformation:
CSC Computer Graphics
 // CSC. Computer Graphics Lecture Kasun@dscs.sjp.ac.lk Department of Computer Science University of Sri Jayewardanepura Polygon Filling Scan-Line Polygon Fill Algorithm Span Flood-Fill Algorithm Inside-outside
Data Visualization (DSC 530/CIS )
") Data Visualization (DSC 530/CIS 60-0) Isosurfaces & Volume Rendering Dr. David Koop Fields & Grids Fields: - Values come from a continuous domain, infinitely many values - Sampled at certain positions
Data Visualization (DSC 530/CIS 60-0) Isosurfaces & Volume Rendering Dr. David Koop Fields & Grids Fields: - Values come from a continuous domain, infinitely many values - Sampled at certain positions
Volume Illumination. Visualisation Lecture 11. Taku Komura. Institute for Perception, Action & Behaviour School of Informatics
 Volume Illumination Visualisation Lecture 11 Taku Komura Institute for Perception, Action & Behaviour School of Informatics Taku Komura Volume Illumination & Vector Vis. 1 Previously : Volume Rendering
Data Representation in Visualisation
 Data Representation in Visualisation Visualisation Lecture 4 Taku Komura Institute for Perception, Action & Behaviour School of Informatics Taku Komura Data Representation 1 Data Representation We have
Raytracing & Epsilon. Today. Last Time? Forward Ray Tracing. Does Ray Tracing Simulate Physics? Local Illumination
 Raytracing & Epsilon intersects light @ t = 25.2 intersects sphere1 @ t = -0.01 & Monte Carlo Ray Tracing intersects sphere1 @ t = 10.6 Solution: advance the ray start position epsilon distance along the
Visualization Computer Graphics I Lecture 20
 15-462 Computer Graphics I Lecture 20 Visualization Height Fields and Contours Scalar Fields Volume Rendering Vector Fields [Angel Ch. 12] November 20, 2003 Doug James Carnegie Mellon University http://www.cs.cmu.edu/~djames/15-462/fall03
GPU Ultrasound Simulation and Volume Reconstruction
 GPU Ultrasound Simulation and Volume Reconstruction Athanasios Karamalis 1,2 Supervisor: Nassir Navab1 Advisor: Oliver Kutter1, Wolfgang Wein2 1Computer Aided Medical Procedures (CAMP), Technische Universität
Geometric Representations. Stelian Coros
 Geometric Representations Stelian Coros Geometric Representations Languages for describing shape Boundary representations Polygonal meshes Subdivision surfaces Implicit surfaces Volumetric models Parametric
Scientific Visualization. CSC 7443: Scientific Information Visualization
 Scientific Visualization Scientific Datasets Gaining insight into scientific data by representing the data by computer graphics Scientific data sources Computation Real material simulation/modeling (e.g.,
Image Acquisition Systems
 Image Acquisition Systems Goals and Terminology Conventional Radiography Axial Tomography Computer Axial Tomography (CAT) Magnetic Resonance Imaging (MRI) PET, SPECT Ultrasound Microscopy Imaging ITCS
MEDICAL IMAGE ANALYSIS
 SECOND EDITION MEDICAL IMAGE ANALYSIS ATAM P. DHAWAN g, A B IEEE Engineering in Medicine and Biology Society, Sponsor IEEE Press Series in Biomedical Engineering Metin Akay, Series Editor +IEEE IEEE PRESS
Global Illumination. CSCI 420 Computer Graphics Lecture 18. BRDFs Raytracing and Radiosity Subsurface Scattering Photon Mapping [Ch
 CSCI 420 Computer Graphics Lecture 18 Global Illumination Jernej Barbic University of Southern California BRDFs Raytracing and Radiosity Subsurface Scattering Photon Mapping [Ch. 13.4-13.5] 1 Global Illumination
Rendering Smoke & Clouds
 Rendering Smoke & Clouds Game Design Seminar 2007 Jürgen Treml Talk Overview 1. Introduction to Clouds 2. Virtual Clouds based on physical Models 1. Generating Clouds 2. Rendering Clouds using Volume Rendering
Volume Illumination, Contouring
 Volume Illumination, Contouring Computer Animation and Visualisation Lecture 0 tkomura@inf.ed.ac.uk Institute for Perception, Action & Behaviour School of Informatics Contouring Scaler Data Overview -
Fog and Cloud Effects. Karl Smeltzer Alice Cao John Comstock
 Fog and Cloud Effects Karl Smeltzer Alice Cao John Comstock Goal Explore methods of rendering scenes containing fog or cloud-like effects through a variety of different techniques Atmospheric effects make
Medical Imaging Introduction
 Medical Imaging Introduction Jan Kybic February 16, 2010 Medical imaging: a collaborative paradigm picture from Atam P. Dhawan: Medical Imaging From physiology to information processing (what we should
Previously... contour or image rendering in 2D
 Volume Rendering Visualisation Lecture 10 Taku Komura Institute for Perception, Action & Behaviour School of Informatics Volume Rendering 1 Previously... contour or image rendering in 2D 2D Contour line
Medical Image Analysis
 Computer assisted Image Analysis VT04 29 april 2004 Medical Image Analysis Lecture 10 (part 1) Xavier Tizon Medical Image Processing Medical imaging modalities XRay,, CT Ultrasound MRI PET, SPECT Generic
Introduction to Scientific Visualization
 Visualization Definition Introduction to Scientific Visualization Stefan Bruckner visualization: to form a mental vision, image, or picture of (something not visible or present to the sight, or of an abstraction);
Direct Volume Rendering
 Direct Volume Rendering CMPT 467/767 Visualization Torsten Möller Weiskopf/Machiraju/Möller Overview Volume rendering equation Compositing schemes Ray casting Acceleration techniques for ray casting Texture-based
Digital Image Processing
 Digital Image Processing SPECIAL TOPICS CT IMAGES Hamid R. Rabiee Fall 2015 What is an image? 2 Are images only about visual concepts? We ve already seen that there are other kinds of image. In this lecture
Global Illumination. Global Illumination. Direct Illumination vs. Global Illumination. Indirect Illumination. Soft Shadows.
 CSCI 480 Computer Graphics Lecture 18 Global Illumination BRDFs Raytracing and Radiosity Subsurface Scattering Photon Mapping [Ch. 13.4-13.5] March 28, 2012 Jernej Barbic University of Southern California
Medical Images Analysis and Processing
 Medical Images Analysis and Processing - 25642 Emad Course Introduction Course Information: Type: Graduated Credits: 3 Prerequisites: Digital Image Processing Course Introduction Reference(s): Insight
Rendering Algorithms: Real-time indirect illumination. Spring 2010 Matthias Zwicker
 Rendering Algorithms: Real-time indirect illumination Spring 2010 Matthias Zwicker Today Real-time indirect illumination Ray tracing vs. Rasterization Screen space techniques Visibility & shadows Instant
Ch. 4 Physical Principles of CT
 Ch. 4 Physical Principles of CT CLRS 408: Intro to CT Department of Radiation Sciences Review: Why CT? Solution for radiography/tomography limitations Superimposition of structures Distinguishing between
Data Visualization (DSC 530/CIS )
") Data Visualization (DSC 530/CIS 60-01) Scalar Visualization Dr. David Koop Online JavaScript Resources http://learnjsdata.com/ Good coverage of data wrangling using JavaScript Fields in Visualization Scalar
Data Visualization (DSC 530/CIS 60-01) Scalar Visualization Dr. David Koop Online JavaScript Resources http://learnjsdata.com/ Good coverage of data wrangling using JavaScript Fields in Visualization Scalar
Medical Image Processing: Image Reconstruction and 3D Renderings
 Medical Image Processing: Image Reconstruction and 3D Renderings 김보형 서울대학교컴퓨터공학부 Computer Graphics and Image Processing Lab. 2011. 3. 23 1 Computer Graphics & Image Processing Computer Graphics : Create,
Participating Media. Part I: participating media in general. Oskar Elek MFF UK Prague
 Participating Media Part I: participating media in general Oskar Elek MFF UK Prague Outline Motivation Introduction Properties of participating media Rendering equation Storage strategies Non-interactive
Direct Volume Rendering
 Direct Volume Rendering Balázs Csébfalvi Department of Control Engineering and Information Technology Budapest University of Technology and Economics Classification of Visualization Algorithms Indirect
Advanced Image Reconstruction Methods for Photoacoustic Tomography
 Advanced Image Reconstruction Methods for Photoacoustic Tomography Mark A. Anastasio, Kun Wang, and Robert Schoonover Department of Biomedical Engineering Washington University in St. Louis 1 Outline Photoacoustic/thermoacoustic
Optical Models of Direct Volume Rendering by Nelson Max
 Optical Models of Direct Volume Rendering by Nelson Max By Michael Shah Duration: 15~20minutes February 7, 2011 Slides and study guide available at http://www.cse.ohio-state.edu/ ~shahmi/coursework.html
Multipass GPU Surface Rendering in 4D Ultrasound
 2012 Cairo International Biomedical Engineering Conference (CIBEC) Cairo, Egypt, December 20-21, 2012 Multipass GPU Surface Rendering in 4D Ultrasound Ahmed F. Elnokrashy 1,2, Marwan Hassan 1, Tamer Hosny
Global Illumination. Global Illumination. Direct Illumination vs. Global Illumination. Indirect Illumination. Soft Shadows.
 CSCI 420 Computer Graphics Lecture 18 Global Illumination Jernej Barbic University of Southern California BRDFs Raytracing and Radiosity Subsurface Scattering Photon Mapping [Angel Ch. 11] 1 Global Illumination
Simple Lighting/Illumination Models
 Simple Lighting/Illumination Models Scene rendered using direct lighting only Photograph Scene rendered using a physically-based global illumination model with manual tuning of colors (Frederic Drago and
GPU-based Volume Rendering. Michal Červeňanský
 GPU-based Volume Rendering Michal Červeňanský Outline Volume Data Volume Rendering GPU rendering Classification Speed-up techniques Other techniques 2 Volume Data Describe interior structures Liquids,
CSE528 Computer Graphics: Theory, Algorithms, and Applications
 CSE528 Computer Graphics: Theory, Algorithms, and Applications Hong Qin State University of New York at Stony Brook (Stony Brook University) Stony Brook, New York 11794--4400 Tel: (631)632-8450; Fax: (631)632-8334
CHAPTER 1 Graphics Systems and Models 3
 ?????? 1 CHAPTER 1 Graphics Systems and Models 3 1.1 Applications of Computer Graphics 4 1.1.1 Display of Information............. 4 1.1.2 Design.................... 5 1.1.3 Simulation and Animation...........
Volume Graphics Introduction
 High-Quality Volume Graphics on Consumer PC Hardware Volume Graphics Introduction Joe Kniss Gordon Kindlmann Markus Hadwiger Christof Rezk-Salama Rüdiger Westermann Motivation (1) Motivation (2) Scientific
Global Illumination. CMPT 361 Introduction to Computer Graphics Torsten Möller. Machiraju/Zhang/Möller
 Global Illumination CMPT 361 Introduction to Computer Graphics Torsten Möller Reading Foley, van Dam (better): Chapter 16.7-13 Angel: Chapter 5.11, 11.1-11.5 2 Limitation of local illumination A concrete
CIS 467/602-01: Data Visualization
 CIS 467/60-01: Data Visualization Isosurfacing and Volume Rendering Dr. David Koop Fields and Grids Fields: values come from a continuous domain, infinitely many values - Sampled at certain positions to
MIT Monte-Carlo Ray Tracing. MIT EECS 6.837, Cutler and Durand 1
 MIT 6.837 Monte-Carlo Ray Tracing MIT EECS 6.837, Cutler and Durand 1 Schedule Review Session: Tuesday November 18 th, 7:30 pm bring lots of questions! Quiz 2: Thursday November 20 th, in class (one weeks
Lecture overview. Visualisatie BMT. Transparency. Transparency. Transparency. Transparency. Transparency Volume rendering Assignment
 Visualisatie BMT Lecture overview Assignment Arjan Kok a.j.f.kok@tue.nl 1 Makes it possible to see inside or behind objects Complement of transparency is opacity Opacity defined by alpha value with range
Illumination Under Trees. Nelson Max University of Tokyo, and University of California, Davis
 Illumination Under Trees Nelson Max University of Tokyo, and University of California, Davis Topics Hierarchical image based rendering for trees Atmospheric illumination and shadows Shadow penumbras with
CENG 477 Introduction to Computer Graphics. Ray Tracing: Shading
 CENG 477 Introduction to Computer Graphics Ray Tracing: Shading Last Week Until now we learned: How to create the primary rays from the given camera and image plane parameters How to intersect these rays
A Brief Overview of. Global Illumination. Thomas Larsson, Afshin Ameri Mälardalen University
 A Brief Overview of Global Illumination Thomas Larsson, Afshin Ameri Mälardalen University 1 What is Global illumination? Global illumination is a general name for realistic rendering algorithms Global
Constructing System Matrices for SPECT Simulations and Reconstructions
 Constructing System Matrices for SPECT Simulations and Reconstructions Nirantha Balagopal April 28th, 2017 M.S. Report The University of Arizona College of Optical Sciences 1 Acknowledgement I would like
Photorealism: Ray Tracing
 Photorealism: Ray Tracing Reading Assignment: Chapter 13 Local vs. Global Illumination Local Illumination depends on local object and light sources only Global Illumination at a point can depend on any
Continuous and Discrete Image Reconstruction
 25 th SSIP Summer School on Image Processing 17 July 2017, Novi Sad, Serbia Continuous and Discrete Image Reconstruction Péter Balázs Department of Image Processing and Computer Graphics University of
Implicit Surfaces & Solid Representations COS 426
 Implicit Surfaces & Solid Representations COS 426 3D Object Representations Desirable properties of an object representation Easy to acquire Accurate Concise Intuitive editing Efficient editing Efficient
Recollection. Models Pixels. Model transformation Viewport transformation Clipping Rasterization Texturing + Lights & shadows
 Recollection Models Pixels Model transformation Viewport transformation Clipping Rasterization Texturing + Lights & shadows Can be computed in different stages 1 So far we came to Geometry model 3 Surface
Illumination. The slides combine material from Andy van Dam, Spike Hughes, Travis Webb and Lyn Fong
 INTRODUCTION TO COMPUTER GRAPHIC S Illumination The slides combine material from Andy van Dam, Spike Hughes, Travis Webb and Lyn Fong Andries van Dam October 29, 2009 Illumination Models 1/30 Outline Physical
Computer Graphics. Sampling Theory & Anti-Aliasing. Philipp Slusallek
 Computer Graphics Sampling Theory & Anti-Aliasing Philipp Slusallek Dirac Comb (1) Constant & δ-function flash Comb/Shah function 2 Dirac Comb (2) Constant & δ-function Duality f(x) = K F(ω) = K (ω) And
9. Three Dimensional Object Representations
 9. Three Dimensional Object Representations Methods: Polygon and Quadric surfaces: For simple Euclidean objects Spline surfaces and construction: For curved surfaces Procedural methods: Eg. Fractals, Particle
Lecture 11: Ray tracing (cont.)
") Interactive Computer Graphics Ray tracing - Summary Lecture 11: Ray tracing (cont.) Graphics Lecture 10: Slide 1 Some slides adopted from H. Pfister, Harvard Graphics Lecture 10: Slide 2 Ray tracing -
Interactive Computer Graphics Ray tracing - Summary Lecture 11: Ray tracing (cont.) Graphics Lecture 10: Slide 1 Some slides adopted from H. Pfister, Harvard Graphics Lecture 10: Slide 2 Ray tracing -
03 - Reconstruction. Acknowledgements: Olga Sorkine-Hornung. CSCI-GA Geometric Modeling - Spring 17 - Daniele Panozzo
 3 - Reconstruction Acknowledgements: Olga Sorkine-Hornung Geometry Acquisition Pipeline Scanning: results in range images Registration: bring all range images to one coordinate system Stitching/ reconstruction:
Particle-Based Volume Rendering of Unstructured Volume Data
 Particle-Based Volume Rendering of Unstructured Volume Data Takuma KAWAMURA 1)*) Jorji NONAKA 3) Naohisa SAKAMOTO 2),3) Koji KOYAMADA 2) 1) Graduate School of Engineering, Kyoto University 2) Center for
Scalar Algorithms: Contouring
 Scalar Algorithms: Contouring Computer Animation and Visualisation Lecture tkomura@inf.ed.ac.uk Institute for Perception, Action & Behaviour School of Informatics Contouring Scaler Data Last Lecture...
Advanced Graphics. Path Tracing and Photon Mapping Part 2. Path Tracing and Photon Mapping
 Advanced Graphics Path Tracing and Photon Mapping Part 2 Path Tracing and Photon Mapping Importance Sampling Combine importance sampling techniques Reflectance function (diffuse + specular) Light source
Direct Volume Rendering
 Direct Volume Rendering Visualization Torsten Möller Weiskopf/Machiraju/Möller Overview 2D visualization slice images (or multi-planar reformating MPR) Indirect 3D visualization isosurfaces (or surface-shaded
Enhanced material contrast by dual-energy microct imaging
 Enhanced material contrast by dual-energy microct imaging Method note Page 1 of 12 2 Method note: Dual-energy microct analysis 1. Introduction 1.1. The basis for dual energy imaging Micro-computed tomography
Volume Illumination & Vector Field Visualisation
 Volume Illumination & Vector Field Visualisation Visualisation Lecture 11 Institute for Perception, Action & Behaviour School of Informatics Volume Illumination & Vector Vis. 1 Previously : Volume Rendering
Consider a partially transparent object that is illuminated with two lights, one visible from each side of the object. Start with a ray from the eye
 Ray Tracing What was the rendering equation? Motivate & list the terms. Relate the rendering equation to forward ray tracing. Why is forward ray tracing not good for image formation? What is the difference
CP467 Image Processing and Pattern Recognition
 CP467 Image Processing and Pattern Recognition Instructor: Hongbing Fan Introduction About DIP & PR About this course Lecture 1: an overview of DIP DIP&PR show What is Digital Image? We use digital image
Today. Anti-aliasing Surface Parametrization Soft Shadows Global Illumination. Exercise 2. Path Tracing Radiosity
 Today Anti-aliasing Surface Parametrization Soft Shadows Global Illumination Path Tracing Radiosity Exercise 2 Sampling Ray Casting is a form of discrete sampling. Rendered Image: Sampling of the ground
CS 563 Advanced Topics in Computer Graphics Irradiance Caching and Particle Tracing. by Stephen Kazmierczak
 CS 563 Advanced Topics in Computer Graphics Irradiance Caching and Particle Tracing by Stephen Kazmierczak Introduction Unbiased light transport algorithms can sometimes take a large number of rays to
5. Volume Visualization
 5. Volume Visualization Scalar volume data Medical Applications: CT, MRI, confocal microscopy, ultrasound, etc. 1 5. Volume Visualization 2 5. Volume Visualization 3 5. Volume Visualization Some possible
Sampling, Aliasing, & Mipmaps
 Sampling, Aliasing, & Mipmaps Last Time? Monte-Carlo Integration Importance Sampling Ray Tracing vs. Path Tracing source hemisphere What is a Pixel? Sampling & Reconstruction Filters in Computer Graphics
Local Illumination. CMPT 361 Introduction to Computer Graphics Torsten Möller. Machiraju/Zhang/Möller
 Local Illumination CMPT 361 Introduction to Computer Graphics Torsten Möller Graphics Pipeline Hardware Modelling Transform Visibility Illumination + Shading Perception, Interaction Color Texture/ Realism
Computational Medical Imaging Analysis
 Computational Medical Imaging Analysis Chapter 1: Introduction to Imaging Science Jun Zhang Laboratory for Computational Medical Imaging & Data Analysis Department of Computer Science University of Kentucky
Solid Modeling. Michael Kazhdan ( /657) HB , FvDFH 12.1, 12.2, 12.6, 12.7 Marching Cubes, Lorensen et al.
 HB , FvDFH 12.1, 12.2, 12.6, 12.7 Marching Cubes, Lorensen et al.") Solid Modeling Michael Kazhdan (601.457/657) HB 10.15 10.17, 10.22 FvDFH 12.1, 12.2, 12.6, 12.7 Marching Cubes, Lorensen et al. 1987 Announcement OpenGL review session: When: Today @ 9:00 PM Where: Malone
Solid Modeling Michael Kazhdan (601.457/657) HB 10.15 10.17, 10.22 FvDFH 12.1, 12.2, 12.6, 12.7 Marching Cubes, Lorensen et al. 1987 Announcement OpenGL review session: When: Today @ 9:00 PM Where: Malone
Visualisatie BMT. Rendering. Arjan Kok
 Visualisatie BMT Rendering Arjan Kok a.j.f.kok@tue.nl 1 Lecture overview Color Rendering Illumination 2 Visualization pipeline Raw Data Data Enrichment/Enhancement Derived Data Visualization Mapping Abstract
Computer Graphics and Visualization. What is computer graphics?
 CSCI 120 Computer Graphics and Visualization Shiaofen Fang Department of Computer and Information Science Indiana University Purdue University Indianapolis What is computer graphics? Computer graphics
1. Interpreting the Results: Visualization 1
 1. Interpreting the Results: Visualization 1 visual/graphical/optical representation of large sets of data: data from experiments or measurements: satellite images, tomography in medicine, microsopy,...
Voxelization in Common Sampling Lattices
 Voxelization in Common Sampling Lattices Haris Widjaya htw@cs.sfu.ca Torsten Möller torsten@cs.sfu.ca Alireza Entezari aentezar@cs.sfu.ca Abstract In this paper we introduce algorithms to voxelize polygonal
Real-Time Voxelization for Global Illumination
 Lecture 26: Real-Time Voxelization for Global Illumination Visual Computing Systems Voxelization to regular grid Input: scene triangles Output: surface information at each voxel in 3D grid - Simple case:
ECS 175 COMPUTER GRAPHICS. Ken Joy.! Winter 2014
 ECS 175 COMPUTER GRAPHICS Ken Joy Winter 2014 Shading To be able to model shading, we simplify Uniform Media no scattering of light Opaque Objects No Interreflection Point Light Sources RGB Color (eliminating
Visualisation : Lecture 1. So what is visualisation? Visualisation
 So what is visualisation? UG4 / M.Sc. Course 2006 toby.breckon@ed.ac.uk Computer Vision Lab. Institute for Perception, Action & Behaviour Introducing 1 Application of interactive 3D computer graphics to