(1B) Click Browse and select the AASPI-format file (*.H) that you want to display. After you browse the file, the Colorbar file name (1C), plot title
|
|
|
- Colleen Gardner
- 5 years ago
- Views:
Transcription

 Click the tab labeled AASPI QC Plotting.")
 that you want to display.")
1 QC PLOTTING OF AASPI-FORMAT DATA AND ATTRIBUTES Program aaspi_plot The AASPI QC Plotting tab To further quality control the conversion process, you will wish to plot your data before computing seismic attributes. You will also wish to plot your attributes before converting them to SEGY format prior to importation into your interpretation workstation software. In the aaspi_util GUI (1A) Click the tab labeled AASPI QC Plotting. The panel below appears. 1A 1D 1B 1C 1E 1F 1G 1H 1J 1I (1B) Click Browse and select the AASPI-format file (*.H) that you want to display. After you browse the file, the Colorbar file name (1C), plot title Attribute-Assisted Seismic Processing and Interpretation Page 1
2 (1D), and all axes parameters (1E) are automatically loaded. You can change all those fields to your need. By default, desired axes 1, 2, 3 are time, cdp, and line, respectively (1F). This default selection correspond to inline display type, where each panel is an inline view, with cdp as the horizontal axis and time as the vertical axis. To change the display type to cross-line view, make sure the desired axis 3 is CDP no. Similarly, to change the display type to time-slice view, make sure the desired axis 3 is Time. Note that each time you change the display type, the increment value for the 3 rd axis would be set to be 10x the original increment. For example, if you select time as the 3 rd axis, and your sample interval is 0.004s, then the time increment is automatically set at 0.04s. This is recommended because it would help increase the display loading speed by cropping the data to the new increment of the 3 rd axis and generate a smaller volume to be displayed. By default, auto-scaling is active (1G). This means the program will use statistical percentage clip to scale the data to appropriate color level. The default percentage histogram clip is 98 (1H), meaning only values between 1% and 99% of the data statistical distribution will be taken into the scaling process. Data falls below 1% or above 99% of the distribution would be clipped. Anything in between 1% and 99% distribution will be scaled in between. This is useful when you are comparing seismic amplitude data with different processing flows or different surveys that have different range of values. Click on (1G) would switch between auto-scaling and fixed-scaling modes. In fixed-scale mode, you need to define a minimum and maximum values (1H). These values are automatically loaded when you browse the input file and you can always change them to your need. Data falls below the minimum or above the maximum would be clipped. The display color would be scaled linearly from minimum value to maximum value. If the browsed data have both positive and negative values (e.g. seismic amplitude, curvatures ), specify All-positive to n (1I). Otherwise (e.g. coherence, dip magnitude ) select y. After all the parameters are set, click Execute (1J). The following figure generated by the program aaspi_plot appears: Attribute-Assisted Seismic Processing and Interpretation Page 2
3 2B 2A Attribute-Assisted Seismic Processing and Interpretation Page 3
4 Basic interaction with aaspi_plot GUI By default, the display panel will scale the vertical axis using a 3000ft/s conversion velocity (for inline and cross-line display type) or using the correct 1 inline : 1 cross-line (for time-slice display type). Click on 2A to switch to the window-size fitting mode. Click again to switch back to scaling using velocity conversion mode. You can change the replacement velocity and hit Apply to rescale the plot to your need. Click on 2B to turn on/off bilinear interpolation of the image. Interpolation makes the image look smoother. However, in some cases, it should be turned off to prevent interpolation artifacts, such as azimuthal wrap-around. Click on the double right arrow button (3A) to move to next panel (e.g. move to the next inline in inline display type). Similarly, click on the double left arrow button to move to the previous panel. The single right arrow is used to play forward the panel as a movie. To play the movie in a loop, check-mark the loop option (3B). Left arrow button is for playing backward. Square button is to stop the movie. This is useful to animate through different panels in order to see the change of a geologic feature (such as a fault or a bedding surface). The right most and left most button is used to quickly switch to the last or the first panel view. To view the coordinate and value of a data point, left click on the data point of interest (3C). The coordinate and value of the data point is displayed in the bottom status bar (3D). Note that the value are the number inside the parentheses. Attribute-Assisted Seismic Processing and Interpretation Page 4

 and click (4D) Apply.")

5 3B 3A 3C 3D To go to a specific panel of interest, click (4A) File, Goto to open the Goto panel. In this panel, you can either (4B) move the slider, or alternatively, type in the panel number on the right (4C) and click (4D) Apply. The label of the panel will change accordingly (4E). 4A 4B 4C 4E 4D Settings AASPI Plot GUI allows you to manually change plotting parameters after a data is displayed. Click on (5A) File Settings to open the settings dialog. Attribute-Assisted Seismic Processing and Interpretation Page 5
, it is better to turn off the color bar to")
 is probably the most important one that you will regularly use.")
, while fixed scaling parameters are in box (5G).")
 and you want to set zero value as the middle color of the color bar. If your data values are all positive, uncheck Symmetric about bias.")
6 5C 5D 5A 5E 5F 5B 5G In the general tab (5B), you can specify whether to show color bar, transpose image, reverse axes, and reverse color bar. If you are comparing two data of the same type but with different ranges of values (for example, seismic amplitude reprocessed in different workflow), it is better to turn off the color bar to maintain the exact size of the main plot area. In the Title/Labels tab (5C), you can change the title of the plot, as well as the axes labels and color bar label. The data ranges tab (5D) is probably the most important one that you will regularly use. This tab allow you to change from statistical scaling mode using histogram percentage distribution to fixed scale mode using minimum and maximum values(5e). These modes are mutually exclusive, so you can only use one of them at a time. Statistical scaling parameters are in box (5F), while fixed scaling parameters are in box (5G). Note that if Symmetric about bias is activated and Data bias is 0, then it would correspond to All-positive set to n in the QC plotting tab of aaspi_util, meaning your data has both positive and negative values (e.g. amplitude, curvatures ) and you want to set zero value as the middle color of the color bar. If your data values are all positive, uncheck Symmetric about bias. Changing Color Bar The color bar can be browsed in the QC Plotting tab. However, if you want to change the color bar after the data is displayed, go to (6A) File Change Color Table. The color bar dialog will pop up, allow you to change Attribute-Assisted Seismic Processing and Interpretation Page 6
, JPEG (Linux only), GIF, and BMP format graphics")

. 2.")
7 the color bar to your need (6B) and to reverse it if needed. Then click (6C) Apply (or OK) to see the change. 6A 6B 6C Exporting Graphics Files Program aaspi_plot allows you to export PNG (Linux only), JPEG (Linux only), GIF, and BMP format graphics files for use in reports and publications. This may be particularly useful in exporting images that appear better when using 24-bit color tables. There are two options to export the image. 1. Save the entire image: click (7A) File Save Image. This will save the entire image, including color bar, titles, and axes labels to an image file (7B). 2. Save only the plotting area: click (7C) File Save. This will only save the plotting area to an image file (7D). Give the file a name (7E), choose export format (7F), and click OK (7G). Attribute-Assisted Seismic Processing and Interpretation Page 7
 and alpha blending with two layers (8B). We planned to implement RGB and HLS blending methods soon.")
.")
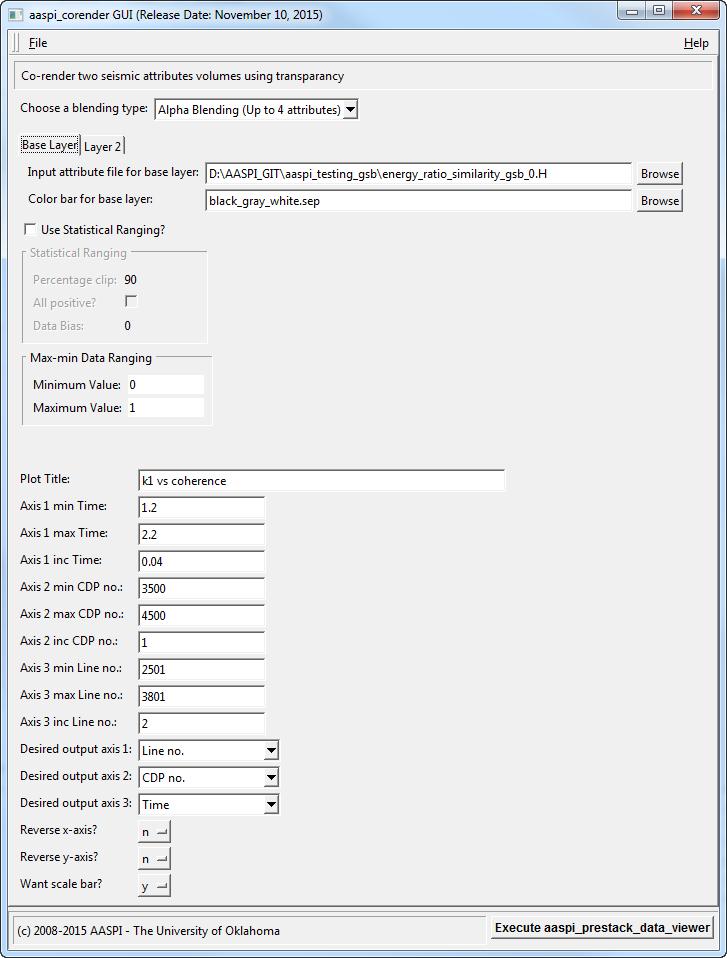
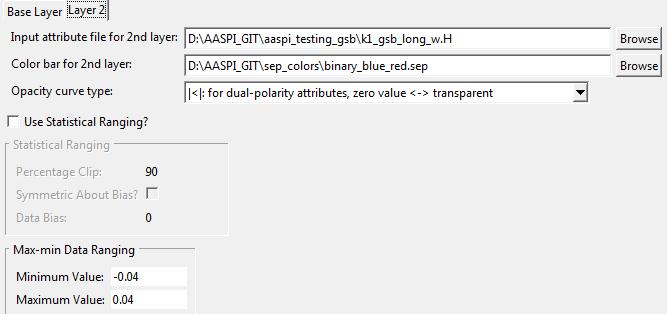
8 7A 7C 7E 7F 7G 7B 7D Co-rendering two attributes To co-render two attributes, go to Display Tools aaspi_corender (8A). Currently we support single display (no blending) and alpha blending with two layers (8B). We planned to implement RGB and HLS blending methods soon. In the tab book, specify input file, input color bar, as well as statistical or normal max-min ranging parameters for the base layer (8C) as well as the second layer (8D). In layer 2 tab, choose appropriate opacity curve for blending (8E). There are 5 choices of opacity curves: - Positive linear: low values are transparent, while high values are opaque Attribute-Assisted Seismic Processing and Interpretation Page 8
9 - Negative linear: low values are opaqe, while high values are transparent - > : near-zero values are opaque, while positive and negative values are transparent - < : near-zero values are transparent, while positive and negative values are opaque - Custom: use the embedded alpha channel in the color bar file (usually Petrel *.alut file). If an.alut file is selected for the color bar, this choice is automatically selected. Attribute-Assisted Seismic Processing and Interpretation Page 9

10 8A 8B 8C 8D 8G 8F 8E 8H Attribute-Assisted Seismic Processing and Interpretation Page 10
.")
11 In this case, we are plotting curvature as the 2 nd layer, we want to use < opacity curve type to enhance the high positive and low negative values of curvature. Notice that we also created a binary blue-red color bar, which has all red for positive values and all blue for negative value, for this blending purpose (8F). After the two layers parameters are set up, specify common parameters for plotting (8G). This is similar to the QC plot tab in aaspi_util. Finally, hit Execute (8H). The figure below shows the co-rendered result of coherence (specifically energy-ratio similarity) and most positive curvature (k 1 ) on a time-slice. Attribute-Assisted Seismic Processing and Interpretation Page 11
.")

12 If somehow you want to change co-rendering parameters for the two attributes after they are plotted, in aaspi_plot, click File Open for blending (9A). This window show almost exactly the same settings you applied to the two layers in aaspi_corender, including blending type, input file, color bar, scaling parameters, and opacity curve type (9B). Note that the input files are not the actual attributes, but rather a cropped / sliced / transposed versions of them. This is a good practice for plotting since it allows us to view the data in time slice and X-line mode, as well as increasing the panel increment so we can go through the data quicker. Change the parameters to your need, and click Apply/OK (9C) 9A 9B 9C Attribute-Assisted Seismic Processing and Interpretation Page 12

13 Looking under the hood: GUIs, parameter files, shell scripts, and application programs A few users and the system administrators may wish to know how we have put this software together. The components were discussed in reviewing our migration plans to support Windows in Section 1. The AASPI software is driven by a collection of graphical user interfaces (GUIs) written in C++ and using the Fox toolkit. These GUI read default and user-supplied parameters to generate a parameter file, which for the QC plotting program here is called aaspiviewer.parms: The GUI invokes a python script ${AASPIHOME}/pyscripts/ aaspi_aaspiviewer_poststack.py. The python script reads the parameters from the *.parms file, processes them, and then invokes application program aaspi_plot (written in C++ and also using the Fox toolkit). The bulk of our applications is written in Fortran95, run in parallel under MPI, and is not interactive. This fourlayer software architecture provides an interactive user interface, computationally efficient application codes, glued together with python scripts that provide multiplatform capabilities on Linux and Windows. If you were to inspect ${AASPIHOME}/pyscripts/ aaspi_aaspiviewer_poststack.py you would see that it reads the parameter values from the parameter file, such as those to determine whether we wish to plot time slices or vertical slices, a call to program crop that crops the data according to the input parameters, and program slice that generates time slices from the input cropped data sub-volume, prior to calling program aaspi_plot that actually plots the seismic data. Since we no longer will use pipes in order to move to Windows, we need to define temporary intermediate files. Unique temp_sliced and temp_cropped files are created by appending the time of execution to the file name. These temporary files are deleted when program aaspi_plot is closed. Occasionally, your system connection may be interrupted or a process may terminate abnormally. Nothing will be damaged if you remove any of the *.parms or temp* files in any of your directories. Attribute-Assisted Seismic Processing and Interpretation Page 13
14 Attribute-Assisted Seismic Processing and Interpretation Page 14
MODULATING A POLYCHROMATIC IMAGE BY ONE PLOTTED AGAINST LIGHTNESS: PROGRAM hlplot
 MODULATING A POLYCHROMATIC IMAGE BY ONE PLOTTED AGAINST LIGHTNESS: PROGRAM hlplot Multiattribute display of dip magnitude modulating dip azimuth Program hlplot AASPI provides two ways to blend a polychromatic
Prestack Workflows: Prestack Structure-Oriented Filtering. The Prestack Structure-Oriented Filtering Workflow. Introduction
 The Prestack Structure-Oriented Filtering Workflow. Introduction Structure-Oriented Filtering (SOF) involve many programs in AASPI software. Particularly, prestack SOF is tedious and time-consuming. To
2D Seismic Utilities Programs: aaspi_segy_read_batch aaspi_2d_combine aaspi_pseudo3d_split aaspi_mega2d_split aaspi_segy_write_batch
 2D Seismic Utilities Programs: aaspi_segy_read_batch aaspi_2d_combine aaspi_pseudo3d_split aaspi_mega2d_split aaspi_segy_write_batch Most of AASPI utilities, such as dip3d, spec_cwt, and som3d, are designed
Iterative Fault Enhancement Workflow
 Iterative Fault Enhancement Workflow. Introduction A greater degree of filtering can be obtained using three methods: (1) applying more aggressive filter parameters using the original window, (2) applying
MULTIATTRIBUTE DISPLAY: PROGRAMS hlplot, hsplot, hlsplot, rgbplot, and crossplot
 MULTIATTRIBUTE DISPLAY: PROGRAMS hlplot, hsplot, hlsplot, rgbplot, and crossplot Multiattribute display of dip magnitude modulating dip azimuth Programs hlplot and hsplot In section 6, pages 12-13, we
MODULATING A POLYCHROMATIC IMAGE BY A 2 ND IMAGE PLOTTED AGAINST SATURATION AND A 3 RD IMAGE PLOTTED AGAINST LIGHTNESS: PROGRAM hlsplot
 MODULATING A POLYCHROMATIC IMAGE BY A 2 ND IMAGE PLOTTED AGAINST SATURATION AND A 3 RD IMAGE PLOTTED AGAINST LIGHTNESS: PROGRAM hlsplot Plotting dip vs. azimuth vs. coherence Program hlsplot Earlier, we
Program flatten reads in an input seismic or attribute volume as well as a picked horizon and generates a flattened output volume:
 FLATTENING A SCALAR DATA VOLUME PROGRAM flatten Computation Flow Chart Program flatten reads in an input seismic or attribute volume as well as a picked horizon and generates a flattened output volume:
Improving Dip Estimates Program filter_dip_components
 Improving Dip Estimates Program filter_dip_components Computation flow chart The input to program filter_dip_components is generally computed from program dip3d and includes estimates of the inline and
FLATTENING AND GENERATING STRATAL SLICES PROGRAMS flatten, vector_flatten, stratal_slice, and vector_stratal_slice
 FLATTENING AND GENERATING STRATAL SLICES PROGRAMS flatten, vector_flatten, stratal_slice, and vector_stratal_slice Extracting phantom horizon and stratal slices is one of the more common interpretation
Well Log Utilities: Program LAS file importer
 Overview The well log modules in AASPI allow you to: import LAS format *.las files and convert them to *.H AASPI format, display the curves, and export AASPI-format *.H files as LAS-format *.las files.
Interactive Velocity Analysis (aaspi_iva): Program: Precompute Velocity Semblance, Interactive Velocity Analysis, Velocity Interpolation
: Program: Precompute Velocity Semblance, Interactive Velocity Analysis, Velocity Interpolation") Interactive Velocity Analysis (aaspi_iva): Program: Precompute Velocity Semblance, Interactive Velocity Analysis, Velocity Interpolation Computational Flowchart Time Migrated Prestack Gathers Post Stack
Interactive Velocity Analysis (aaspi_iva): Program: Precompute Velocity Semblance, Interactive Velocity Analysis, Velocity Interpolation Computational Flowchart Time Migrated Prestack Gathers Post Stack
Enhancing faults and axial planes Program fault_enhancement
 Enhancing faults and axial planes Program fault_enhancement Overview The fault enhancement attribute is a post-stack attribute which enhances locally planar features within a seismic attribute volume.
Seismic imaging PROGRAM aaspi_azim_offset_mig
 Seismic imaging PROGRAM aaspi_azim_offset_mig Program aaspi_azim_offset_mig is a prestack time migration based on the Kirchhoff algorithm which adds the anti_aliasing operator based on Gray, S. H. (1992).
Constructing a Geometric Attribute Workflow
 Constructing a Geometric Attribute Workflow. Introduction Attribute computation of very large data volumes can take considerable time. Experienced interpreters may already have familiarity with other data
PRESTACK STRUCTURE-ORIENTED FILTERING PROGRAM sof_prestack
 PRESTAK STRUTURE-ORIENTED FILTERING PROGRAM sof_prestack omputation Flow hart Program sof_prestack is a generalization of program sof3d For this reason, the input parameters and workflow of the two algorithms
AASPI Software Structure
 AASPI Software Structure Introduction The AASPI software comprises a rich collection of seismic attribute generation, data conditioning, and multiattribute machine-learning analysis tools constructed by
COMPUTING APPARENT DIP AND AMPLITUDE GRADIENTS PROGRAM apparent_cmpt. Apparent curvature computation flow charts
 COMPUTING APPARENT DIP AND AMPLITUDE GRADIENTS PROGRAM apparent_cmpt Apparent curvature computation flow charts inline dip crossline dip apparent_cmpt p(φ=-90 0 ) p(φ=0 0 ) p(φ=+30 0 ) p(φ=-60 0 ) p(φ=+60
INTViewer Tutorial Cube Tutorial
 INTViewer Tutorial Cube Tutorial This tutorial shows how to use INTViewer to display a seismic cube stored in a Seismic file. Windows created will include INLINE, XLINE, Time Slice and an arbitrary traverse,
Petrel TIPS&TRICKS from SCM
 E&P SOLUTIONS Petrel TIPS&TRICKS from SCM Knowledge Worth Sharing Cropped & Flattened Volumes in *Petrel Geophysicists who use D volumes often want to work on a smaller part of the volume or they want
Offset Scaling. Irfan Saputra. December 2008/CE8R3 SAMPLE IMAGE
 Offset Scaling SAMPLE IMAGE Irfan Saputra HRS Jakarta December 2008/CE8R3 Why offset scaling is needed? To correct systematic offset-dependent amplitude distortion in the gathers. This error is common
Mapping the Subsurface in 3-D Using Seisworks Part 1 - Structure Mapping
 Mapping the Subsurface in 3-D Using Seisworks Part 1 - Structure Mapping The purpose of this exercise is to introduce you to the art of mapping geologic surfaces from 3-D seismic data using Seisworks.
7. Vertical Layering
 7.1 Make Horizons 7. Vertical Layering The vertical layering process consists of 4 steps: 1. Make Horizons: Insert the input surfaces into the 3D Grid. The inputs can be surfaces from seismic or well tops,
Software Installation - Accessing Linux and Checking your Environmental Variables
 Accessing Linux and Checking your Environmental Although you may be fortunate enough to have a powerful multi-processor desktop running Linux, most of our sponsors do not. Most of our sponsors will have
Volumetric Classification: Program pca3d
 Volumetric principle component analysis for 3D SEISMIC FACIES ANALYSIS PROGRAM pca3d Overview Principal component analysis (PCA) is widely used to reduce the redundancy and excess dimensionality of the
HRS-9 Data Slice Editing and Math. Jon Brown 2013
 HRS-9 Data Slice Editing and Math Jon Brown 2013 Overview HRS-9 has several tools for editing, combining, or processing horizons and data slices. This document includes: Automated Math processes. An example
Using the Link to Petrel
 Using the Link to Petrel Prerequisites: * Petrel installed (Current supported versions are 2014, 2015 and 2016) * GeoTeric installed * Valid GeoTeric license The Link for Petrel connects automatically
Producing a Depth-Converted Seismic Horizon in Z-map
 Producing a Depth-Converted Seismic Horizon in Z-map Summary This is a reference guide to creating a depth-converted seismic horizon in LGC s Z-Map Plus TM. The procedure followed is: 1. Approximately
DW Tomo 8.1 User Guide
 DW Tomo 8.1 User Guide Copyright 2016, All rights reserved. Table of Contents Preface...1 Conventions Used in This Guide...1 Where to Find Information...1 Technical Support...2 Feedback...2 Chapter 1 Introducing
Refractor 8.1 User Guide
 Refractor 8.1 User Guide Copyright 2016, All rights reserved. Table of Contents Preface...1 Conventions Used in This Guide...1 Where to Find Information...1 Technical Support...2 Feedback...2 Chapter 1
How to...create a Video VBOX Gauge in Inkscape. So you want to create your own gauge? How about a transparent background for those text elements?
 BASIC GAUGE CREATION The Video VBox setup software is capable of using many different image formats for gauge backgrounds, static images, or logos, including Bitmaps, JPEGs, or PNG s. When the software
SlickEdit Gadgets. SlickEdit Gadgets
 SlickEdit Gadgets As a programmer, one of the best feelings in the world is writing something that makes you want to call your programming buddies over and say, This is cool! Check this out. Sometimes
animation, and what interface elements the Flash editor contains to help you create and control your animation.
 e r ch02.fm Page 43 Wednesday, November 15, 2000 8:52 AM c h a p t 2 Animating the Page IN THIS CHAPTER Timelines and Frames Movement Tweening Shape Tweening Fading Recap Advanced Projects You have totally
Transform Introduction page 96 Spatial Transforms page 97
 Transform Introduction page 96 Spatial Transforms page 97 Pad page 97 Subregion page 101 Resize page 104 Shift page 109 1. Correcting Wraparound Using the Shift Tool page 109 Flip page 116 2. Flipping
3D Horizon/Fault Interpretation Exercise Using Seismic Micro-Technology s PC based 2d/3dPAK Seismic Interpretation Software
 3D Horizon/Fault Interpretation Exercise Using Seismic Micro-Technology s PC based 2d/3dPAK Seismic Interpretation Software Prepared by Tom Wilson, Appalachian Region Resource Center, Petroleum Technology
Petrel TIPS&TRICKS from SCM
 E&P SOLUTIONS Petrel TIPS&TRICKS from SCM Knowledge Worth Sharing Petrel Inspector The Petrel Inspector was introduced in Petrel 2012 and was augmented with new features in Petrel 2013. It contains a variety
Animating the Page IN THIS CHAPTER. Timelines and Frames
 e r ch02.fm Page 41 Friday, September 17, 1999 10:45 AM c h a p t 2 Animating the Page IN THIS CHAPTER Timelines and Frames Movement Tweening Shape Tweening Fading Recap Advanced Projects You have totally
A Guide to App Studio 9.1
 A Guide to App Studio 9.1 CONTENTS Contents App Studio...4 Understanding App Studio...5 Understanding the AVE-Mag and AVE-Doc formats...6 Understanding layout families...7 Understanding App Studio publishing...8
KCS Motion. Video Motion Analysis Software
 Video Motion Analysis Software Software and supporting material is property of G. Mason, Seattle University, 2007 Overview Overview KCS Motion tracks moving objects in a video clip and analyzes their position,
GUIDE TO View3D. Introduction to View3D
 View3D Guide Introduction to View3D... 1 Starting Hampson-Russell Software... 2 Starting View3D... 4 A Brief Summary of the View3D Process... 8 Loading the Seismic and Horizon Data... 8 Viewing the Data...
Saturn User Manual. Rubén Cárdenes. 29th January 2010 Image Processing Laboratory, University of Valladolid. Abstract
 Saturn User Manual Rubén Cárdenes 29th January 2010 Image Processing Laboratory, University of Valladolid Abstract Saturn is a software package for DTI processing and visualization, provided with a graphic
Velocity (Vs) Display (1-D Profile)
 Display (1-D Profile)") PS User Guide Series 2015 Velocity (Vs) Display (1-D Profile) Prepared By Choon B. Park, Ph.D. January 2015 Table of Contents Page 1. Overview 2 2. Files 6 3. View 7 4. Edit 9 5. Chart 11 6. Layer 12 7.
PS User Guide Series 2015 Velocity (Vs) Display (1-D Profile) Prepared By Choon B. Park, Ph.D. January 2015 Table of Contents Page 1. Overview 2 2. Files 6 3. View 7 4. Edit 9 5. Chart 11 6. Layer 12 7.
Geogiga Seismic Pro 8.3 Release Notes
 Geogiga Seismic Pro 8.3 Release Notes Copyright 2017, All rights reserved. Table of Contents Introduction...1 Part 1 Utility Modules...2 Part 2 Reflection Modules...4 Updates in SF Imager...5 Updates in
Premiere Pro Desktop Layout (NeaseTV 2015 Layout)
") Premiere Pro 2015 1. Contextually Sensitive Windows - Must be on the correct window in order to do some tasks 2. Contextually Sensitive Menus 3. 1 zillion ways to do something. No 2 people will do everything
Premiere Pro 2015 1. Contextually Sensitive Windows - Must be on the correct window in order to do some tasks 2. Contextually Sensitive Menus 3. 1 zillion ways to do something. No 2 people will do everything
Background on Kingdom Suite for the Imperial Barrel Competition 3D Horizon/Fault Interpretation Parts 1 & 2 - Fault Interpretation and Correlation
 Background on Kingdom Suite for the Imperial Barrel Competition 3D Horizon/Fault Interpretation Parts 1 & 2 - Fault Interpretation and Correlation Wilson (2010) 1 Fault/Horizon Interpretation Using Seismic
GeoProbe Geophysical Interpretation Software
 DATA SHEET GeoProbe Geophysical Interpretation Software overview DecisionSpace Geosciences key features Integrated building, editing and interactive deformation of sealed multi-z bodies extracted from
Introduction to ANSYS FLUENT Meshing
 Workshop 04 CAD Import and Meshing from Conformal Faceting Input 14.5 Release Introduction to ANSYS FLUENT Meshing 2011 ANSYS, Inc. December 21, 2012 1 I Introduction Workshop Description: CAD files will
Tutorial 3. Correlated Random Hydraulic Conductivity Field
 Tutorial 3 Correlated Random Hydraulic Conductivity Field Table of Contents Objective. 1 Step-by-Step Procedure... 2 Section 1 Generation of Correlated Random Hydraulic Conductivity Field 2 Step 1: Open
BCC Sphere Transition
 BCC Sphere Transition The Sphere Transition shape models the source image onto a sphere. Unlike the Sphere filter, the Sphere Transition filter allows you to animate Perspective, which is useful in creating
Using the History Palette Part 2 - Create & Convert Quick Scripts
 Using the History Palette Part 2 - Create & Convert Quick Scripts By JP Kabala Quick Scripts are such a useful and intuitive new feature of the History Palette that it really is worth your while to take
Standard Operating Procedure of Triboindenter (Hysitron TI 950)
") Standard Operating Procedure of Triboindenter (Hysitron TI 950) I Sample Loading and Preparation DO NOT TOUCH the bottom of transducer and optical microscope. Always place the tall samples on the most
Standard Operating Procedure of Triboindenter (Hysitron TI 950) I Sample Loading and Preparation DO NOT TOUCH the bottom of transducer and optical microscope. Always place the tall samples on the most
Lesson 3 Creating and Using Graphics
 Lesson What you will learn: how to delete a sprite and import a new sprite how to draw using the pen feature of Scratch how to use the pen up and pen down feature how to change the colour of the pen how
AASPI SOFTWARE PARALLELIZATION
 AASPI SOFTWARE PARALLELIZATION Introduction Generation of multitrace and multispectral seismic attributes can be computationally intensive. For example, each input seismic trace may generate 50 or more
Exercise One: Creating a Title 3D Effect
 1 Tutorials 2 Exercise One: Creating a Title 3D Effect The exercises in this section are designed to give you a hands-on introduction to the Boris Title Generators. You will need a project with some captured
Fireworks 3 Animation and Rollovers
 Fireworks 3 Animation and Rollovers What is Fireworks Fireworks is Web graphics program designed by Macromedia. It enables users to create any sort of graphics as well as to import GIF, JPEG, PNG photos
Software Installation: AASPI Windows Installation
 AASPI Windows Installation This guide shows a step-by-step installation, running, and uninstallation of AASPI software on Windows machine. Compatibility Currently we support 64-bit Windows XP, 7, 8, 8.1,
Hypercube viewer. Robert G. Clapp, David M. Chen and Simon Luo ABSTRACT
 Hypercube viewer Robert G. Clapp, David M. Chen and Simon Luo ABSTRACT Efficient viewing and interacting with multi-dimensional data volumes is an essential part of many scientific fields. This interaction
Key areas of updates in GeoTeric Volumetrics
 Release notes GeoTeric 2018.2 Volumetrics calculation is an essential step for understanding and quantifying the size of plays, leads, prospects and fields to track changing hydrocarbon volumes over time.
About This Version ParkSEIS 2.0
 PS User Guide Series - About This Version 2.0 2016 About This Version ParkSEIS 2.0 Prepared By Choon B. Park, Ph.D. September 2016 Table of Contents Page 1. Summary 2 2. Velocity (Vs) Cross Section - Topographic
PS User Guide Series Velocity (Vs) Display (2-D Cross Section)
 Display (2-D Cross Section)") PS User Guide Series 2015 Velocity (Vs) Display (2-D Cross Section) Prepared By Choon B. Park, Ph.D. January 2015 Table of Contents Page 1. Overview 2 2. Files 4 3. View 5 4. Edit 7 5. Process 9 6. Chart
PS User Guide Series 2015 Velocity (Vs) Display (2-D Cross Section) Prepared By Choon B. Park, Ph.D. January 2015 Table of Contents Page 1. Overview 2 2. Files 4 3. View 5 4. Edit 7 5. Process 9 6. Chart
SES123 Computer Methods Lab Procedures
 SES123 Computer Methods Lab Procedures Introduction Science and engineering commonly involve numerical calculations, graphs, photographic images, and various types of figures. In this lab, you will use
Physics MRI Research Centre UNIFIT VERSION User s Guide
 Physics MRI Research Centre UNIFIT VERSION 1.24 User s Guide Note: If an error occurs please quit UNIFIT and type:.reset in the IDL command line, and restart UNIFIT. Last Update November 2016 by Katie
Desktop Studio: Charts. Version: 7.3
 Desktop Studio: Charts Version: 7.3 Copyright 2015 Intellicus Technologies This document and its content is copyrighted material of Intellicus Technologies. The content may not be copied or derived from,
SIVIC GUI Overview. SIVIC GUI Layout Overview
 SIVIC GUI Overview SIVIC GUI Layout Overview At the top of the SIVIC GUI is a row of buttons called the Toolbar. It is a quick interface for loading datasets, controlling how the mouse manipulates the
Manual Whisker Annotator
 Manual Whisker Annotator Homepage: http://www.mwa.bretthewitt.net Getting Started To get started, go to file new, and browse to the video you wish to annotate. Once the video has been selected, you will
COMPUTING APPARENT CURVATURE PROGRAM euler_curvature. Euler curvature computation flow chart. Computing Euler curvature
 COMPUTING APPARENT CURVATURE PROGRAM euler_curvature Euler curvature computation flow chart Inline dip Crossline dip curvature3d k 1 Strike of k 1 k 2 Strike of k 1 euler_curvature (φ=-90 0 ) (φ=0 0 )
Technical Whitepaper. Unlock your Subsurface Data using Seismic Explorer for ArcGIS & the ArcGIS Platform
 Technical Whitepaper Unlock your Subsurface Data using Seismic Explorer for ArcGIS & the ArcGIS Platform 1 Business Problem The Petroleum industry and their vendors have for years been talking about the
v. 9.0 GMS 9.0 Tutorial MODPATH The MODPATH Interface in GMS Prerequisite Tutorials None Time minutes
 v. 9.0 GMS 9.0 Tutorial The Interface in GMS Objectives Setup a simulation in GMS and view the results. Learn about assigning porosity, creating starting locations, different ways to display pathlines,
Petrel* Schlumberger Public
 Petrel* Schlumberger Public Copyright Notice Copyright 1998-2010 Schlumberger. All rights reserved. No part of this document may be reproduced, stored in a retrieval system, or translated in any form or
Working with the BCC 2D Particles Filter
 Working with the BCC 2D Particles Filter 2D Particles breaks the source image into particles and disperses them in 2D space. This Þlter also provides a variety of explosion, velocity, and gravity controls
Programme. Introduction to Animation Shop
 HEART Trust NTA Vocational Training Development Institute Programme Course Animations Learning Objectives: Use the animation tools Prepare for an animation Create an animation with animation
Chapter Eight: Contents
 Volume Three Modules 01 March 2002 i Chapter Eight: Contents (Output Visualizer 04 March 2002 LA-UR-00-1725 TRANSIMS 3.0) 1. INTRODUCTION...1 1.1 OVERVIEW... 1 1.2 REQUIREMENTS... 1 2. USING THE OUTPUT
CTvox Quick Start Guide
 CTvox Quick Start Guide For Software Version 3.0 CTvox Quick Start Guide (for Software Version 3.0) Page 1 Contents Version history... 3 Introduction... 4 Loading a dataset... 5 Navigating the scene...
Adding Dynamics. Introduction
 M-Graphic s User s Manual 11-1 Chapter 11 Adding Dynamics Introduction This chapter explains how to make single or multiple dynamic connections from display objects to points from OPC data servers. This
Opaque. Flowmap Generator 3
 Flowmap Shaders Table of Contents Opaque... 3 FlowmapGenerator/Opaque/Water... 4 FlowmapGenerator /Opaque/Water Foam... 6 FlowmapGenerator /Opaque/Solid... 8 Edge Fade... 9 Depth Fog... 12 Opaque The opaque
If you haven't already - Create Account in DaVinci Resolve (User Name & Password)
") COLOR CORRECTION GUIDE DAVINCI RESOLVE & ADOBE PREMIERE (v2) If you haven't already - Create Account in DaVinci Resolve (User Name & Password) In Locked Project, duplicate your Premiere Sequence. Rename
COLOR CORRECTION GUIDE DAVINCI RESOLVE & ADOBE PREMIERE (v2) If you haven't already - Create Account in DaVinci Resolve (User Name & Password) In Locked Project, duplicate your Premiere Sequence. Rename
NaysEddy ver 1.0. Example MANUAL. By: Mohamed Nabi, Ph.D. Copyright 2014 iric Project. All Rights Reserved.
 NaysEddy ver 1.0 Example MANUAL By: Mohamed Nabi, Ph.D. Copyright 2014 iric Project. All Rights Reserved. Contents Introduction... 3 Getting started... 4 Simulation of flow over dunes... 6 1. Purpose of
Desktop Studio: Charts
 Desktop Studio: Charts Intellicus Enterprise Reporting and BI Platform Intellicus Technologies info@intellicus.com www.intellicus.com Working with Charts i Copyright 2011 Intellicus Technologies This document
The 3 Voxet axes can be annotated: Menu > Voxet > Tools > Annotate Voxet > Custom system.
 Annotate Voxet The 3 Voxet axes can be annotated: Menu > Voxet > Tools > Annotate Voxet > Custom system. You can then enter the start and end coordinate values as well as custom labels. The annotation
3DMMVR REFERENCE MANUAL V 0.81
 3DMMVR REFERENCE MANUAL V 0.81 Page 1 of 30 Index: 1.0 System Requirements...5 1.1 System Processor...5 1.2 System RAM...5 1.3 Graphics Card...5 1.4 Operating System...5 2.0 Conventions...6 2.1 Typographic
Target Lithology Voxels
 Target Lithology Voxels The Target Lithology Voxels tool enables you to create a 3D grid (voxel) based on data contained in a string channel within a from-to drillhole database. A lithology voxel can be
Avizo 8 3D Analysis Software for Scientific and Industrial Data
 RELEASE NOTES - AVIZO 8.0.1, OCTOBER 2013 Dear Avizo User, Avizo 8 3D Analysis Software for Scientific and Industrial Data With this document we would like to inform you about the most important new features,
PRODUCT HIGHLIGHTS. Velocity Modeling - Time/Depth Conversion A COMPLETE SEISMIC INTERPRETATION SOLUTION
 PRODUCT HIGHLIGHTS Velocity Modeling - Time/Depth Conversion Easily create reliable velocity models and depth convert seismic volumes and interpretation. Create multi-layer horizon top equivalences to
Geology Interpretation Project Big Injun Sand & Trenton-Black River plays, Central Appalachian Basin, WV
 Geology 554 - Interpretation Project Big Injun Sand & Trenton-Black River plays, Central Appalachian Basin, WV Part 1 - Access and Basic Interpretation of the Seismic Data Using Kingdom T. H. Wilson (2005)
Tools Menu (Frequently Used Features)
") Tools Menu (Frequently Used Features) Exit VoxelCalc Shop for features Show VoxelCalc User Guide (right click on oither icons shows user guide for that function) Region of Interest (ROI) tool with beam
Tools Menu (Frequently Used Features) Exit VoxelCalc Shop for features Show VoxelCalc User Guide (right click on oither icons shows user guide for that function) Region of Interest (ROI) tool with beam
Informatik Image Markup
 Informatik Image Markup Version 7.50 User Guide May 12, 2010 Please visit www.informatik.com for the latest version of the software. 1 Table of Contents General...3 Open an Image File...3 Lines...4 Arrows...4
PS User Guide Series Dispersion-Data Display
 PS User Guide Series 2015 Dispersion-Data Display Prepared By Choon B. Park, Ph.D. January 2015 Table of Contents Page 1. Overview 2 2. Dispersion Curve (*.DC) 5 2.1 Files 5 2.2 Curves 6 2.3 Scale 7 2.4
Learning to use the drawing tools
 Create a blank slide This module was developed for Office 2000 and 2001, but although there are cosmetic changes in the appearance of some of the tools, the basic functionality is the same in Powerpoint
Repetier-Host Documentation
 Repetier-Host Documentation Installation Prerequisites Before you start with the installation, you should check if your computer meets the requirements. Currently available computers should have no problems
Three-Dimensional (Surface) Plots
 Plots") Three-Dimensional (Surface) Plots Creating a Data Array 3-Dimensional plots (surface plots) are often useful for visualizing the behavior of functions and identifying important mathematical/physical features
Three-Dimensional (Surface) Plots Creating a Data Array 3-Dimensional plots (surface plots) are often useful for visualizing the behavior of functions and identifying important mathematical/physical features
Animations in Creo 3.0
 Animations in Creo 3.0 ME170 Part I. Introduction & Outline Animations provide useful demonstrations and analyses of a mechanism's motion. This document will present two ways to create a motion animation
Adobe Flash CS4 Part 1: Introduction to Flash
 CALIFORNIA STATE UNIVERSITY, LOS ANGELES INFORMATION TECHNOLOGY SERVICES Adobe Flash CS4 Part 1: Introduction to Flash Fall 2010, Version 1.0 Table of Contents Introduction...3 Downloading the Data Files...3
Introduction to Solid Modeling Using SolidWorks 2008 COSMOSMotion Tutorial Page 1
 Introduction to Solid Modeling Using SolidWorks 2008 COSMOSMotion Tutorial Page 1 In this tutorial, we will learn the basics of performing motion analysis using COSMOSMotion. Although the tutorial can
PVRTexTool. User Manual
 Public Imagination Technologies PVRTexTool Copyright Imagination Technologies Limited. All Rights Reserved. This publication contains proprietary information which is subject to change without notice and
AVS4YOU Programs Help
 AVS4YOU Help - AVS Document Converter AVS4YOU Programs Help AVS Document Converter www.avs4you.com Online Media Technologies, Ltd., UK. 2004-2012 All rights reserved AVS4YOU Programs Help Page 2 of 39
Tangents. In this tutorial we are going to take a look at how tangents can affect an animation.
 Tangents In this tutorial we are going to take a look at how tangents can affect an animation. One of the 12 Principles of Animation is called Slow In and Slow Out. This refers to the spacing of the in
Working with Charts Stratum.Viewer 6
 Working with Charts Stratum.Viewer 6 Getting Started Tasks Additional Information Access to Charts Introduction to Charts Overview of Chart Types Quick Start - Adding a Chart to a View Create a Chart with
EMERGE Workflow CE8R2 SAMPLE IMAGE. Simon Voisey Hampson-Russell London Office
 EMERGE Workflow SAMPLE IMAGE CE8R2 Simon Voisey Hampson-Russell London Office August 2008 Introduction The document provides a step-by-step guide for producing Emerge-predicted petrophysical p volumes
Tutorial 3: Using the Waveform Viewer Introduces the basics of using the waveform viewer. Read Tutorial SIMPLIS Tutorials SIMPLIS provide a range of t
 Tutorials Introductory Tutorials These tutorials are designed to give new users a basic understanding of how to use SIMetrix and SIMetrix/SIMPLIS. Tutorial 1: Getting Started Guides you through getting
Chapter 8 Getting Started with Draw:
 Getting Started Guide Chapter 8 Getting Started with Draw: OpenOffice.org s Vector Graphics Drawing Tool OpenOffice.org Copyright This document is Copyright 2005 by its contributors as listed in the section
Lab Practical - Limit Equilibrium Analysis of Engineered Slopes
 Lab Practical - Limit Equilibrium Analysis of Engineered Slopes Part 1: Planar Analysis A Deterministic Analysis This exercise will demonstrate the basics of a deterministic limit equilibrium planar analysis