QIBA Profile: Magnetic Resonance Elastography of the Liver
|
|
|
- Beverley Cole
- 6 years ago
- Views:
Transcription

1 5 QIBA Profile: Magnetic Resonance Elastography of the Liver Stage: A. Initial Draft July 28,
2 Table of Contents Change Log:...3 Open Issues:...4 Closed Issues: Executive Summary Clinical Context and Claims Profile Activities Pre-delivery Installation Periodic QA Subject Selection Subject Handling Image Data Acquisition Image Data Reconstruction Image QA Image Distribution Image Analysis Image Interpretation Assessment Procedures Assessment Procedure: Stiffness Measurement in the Liver Test-Retest Conformance Study References...17 Appendices...18 Appendix A: Acknowledgements and Attributions...18 Appendix B: Background Information...18 Appendix C: Conventions and Definitions...18 Appendix D: Detailed Protocols...18 Appendix E: Sample Phantom QA Protocol...19
3 Change Log: This table is a best-effort of the authors to summarize significant changes to the Profile. 45 Date Sections Affected Summary of Change 12/2/2016 All Added References 12/7/ Added details on proposed test-retest study for sites to demonstrate conformance with profile. 12/23/2016 All Changed profile claim to a 19% change (revised from a 22% change) 12/23/ Added brief discussion on comparison of MRE and materials testing in phantoms and tissue to highlight complexity and explain the role of the volunteer test-retest conformance validation as opposed to a phantom study. 1/9/2017 2/3.3 Moved discussion of MRE phantom measurements and DMA testing to from the Periodic QA section to the end of the Claims discussion section. 1/9/ Changed fasting time from 3 to 4 hours. 5/5/ Revised wording regarding demonstration of conformance with the profile. 7/28/ Additional discussion was added to clarify the specific situations in which it would be necessary to demonstrate conformance to the profile.
4 Open Issues: 50 The following issues are provided here to capture associated discussion, to focus the attention of reviewers on topics needing feedback, and to track them so they are ultimately resolved. In particular, comments on these issues are highly encouraged during the Public Comment stage. Closed Issues: 55 The following issues have been considered closed by the biomarker committee. They are provided here to forestall discussion of issues that have already been raised and resolved, and to provide a record of the rationale behind the resolution. Q. The longitudinal claim presented in this profile requires that the MRE stiffness measurements (magnitude of the complex shear modulus) have a linear relationship with true stiffness. Can this be confirmed with phantom testing? A. The working group noted that existing technology does not provide a way to fabricate elastography phantoms with stiffness values that are precisely defined in advance by the composition and process. Existing dynamic mechanical testing devices used in laboratories have significant limitations for estimating the complex shear modulus of semi-solid materials. Therefore, no currently-accepted test procedure can be recommended to confirm the assumption of linearity. However, based on the physical principles of the MRE measurement process and published comparisons with benchtop mechanical testing (refs), the working group concludes that linearity is a reasonable assumption at this time. Q. Should the profile attempt to identify commercial suppliers of MRE phantoms in this first edition? A. At this time, commercial products are limited, have not been widely tested, and may only be available from some of the MRI OEM's. The draft profile describes the use of an MRE phantom to aid training and as an optional tool for generally confirming proper system operation (not to test accuracy). Accordingly, it may be appropriate to defer attempting identify commercial MRE phantoms to the second edition of the profile, when there may be more experience to confirm availability and usability. Q. References/Citations A. References were added
5 60 1. Executive Summary The goal of a QIBA Profile is to help achieve a useful level of performance for a given biomarker. The Claim (Section 2) describes the biomarker performance. The Activities (Section 3) contribute to generating the biomarker. Requirements are placed on the Actors that participate in those activities as necessary to achieve the Claim Assessment Procedures (Section 4) for evaluating specific requirements are defined as needed. This QIBA Profile (Magnetic Resonance Elastography of the Liver) addresses the application of Magnetic Resonance Elastography (MRE) for the quantification of liver stiffness, which is often used as a biomarker of liver fibrosis. It places requirements on Acquisition Devices, Technologists, Radiologists, Reconstruction Software and Image Analysis Tools involved in Subject Handling, Image Data Acquisition, Image Data Reconstruction, Image QA and Image Analysis. The requirements are focused on achieving sufficient accuracy and avoiding unnecessary variability of the measurement of hepatic stiffness. The clinical performance target is to achieve a 95% confidence interval for a true change in stiffness has occurred when there is a measured change in hepatic stiffness of 19% or larger. 75 This document is intended to help clinicians basing decisions on this biomarker, imaging staff generating this biomarker, vendor staff developing related products, purchasers of such products and investigators designing trials with imaging endpoints. Note that this document only states requirements to achieve the claim, not requirements on standard of care. Conformance to this Profile is secondary to properly caring for the patient. 80 QIBA Profiles addressing other imaging biomarkers using CT, MRI, PET and Ultrasound can be found at qibawiki.rsna.org.
6 2. Clinical Context and Claims Clinical Context Chronic liver disease (CLD) is a major health burden in the US. CLD regardless of etiology when untreated may lead to liver fibrosis and if progressive to cirrhosis and its complications. Effective treatment methods for some forms of CLD are available and can prevent progression or even result in regression of fibrosis (1, 2). A reliable non-invasive technique is needed for detection, staging and treatment response assessment of liver fibrosis. Measurement of liver stiffness (defined in this document as the magnitude of the complex shear modulus) with MR Elastography (MRE) has been shown to be useful for non-invasive detection and staging of liver fibrosis (3, 4). Published evidence has established that MRE is an accurate and reproducible technique and promising for use in clinical trials (5-7). 95 Conformance to this Profile by all relevant staff and equipment supports the following claim(s): Claim: A measured change in hepatic stiffness of 19% or larger indicates that a true change in stiffness has occurred in that patient with 95% confidence. 100 This claim holds when: A change in liver stiffness is measured at two time points with the same scanner, driver hardware, parameters, and software Discussion This claim is based on estimates of the normal liver stiffness within-subject coefficient of variation (wcv) which we have estimated as 7% (8). The Repeatability Coefficient is then 2.77 wcv, or 19%. If Y1 and Y2 are the stiffness values (in kpa) at the two time points, then the 95% confidence interval for the true change is (Y2-Y1) ± 1.96 x sqrt{ [Y1x0.07] 2 + [Y2 x0.07] 2 } kpa. Clinical interpretation with respect to the magnitude of true stiffness change: The magnitude of the true change is defined by the measured change and the error bars. For example, if 3.5 kpa and 2.5 kpa are the stiffness values at time points 1 and 2, respectively, then ( )/3.5 represents a 40% change. Since 40%>19%, we are 95% confident that a true change in hepatic stiffness has occurred. The 95% confidence interval for the true change is 1.0 ± 0.49 kpa. Multiple studies have demonstrated good agreement in mechanical stiffness of phantom materials assessed using MRE, and of the same phantom materials assessed using dynamic mechanical analyzer (DMA) instruments (9-11). These studies provide confidence in the validity of MRE-based stiffness measurements. However, routine comparisons of MRE and DMA measurements for tissue and tissuelike materials are of limited use for MRE QA due to the technical limitations of DMA testing, including the difficulty of defining the geometry of semi-solid test specimens.
7 3. Profile Activities The Profile is documented in terms of Actors performing Activities. Equipment, software, staff or sites may claim conformance to this Profile as one or more of the Actors in the following table. 125 Conformant Actors shall support the listed Activities by conforming to all requirements in the referenced Section. Table 1: Actors and Required Activities Actor Activity Section Acquisition Device Pre-delivery 3.1. Subject Handling 3.5. Image Data Acquisition 3.6. Technologist Subject Handling 3.5. Image Data Acquisition 3.6. Image Data Reconstruction 3.7. Radiologist Subject Handling 3.5. Image QA 3.8. Image Analysis Reconstruction Software Image Data Reconstruction 3.7. Image Analysis Tool Image Analysis The requirements in this Profile do not codify a Standard of Care; they only provide guidance intended to achieve the stated Claim. Failing to conform to a shall in this Profile is a protocol deviation. Although deviations invalidate the Profile Claim, such deviations may be reasonable and unavoidable and the radiologist or supervising physician is expected to do so when required by the best interest of the patient or research subject. How study sponsors and others decide to handle deviations for their own purposes is entirely up to them. 135
8 3.1. Pre-delivery There are no onsite pre-delivery testing requirements Installation 140 Installation and initial functional validation shall be performed according to manufacturer-defined procedures and specifications, including MRE driver system and pulse sequences Periodic QA 145 Required QA. Measurements of liver stiffness (magnitude of the complex shear modulus) obtained with MRE depend on the spatial fidelity of the acquired phase images. Therefore, the validity of the field of view and image linearity should be assessed and confirmed on an ongoing basis, as is already routine for all clinical scanners, using manufacturer-recommended procedures. While other instrumental causes of drift in stiffness measurements have not been documented in the literature, technical failures such as faulty synchronization of the driver system or incorrect driver frequency settings can cause incorrect measurement Optional QA. Correct user set-up and proper functioning of the MRE system can be confirmed using a phantom with a known stiffness properties. These usually consist of a uniform, tissue-simulating material with known stiffness and known stability over time and storage conditions. An MRE phantom can be used to confirm proper functioning of the MRE system after initial installation and as a periodic test of correct functioning. There is as yet no consensus on recommendations for the frequency of phantom testing. Optional QA testing with a phantom should employ a protocol recommended by the phantom manufacturer. Appendix 2 describes a sample protocol for a currently available phantom Subject Selection Local policies for patient eligibility for MRI should be followed. Definition of the relative and/or absolute contraindications to MRI is not within the scope of this document Subject Handling Subject preparation The subject should be fasting for at least 4 hours before the scheduled time of the imaging (14, 15) Subject positioning The subject will be scanned in supine position. The passive driver is placed over the right lower chest wall at the level of xiphisternum in midclavicular line. (Can be placed in the right mid-axillary line if colon is present between the anterior body wall and the liver) (16, 17). The passive driver is held in firm contact with the body wall using an elastic band. The passive driver is connected to the active driver, which is located outside the scan room, via a plastic tube.

 Note that the passive driver is connected via a plastic tube to the active driver (vibration source), which is located outside the scan room. 3.6.")
9 Figure 1: The passive driver should be placed over the right lower anterior chest wall at the level of the xiphisternum, centered on the mid-clavicular line. Once positioned, the passive driver should be held firmly against the chest wall by a wide elastic band, placed around the torso. Check to ensure that the band is stretched sufficiently so that the driver is not loose during full expiration. (video links on MR tech training to be added) Note that the passive driver is connected via a plastic tube to the active driver (vibration source), which is located outside the scan room Image Data Acquisition GRE-MRE Sequence Sequences discussed are commercially available 2D MRE acquisition techniques. Image data are acquired during suspended expiration in a natural end-expiratory position. Figure 2: Acquired sections for MRE are positioned at the level of the widest transverse extent of the liver, avoiding the dome and inferior tip of the right lobe. Sections should be prescribed in a coronal image in relaxed end-expiration.

10 See Appendix D for detailed vendor specific and scanner specific protocol parameters Technical success The raw magnitude and phase images obtained from the MRE acquisition should be reviewed on the scanner console at the time of the exam. As shown in Figure 3, the magnitude images should show signal loss in the subcutaneous fat just below the passive driver placement, confirming that mechanical waves are being applied. The phase images (also known as wave images) should demonstrate shear waves in the liver. If no waves are imaged in the liver, then the driver system should be checked. Loss of signal in subcutaneous fat adequate motion from the paddle 195 Figure 3: Valid MRE. Top row shows the magnitude images of four offsets and bottom row shows the phase (wave) images. The four offsets belong to a single slice location.


11 200 Figure 4: Magnitude (a) and color-coded wave (b) images of a successful MRE showing excellent illumination of waves through the liver. Stiffness map (c) shows elevated liver stiffness consistent with significant fibrosis. 205 Figure 5: Failed MRE Representative images of failed MRE due to colonic interposition between paddle and liver.
, phase (b), and color-coded wave (c) images show no waves traversing the liver.")
12 210 Figure 6: Failed MRE Representative images of failed MRE due to disconnection of plastic tube between passive and active drivers. Magnitude (a), phase (b), and color-coded wave (c) images show no waves traversing the liver. Stiffness map (d) has no valid data.
 has no valid data. 3.7. Image Data Reconstruction 3.7.1 DISCUSSION 220 Post-processing of the acquired magnitude and phase (wave) images is performed to create quantitative maps of liver stiffness, or elastograms.")
13 215 Figure 7: Failed MRE Representative images of failed MRE failed due to hepatic iron overload. Magnitude (a), phase (b), and color-coded wave (c) images show no waves traversing the liver. Stiffness map (d) has no valid data Image Data Reconstruction DISCUSSION 220 Post-processing of the acquired magnitude and phase (wave) images is performed to create quantitative maps of liver stiffness, or elastograms. This post-processing technique is standardized across vendors QUANTITATIVE ELASTOGRAMS 225 After the magnitude and phase images are acquired, the scanner computer automatically processes
, depicting the magnitude of the complex shear modulus in a gray or color scale. The most appropriate default scale is 0-8 kpa. 230 2.")
14 the information to generate the following images on the scanner console as illustrated in Figure Quantitative stiffness maps (elastograms), depicting the magnitude of the complex shear modulus in a gray or color scale. The most appropriate default scale is 0-8 kpa Confidence maps: quantitative elastograms in which areas where the estimated stiffness values have reduced reliability due to low wave amplitude are indicated with cross-hatching or other means. 3. Unwrapped wave images, providing a clear depiction of the observed waves. Phase wrapping occurs when the shear wave motion is large. Since MRE is a phase-based technique, the displacement data typically must be unwrapped before subsequent processing is performed. 235 Figure 8: Representation of images generated in a MRE study. Additional post-processed images may be available depending on the software version installed on the scanner Image QA 240 At the time of image review, the suitability of the data should be checked again by confirming the presence of signal loss in subcutaneous fat under the driver in the magnitude images, and presence of visible of waves in the liver in the phase and wave images (Figure 3). The quantitative elastograms of successful exams should demonstrate areas of valid stiffness data within the liver in the confidence maps (see figures 3 to 8 as representative examples of a successful
.")
15 and failed MRE studies) Image Distribution There are no specific requirements on image distribution for MRE Image Analysis 250 Mean shear stiffness of the liver is calculated using manually specified regions of interest (ROIs). The ROIs are drawn manually in the largest possible area of liver parenchyma in which coherent shear waves are visible, while excluding major blood vessels seen on the MRE magnitude images. To avoid areas of incoherent waves, avoid regions immediately under the paddle and stay ~1 cm inside the liver boundary and contain a minimum of 500 pixels per slice (3, 18). ROIs should be placed in individual slices and in the right lobe whenever possible. The mean value is calculated from all slices and reported as stiffness in kilopascals (kpa) Figure 9: Regions of interest (ROIs) should be drawn with reference to the magnitude, wave, and elastogram images. The ROI should be within the contour of the liver, excluding areas near the margins and major vessels (top row). The ROI should be modified to exclude areas with low wave amplitude as well as incoherent waves, as observed in the wave images (middle row). The ROI should also exclude areas of low confidence, as seen by the checkerboard pattern in the masked elastogram images (lower row). In practice, the ROIs may be drawn in a single step, keeping these principles in
16 mind. Generally the ROI should be confined to the right lobe of the liver. (video links on training will be added) Image Interpretation Overall mean stiffness of liver is reported by recording the mean stiffness value of each ROI and then calculating the mean value, weighted by ROI size. 270 Example: Slice 1: mean liver stiffness = 2.32 kpa and ROI size = 2500 mm 2 ; Slice 2: mean liver stiffness = 2.25 kpa and ROI size = 1500 mm 2 ; Slice 3: mean liver stiffness = 2.52 kpa and ROI size = 500 mm 2 ; and Slice 4: mean liver stiffness = 2.22 kpa and ROI size = 1000 mm 2 ; then the weighted mean = ((2.32 X 2500)+(2.25 X 1500)+(2.52 X 500) + (2.22 X 1000))/( ) = 2.30 kpa. 4. Assessment Procedures To conform to this Profile, participating staff and equipment ( Actors ) shall support each activity assigned to them in Table To support an activity, the actor shall conform to the requirements (indicated by shall language ) listed in the specifications table of the activity subsection in Section 3. Although most of the requirements described in Section 3 can be assessed for conformance by direct observation, some of the performance-oriented requirements cannot, in which case the requirement will reference an assessment procedure in a subsection here in Section Formal claims of conformance by the organization responsible for an Actor shall be in the form of a published QIBA Conformance Statement. Vendors publishing a QIBA Conformance Statement shall provide a set of Model-specific Parameters (as shown in Appendix D) describing how their product was configured to achieve conformance. Vendors shall also provide access or describe the characteristics of the test set used for conformance testing Assessment Procedure: Stiffness Measurement in the liver This procedure can be used by a vendor, physicist, or an imaging site to assess the stiffness measurement with MRE. For MRE use as a quantitative imaging biomarker of liver stiffness, it is essential to ensure quality assurance of the acquisition and image processing methodology. 290 For MRE image acquisition, it is important to consider the availability of: Appropriate imaging equipment Experienced MR technologists for the imaging procedure Procedures to ensure standardized image analysis techniques IMAGING EQUIPMENT As outlined in Section 3.2, installation and initial functional validation shall be performed according to manufacturer-defined procedures and specifications. This includes specific guidelines on the MRI scanner and MRE driver system. The scanner must be under quality assurance and quality control processes as outlined by local institution and vendor requirements. The scanner software version should be identified and tracked across time.
17 IMAGING PROCEDURE MR technologists or other site personnel performing liver MRE should be MR-certified according to site-specific local or institutional requirements. These individuals should be trained or have prior experience in conducting liver MRE as outlined in Section 3.6. Currently, there is not a standard imaging phantom for standardized image acquisition and processing procedures IMAGE ANALYSIS Image analysis software for liver MRE is standardized across vendors. Therefore, the quantitative elastograms or stiffness maps are highly reproducible across sites and vendors. For the determination of ROIs, training and procedures should be followed as outlined in Section Test-Retest Conformance Study Actors may demonstrate conformance to the profile through a test-retest repeatability study which may be performed in a group of healthy volunteers. The specific situations in which it would be advisable to prove conformity are currently the subject of study, but there is a consensus that assessment of conformity would typically be appropriate when a new version of MRE is introduced, such as by a new vendor. An important assumption underlying the claim is that the image analysis software has a within-subject test-retest coefficient of variation (wcv) of <0.07 (7%) (or RC of <19%).In order to test this assumption, N=40 normal subjects will be imaged, with each subject imaged twice on the same day (and additionally, some of these subjects may return for a third scan within one week). Subject selection should be performed as outlined in Section 3.4. The same scanner, driver hardware, parameters, and software should be used following the guidelines outlined in Section 3.5 for subject preparation and positioning. Following the liver MRE acquisition on day 1, subjects will be asked to stand and are repositioned for a second MRE exam. A third MRE exam should be performed within 7 days. The data is reconstructed and analyzed using the techniques outlined in Section 3.7 and 3.10 respectively. Let Y i1 denote the liver stiffness measurement from the first scan 1, Y i2 denote the liver stiffness measurement from the second scan, and, as available, Y i3 denote the liver stiffness measurement from the third scan on the i-th subject. For each subject, calculate the mean of the J measurements (where J=2 or 3) and the wsd: Y i = (Y ij )/ J and wsd i 2 = (Y ij Y i) 2 /(J 1). Then estimate the wcv: 335 wcv = N=40 2 i=1 (wsd i /Y i2 )/N. The percent repeatability coefficient is then calculated as follows: %RC = %wcv 2.
18 340 To demonstrate conformance with the profile claim, this estimated %RC from the test-retest study must be <19%. Appendix D: Detailed MRE Protocols For acquisition modalities, reconstruction software and software analysis tools, profile conformance requires meeting the activity specifications above in Sections 2, 3, and This Appendix provides, as an informative tool, some specific acquisition parameters, reconstruction parameters and analysis software parameters that are expected to be compatible with meeting the profile requirements.

19 350 Draft-MRE-QIBAProfile _clean.docx
20

21 230 Draft-MRE-QIBAProfile _clean.docx
22 355 Draft-MRE-QIBAProfile _clean.docx

23

24 235 Draft-MRE-QIBAProfile _clean.docx

25

26 360 Draft-MRE-QIBAProfile _clean.docx

27

28 240 Draft-MRE-QIBAProfile _clean.docx

29

30 365 Draft-MRE-QIBAProfile _clean.docx

31

32 245 Draft-MRE-QIBAProfile _clean.docx
33 370 GE 1.5T - Phantom 2DMRE Parameter Recommendations - Sep 2016 Draft 1c Scanner HDx HDx MR450w (Tentative) Software versions DV16 and DV22.1 and 24 DV16 and DV22.1 and 24 DV22.1 and 24 Scanners and Sequences Pulse sequence fgremre (Resoundant-GE) epimre (Resoundant-GE) MR-Touch (GRE) Mode 2D, zoom gradient 2D, zoom gradient 2D Options Fast, ASSET, MultiPhase ASSET, MultiPhase Fast, ASSET, MultiPhase Phantom Setup Place the 16-cm diameter cylinder phantom vertically in the torso coil, place the liver driver (facing down) on the top of the phantom and secure them with the liver MRE elastic belt tightly. Place one coronal slice at the center of the height of the phantom, with a fixed squared FOV (200 mm). Slice Positing Position feet-first, supine feet-first, supine feet-first, supine Information Input (Pretent Patient) Weight 150 Lbs 150 Lbs 150 Lbs Height Coil (note 1) Coil Torso Torso Torso Imaging Plane coronal coronal coronal No. of slices Slice thickness (mm)/gap 10 mm / 0 mm 8 mm / 2 mm 10 mm / 0 mm FOV (mm) / Phase FOV (100%) 20cm/1 (note 4) 20cm/1 (note 4) 20cm/1 (note 4) Matrix TE (msec) in-phase TE (about 18.2) (note 7) min full TE (note 1) min full TE (type a value colse to 18.2 if possible) TR (msec) Flip Angle (degree) 25 default (90) 25 Imaging Prameters NEX, EPI shots 1 8, 4shot 1 Bandwidth (khz) (hard coded) Freq Encoding Dir Superior-Inferior Superior-Inferior Superior-Inferior Phases per Location 4 4 Phase Acq. Order Interleaved Interleaved Delay After Acq. Minimum Minimum Acceleration ASSET (Note 1) ASSET (Note 1) ASSET (Note 1) Acceleration factor No. of breath holds
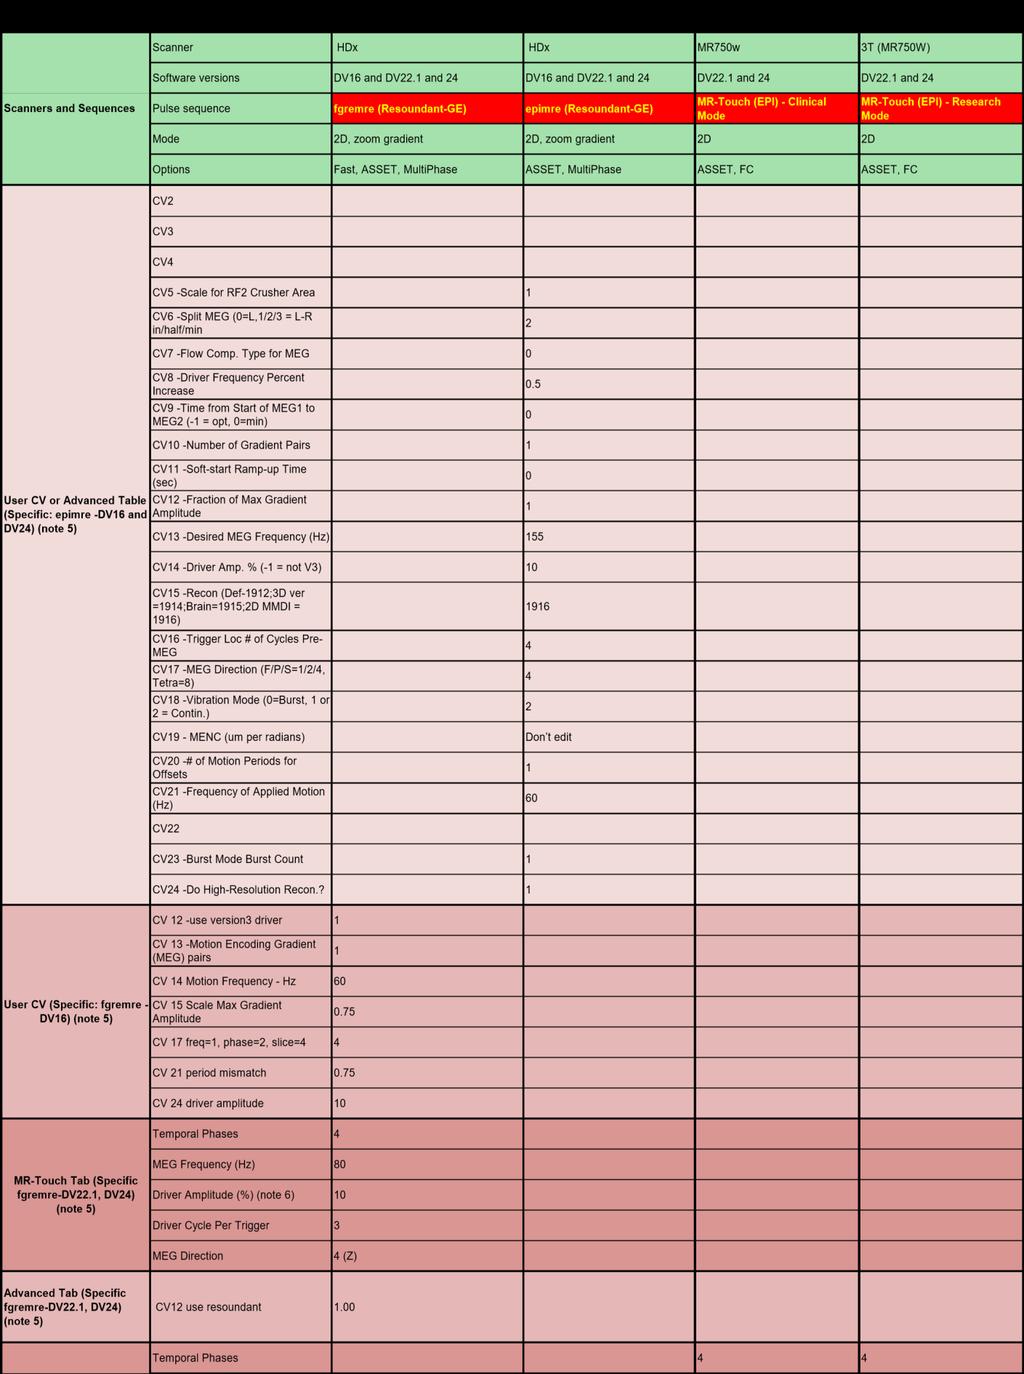
34 Shimming Volume Cover the whole phantom Cover the whole phantom Cover the whole phantom Spectrum Peaks Peak with middle freq (there are 3 peaks) Peak with middle freq (there are 3 peaks) Peak with middle freq (there are 3 peaks) Saturation Band SI SI SI scan time about 28 s (note 2) about 1 min 13 sec about 28 sec (note 2) Driver Power (%) Driver Parameters (Generic) (note 5) Driver frequency (Hz) GE 1.5T - Phantom 2DMRE Parameter Recommendations - Sep 2016 Draft 1c Scanner HDx HDx MR450w (Tentative) Software versions DV16 and DV22.1 and 24 DV16 and DV22.1 and 24 DV22.1 and 24 Scanners and Sequences Pulse sequence fgremre (Resoundant-GE) epimre (Resoundant-GE) MR-Touch (GRE) Mode 2D, zoom gradient 2D, zoom gradient 2D Options Fast, ASSET, MultiPhase ASSET, MultiPhase Fast, ASSET, MultiPhase Motion Encoding Gradients (Generic) (note 5) Driver cycles/ trigger (Duration) 3 (auto-caculated) Auto-calculated Auto-caculated MEG frequency (Hz) (or Period Mismatch) 75 Hz (0.8) MEG Amplitude (G/cm) About 3 G/cm with Zoom gradient (75%) (note 3) Full Scale (note 3) Axis of MEG 4 (Z) 4 (Z) 4 (Z) CV0 -Ramp Sampling (1=on, 0=off) 1 CV1 CV2 CV3 CV4 CV5 -Scale for RF2 Crusher Area 1 CV6 -Split MEG (0=L,1/2/3 = L-R in/half/min 2 CV7 -Flow Comp. Type for MEG 0 User CV or Advanced Table CV8 -Driver Frequency Percent (Specific: epimre -DV16 Increase 0.5 and DV24) (note 5) CV9 -Time from Start of MEG1 to MEG2 (-1 = opt, 0=min) 0 CV10 -Number of Gradient Pairs 1 CV11 -Soft-start Ramp-up Time (sec) 0 CV12 -Fraction of Max Gradient Amplitude 1 CV13 -Desired MEG Frequency (Hz) 155 CV14 -Driver Amp. % (-1 = not V3) 10 CV15 -Recon (Def-1912;3D ver =1914;Brain=1915;2D MMDI = 1916) 1916 CV16 -Trigger Loc # of Cycles Pre- MEG 4
35 CV17 -MEG Direction (F/P/S=1/2/4, Tetra=8) 4 CV18 -Vibration Mode (0=Burst, 1 or 2 = Contin.) 2 CV19 - MENC (um per radians) Don t edit CV20 -# of Motion Periods for Offsets 1 CV21 -Frequency of Applied Motion (Hz) 60 CV22 CV23 -Burst Mode Burst Count 1 CV24 -Do High-Resolution Recon.? 1 CV 12 -use version3 driver 1 CV 13 -Motion Encoding Gradient (MEG) pairs 1 CV 14 Motion Frequency - Hz 60 GE 1.5T - Phantom 2DMRE Parameter Recommendations - Sep 2016 Draft 1c Scanner HDx HDx MR450w (Tentative) Software versions DV16 and DV22.1 and 24 DV16 and DV22.1 and 24 DV22.1 and 24 Scanners and Sequences Pulse sequence fgremre (Resoundant-GE) epimre (Resoundant-GE) MR-Touch (GRE) Mode 2D, zoom gradient 2D, zoom gradient 2D User CV (Specific: fgremre DV16) (note 5) Options Fast, ASSET, MultiPhase ASSET, MultiPhase Fast, ASSET, MultiPhase CV 15 Scale Max Gradient Amplitude 0.75 CV 17 freq=1, phase=2, slice=4 4 CV 21 period mismatch 0.8 CV 24 driver amplitude 10 Temporal Phases 4 MR-Touch Tab (Specific fgremre-dv22.1, DV24) (note 5) MEG Frequency (Hz) 75 Driver Amplitude (%) (note 6) 10 Driver Cycle Per Trigger 3 MEG Direction 4 (Z) Advanced Tab (Specific fgremre-dv22.1, DV24) (note 5) CV12 use resoundant 1.00 Temporal Phases 4 MR-Touch Tab (Specific MR- Touch sequence -DV22.1, DV24) (note 5) MEG Frequency (Hz) 75 Driver Amplitude (%) (note 6) 10 Driver Cycle Per Trigger 3 MEG Direction 4 (Z)
36 NOTE: (1) Always use torso coil (multi-channel), add pads around the phantom to support the top part of the torsol coil, which should not contact the phantom; if other coils that do not support parallel imaging is used, then the ASSET is turned off automatically, scan time is longer. (2) For GREMRE, scan time can vary depending on the FOV (in phase dir) setup - decreasing phase FOV can slightly decrease scan time; however, do not do this for the phantom. (3) Depending on your gradient hardware peformance, the absolute gradient strenth could be differnet. (4) FOV is recommendated to be a fixed value (200 mm), even for this 16-cm diameter cylinder phantom. (5) The specific tab and parameters can be different for different software versions and MRE sequences; the generic parameters for driver and motion encoding gradients are the guidline to those specific tab and parameters; overall, this recommendation is conservative so that it can be successfully performmed at all software versions and scanners.(6) Driver Frequencey is 60Hz (default). (7) FC is not supported with F/W in phase TE, FC should be turned off; if this causes trouble, then Try min full TE. GE 3T - Phantom 2DMRE Parameter Recommendations - Sep 2016 Draft 1c Scanner HDx HDx MR750w 3T (MR750W) Software versions DV16 and DV22.1 and 24 DV16 and DV22.1 and 24 DV22.1 and 24 DV22.1 and 24 Scanners and Sequences Pulse sequence fgremre (Resoundant-GE) epimre (Resoundant-GE) MR-Touch (EPI) - Clinical Mode Mode 2D, zoom gradient 2D, zoom gradient 2D 2D MR-Touch (EPI) - Research Mode Options Fast, ASSET, MultiPhase ASSET, MultiPhase ASSET, FC ASSET, FC Phantom Setup Place the 16-cm diameter cylinder phantom vertically in the torso coil, place the liver driver (facing down) on the top of the phantom and secure them with the liver MRE elastic belt tightly. Place one coronal slice at the center of the height of the phantom, with a fixed squared FOV (200 mm). Slice Positing Position feet-first, supine feet-first, supine feet-first, supine feet-first, supine Information Input (Pretent Patient) Weight 150 Lbs 150 Lbs 150 Lbs 150 Lbs Height Coil (note 1) Coil Torso Torso Torso Torso Imaging Plane coronal coronal coronal coronal No. of slices Slice thickness (mm)/gap 10 mm / 0 mm 8 mm / 2 mm 8 mm / 2 mm 8 mm / 2 mm FOV (cm) / Phase FOV (100%) 20cm/1 (note 4) 20cm/1 (note 4) 20cm/1 (note 4) 20cm/1 (note 4) Matrix TE (msec) min full (around 15.9, this is close to inphase TE) min full( around 31 msec) (note 1) min full( around 57.6 msec) (note 1) min full (note 1) TR (msec) (display CV -> act_tr = ) Flip Angle (degree) 20 default (90) default (90) default (90) NEX, EPI shots 1 8, 4shot 1, 1shot 1, 8-shot (display CV -> touch_maxshots = 8)) Bandwidth (khz) (hard coded) 250 (hard coded) 250 (hard coded) Imaging Prameters Freq Encoding Dir Superior-Inferior Superior-Inferior Superior-Inferior Superior-Inferior Phases per Location 4 4 Phase Acq. Order Interleaved Interleaved Delay After Acq. Minimum Minimum Acceleration ASSET (Note 1) ASSET (Note 1) ASSET (Note 1) (Note 2) ASSET Acceleration factor No. of breath holds Shimming Volume Cover the whole phantom Cover the whole phantom Cover the whole phantom Cover the whole phantom Spectrum Peaks Saturation Band Peak with middle freq (there are 3 peaks) Peak with middle freq (there are 3 peaks) Peak with middle freq (there are 3 peaks) Peak with middle freq (there are 3 peaks) scan time 28 s (note 2) 1 min 13 sec 10 sec 24 sec
37 Driver Power (%) Driver Parameters (Generic) (note 5) Driver frequency (Hz) Driver cycles/ trigger (Duration) 3 (auto-caculated) Auto-calculated Auto-calculated Auto-calculated Motion Encoding Gradients (Generic) (note 5) MEG frequency (Hz) (or Period Mismatch) MEG Amplitude (G/cm) 80 Hz (0.75) About 1.7 G/cm with whole gradient (75%) (note 3) Full Scale (note 3) Axis of MEG 4 (Z) 4 (Z) 4 (Z) 4 (Z) CV0 -Ramp Sampling (1=on, 0=off) 1 CV1
38
39 375 GE 3T - Phantom 2DMRE Parameter Recommendations - Sep 2016 Draft 1c Scanner HDx HDx MR750w 3T (MR750W) Software versions DV16 and DV22.1 and 24 DV16 and DV22.1 and 24 DV22.1 and 24 DV22.1 and 24 Scanners and Sequences Pulse sequence fgremre (Resoundant-GE) epimre (Resoundant-GE) MR-Touch (EPI) - Clinical Mode Mode 2D, zoom gradient 2D, zoom gradient 2D 2D MR-Touch (EPI) - Research Mode Options Fast, ASSET, MultiPhase ASSET, MultiPhase ASSET, FC ASSET, FC MR-Touch Tab (Specific MEG Frequency (Hz) MR- Touch sequence -DV22.1, DV24) (note 5) Driver frequency (Hz) Driver Amplitude (%) MEG Direction Z Z Driver Cycle Per Trigger 15 (Not for edit) 15 (Not for edit) MENC um/rad 28.5 (Not for edit) 28.5 (Not for edit) (Note 3) NOTE: (1) Always use torso coil (multi-channel), add pads around the phantom to support the top part of the torsol coil, which should not contact the phantom; if other coils that do not support parallel imaging is used, then the ASSET is turned off automatically, scan time is longer. (2) For GREMRE, scan time can vary depending on the FOV (in phase dir) setup - decreasing phase FOV can slightly decrease scan time; however, do not do this for the phantom. (3) Depending on your gradient hardware peformance, the absolute gradient strenth could be differnet. (4) FOV is recommendated to be a fixed value (200 mm), even for this 16-cm diameter cylinder phantom. (5) The specific tab and parameters can be different for different software versions and MRE sequences; the generic parameters for driver and motion encoding gradients are the guidline to those specific tab and parameters; overall, this recommendation is conservative so that it can be successfully performmed at all software versions and scanners.(6) Driver Frequencey is 60Hz (default).
40 Siemens 1.5T - Phantom 2DMRE Parameter Recommendations - Sep 2016 Draft 1c Scanner Scanners and Sequences Software versions Pulse sequence gremre epsemre(wip) Mode 2D 2D Phantom Setup Place the 16-cm diameter cylinder phantom vertically in the torso coil, place the liver driver (facing down) on the top of the phantom and secure them with the liver MRE elastic belt tightly. Place one coronal slice at the center of the height of the phantom, with a fixed squared FOV (200 mm). Slice Positing Position head-first, supine head-first, supine Information Input (Pretent Patient) Weight 150 Lbs 150 Lbs Height 5 ft 5 ft Coil (note 1) Coil Torso Torso Imaging Plane Coronal Coronal No. of slices 1 1 Slice thickness (mm)/dist. Factor 10 mm / 0% (0) 8 mm / 25% (2mm) FOV (mm) / Phase FOV (100%) 200mm/1 (note 4) 200mm/1 (note 4) Matrix (Base Phase) %(64) %(128) TE (msec) min (about ~20 with flow comp off) min Imaging Prameters TR (msec)
41 Flip Angle (degree) 25 default (90) NEX, EPI shots 1 1, 1shot Bandwidth (Hz/Pixel) 260 Hz/pixel 1502 Hz/pixel Phase enc.dir. Right-Left Right-Left Acceleration GRAPPA (note 1) GRAPPA (note 1) Acceleration factor 1 1 No. of breath holds NA NA Siemens 1.5T - Phantom 2DMRE Parameter Recommendations - Sep 2016 Draft 1c Scanner Scanners and Sequences Software versions Pulse sequence gremre epsemre(wip) Mode 2D 2D Shimming Volume auto auto Spectrum Peaks Peak with middle freq (there are 3 peaks) Peak with middle freq (there are 3 peaks) Saturation Band scan time 34 sec 11 sec Driver Parameters (Generic) (note 5) Driver Power (%) 10 (default) (note 6) 10 (default) (note 6) Driver frequency (Hz) 60 (default) (note 6) 60 (default) (note 6) Driver cycles/ trigger (Duration) 3 (default) (note 6) 3 (default) (note 6) MEG frequency (Hz) 60 Hz (Hard Coded) 60 Hz (Hard Coded) Motion Encoding Gradients (Generic) (note 5) MEG Amplitude (Hard coded) 30 mt/m (Hard coded) Axis of MEG Slice (Hard Coded) Slice Number of phase 4 (Hard coded) 4 (Hard coded) Specific Parameters (note 5) Sequence - Part 1 - Flow Comp NO YES Sequence - Special - MEG Ampltude (mt/m) Not available 30
42 Sequence - Special - MEG Frequency (Hz) Not available 60.0 Sequence - Special - MEG Waveform Not available Sequence - Special - MEG Direction Not available Slice System - Tx/Rx - Img. Scale Cor. 1 1 Resolution - Filter Image - Prescan Normalize Check Check NOTE: (1) Always use torso coil (multi-channel), add pads around the phantom to support the top part of the torsol coil, which should not contact the phantom; if other coils that do not support parallel imaging is used, then the ASSET is turned off automatically, scan time is longer. (2) For GREMRE, scan time can vary depending on the FOV (in phase dir) setup - decreasing phase FOV can slightly decrease scan time; however, do not do this for the phantom. (3) Depending on your gradient hardware peformance, the absolute gradient strenth could be differnet. (4) FOV is recommendated to be a fixed value (200 mm), even for this 16-cm diameter cylinder phantom. (5) The specific tab and parameters can be different for different software versions and MRE sequences; the generic MRE parameters for driver and motion encoding gradients are the guidline to those specific tab and parameters (MRE-related); overall, this recommendation is conservative so that it can be successfully performmed at all software versions and scanners. (6) The current implementation of Semiens MRE does not access active driver, those values are default values and can be changed by using a seprate web connection to the active driver (Syngo or Laptop); epsemre sequences delivers one trigger every 50ms. Siemens 3T - Phantom 2DMRE Parameter Recommendations - Sep 2016 Draft 1c Scanner Skyra Skyra Scanners and Sequences Software versions VE11A VE11A Pulse sequence gremre epsemre(wip) Mode 2D 2D Phantom Setup Place the 16-cm diameter cylinder phantom vertically in the torso coil, place the liver driver (facing down) on the top of the phantom and secure them with the liver MRE elastic belt tightly. Place one coronal slice at the center of the height of the phantom, with a fixed squared FOV (200 mm). Slice Positing Position head-first, supine head-first, supine Information Input (Pretent Patient) Weight 150 Lbs 150 Lbs Height 5 ft 5 ft
43 Coil (note 1) Coil Torso Torso Imaging Plane Coronal Coronal No. of slices 1 1 Slice thickness (mm)/dist. Factor 10 mm / 0% (0) 8 mm / 25% (2mm) FOV (mm) / Phase FOV (100%) 200mm/1 (note 4) 200mm/1 (note 4) Matrix (Base Phase) %(64) %(128) TE (msec) min (about ~20 with flow comp off) min TR (msec) Flip Angle (degree) 20 default (90) NEX, EPI shots 1 1, 1shot Bandwidth (Hz/Pixel) 260 Hz/pixel 1502 Hz/pixel Phase enc.dir. Right-Left Right-Left Acceleration GRAPPA (note 1) GRAPPA (note 1) Acceleration factor Imaging Prameters No. of breath holds NA NA Siemens 3T - Phantom 2DMRE Parameter Recommendations - Sep 2016 Draft 1c Scanner Skyra Skyra Scanners and Sequences Software versions VE11A VE11A Pulse sequence gremre epsemre(wip) Mode 2D 2D Shimming Volume auto auto Spectrum Peaks Peak with middle freq (there are 3 peaks) Peak with middle freq (there are 3 peaks) Saturation Band
44 scan time 34 sec 11 sec Driver Parameters (Generic) (note 5) Driver Power (%) 10 (default) (note 6) 10 (default) (note 6) Driver frequency (Hz) 60 (default) (note 6) 60 (default) (note 6) Driver cycles/ trigger (Duration) 3 (default) (note 6) 3 (default) (note 6) MEG frequency (Hz) 60 Hz (Hard Coded) 60 Hz (Hard Coded) Motion Encoding Gradients (Generic) (note 5) MEG Amplitude (Hard coded) 30 mt/m (Hard coded) Axis of MEG Slice (Hard Coded) Slice Number of phase 4 (Hard coded) 4 (Hard coded) Sequence - Part 1 - Flow Comp NO YES Sequence - Special - MEG Ampltude (mt/m) Not available 30 Sequence - Special - MEG Frequency (Hz) Not available 60.0 Specific Parameters (note 5) Sequence - Special - MEG Waveform Not available Sequence - Special - MEG Direction Not available Slice System - Tx/Rx - Img. Scale Cor. 1 1 Resolution - Filter Image - Prescan Normalize Check Check NOTE: (1) Always use torso coil (multi-channel), add pads around the phantom to support the top part of the torsol coil, which should not contact the phantom; if other coils that do not support parallel imaging is used, then the ASSET is turned off automatically, scan time is longer. (2) For GREMRE, scan time can vary depending on the FOV (in phase dir) setup - decreasing phase FOV can slightly decrease scan time; however, do not do this for the phantom. (3) Depending on your gradient hardware peformance, the absolute gradient strenth could be differnet. (4) FOV is recommendated to be a fixed value (200 mm), even for this 16-cm diameter cylinder phantom. (5) The specific tab and parameters can be different for different software versions and MRE sequences; the generic MRE parameters for driver and motion encoding gradients are the guidline to those specific tab and parameters (MRE-related); overall, this recommendation is conservative so that it can be successfully performmed at all software versions and scanners. (6) The current implementation of Semiens MRE does not access active driver, those values are default values and can be changed by using a seprate web connection to the active driver (Syngo or Laptop); epsemre sequences delivers one trigger every 50ms. Philips 1.5T - Phantom 2DMRE Parameter Recommendations - Sep 2016 Draft 1c Scanner Ingenia Ingenia Scanners and Sequences Software versions Pulse sequence GRE MRE 2D SE-EPI MRE Mode 2D 2D
45 Phantom Setup Place the 16-cm diameter cylinder phantom vertically in the torso coil, place the liver driver (facing down) on the top of the phantom and secure them with the liver MRE elastic belt tightly. Place one coronal slice at the center Slice Positing height of the phantom, with a fixed squared FOV (200 mm). of the Position feet-first, supine feet-first, supine Information Input (Pretent Patient) Weight 150 Lbs 150 Lbs Height Coil (note 1) Coil Torso Torso Imaging Plane Coronal Coronal No. of slices 1 1 Slice thickness (mm)/gap 10 mm / 0 mm 8 mm / 2 mm FOV (mm) / Phase FOV (100%) 200/1 (note 4) 200/1 (note 4) Matrix TE (msec) min or 20 min or 58 TR (msec) Flip Angle (degree) 25 default (90) NEX, EPI shots 1 1, 1shot Bandwidth (Hz/Pixel) 288 Hz/pixel 88 Hz/pixel Freq Encoding Dir Superior-Inferior Superior-Inferior Acceleration SENSE (note 1) SENSE (note 1) Imaging Prameters Acceleration factor 1 1
46 No. of breath holds 4 (note 2) 1 Philips 1.5T - Phantom 2DMRE Parameter Recommendations - Sep 2016 Draft 1c Scanner Ingenia Ingenia Scanners and Sequences Software versions Pulse sequence GRE MRE 2D SE-EPI MRE Mode 2D 2D Shimming Volume Cover the whole body Cover the whole body Spectrum Peaks Peak with middle freq (there are 3 peaks) Peak with middle freq (there are 3 peaks) Saturation Band scan time 30 s (note 2) 19 sec Driver Parameters (Generic) (note 5) Driver Power (%) Driver frequency (Hz) Driver cycles/ trigger (Duration) 3 (auto-caculated) Auto-calculated MEG frequency (Hz) (or Period Mismatch) 60 Hz 60 Hz Motion Encoding Gradients (Generic) (note 5) MEG Amplitude (G/cm) note 3 note 3 Axis of MEG 4 (Z) 4 (Z) Number of phase 4 4 Specific Parameters (To be specified) NOTE: (1) Always use torso coil (multi-channel), add pads around the phantom to support the top part of the torsol coil, which should not contact the phantom; if other coils that do not support parallel imaging is used, then the ASSET is turned off automatically, scan time is longer. (2) For GREMRE, scan time can vary depending on the FOV (in phase dir) setup - decreasing phase FOV can slightly decrease scan time; however, do not do this for the phantom. (3) Depending on your gradient hardware peformance, the absolute gradient strenth could be differnet. (4) FOV is recommendated to be a fixed value (200 mm), even for this 16-cm diameter cylinder phantom. (5) The specific tab and parameters can be different for different software versions and MRE sequences; the generic MRE parameters for driver and motion encoding gradients are the guidline to those specific tab and parameters (MRE-related); overall, this recommendation is conservative so that it can be successfully performmed at all software versions and scanners. Philips 3T - Phantom 2DMRE Parameter Recommendations - Sep 2016 Draft 1c Scanners and Sequences Scanner Ingenia Ingenia
.")
47 Software versions Pulse sequence GRE MRE 2D SE-EPI MRE Mode 2D 2D Phantom Setup Place the 16-cm diameter cylinder phantom vertically in the torso coil, place the liver driver (facing down) on the top of the phantom and secure them with the liver MRE elastic belt tightly. Place one coronal slice at the center of the height of the phantom, with a fixed squared FOV (200 mm). Slice Positing Position feet-first, supine feet-first, supine Information Input (Pretent Patient) Weight 150 Lbs 150 Lbs Height Coil (note 1) Coil Torso Torso Imaging Plane Coronal Coronal No. of slices 1 1 Slice thickness (mm)/gap 10 mm / 0 mm 8 mm / 2 mm FOV (mm) / Phase FOV (100%) 400/1 (note 4) 200/1 (note 4) Matrix TE (msec) min or 20 min or 58 TR (msec) Flip Angle (degree) 20 default (90) NEX, EPI shots 1 1, 1shot Imaging Prameters Bandwidth (Hz/Pixel) 288 Hz/pixel 88 Hz/pixel
48 Freq Encoding Dir Superior-Inferior Superior-Inferior Acceleration SENSE (note 1) SENSE (note 1) Acceleration factor 1 1 No. of breath holds 4 (note 2) 1 Philips 3T - Phantom 2DMRE Parameter Recommendations - Sep 2016 Draft 1c Scanner Ingenia Ingenia Scanners and Sequences Software versions Pulse sequence GRE MRE 2D SE-EPI MRE Mode 2D 2D Shimming Volume Cover the whole phantom Cover the whole phantom Spectrum Peaks Peak with middle freq (there are 3 peaks) Peak with middle freq (there are 3 peaks) Saturation Band scan time 30 s (note 2) 19 sec Driver Parameters (Generic) (note 5) Driver Power (%) Driver frequency (Hz) Driver cycles/ trigger (Duration) 3 (auto-caculated) Auto-calculated MEG frequency (Hz) (or Period Mismatch) 60 Hz 60 Hz Motion Encoding Gradients (Generic) (note 5) MEG Amplitude (G/cm) note 3 note 3 Axis of MEG 4 (Z) 4 (Z) Number of phase 4 4 Specific Parameters (To be specified) NOTE: (1) Always use torso coil (multi-channel), add pads around the phantom to support the top part of the torsol coil, which should not contact the phantom; if other coils that do not support parallel imaging is used, then the ASSET is turned off automatically, scan time is longer. (2) For GREMRE, scan time can vary depending on the FOV (in phase dir) setup - decreasing phase FOV can slightly decrease scan time; however, do not do this for the phantom. (3) Depending on your gradient hardware peformance, the absolute gradient strenth could be differnet. (4) FOV is recommendated to be a fixed value (200 mm), even for this 16-cm diameter cylinder phantom. (5) The specific tab and parameters can be different for different software versions and MRE sequences; the generic MRE parameters for driver and motion encoding gradients are the guidline to those specific tab and parameters (MRE-related); overall, this recommendation is conservative so that it can be successfully performmed at all software versions and scanners. 385
 for measuring phantom stiffness, as well as a QA schedule and pass criteria.")

 Position the bottom part of the patient torso")
 Put the friction cloth on the top of the phantom 5) Put the patient liver driver on the friction cloth 6) Wrap the phantom, friction cloth and driver with the elastic belt")
49 Appendix E: Sample Phantom QA Protocol This activity describes MRE system Quality Assurance (QA) method using MRE QA phantoms, including the phantom setup, phantom imaging parameters and region of interest (ROI) for measuring phantom stiffness, as well as a QA schedule and pass criteria. QA PHANTOM The MRE system QA phantom is made of Polyvinyl Chloride (PVC) in a 12.5cm Ø15.5cm cylinder container with 0.15 cm wall thickness. It should be handled carefully when being transferred from on location to another to avoid dropping. PHANTOM SETUP: The MRE system QA phantoms setup uses the patient liver MRE driver, the patient elastic belt, a phantom specific friction cloth, and the patient torso RF coil. There are 10 steps for a typical QA phantom setup; the goal of the setup is to make sure the phantom is sitting on the table vertically and stably: 1) Position the bottom part of the patient torso coil on the patient table 2) Put the patient elastic belt on the bottom coil 3) Put the MRE standard phantom on the elastic belt vertically Figure 2. MRE QA Phantom Setup 4) Put the friction cloth on the top of the phantom 5) Put the patient liver driver on the friction cloth 6) Wrap the phantom, friction cloth and driver with the elastic belt tightly 7) Put some cushions around the MRE Phantom to support the top part of the torso coil, which should not contact the phantom 8) Put the top part of the torso coil on the cushions 9) Connect the liver driver to the tube of MRE active driver 10) Advance to scan PHANTOM IMAGING PARAMETERS Patient MRE sequences are used for the MRE system QA, but with different imaging parameters. Phantom imaging parameters have been optimized according to its T1 and T2 relaxation time, chemical spectrum and geometry, which are very different from the patients. Detailed parameters for GRE MRE and EPI MRE sequences at both 1.5-T and 3-T platforms of the three vendors (GE, Siemens and Philips) are attached (Phantom 2DMRE Parameters - Hepatic Driver - Sept 2016 Draft 1c.pdf). REGION OF INTEREST (ROI) FOR MEASURING PHANTOM STIFFNESS Figure 1. MRE QA Phantom Position a circular ROI in the middle of the phantom with half of the phantom diameter on the elastogram (with or without confidence mask). A high quality phantom exam should have the majority of phantom uncovered with the confidence mask. Phantom edges should be avoided from the ROI due to the edge effect. Mean and standard deviation of the pixel values in the ROI are reported as the
 QA SCHEDULE AND PASS CRITERIA The MRE system QA phantom exams should be scheduled on site every six months.")
50 phantom stiffness (in the unit of Pa or kpa) Figure 3. ROI for measuring phantom stiffness (mean ± sd, Pa or kpa) QA SCHEDULE AND PASS CRITERIA The MRE system QA phantom exams should be scheduled on site every six months. The current mean stiffness measurement (E_current) of the phantom should be compared to the average of the current and the previous measurement (E_previous); measurement difference = 2 abs (E_current- E_previous)/(E_current + E_previous). Pass criteria for the current exam: measurement difference 10%. Date Phantom Mean Stiffness (kpa) Table 1: MRE QA Schedule and Criteria Phantom SD Stiffness (kpa) Stiffness Measurement Difference First Scan E0 SD0 NA NA 6 months E1 SD1 2 abs (E1-E0)/(E1+E0) 10% Pass Criteria (Expected Stiffness Measurement Difference) Next 6 months E2 SD2 2 abs (E2-E1)/(E2+E1) 10% Ellis EL, Mann DA. Clinical evidence for the regression of liver fibrosis. Journal of Hepatology. 2012;56(5): Snowdon VK, Fallowfield JA. Models and mechanisms of fibrosis resolution. Alcohol Clin Exp Res. 2011;35(5): Yin M, Glaser KJ, Talwalkar JA, Chen J, Manduca A, Ehman RL. Hepatic MR Elastography: Clinical Performance in a Series of 1377 Consecutive Examinations. Radiology. 2016;278(1): Yin M, Woollard J, Wang X, et al. Quantitative assessment of hepatic fibrosis in an animal
Magnetic Resonance Elastography (MRE) of Liver Disease
 of Liver Disease") Magnetic Resonance Elastography (MRE) of Liver Disease Authored by: Jennifer Dolan Fox, PhD VirtualScopics Inc. jennifer_fox@virtualscopics.com 1-585-249-6231 1. Overview of MRE Imaging MRE is a magnetic
Magnetic Resonance Elastography (MRE) of Liver Disease Authored by: Jennifer Dolan Fox, PhD VirtualScopics Inc. jennifer_fox@virtualscopics.com 1-585-249-6231 1. Overview of MRE Imaging MRE is a magnetic
Slide 1. Technical Aspects of Quality Control in Magnetic Resonance Imaging. Slide 2. Annual Compliance Testing. of MRI Systems.
 Slide 1 Technical Aspects of Quality Control in Magnetic Resonance Imaging Slide 2 Compliance Testing of MRI Systems, Ph.D. Department of Radiology Henry Ford Hospital, Detroit, MI Slide 3 Compliance Testing
HST.583 Functional Magnetic Resonance Imaging: Data Acquisition and Analysis Fall 2008
 MIT OpenCourseWare http://ocw.mit.edu HST.583 Functional Magnetic Resonance Imaging: Data Acquisition and Analysis Fall 2008 For information about citing these materials or our Terms of Use, visit: http://ocw.mit.edu/terms.
SIEMENS MAGNETOM Skyra syngo MR D13
 Page 1 of 8 SIEMENS MAGNETOM Skyra syngo MR D13 \\USER\CIND\StudyProtocols\PTSA\*dm_ep2d_mono70_b0_p2_iso2.0 TA:1:05 PAT:2 Voxel size:2.0 2.0 2.0 mm Rel. SNR:1.00 :epse Properties Routine Prio Recon Load
Lab Location: MRI, B2, Cardinal Carter Wing, St. Michael s Hospital, 30 Bond Street
 Lab Location: MRI, B2, Cardinal Carter Wing, St. Michael s Hospital, 30 Bond Street MRI is located in the sub basement of CC wing. From Queen or Victoria, follow the baby blue arrows and ride the CC south
HST.583 Functional Magnetic Resonance Imaging: Data Acquisition and Analysis Fall 2008
 MIT OpenCourseWare http://ocw.mit.edu HST.583 Functional Magnetic Resonance Imaging: Data Acquisition and Analysis Fall 2008 For information about citing these materials or our Terms of Use, visit: http://ocw.mit.edu/terms.
COBRE Scan Information
 COBRE Scan Information Below is more information on the directory structure for the COBRE imaging data. Also below are the imaging parameters for each series. Directory structure: var/www/html/dropbox/1139_anonymized/human:
HST.583 Functional Magnetic Resonance Imaging: Data Acquisition and Analysis Fall 2006
 MIT OpenCourseWare http://ocw.mit.edu HST.583 Functional Magnetic Resonance Imaging: Data Acquisition and Analysis Fall 2006 For information about citing these materials or our Terms of Use, visit: http://ocw.mit.edu/terms.
SIEMENS MAGNETOM Avanto syngo MR B15
 \\USER\INVESTIGATORS\Ravi\ADNI-phantom\QC Phantom-Localizer TA: 0:10 PAT: Voxel size: 1.9 1.5 8.0 mm Rel. SNR: 1.00 SIEMENS: gre Properties Prio Recon Before measurement After measurement Load to viewer
Lucy Phantom MR Grid Evaluation
 Lucy Phantom MR Grid Evaluation Anil Sethi, PhD Loyola University Medical Center, Maywood, IL 60153 November 2015 I. Introduction: The MR distortion grid, used as an insert with Lucy 3D QA phantom, is
SIEMENS MAGNETOM Verio syngo MR B15V
 \\USER\ZAHID_RESEARCH\MS\No Name\3D SWI TA: 6:39 PAT: 2 Voxel size: 1.0 0.5 2.0 mm Rel. SNR: 1.00 SIEMENS: gre Properties Prio Recon Before measurement After measurement Load to viewer Inline movie Auto
SIEMENS MAGNETOM Verio syngo MR B17
 \\USER\Dr. Behrmann\routine\Ilan\ep2d_bold_PMU_resting TA: 8:06 PAT: Voxel size: 3.03.03.0 mm Rel. SNR: 1.00 USER: ep2d_bold_pmu Properties Special sat. Prio Recon System Before measurement Body After
New Technology Allows Multiple Image Contrasts in a Single Scan
 These images were acquired with an investigational device. PD T2 T2 FLAIR T1 MAP T1 FLAIR PSIR T1 New Technology Allows Multiple Image Contrasts in a Single Scan MR exams can be time consuming. A typical
Field Maps. 1 Field Map Acquisition. John Pauly. October 5, 2005
 Field Maps John Pauly October 5, 25 The acquisition and reconstruction of frequency, or field, maps is important for both the acquisition of MRI data, and for its reconstruction. Many of the imaging methods
Page 1 of 9. Protocol: adult_other_adni3basichumanprotocol25x_ _ _1. 3 Plane Localizer. 3 Plane Localizer PATIENT POSITION
 3 Localizer FOV 26.0 Slice Thickness 5.0 Slice Spacing 0.0 Freq 256 Phase 128 3-PLANE 3 Localizer Unswap Phase Correction Gradient Echo Imaging Options Seq, Fast Recon All Images 3 Localizer Pause / SCIC
QIBA Profile: CT Tumor Volume Change for Advanced Disease (CTV-AD)
") 5 QIBA Profile: CT Tumor Volume Change for Advanced Disease (CTV-AD) Stage: Consensus When referencing this document, please use the following format: QIBA CT Volumetry Technical Committee. CT Tumor Volume
5 QIBA Profile: CT Tumor Volume Change for Advanced Disease (CTV-AD) Stage: Consensus When referencing this document, please use the following format: QIBA CT Volumetry Technical Committee. CT Tumor Volume
QIBA Profile: CT Tumor Volume Change for Advanced Disease (CTV-AD)
") 5 QIBA Profile: CT Tumor Volume Change for Advanced Disease (CTV-AD) Stage: Consensus+ Draft Tech Confirmed When referencing this document, please use the following format: QIBA CT Volumetry Technical
5 QIBA Profile: CT Tumor Volume Change for Advanced Disease (CTV-AD) Stage: Consensus+ Draft Tech Confirmed When referencing this document, please use the following format: QIBA CT Volumetry Technical
M R I Physics Course
 M R I Physics Course Multichannel Technology & Parallel Imaging Nathan Yanasak, Ph.D. Jerry Allison Ph.D. Tom Lavin, B.S. Department of Radiology Medical College of Georgia References: 1) The Physics of
SIEMENS MAGNETOM Avanto syngo MR B15
 \\USER\INVESTIGATORS\Ravi\ADNI-Subject\Localizer TA: 0:10 PAT: Voxel size: 1.9 1.5 8.0 mm Rel. SNR: 1.00 SIEMENS: gre Properties Prio Recon Before measurement After measurement Load to viewer Inline movie
Clinical Importance. Aortic Stenosis. Aortic Regurgitation. Ultrasound vs. MRI. Carotid Artery Stenosis
 Clinical Importance Rapid cardiovascular flow quantitation using sliceselective Fourier velocity encoding with spiral readouts Valve disease affects 10% of patients with heart disease in the U.S. Most
QIBA Profile: CT Tumor Volume Change for Advanced Disease (CTV-AD)
") 5 QIBA Profile: CT Tumor Volume Change for Advanced Disease (CTV-AD) Stage 3: Technically Confirmed June 22, 2018 When referencing this document, please use the following format: QIBA CT Volumetry Technical
5 QIBA Profile: CT Tumor Volume Change for Advanced Disease (CTV-AD) Stage 3: Technically Confirmed June 22, 2018 When referencing this document, please use the following format: QIBA CT Volumetry Technical
ACQUIRING AND PROCESSING SUSCEPTIBILITY WEIGHTED IMAGING (SWI) DATA ON GE 3.0T
 DATA ON GE 3.0T") ACQUIRING AND PROCESSING SUSCEPTIBILITY WEIGHTED IMAGING (SWI) DATA ON GE 3.0T Revision date: 12/13/2010 Overview Susceptibility Weighted Imaging (SWI) is a relatively new data acquisition and processing
ACQUIRING AND PROCESSING SUSCEPTIBILITY WEIGHTED IMAGING (SWI) DATA ON GE 3.0T Revision date: 12/13/2010 Overview Susceptibility Weighted Imaging (SWI) is a relatively new data acquisition and processing
연구용유방초음파질관리 원광대학병원김혜원
 연구용유방초음파질관리 원광대학병원김혜원 Why US QC? Quality control (QC) testing of ultrasound scanners is important to verify the proper and consistent operation of these devices. main goal ; quality improvement Guidelines
QIBA PET Amyloid BC March 11, Agenda
 QIBA PET Amyloid BC March 11, 2016 - Agenda 1. QIBA Round 6 Funding a. Deadlines b. What projects can be funded, what cannot c. Discussion of projects Mechanical phantom and DRO Paul & John? Any Profile
Breast MRI Accreditation Program Clinical Image Quality Guide
 Breast MRI Accreditation Program Clinical Image Quality Guide Introduction This document provides guidance on breast MRI clinical image quality and describes the criteria used by the ACR Breast MRI Accreditation
Applications Guide for Interleaved
 Applications Guide for Interleaved rephase/dephase MRAV Authors: Yongquan Ye, Ph.D. Dongmei Wu, MS. Tested MAGNETOM Systems : 7TZ, TRIO a Tim System, Verio MR B15A (N4_VB15A_LATEST_20070519) MR B17A (N4_VB17A_LATEST_20090307_P8)
SIEMENS MAGNETOM TrioTim syngo MR B17
 \\USER\KNARRGROUP\MultiBand\LavretskyMultiBand\trufi localizer 3-plane TA: 5.1 s PAT: Voxel size: 1.2 1.2 5. Rel. SNR: 1.00 SIEMENS: trufi Load to stamp Slice group 1 Slices 1 Dist. factor 20 % Phase enc.
Philips MRI Protocol Dump Created on Comment Software Stream
 Page 1 of 5 Philips MRI Protocol Dump Created on 2/17/2011 4:11:01 PM Comment Created by ExamCard_to_XML with inputs: "J:\ADNI GO - ADNI 2 Phantom5.ExamCard" on system (BU SCHOOL OF MEDICINE :: 192.168.71.10)
MRI Imaging Options. Frank R. Korosec, Ph.D. Departments of Radiology and Medical Physics University of Wisconsin Madison
 MRI Imaging Options Frank R. Korosec, Ph.D. Departments of Radiolog and Medical Phsics Universit of Wisconsin Madison f.korosec@hosp.wisc.edu As MR imaging becomes more developed, more imaging options
8/11/2009. Common Areas of Motion Problem. Motion Compensation Techniques and Applications. Type of Motion. What s your problem
 Common Areas of Motion Problem Motion Compensation Techniques and Applications Abdominal and cardiac imaging. Uncooperative patient, such as pediatric. Dynamic imaging and time series. Chen Lin, PhD Indiana
Image Quality Assessment and Quality Assurance of Advanced Imaging Systems for IGRT. AAPM Penn-Ohio Chapter Sep 25, 2015 Soyoung Lee, PhD
 Image Quality Assessment and Quality Assurance of Advanced Imaging Systems for IGRT AAPM Penn-Ohio Chapter Sep 25, 2015 Soyoung Lee, PhD 1 Outline q Introduction q Imaging performances in 4D-CBCT Image
CHAPTER 9: Magnetic Susceptibility Effects in High Field MRI
 Figure 1. In the brain, the gray matter has substantially more blood vessels and capillaries than white matter. The magnified image on the right displays the rich vasculature in gray matter forming porous,
MRI Physics II: Gradients, Imaging
 MRI Physics II: Gradients, Imaging Douglas C., Ph.D. Dept. of Biomedical Engineering University of Michigan, Ann Arbor Magnetic Fields in MRI B 0 The main magnetic field. Always on (0.5-7 T) Magnetizes
SPECT QA and QC. Bruce McBride St. Vincent s Hospital Sydney.
 SPECT QA and QC Bruce McBride St. Vincent s Hospital Sydney. SPECT QA and QC What is needed? Why? How often? Who says? QA and QC in Nuclear Medicine QA - collective term for all the efforts made to produce
Technical Publications
 GE Medical Systems Technical Publications Direction 2188003-100 Revision 0 Tissue Volume Analysis DICOM for DICOM V3.0 Copyright 1997 By General Electric Co. Do not duplicate REVISION HISTORY REV DATE
ADNI, ADNI_QH, SURVEY. Geometry. connection
 ADNI, ADNI_QH, SURVEY Geometry Coil selection = Head connection = d Multi coil Homogeneity correction ne FOV (mm) = 250.00 RFOV (%) = 100.00 Foldover suppression Matrix scan = 256 reconstruction = 256
COMPREHENSIVE QUALITY CONTROL OF NMR TOMOGRAPHY USING 3D PRINTED PHANTOM
 COMPREHENSIVE QUALITY CONTROL OF NMR TOMOGRAPHY USING 3D PRINTED PHANTOM Mažena MACIUSOVIČ *, Marius BURKANAS *, Jonas VENIUS *, ** * Medical Physics Department, National Cancer Institute, Vilnius, Lithuania
Midterm Review
 Midterm Review - 2017 EE369B Concepts Noise Simulations with Bloch Matrices, EPG Gradient Echo Imaging 1 About the Midterm Monday Oct 30, 2017. CCSR 4107 Up to end of C2 1. Write your name legibly on this
Single Breath-hold Abdominal T 1 Mapping using 3-D Cartesian Sampling and Spatiotemporally Constrained Reconstruction
 Single Breath-hold Abdominal T 1 Mapping using 3-D Cartesian Sampling and Spatiotemporally Constrained Reconstruction Felix Lugauer 1,3, Jens Wetzl 1, Christoph Forman 2, Manuel Schneider 1, Berthold Kiefer
Compressed Sensing for Rapid MR Imaging
 Compressed Sensing for Rapid Imaging Michael Lustig1, Juan Santos1, David Donoho2 and John Pauly1 1 Electrical Engineering Department, Stanford University 2 Statistics Department, Stanford University rapid
Technical Publications
 g GE Medical Systems Technical Publications Direction 2275362-100 Revision 0 DICOM for DICOM V3.0 Copyright 2000 By General Electric Co. Do not duplicate REVISION HISTORY REV DATE REASON FOR CHANGE 0 May
Technical Publications
 g GE Medical Systems Technical Publications Direction 2264272-100 Revision 1 DICOM for DICOM V3.0 Copyright ª 2000 By General Electric Co. Do not duplicate THIS PAGE LEFT INTENTIONALLY BLANK TABLE OF
CT Protocol Review: Practical Tips for the Imaging Physicist Physicist
 CT Protocol Review: Practical Tips for the Imaging Physicist Physicist Dianna Cody, Ph.D., DABR, FAAPM U.T.M.D. Anderson Cancer Center August 8, 2013 AAPM Annual Meeting Goals Understand purpose and importance
AAPM Standard of Practice: CT Protocol Review Physicist
 AAPM Standard of Practice: CT Protocol Review Physicist Dianna Cody, Ph.D., DABR, FAAPM U.T.M.D. Anderson Cancer Center September 11, 2014 2014 Texas Radiation Regulatory Conference Goals Understand purpose
White Pixel Artifact. Caused by a noise spike during acquisition Spike in K-space <--> sinusoid in image space
 White Pixel Artifact Caused by a noise spike during acquisition Spike in K-space sinusoid in image space Susceptibility Artifacts Off-resonance artifacts caused by adjacent regions with different
DICOM Correction Item
 DICOM Correction Item Correction Number CP-668 Log Summary: Type of Modification Addition Name of Standard PS 3.3, 3.17 2006 Rationale for Correction The term axial is common in practice, but is incorrectly
MRI image formation 8/3/2016. Disclosure. Outlines. Chen Lin, PhD DABR 3. Indiana University School of Medicine and Indiana University Health
 MRI image formation Indiana University School of Medicine and Indiana University Health Disclosure No conflict of interest for this presentation 2 Outlines Data acquisition Spatial (Slice/Slab) selection
RADIOMICS: potential role in the clinics and challenges
 27 giugno 2018 Dipartimento di Fisica Università degli Studi di Milano RADIOMICS: potential role in the clinics and challenges Dr. Francesca Botta Medical Physicist Istituto Europeo di Oncologia (Milano)
High dynamic range magnetic resonance flow imaging in the abdomen
 High dynamic range magnetic resonance flow imaging in the abdomen Christopher M. Sandino EE 367 Project Proposal 1 Motivation Time-resolved, volumetric phase-contrast magnetic resonance imaging (also known
CT NOISE POWER SPECTRUM FOR FILTERED BACKPROJECTION AND ITERATIVE RECONSTRUCTION
 CT NOISE POWER SPECTRUM FOR FILTERED BACKPROJECTION AND ITERATIVE RECONSTRUCTION Frank Dong, PhD, DABR Diagnostic Physicist, Imaging Institute Cleveland Clinic Foundation and Associate Professor of Radiology
Functional MRI. Jerry Allison, Ph. D. Medical College of Georgia
 Functional MRI Jerry Allison, Ph. D. Medical College of Georgia BOLD Imaging Technique Blood Oxygen Level Dependent contrast can be used to map brain function Right Hand Motor Task Outline fmri BOLD Contrast
MRI. When to use What sequences. Outline 2012/09/19. Sequence: Definition. Basic Principles: Step 2. Basic Principles: Step 1. Govind Chavhan, MD
 MRI When to use What sequences Govind Chavhan, MD Assistant Professor and Staff Radiologist The Hospital For Sick Children, Toronto Planning Acquisition Post processing Interpretation Patient history and
What is pmri? Overview. The Need for Speed: A Technical and Clinical Primer for Parallel MR Imaging 8/1/2011
 The Need for Speed: A Technical and Clinical Primer for Parallel MR Imaging Nathan Yanasak, Ph.D. Chair, AAPM TG118 Assistant Professor Department of Radiology Director, Core Imaging Facility for Small
Brilliance CT Big Bore.
 1 2 2 There are two methods of RCCT acquisition in widespread clinical use: cine axial and helical. In RCCT with cine axial acquisition, repeat CT images are taken each couch position while recording respiration.
Agenda : Lung Density Breakout Session
 Agenda : Lung Density Breakout Session 1. : Mathew Fuld and Bernice Hoppel 2. Automatic Exposure Control (AEC) Evaluation : Sean Fain Round 4 Project 3. Dose reduction effects on emphysema metrics : Philip
Technical Publications
 g GE Medical Systems Technical Publications 2365523-100 Revision 1 DICOM for DICOM V3.0 Copyright 2003 By General Electric Co. Do not duplicate REVISION HISTORY REV DATE REASON FOR CHANGE 0 Nov. 15, 2002
C a t p h a n / T h e P h a n t o m L a b o r a t o r y
 C a t p h a n 5 0 0 / 6 0 0 T h e P h a n t o m L a b o r a t o r y C a t p h a n 5 0 0 / 6 0 0 Internationally recognized for measuring the maximum obtainable performance of axial, spiral and multi-slice
MR Advance Techniques. Vascular Imaging. Class III
 MR Advance Techniques Vascular Imaging Class III 1 Vascular Imaging There are several methods that can be used to evaluate the cardiovascular systems with the use of MRI. MRI will aloud to evaluate morphology
UvA-DARE (Digital Academic Repository) Motion compensation for 4D PET/CT Kruis, M.F. Link to publication
 Motion compensation for 4D PET/CT Kruis, M.F. Link to publication") UvA-DARE (Digital Academic Repository) Motion compensation for 4D PET/CT Kruis, M.F. Link to publication Citation for published version (APA): Kruis, M. F. (2014). Motion compensation for 4D PET/CT General
UvA-DARE (Digital Academic Repository) Motion compensation for 4D PET/CT Kruis, M.F. Link to publication Citation for published version (APA): Kruis, M. F. (2014). Motion compensation for 4D PET/CT General
ANALYSIS OF PULMONARY FIBROSIS IN MRI, USING AN ELASTIC REGISTRATION TECHNIQUE IN A MODEL OF FIBROSIS: Scleroderma
 ANALYSIS OF PULMONARY FIBROSIS IN MRI, USING AN ELASTIC REGISTRATION TECHNIQUE IN A MODEL OF FIBROSIS: Scleroderma ORAL DEFENSE 8 th of September 2017 Charlotte MARTIN Supervisor: Pr. MP REVEL M2 Bio Medical
A Transmission Line Matrix Model for Shielding Effects in Stents
 A Transmission Line Matrix Model for hielding Effects in tents Razvan Ciocan (1), Nathan Ida (2) (1) Clemson University Physics and Astronomy Department Clemson University, C 29634-0978 ciocan@clemon.edu
Exam 8N080 - Introduction MRI
 Exam 8N080 - Introduction MRI Friday January 23 rd 2015, 13.30-16.30h For this exam you may use an ordinary calculator (not a graphical one). In total there are 6 assignments and a total of 65 points can
Motion Artifacts and Suppression in MRI At a Glance
 Motion Artifacts and Suppression in MRI At a Glance Xiaodong Zhong, PhD MR R&D Collaborations Siemens Healthcare MRI Motion Artifacts and Suppression At a Glance Outline Background Physics Common Motion
Patient Specific. Protocol Identification Number (PID) Must be on each individual. MRI Image
 Must be on each individual. MRI Image") MRI PROCEDURE GUIDELINES Patient Specific Protocol Identification Number (PID) Must be on each individual MRI Image [Protocol 11/04/13, Version 1.4] (Revised 09/03/2014) Page 1 of 72 Abbreviations: BH:
MRI PROCEDURE GUIDELINES Patient Specific Protocol Identification Number (PID) Must be on each individual MRI Image [Protocol 11/04/13, Version 1.4] (Revised 09/03/2014) Page 1 of 72 Abbreviations: BH:
Public Comment Form for QIBA Documents
 Public Comment Form for QIBA Documents Notes: 1. identify the commenter to facilitate clarification of the issue and/or communication of the resolution.. : ow. Typo or other minor correction that an editor
Imaging protocols for navigated procedures
 9732379 G02 Rev. 1 2015-11 Imaging protocols for navigated procedures How to use this document This document contains imaging protocols for navigated cranial, DBS and stereotactic, ENT, and spine procedures
(a Scrhon5 R2iwd b. P)jc%z 5. ivcr3. 1. I. ZOms Xn,s. 1E IDrAS boms. EE225E/BIOE265 Spring 2013 Principles of MRI. Assignment 8 Solutions
jc%z 5. ivcr3. 1. I. ZOms Xn,s. 1E IDrAS boms. EE225E/BIOE265 Spring 2013 Principles of MRI. Assignment 8 Solutions") EE225E/BIOE265 Spring 2013 Principles of MRI Miki Lustig Assignment 8 Solutions 1. Nishimura 7.1 P)jc%z 5 ivcr3. 1. I Due Wednesday April 10th, 2013 (a Scrhon5 R2iwd b 0 ZOms Xn,s r cx > qs 4-4 8ni6 4
EE225E/BIOE265 Spring 2013 Principles of MRI Miki Lustig Assignment 8 Solutions 1. Nishimura 7.1 P)jc%z 5 ivcr3. 1. I Due Wednesday April 10th, 2013 (a Scrhon5 R2iwd b 0 ZOms Xn,s r cx > qs 4-4 8ni6 4
Computer-Aided Diagnosis in Abdominal and Cardiac Radiology Using Neural Networks
 Computer-Aided Diagnosis in Abdominal and Cardiac Radiology Using Neural Networks Du-Yih Tsai, Masaru Sekiya and Yongbum Lee Department of Radiological Technology, School of Health Sciences, Faculty of
Sparse sampling in MRI: From basic theory to clinical application. R. Marc Lebel, PhD Department of Electrical Engineering Department of Radiology
 Sparse sampling in MRI: From basic theory to clinical application R. Marc Lebel, PhD Department of Electrical Engineering Department of Radiology Objective Provide an intuitive overview of compressed sensing
Medical Image Processing: Image Reconstruction and 3D Renderings
 Medical Image Processing: Image Reconstruction and 3D Renderings 김보형 서울대학교컴퓨터공학부 Computer Graphics and Image Processing Lab. 2011. 3. 23 1 Computer Graphics & Image Processing Computer Graphics : Create,
Abbie M. Diak, PhD Loyola University Medical Center Dept. of Radiation Oncology
 Abbie M. Diak, PhD Loyola University Medical Center Dept. of Radiation Oncology Outline High Spectral and Spatial Resolution MR Imaging (HiSS) What it is How to do it Ways to use it HiSS for Radiation
Parallel Magnetic Resonance Imaging (pmri): How Does it Work, and What is it Good For?
: How Does it Work, and What is it Good For?") Parallel Magnetic Resonance Imaging (pmri): How Does it Work, and What is it Good For? Nathan Yanasak, Ph.D. Chair, AAPM TG118 Department of Radiology Georgia Regents University Overview Phased-array coils
Parallel Magnetic Resonance Imaging (pmri): How Does it Work, and What is it Good For? Nathan Yanasak, Ph.D. Chair, AAPM TG118 Department of Radiology Georgia Regents University Overview Phased-array coils
Advanced Image Reconstruction Methods for Photoacoustic Tomography
 Advanced Image Reconstruction Methods for Photoacoustic Tomography Mark A. Anastasio, Kun Wang, and Robert Schoonover Department of Biomedical Engineering Washington University in St. Louis 1 Outline Photoacoustic/thermoacoustic
CLASS HOURS: 4 CREDIT HOURS: 4 LABORATORY HOURS: 0
 Revised 10/10 COURSE SYLLABUS TM 220 COMPUTED TOMOGRAPHY PHYSICS CLASS HOURS: 4 CREDIT HOURS: 4 LABORATORY HOURS: 0 CATALOG COURSE DESCRIPTION: This course is one of a three course set in whole body Computed
Diffusion MRI Acquisition. Karla Miller FMRIB Centre, University of Oxford
 Diffusion MRI Acquisition Karla Miller FMRIB Centre, University of Oxford karla@fmrib.ox.ac.uk Diffusion Imaging How is diffusion weighting achieved? How is the image acquired? What are the limitations,
An Improved Tracking Technique for Assessment of High Resolution Dynamic Radiography Kinematics
 Copyright c 2008 ICCES ICCES, vol.8, no.2, pp.41-46 An Improved Tracking Technique for Assessment of High Resolution Dynamic Radiography Kinematics G. Papaioannou 1, C. Mitrogiannis 1 and G. Nianios 1
surface Image reconstruction: 2D Fourier Transform
 2/1/217 Chapter 2-3 K-space Intro to k-space sampling (chap 3) Frequenc encoding and Discrete sampling (chap 2) Point Spread Function K-space properties K-space sampling principles (chap 3) Basic Contrast
Image Acquisition Systems
 Image Acquisition Systems Goals and Terminology Conventional Radiography Axial Tomography Computer Axial Tomography (CAT) Magnetic Resonance Imaging (MRI) PET, SPECT Ultrasound Microscopy Imaging ITCS
BME I5000: Biomedical Imaging
 1 Lucas Parra, CCNY BME I5000: Biomedical Imaging Lecture 4 Computed Tomography Lucas C. Parra, parra@ccny.cuny.edu some slides inspired by lecture notes of Andreas H. Hilscher at Columbia University.
UNIVERSITY OF SOUTHAMPTON
 UNIVERSITY OF SOUTHAMPTON PHYS2007W1 SEMESTER 2 EXAMINATION 2014-2015 MEDICAL PHYSICS Duration: 120 MINS (2 hours) This paper contains 10 questions. Answer all questions in Section A and only two questions
Parallel Imaging. Marcin.
 Parallel Imaging Marcin m.jankiewicz@gmail.com Parallel Imaging initial thoughts Over the last 15 years, great progress in the development of pmri methods has taken place, thereby producing a multitude
Digital Imaging and Communications in Medicine (DICOM) Supplement 167: X-Ray 3D Angiographic IOD Informative Annex
 Supplement 167: X-Ray 3D Angiographic IOD Informative Annex") 5 Digital Imaging and Communications in Medicine (DICOM) Supplement 167: X-Ray 3D Angiographic IOD Informative Annex 10 15 Prepared by: DICOM Standards Committee, Working Group 2, Projection Radiography
5 Digital Imaging and Communications in Medicine (DICOM) Supplement 167: X-Ray 3D Angiographic IOD Informative Annex 10 15 Prepared by: DICOM Standards Committee, Working Group 2, Projection Radiography
Supplementary methods
 Supplementary methods This section provides additional technical details on the sample, the applied imaging and analysis steps and methods. Structural imaging Trained radiographers placed all participants
Imaging Notes, Part IV
 BME 483 MRI Notes 34 page 1 Imaging Notes, Part IV Slice Selective Excitation The most common approach for dealing with the 3 rd (z) dimension is to use slice selective excitation. This is done by applying
Technological Advances and Challenges: Experience with Time-Of-Flight PET Combined with 3T MRI. Floris Jansen, GE Healthcare July, 2015
 Technological Advances and Challenges: Experience with Time-Of-Flight PET Combined with 3T MRI Floris Jansen, GE Healthcare July, 2015 PET/MR 101 : challenges Thermal Workflow & Apps RF interactions?!!
ACMP 25th Annual Meeting
 Surveying and QC of Stereotactic Breast Biopsy Units for ACR Accreditation ACMP 25th Annual Meeting Seattle, WA May 3, 2008 Melissa C. Martin, M.S., FACR Therapy Physics, Inc. 879 West 190th St., Ste 419,
Optimisation of Toshiba Aquilion ONE Volume Imaging
 Optimisation of Toshiba Aquilion ONE Volume Imaging Jane Edwards, RPRSG Royal Free London NHS Foundation Trust Dr Mufudzi Maviki, Plymouth Hospitals NHS Trust Background In 2011/12 Radiology at RFH was
Philips SPECT/CT Systems
 Philips SPECT/CT Systems Ling Shao, PhD Director, Imaging Physics & System Analysis Nuclear Medicine, Philips Healthcare June 14, 2008 *Presented SNM08 Categorical Seminar - Quantitative SPECT and PET
3/27/2012 WHY SPECT / CT? SPECT / CT Basic Principles. Advantages of SPECT. Advantages of CT. Dr John C. Dickson, Principal Physicist UCLH
 3/27/212 Advantages of SPECT SPECT / CT Basic Principles Dr John C. Dickson, Principal Physicist UCLH Institute of Nuclear Medicine, University College London Hospitals and University College London john.dickson@uclh.nhs.uk
A Virtual MR Scanner for Education
 A Virtual MR Scanner for Education Hackländer T, Schalla C, Trümper A, Mertens H, Hiltner J, Cramer BM Hospitals of the University Witten/Herdecke, Department of Radiology Wuppertal, Germany Purpose A
IHE Cardiology Technical Framework Supplement. Evidence Documents Profile. Cardiology Options: Stress Testing CT/MR Angiography
 Integrating the Healthcare Enterprise 5 IHE Cardiology Technical Framework Supplement Evidence Documents Profile 10 Cardiology Options: Stress Testing CT/MR Angiography 15 Trial Implementation Date: October
Dynamic Contrast enhanced MRA
 Dynamic Contrast enhanced MRA Speaker: Yung-Chieh Chang Date : 106.07.22 Department of Radiology, Taichung Veterans General Hospital, Taichung, Taiwan 1 Outline Basic and advanced principles of Diffusion
Qualitative Comparison of Conventional and Oblique MRI for Detection of Herniated Spinal Discs
 Qualitative Comparison of Conventional and Oblique MRI for Detection of Herniated Spinal Discs Doug Dean Final Project Presentation ENGN 2500: Medical Image Analysis May 16, 2011 Outline Review of the
7/31/2011. Learning Objective. Video Positioning. 3D Surface Imaging by VisionRT
 CLINICAL COMMISSIONING AND ACCEPTANCE TESTING OF A 3D SURFACE MATCHING SYSTEM Hania Al-Hallaq, Ph.D. Assistant Professor Radiation Oncology The University of Chicago Learning Objective Describe acceptance
Evaluation of AutoQA Lite TM Image Quality Measurement Software
 Evaluation of AutoQA Lite TM Image Quality Measurement Software Andrew J Reilly Imaging Physicist Oncology Physics Edinburgh Cancer Centre Western General Hospital EDINBURGH EH4 2XU Phone: 0131 537 1161
Phase Difference Reconstruction. Outline
 Advanced MRI Phase Difference Reconstruction Faik Can MERAL Outline Introduction Quantitative Description Arctangent operation ATAN2 Phased-Array Multiple Coil Data Correction of Predictable Phase Errors
Acknowledgments and financial disclosure
 AAPM 2012 Annual Meeting Digital breast tomosynthesis: basic understanding of physics principles James T. Dobbins III, Ph.D., FAAPM Director, Medical Physics Graduate Program Ravin Advanced Imaging Laboratories
A 3D Speech Visualization Tool for Turkish based on MRI
 A 3D Speech Visualization Tool for Turkish based on MRI Maviş Emel Kulak Kayıkcı, PhD, Hacettepe University, Turkey Can Ölçek, MSc, Sobee Studios, Turkey Erdal Yılmaz, PhD, Sobee Studios, Turkey Burce
Module 4. K-Space Symmetry. Review. K-Space Review. K-Space Symmetry. Partial or Fractional Echo. Half or Partial Fourier HASTE
 MRES 7005 - Fast Imaging Techniques Module 4 K-Space Symmetry Review K-Space Review K-Space Symmetry Partial or Fractional Echo Half or Partial Fourier HASTE Conditions for successful reconstruction Interpolation
SEMI Draft Document 4537 Revision to SEMI M PRACTICE FOR DETERMINING WAFER-NEAR-EDGE GEOMETRY USING PARTIAL WAFER SITE FLATNESS
 SEMI Draft Document 4537 Revision to SEMI M70-0307 PRACTICE FOR DETERMINING WAFER-NEAR-EDGE GEOMETRY USING PARTIAL WAFER SITE FLATNESS Background Statement Note: This background statement is not part of