Profiling and debugging. Yaakoub El Khamra Texas Advanced Computing Center
|
|
|
- Constance Kelly
- 6 years ago
- Views:
Transcription
1 Profiling and debugging Yaakoub El Khamra Texas Advanced Computing Center
2 Outline Debugging GDB DDT PTP Basic use Attaching to a running job Identify MPI problems using Message Queues Catch memory errors For the extremely patient* Profiling Command line timing gprof Advanced Tools Perfexpert IPM Tau ( and PAPI) HPCToolkit Lessons Promising packages
3 Debugging gdb and ddt
4 Why use a debugger? You ve got code -> you ve got bugs Buffered output (printf / write may not help) Fast & Accurate Many errors are difficult to find without one!
5 About GDB GDB is the GNU Project DeBugger Looks inside a running program (SERIAL) From the GDB website: GDB can do four main kinds of things (plus other things in support of these) to help you catch bugs in the act: Start your program, specifying anything that might affect its behavior. Make your program stop on specified conditions. Examine what has happened, when your program has stopped. Change things in your program, so you can experiment with correcting the effects of one bug and go on to learn about another.
6 Using GDB Compile with debug flags: gcc g O0./srcFile.c The -g flag generates the symbol table and provides the debugger with line-by-line information about the source code. Execute debugger loading source dir: gdb d srcdir./exefile The -d option is useful when source and executable reside in different directories. Use the -q option to skip the licensing message. Type help at any time to see a list of the debugger options and commands.
7 Two levels of control Basic: Run the code and wait for it to crash. Identify line where it crashes. With luck the problem is obvious. Advanced: Set breakpoints Analyze data at breakpoints Watch specific variables
8 GDB basic commands command shorthand argument description run/kill r / k NA start/end program being debugged continue c NA continue running program from last breakpoint step s NA take a single step in the program from the last position where NA NA equivalent to backtrace print p variablename show value of a variable list l srcfile.c:linenumber show the specified source code line break b srcfile.c:linenumber functionname set a breakpoint by line number or function name watch NA variablename stops when the variable changes value
9 GDB example divcrash.c #include <stdio.h> #include <stdlib.h> int mydiv(int, int); int main(void) { int res, x = 5, y; for(y = 1; y < 10; y++){ res = mydiv(x,y); printf("%d,%d,%d\n",x,y,res); } return 0; } int mydiv(int x, int y){ return 1/( x - y); } divcrash.f90 PROGRAM main INTEGER :: mydiv INTEGER :: res, x = 5, y DO y = 1, 10 res = mydiv(x,y) WRITE(*,*) x,y,res END DO END PROGRAM FUNCTION mydiv(x,y) INTEGER, INTENT(IN) :: x, y mydiv = 1/(x-y) RETURN END FUNCTION mydiv
10 GDB example Compile the program and start the debugger: % gcc g O0./divcrash.c % gdb./a.out Start the program: (gdb) run The debugger will stop program execution with the following message: Program received signal SIGFPE, Arithmetic exception. 0x e in mydiv (x=5, y=5) at divcrash.c:28 28 return 1/( x - y); We can use gdb commands to obtain more information about the problem: (gdb) where #0 0x e in mydiv (x=5, y=5) at divcrash.c:28 #1 0x cf in main () at divcrash.c:19
11 GDB example In this case the problem is clear: a divide-by-zero exception happens in line 28 when variables x and y are the same. This is related to the call to mydiv from line 19 that is within a for loop: 18: for(y = 1; y < 10; y++){ 19: res = mydiv(x,y); Eventually the loop sets the value of y equal to 5 (the value of x) producing the exception: 28: return 1/( x - y); With the problem identified we can kill the program and exit the debugger : (gdb) kill (gdb) quit
12 Examining data C Fortran Result (gdb) p x (gdb) p x Print scalar data x value (gdb) p V (gdb) p V Print all vector V components (gdb) p V[i] (gdb) p V(i) Print element i of vector V (gdb) p V[i]@n (gdb) p V(i)@n Print n consecutive elements starting with V i (gdb) p M (gdb) p M Print all matrix M elements (gdb) p M[i] Not Available Print row i of matrix M (gdb) p M[i]@n Not Available Print n consecutive rows starting with row i (gdb) p M[i][j] (gdb) p M(i,j) Print matrix element Mij (gdb) p M[i][j]@n (gdb) p M(i,j)@n Print n consecutive elements starting with Mij No simple way to print columns in C or rows in Fortran Some debuggers print array slices (pgdbg, dbx), i.e. p M(1:3,3:7)
13 Breakpoint control Stop the execution of the program Allow you to examine the execution state in detail Can be assigned to a line or function Can be set conditionally command argument description info breakpoints/b/br Prints to screen all breakpoints breakpoint srcfile:linenumber if a < b Conditional insertion of breakpoint enable/disable breakpointnumber Enable/disable a breakpoint delete breakpointnumber Delete a breakpoint clear srcfile:linenumber functionname Clear breakpoints at a given line or function
14 Attaching GDB to a running program Use top to find out the PID of the tasks run by your program (in the top listing PIDs appear on the left, job names on the right). % top Attach gdb to the relevant PID: % gdb p <PID> or: % gdb (gdb) attach <PID> Once attached the debugger pauses execution of the program. Same level of control than in a standard debugging session.
15 Attaching GDB to a running program Best way to debug production runs. Don t wait for your wall time to run out! From the output of qstat obtain the node name where your code is running. In the queue field you will find an entry like development@i ta queue name partial node name: i tacc.utexas.edu
16 GDB Summary Compile using debug flags: % icc -g -O0./srcFile.c Run indicating the directory where the source is: % gdb -d srcdir./exefile Main commands: run/kill continue/next/step break/watch print where help
17 DDT: Parallel Debugger with GUI Allinea Distributed Debugger Tool Multiplatform Supports all MPI distributions Capable of debugging large scale OMP/MPI Comprehensive Memory checking MPI message tracking Useful Graphical User Interface

18 General Options Queue Submission Parameters Processor and thread number Advanced Options DDT - Run

19 General Options Queue Submission Parameters Processor and thread number Advanced Options DDT 3.2 DDT - Run

20 DDT Queue Parameters Each of these parameters may be changed Project must be set!!

21 DDT: The debug session Process controls Process groups window Project navigation window Code window Variable window Stack view and output window Evaluation window

22 DDT: Memory Leaks Go to View -> Current Memory Usage Process 0 is using much more memory than the others. This looks like a memory leak.
23 DDT Summary ssh to Lonestar allowing X11 forwarding: % ssh -X username@lonestar.tacc.utexas.edu Compile with debugging flags: % mpicc -g -O0./srcFile.c Load the ddt module % module load ddt Run ddt % ddt./exefile Configure ddt properly before submission: Options MPI version Queue Parameters Wallclock/CPUs/Project Advanced Memory Checking
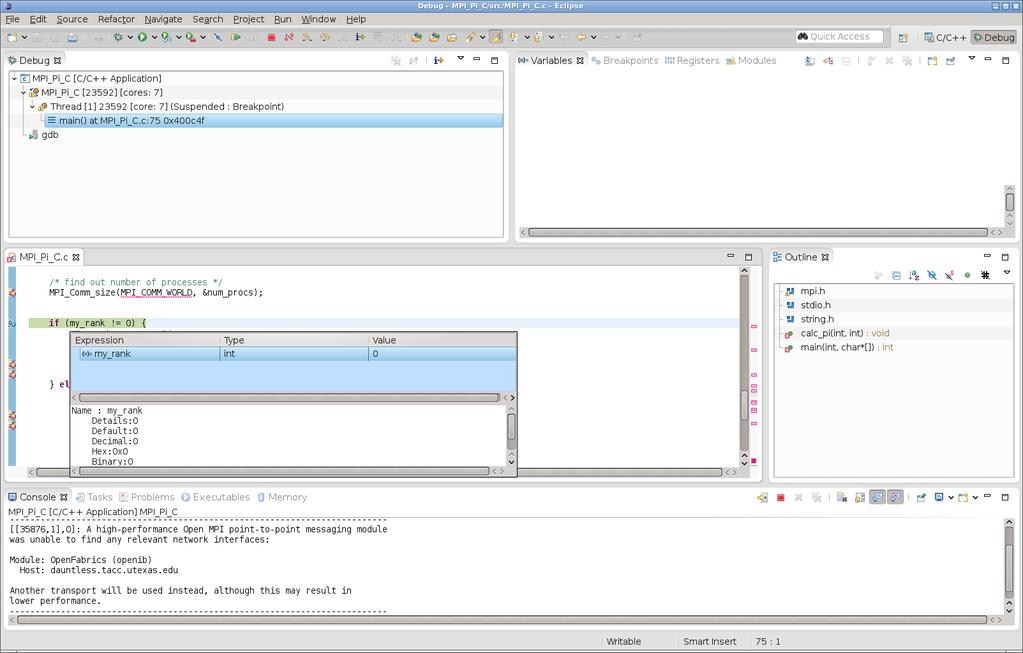
24 Notes on Eclipse PTP Eclipse PTP is FREE Eclipse PTP is part of XSEDE: your tickets about Eclipse PTP will be answered by the Eclipse PTP developers (they are good about tickets) Eclipse PTP is a great tool to debug code locally (i.e. on your own workstation/laptop) before moving to production on XSEDE systems Eclipse PTP supports remote development, with existing configurations for all XSEDE machines including TACC systems Power IDE with refactoring, code completion, static analysis, collaborative code development

25
26

27
28 Debugging: Conclusions You ALWAYS want to debug your code if: o Program exhibits erratic, random behavior when you are not using random o o o variables in control statements (hint: memory corruption/stomping) Program appears to "hang" somewhere: attach a debugger and see "where" it is stuck. Profiling will NOT help with "stuck" program flow Program exits way too fast (and you do not have exit error messages built into your code, which you want to consider) Wrong/bad results: unless you are working with infinite or semi-infinite Cantor sets, or attempting to use GiNaC, you should not be getting NaN's or Inf's in your variables: add conditional watch expressions to halt execution when you encounter these values (or use isnan, isinf functions in C) This is not to say that you cannot debug your code with print statements. Whatever gets your code operating at designed parameters: performance, readability, maintainability, rapid development, informative crashes/bug-free/idiot-proof etc... that is what you want to be doing. Debuggers get you there quicker
29 Profiling timers & gprof
30 Disclaimer: counting flops Lonestar: Cannot count FLOPS accurately, but can make reasonable estimates Stampede (Sandy Bridge): Cannot count FLOPS accurately Results always overcount, by amounts that depend on how busy the memory system is. Stampede (Xeon Phi): Cannot count FLOPS at all (
31 Lonestar!= Stampede Lonestar Command line timing gprof Perfexpert (fairly reliable) IPM mpip Tau HPCToolkit Stampede Command line timing gprof Perfexpert (ignore metrics relying on flops) Tau
32 Timers: Command Line The command time is available in most Unix systems. It is simple to use (no code instrumentation required). Gives total execution time of a process and all its children in seconds. % /usr/bin/time -p./exefile real 9.95 user 9.86 sys 0.06 Leave out the -p option to get additional information: % time./exefile % 9.860u 0.060s 0: % 0+0k 0+0io 0pf+0w
33 Timers: Code Section INTEGER :: rate, start, stop REAL :: time CALL SYSTEM_CLOCK(COUNT_RATE = rate) CALL SYSTEM_CLOCK(COUNT = start)! Code to time here CALL SYSTEM_CLOCK(COUNT = stop) time = REAL( ( stop - start )/ rate ) #include <time.h> double start, stop, time; start = (double)clock()/clocks_per_sec; /* Code to time here */ stop = (double)clock()/clocks_per_sec; time = stop - start;
34 About GPROF GPROF is the GNU Project PROFiler. gnu.org/software/binutils/ Requires recompilation of the code. Compiler options and libraries provide wrappers for each routine call and periodic sampling of the program. Provides three types of profiles - Flat profile - Call graph - Annotated source
35 Types of Profiles Flat Profile CPU time spend in each function (self and cumulative) Number of times a function is called Useful to identify most expensive routines Call Graph Number of times a function was called by other functions Number of times a function called other functions Useful to identify function relations Suggests places where function calls could be eliminated Annotated Source Indicates number of times a line was executed
36 Profiling with gprof Use the -pg flag during compilation: % gcc -g -pg./srcfile.c % icc -g -p./srcfile.c % pgcc -g -pg./srcfile.c Run the executable. An output file gmon.out will be generated with the profiling information. Execute gprof and redirect the output to a file: % gprof./exefile gmon.out > profile.txt % gprof -l./exefile gmon.out > profile_line.txt % gprof -A./exeFile gmon.out > profile_anotated.txt
37 Flat profile In the flat profile we can identify the most expensive parts of the code (in this case, the calls to matsqrt, matcube, and syscube). % cumulative self self total time seconds seconds calls s/call s/call name matsqrt matcube syscube main vecsqrt syssqrt veccube
38 index % time self children called name /1 <hicore> (8) [1] main [1] /1 syssqrt [3] /2 matsqrt [2] /1 syscube [5] /1 matcube [4] /2 vecsqrt [6] /1 veccube [7] /2 main [1] /2 syssqrt [3] [2] matsqrt [2] /1 main [1] [3] syssqrt [3] /2 matsqrt [2] /2 vecsqrt [6] Call Graph Profile
39 Visual Call Graph main syssqrt matsqrt vecsqrt matcube veccube syscube
40 index % time self children called name /1 <hicore> (8) [1] main [1] /1 syssqrt [3] /2 matsqrt [2] /1 syscube [5] /1 matcube [4] /2 vecsqrt [6] /1 veccube [7] /2 main [1] /2 syssqrt [3] [2] matsqrt [2] /1 main [1] [3] syssqrt [3] /2 matsqrt [2] /2 vecsqrt [6] Call Graph Profile
41 Visual Call Graph main syssqrt matsqrt vecsqrt matcube veccube syscube
![index % time self children called name 0.00 0.00 1/1 <hicore> (8) [1] 100.0 0.03 4.91 1 main [1] 0.00 1.24 1/1 syssqrt [3] 1.24 0.00 1/2 matsqrt [2] 1.22 0.00 1/1 syscube [5] 1.22 0.00 1/1 matcube [4] 0.](/docs-images/74/70256372/images/42-2.jpg "00 0.00 1/2 vecsqrt [6] 0.00 0.00 1/1 veccube [7] ----------------------------------------------- 1.24 0.00 1/2 main [1] 1.24 0.00 1/2 syssqrt [3] [2] 50.0 2.47 0.")
42 index % time self children called name /1 <hicore> (8) [1] main [1] /1 syssqrt [3] /2 matsqrt [2] /1 syscube [5] /1 matcube [4] /2 vecsqrt [6] /1 veccube [7] /2 main [1] /2 syssqrt [3] [2] matsqrt [2] /1 main [1] [3] syssqrt [3] /2 matsqrt [2] /2 vecsqrt [6] Call Graph Profile

43 Visual Call Graph main syssqrt matcube veccube syscube matsqrt vecsqrt
44 PERF-EXPERT
45 About PerfExpert Brand new tool, locally developed at UT Easy to use and understand Great for quick profiling and for beginners Provides recommendation on what to fix in a subroutine Collects information from PAPI using HPCToolkit No MPI specific profiling, no 3D visualization, no elaborate metrics Combines ease of use with useful interpretation of gathered performance data Optimization suggestions!!!
46 Profiling with PerfExpert: Compilation Load the java, papi, and perfexpert modules: module load java papi perfexpert Compile the code with full optimization and with the -g flag: mpicc -g -O3 source.c mpif90 -g -O3 source.f90 In your job submission script: perfexpert_run_exp./<executable name> <executable args> perfexpert 0.1 experiment-*.xml Threshold of 0.1 lists only functions and loops that represent 10% of total runtime
 ============================================================================== ratio to total instrns % 0...25...50...75.")
47 PerfExpert Analysis Output Loop in function main() at Integrator.c:81 (98.9% of the total runtime) ============================================================================== ratio to total instrns % floating point : 30 ************** - data accesses : 71 ********************************** * GFLOPS (% max) : 1 * performance assessment LCPI good...okay...fair...poor...bad... * overall : 4.0 >>>>>>>>>>>>>>>>>>>>>>>>>>>>>>>>>>>>>>>>>>>>>>+ upper bound estimates * data accesses : 33.1 >>>>>>>>>>>>>>>>>>>>>>>>>>>>>>>>>>>>>>>>>>>>>>+ - L1d hits : 2.2 >>>>>>>>>>>>>>>>>>>>>>>>>>>>>>>>>>>>>>>>>>> - L2d hits : 2.8 >>>>>>>>>>>>>>>>>>>>>>>>>>>>>>>>>>>>>>>>>>>>>>+ - L2d misses : 28.1 >>>>>>>>>>>>>>>>>>>>>>>>>>>>>>>>>>>>>>>>>>>>>>+ * instruction accesses : 0.4 >>>>>>>> - L1i hits : 0.4 >>>>>>>> - L2i hits : 0.0 > - L2i misses : 0.0 > * data TLB : 0.0 > * instruction TLB : 0.0 > * branch instructions : 0.1 >> - correctly predicted: 0.1 >> - mispredicted : 0.0 > * floating-point instr : 1.1 >>>>>>>>>>>>>>>>>>>>>>> - fast FP instr : 1.1 >>>>>>>>>>>>>>>>>>>>>>> - slow FP instr : 0.0 > biggest problem is data accesses that miss in the L2 cache overall loop performance is bad remaining performance categories are good
48 PerfExpert Summary Load the papi, java, and perfexpert modules: % module load papi java perfexpert In your job submission script, make sure you have: perfexpert_run_exp./<executable name> <executable args> perfexpert 0.1 experiment-*.xml Send output to AutoSCOPE for optimization suggestions: perfexpert 0.1 experiment-integrator.xml autoscope Apply suggestions from autoscope and run again. Check to see if the wall clock time is reduced or not
 ======================================================================================= change the order of loops loop i { loop j {...} } loop j { loop i {.")
![..} } --------------------------------------------------------------------------------------- employ loop blocking loop i {loop k {loop j {c[i][j] = c[i][j] + a[i][k] * b[k][j];}}} loop k step s](/docs-images/74/70256372/images/49-3.jpg "{loop j step s {loop i { for (kk = k; kk < k + s; kk++) { for (jj = j; jj < j + s; jj++) { c[i][jj] = c[i][jj] + a[i][kk] * b[kk][jj];}}}}}")
49 Optimization Suggestions Code Section: Loop in function main() at Integrator.c:81 (98.9% of the total runtime) ======================================================================================= change the order of loops loop i { loop j {...} } loop j { loop i {...} } employ loop blocking loop i {loop k {loop j {c[i][j] = c[i][j] + a[i][k] * b[k][j];}}} loop k step s {loop j step s {loop i { for (kk = k; kk < k + s; kk++) { for (jj = j; jj < j + s; jj++) { c[i][jj] = c[i][jj] + a[i][kk] * b[kk][jj];}}}}} apply loop fission so every loop accesses just a couple of different arrays loop i {a[i] = a[i] * b[i] - c[i];} loop i {a[i] = a[i] * b[i];} loop i {a[i] = a[i] - c[i];}
50 IPM: INTEGRATED PERFORMANCE MONITORING
51 IPM: Integrated Performance Monitoring IPM is a portable profiling infrastructure for parallel codes. It provides a low-overhead performance summary of the computation and communication in a parallel program IPM is a quick, easy and concise profiling tool The level of detail it reports is smaller than TAU, PAPI or HPCToolkit
52 IPM: Integrated Performance IPM features: easy to use has low overhead is scalable Monitoring Requires no source code modification, just adding the -g option to the compilation Produces XML output that is parsed by scripts to generate browser-readable html pages
53 IPM: Integrated Performance Monitoring Available on Ranger and Lonestar with the mvapich libraries Create ipm environment with module command before running code: module load ipm In your job script, set up the following ipm environment before the ibrun command: module load ipm export LD_PRELOAD=$TACC_IPM_LIB/libipm.so export IPM_REPORT=full ibrun <my executable> <my arguments>
54 IPM: Integrated Performance Monitoring Export LD_PRELOAD=$TACC_IPM_LIB/libipm.so must be inside job script IPM_REPORT: full, terse or none are the levels of information IPM_MPI_THRESHOLD: Reports only routines using this percentage (or more) of MPI time. e.g. IPM_MPI_THRESHOLD 0.3 report subroutines that consume more than 30% of the total MPI time. Important details: module help ipm
55 IPM: Text Output ##IPMv0.922############################################### # # command : /work/01125/yye00/icac/cactus_sandtank SandTank.par # host : i /x86_64_linux mpi_tasks : 32 on 2 nodes # start : 05/26/09/11:49:06 wallclock : sec # stop : 05/26/09/11:49:09 %comm : 2.01 # gbytes : e+00 total gflop/sec : e-02 total # ########################################################## # region : * [ntasks] = 32 # # [total] <avg> min max # entries # wallclock # user # system # %comm # gflop/sec # gbytes # # PAPI_FP_OPS e e e e+06 # PAPI_TOT_CYC e e e e+08 # PAPI_VEC_INS e e e e+07 # PAPI_TOT_INS e e e e+08 # # [time] [calls] <%mpi> <%wall> # MPI_Allreduce # MPI_Comm_rank # MPI_Barrier # MPI_Allgatherv # MPI_Bcast # MPI_Allgather # MPI_Recv # MPI_Comm_size # MPI_Send ###########################################################

56 IPM: Integrated Performance Monitoring

57 IPM: Event Statistics

58 IPM: Load Balance
59 IPM Buffer Size Distribution: % of Comm Time
60 Buffer Size Distribution: Ncalls
61 Communication Topology
62 IPM: Integrated Performance When to use IPM? Monitoring To quickly find out where your code is spending most of its time (in both computation and communication) For performing scaling studies (both strong and weak) When you suspect you have load imbalance and want to verify it quickly For a quick look at the communication pattern To find out how much memory you are using per task To find the relative communication & compute time
63 IPM: Integrated Performance Monitoring When IPM is NOT the answer When you already know where the performance issues are When you need detailed performance information on exact lines of code When want to find specific information such as cache misses
64 Advanced Profiling Tools : the next level
65 Advanced Profiling Tools Can be intimidating: Difficult to install Many dependences Require kernel patches Not your problem!! Useful for serial and parallel programs Extensive profiling and scalability information Analyze code using: Timers Hardware registers (PAPI) Function wrappers
66 PAPI PAPI is a Performance Application Programming Interface icl.cs.utk.edu/papi API to use hardware counters Behind Tau, HPCToolkit Multiplatform: Most Intel & AMD chips IBM POWER 4/5/6 Cray X/XD/XT Sun UltraSparc I/II/III MIPS SiCortex Cell Available as a module on Lonestar and Stampede (mind the hardware counters issue with sandybridge xeons).
67 Tau TAU is a suite of Tuning and Analysis Utilities year project involving University of Oregon Performance Research Lab LANL Advanced Computing Laboratory Research Centre Julich at ZAM, Germany Integrated toolkit Performance instrumentation Measurement Analysis Visualization
68 Tau: Measurements Parallel profiling Function-level, block (loop)-level, statement-level Supports user-defined events TAU parallel profile data stored during execution Hardware counter values (multiple counters) Support for callgraph and callpath profiling Tracing All profile-level events Inter-process communication events Trace merging and format conversion
69 Tau: Instrumentation PDT is used to instrument your code. Replace mpicc and mpif90 in make files with tau_f90.sh and tau_cc.sh It is necessary to specify all the components that will be used in the instrumentation (mpi, openmp, profiling, counters [PAPI], etc. However, these come in a limited number of combinations.) Combinations: First determine what you want to do (profiling, PAPI counters, tracing, etc.) and the programming paradigm (mpi, openmp), and the compiler. PDT is a required component: Instrumentation Parallel Paradigm Collectors Compiler PDT MPI PAPI Intel Hand-coded OMP Callpath PGI GNU (gcc)
70 Tau: Instrumentation You can view the available combinations (alias tautypes 'ls -C1 $TAU grep Makefile ' ). Your selected combination is made known to the compiler wrapper through the TAU_MAKEFILE environment variable. E.g. the PDT instrumention (pdt) for the Intel compiler (icpc) with MPI (mpi) is set with this command: setenv TAU_MAKEFILE $TAU/Makefile.tau-icpc-mpi-pdt Other run-time and instrumentation options are set through TAU_OPTIONS. For verbose: setenv TAU_OPTIONS -optverbose

71 Tau Paraprof Overview Raw files PerfDMF managed (database) Application Experiment Trials HPMToolkit Metadata MpiP TAU

72 Tau Paraprof Manager Window Provides Machine Details Organizes Runs as: Applications, Experiments and Trials.


73 Routine Time Experiment Profile Information is in GET_TIME_OF_DAY metric Mean and Standard Deviation Statistics given.


74 Multiply_Matrices Routine Results Function Data Window gives a closer look at a single function: 74 not from same run
75 Float Point OPS trial Hardware Counters provide Floating Point Operations (Function Data view).
76 L1 Data Cache Miss trial Hardware Counters provide L1 Cache Miss Operations.

77 Call Path Call Graph Paths (Must select through thread menu.)


78 Call Path TAU_MAKEFILE = Makefile.tau-callpath-icpc-mpi-pdt
; Select Operation; then Apply.")
79 Derived Metrics Select Argument 1 (green ball); Select Argument 2 (green ball); Select Operation; then Apply. Derived Metric will appear as a new trial.

80 Derived Metrics Since FP/Miss ratios are constant must be memory access problem. Be careful even though ratios are constant, cores may do different amounts of work/operations per call.
81 HPCToolkit HPCToolkit is an open-source suite of multiplatform tools for profile-based performance analysis of applications. The figure below provides an overview of the toolkit components and their relationships. HPCToolkit is under intense development and shows great potential HPCToolkit is a mid-range tool: providing detailed profiling information without the need to rewrite code

82 HPCToolkit: Overview
83 HPCToolkit: Overview To prepare the executable for profiling, compile the code with full optimization as usual but include the - g option Using HPCToolkit involves four stages: We start by performing a static binary analysis of the compiled executable (hence the need for the -g option) using hpcstruct You run the code with hpcrun to collect the stack profile You interpret the stack profile and correlate it with the source using hpcprof to generate the profiling database You view the profiling database with the hpcviewer
84 HPCToolkit: Available Events Counter/Event Name Meaning Counter/Event Name Meaning PAPI_L1_DCM PAPI_L1_ICM PAPI_L2_DCM PAPI_L2_ICM PAPI_L2_TCM PAPI_L3_TCM PAPI_FPU_IDL PAPI_TLB_DM PAPI_TLB_IM PAPI_STL_ICY Level 1 data cache misses Level 1 instruction cache misses Level 2 data cache misses Level 2 instruction cache misses Level 2 cache misses Level 3 cache misses Cycles floating point units are idle Data translation lookaside buffer misses Instruction translation lookaside buffer misses Cycles with no instruction issue PAPI_VEC_INS PAPI_RES_STL PAPI_TOT_CYC PAPI_L1_DCA PAPI_L2_DCA PAPI_L2_ICH PAPI_L1_ICA PAPI_L2_ICA PAPI_L1_ICR PAPI_L2_TCA PAPI_L3_TCR Vector/SIMD instructions Cycles stalled on any resource Total cycles Level 1 data cache accesses Level 2 data cache accesses Level 2 instruction cache hits Level 1 instruction cache accesses Level 2 instruction cache accesses Level 1 instruction cache reads Level 2 total cache accesses Level 3 total cache reads PAPI_HW_INT PAPI_BR_TKN PAPI_BR_MSP PAPI_TOT_INS PAPI_FP_INS PAPI_BR_INS Hardware interrupts Conditional branch instructions taken Conditional branch instructions mispredicted Instructions completed Floating point instructions Branch instructions PAPI_FML_INS PAPI_FAD_INS PAPI_FDV_INS PAPI_FSQ_INS PAPI_FP_OPS Floating point multiply instructions Floating point add instructions (Also includes subtract instructions) Floating point divide instructions (Counts both divide and square root instructions) Floating point square root instructions (Counts both divide and square root instructions) Floating point operations
85 Profiling dos and don ts DO DO NOT Test every change you make Profile typical cases Compile with optimization flags Test for scalability Assume a change will be an improvement Profile atypical cases Profile ad infinitum Set yourself a goal or Set yourself a time limit
86 Valgrind* Other tools valgrind.org Powerful instrumentation framework, often used for debugging memory problems MPIP Tau Lightweight, scalable MPI profiling tool mpip.sourceforge.net Suite of Tuning and Analysis Utilities Scalasca Similar to Tau, complete suit of tuning and analysis tools. HPCToolkit Interesting tool with a lot of promise
Profiling and debugging. John Cazes Texas Advanced Computing Center
 Profiling and debugging John Cazes Texas Advanced Computing Center Outline Debugging Profiling GDB DDT Basic use Attaching to a running job Identify MPI problems using Message Queues Catch memory errors
Profiling and debugging. Carlos Rosales September 18 th 2009 Texas Advanced Computing Center The University of Texas at Austin
 Profiling and debugging Carlos Rosales carlos@tacc.utexas.edu September 18 th 2009 Texas Advanced Computing Center The University of Texas at Austin Outline Debugging Profiling GDB DDT Basic use Attaching
Debugging. John Lockman Texas Advanced Computing Center
 Debugging John Lockman Texas Advanced Computing Center Debugging Outline GDB Basic use Attaching to a running job DDT Identify MPI problems using Message Queues Catch memory errors PTP For the extremely
Tau Introduction. Lars Koesterke (& Kent Milfeld, Sameer Shende) Cornell University Ithaca, NY. March 13, 2009
 Cornell University Ithaca, NY. March 13, 2009") Tau Introduction Lars Koesterke (& Kent Milfeld, Sameer Shende) Cornell University Ithaca, NY March 13, 2009 General Outline Measurements Instrumentation & Control Example: matmult Profiling and Tracing
Tau Introduction Lars Koesterke (& Kent Milfeld, Sameer Shende) Cornell University Ithaca, NY March 13, 2009 General Outline Measurements Instrumentation & Control Example: matmult Profiling and Tracing
MPI Performance Tools
 Physics 244 31 May 2012 Outline 1 Introduction 2 Timing functions: MPI Wtime,etime,gettimeofday 3 Profiling tools time: gprof,tau hardware counters: PAPI,PerfSuite,TAU MPI communication: IPM,TAU 4 MPI
Profiling with TAU. Le Yan. User Services LSU 2/15/2012
 Profiling with TAU Le Yan User Services HPC @ LSU Feb 13-16, 2012 1 Three Steps of Code Development Debugging Make sure the code runs and yields correct results Profiling Analyze the code to identify performance
Profiling and Debugging Tools. Outline
 Profiling and Debugging Tools Karl W. Schulz Texas Advanced Computing Center The University of Texas at Austin UT/Portugal Summer Institute Training Coimbra, Portugal July 17, 2008 Outline General (Analysis
Profiling and Debugging Tools. Lars Koesterke University of Porto, Portugal May 28-29, 2009
 Profiling and Debugging Tools Lars Koesterke University of Porto, Portugal May 28-29, 2009 Outline General (Analysis Tools) Listings & Reports Timers Profilers (gprof, tprof, Tau) Hardware performance
Performance Analysis of Parallel Scientific Applications In Eclipse
 Performance Analysis of Parallel Scientific Applications In Eclipse EclipseCon 2015 Wyatt Spear, University of Oregon wspear@cs.uoregon.edu Supercomputing Big systems solving big problems Performance gains
Vectorization Lab Parallel Computing at TACC: Ranger to Stampede Transition
 Vectorization Lab Parallel Computing at TACC: Ranger to Stampede Transition Aaron Birkland Consultant Cornell Center for Advanced Computing December 11, 2012 1 Simple Vectorization This lab serves as an
Tools and techniques for optimization and debugging. Fabio Affinito October 2015
 Tools and techniques for optimization and debugging Fabio Affinito October 2015 Profiling Why? Parallel or serial codes are usually quite complex and it is difficult to understand what is the most time
Profiling with TAU. Le Yan. 6/6/2012 LONI Parallel Programming Workshop
 Profiling with TAU Le Yan 6/6/2012 LONI Parallel Programming Workshop 2012 1 Three Steps of Code Development Debugging Make sure the code runs and yields correct results Profiling Analyze the code to identify
COSC 6374 Parallel Computation. Performance Oriented Software Design. Edgar Gabriel. Spring Amdahl s Law
 COSC 6374 Parallel Computation Performance Oriented Software Design Spring 2008 Amdahl s Law Describes the performance gains by enhancing one part of the overall system (code, computer) Speedup = Performance
Performance analysis basics
 Performance analysis basics Christian Iwainsky Iwainsky@rz.rwth-aachen.de 25.3.2010 1 Overview 1. Motivation 2. Performance analysis basics 3. Measurement Techniques 2 Why bother with performance analysis
Prof. Thomas Sterling
 High Performance Computing: Concepts, Methods & Means Performance Measurement 1 Prof. Thomas Sterling Department of Computer Science Louisiana i State t University it February 13 th, 2007 News Alert! Intel
Performance Tools. Tulin Kaman. Department of Applied Mathematics and Statistics
 Performance Tools Tulin Kaman Department of Applied Mathematics and Statistics Stony Brook/BNL New York Center for Computational Science tkaman@ams.sunysb.edu Aug 23, 2012 Do you have information on exactly
Parallelism V. HPC Profiling. John Cavazos. Dept of Computer & Information Sciences University of Delaware
 Parallelism V HPC Profiling John Cavazos Dept of Computer & Information Sciences University of Delaware Lecture Overview Performance Counters Profiling PAPI TAU HPCToolkit PerfExpert Performance Counters
Software Tools. ACF Spring HPC Training Workshop Match 15-16, 2016
 Software Tools ACF Spring HPC Training Workshop Match 15-16, 2016 IPM Integrated Performance Monitoring portable low-overhead selectable details at runtime various text and web reports. Link your code
Debugging with GDB and DDT
 Debugging with GDB and DDT Ramses van Zon SciNet HPC Consortium University of Toronto June 28, 2012 1/41 Ontario HPC Summerschool 2012 Central Edition: Toronto Outline Debugging Basics Debugging with the
TAU 2.19 Quick Reference
 What is TAU? The TAU Performance System is a portable profiling and tracing toolkit for performance analysis of parallel programs written in Fortran, C, C++, Java, Python. It comprises 3 main units: Instrumentation,
DDT Debugging Techniques
 DDT Debugging Techniques Carlos Rosales carlos@tacc.utexas.edu Scaling to Petascale 2010 July 7, 2010 Debugging Parallel Programs Usual problems Memory access issues Special cases not accounted for in
General Purpose Timing Library (GPTL)
") General Purpose Timing Library (GPTL) A tool for characterizing parallel and serial application performance Jim Rosinski Outline Existing tools Motivation API and usage examples PAPI interface auto-profiling
General Purpose Timing Library (GPTL) A tool for characterizing parallel and serial application performance Jim Rosinski Outline Existing tools Motivation API and usage examples PAPI interface auto-profiling
Debugging with GDB and DDT
 Debugging with GDB and DDT Ramses van Zon SciNet HPC Consortium University of Toronto June 13, 2014 1/41 Ontario HPC Summerschool 2014 Central Edition: Toronto Outline Debugging Basics Debugging with the
Dresden, September Dan Terpstra Jack Dongarra Shirley Moore. Heike Jagode
 Collecting Performance Data with PAPI-C 3rd Parallel Tools Workshop 3rd Parallel Tools Workshop Dresden, September 14-15 Dan Terpstra Jack Dongarra Shirley Moore Haihang You Heike Jagode Hardware performance
The Art of Debugging: How to think like a programmer. Melissa Sulprizio GEOS-Chem Support Team
 The Art of Debugging: How to think like a programmer Melissa Sulprizio GEOS-Chem Support Team geos-chem-support@as.harvard.edu Graduate Student Forum 23 February 2017 GEOS-Chem Support Team Bob Yantosca
Performance Analysis and Debugging Tools
 Performance Analysis and Debugging Tools Performance analysis and debugging intimately connected since they both involve monitoring of the software execution. Just different goals: Debugging -- achieve
TAU by example - Mpich
 TAU by example From Mpich TAU (Tuning and Analysis Utilities) is a toolkit for profiling and tracing parallel programs written in C, C++, Fortran and others. It supports dynamic (librarybased), compiler
Debugging and Profiling
 Debugging and Profiling Dr. Axel Kohlmeyer Senior Scientific Computing Expert Information and Telecommunication Section The Abdus Salam International Centre for Theoretical Physics http://sites.google.com/site/akohlmey/
Introduction to Performance Tuning & Optimization Tools
 Introduction to Performance Tuning & Optimization Tools a[i] a[i+1] + a[i+2] a[i+3] b[i] b[i+1] b[i+2] b[i+3] = a[i]+b[i] a[i+1]+b[i+1] a[i+2]+b[i+2] a[i+3]+b[i+3] Ian A. Cosden, Ph.D. Manager, HPC Software
HiPERiSM Consulting, LLC.
 HiPERiSM Consulting, LLC. George Delic, Ph.D. HiPERiSM Consulting, LLC (919)484-9803 P.O. Box 569, Chapel Hill, NC 27514 george@hiperism.com http://www.hiperism.com Models-3 User s Conference September
No Time to Read This Book?
 Chapter 1 No Time to Read This Book? We know what it feels like to be under pressure. Try out a few quick and proven optimization stunts described below. They may provide a good enough performance gain
Evaluating Performance Via Profiling
 Performance Engineering of Software Systems September 21, 2010 Massachusetts Institute of Technology 6.172 Professors Saman Amarasinghe and Charles E. Leiserson Handout 6 Profiling Project 2-1 Evaluating
Debugging with TotalView
 Debugging with TotalView Le Yan HPC Consultant User Services Goals Learn how to start TotalView on Linux clusters Get familiar with TotalView graphic user interface Learn basic debugging functions of TotalView
DDT: A visual, parallel debugger on Ra
 DDT: A visual, parallel debugger on Ra David M. Larue dlarue@mines.edu High Performance & Research Computing Campus Computing, Communications, and Information Technologies Colorado School of Mines March,
Parallel Performance and Optimization
 Parallel Performance and Optimization Gregory G. Howes Department of Physics and Astronomy University of Iowa Iowa High Performance Computing Summer School University of Iowa Iowa City, Iowa 25-26 August
Parallel Performance and Optimization
 Parallel Performance and Optimization Erik Schnetter Gregory G. Howes Iowa High Performance Computing Summer School University of Iowa Iowa City, Iowa May 20-22, 2013 Thank you Ben Rogers Glenn Johnson
PAPI - PERFORMANCE API. ANDRÉ PEREIRA
 PAPI - PERFORMANCE API ANDRÉ PEREIRA ampereira@di.uminho.pt 1 Motivation 2 Motivation Application and functions execution time is easy to measure time gprof valgrind (callgrind) 2 Motivation Application
meinschaft May 2012 Markus Geimer
 meinschaft Mitglied der Helmholtz-Gem Module setup and compiler May 2012 Markus Geimer The module Command Software which allows to easily manage different versions of a product (e.g., totalview 5.0 totalview
PAPI - PERFORMANCE API. ANDRÉ PEREIRA
 PAPI - PERFORMANCE API ANDRÉ PEREIRA ampereira@di.uminho.pt 1 Motivation Application and functions execution time is easy to measure time gprof valgrind (callgrind) It is enough to identify bottlenecks,
Debugging, Profiling and Optimising Scientific Codes. Wadud Miah Research Computing Group
 Debugging, Profiling and Optimising Scientific Codes Wadud Miah Research Computing Group Scientific Code Performance Lifecycle Debugging Scientific Codes Software Bugs A bug in a program is an unwanted
Performance Optimization for Stampede
 Performance Optimization for Stampede Jim Browne, Ashay Rane and Leo Fialho XSEDE 2013 Agenda 1 Introduction 2 The User Perspective 3 Hands-on 4 PerfExpert Architecture 5 Conclusions 2 / 81 Agenda In the
Data and File Structures Laboratory
 Tools: GDB, Valgrind Assistant Professor Machine Intelligence Unit Indian Statistical Institute, Kolkata August, 2018 1 GDB 2 Valgrind A programmer s experience Case I int x = 10, y = 25; x = x++ + y++;
Hands-on Workshop on How To Debug Codes at the Institute
 Hands-on Workshop on How To Debug Codes at the Institute H. Birali Runesha, Shuxia Zhang and Ben Lynch (612) 626 0802 (help) help@msi.umn.edu October 13, 2005 Outline Debuggers at the Institute Totalview
CSE 351. GDB Introduction
 CSE 351 GDB Introduction Lab 2 Out either tonight or tomorrow Due April 27 th (you have ~12 days) Reading and understanding x86_64 assembly Debugging and disassembling programs Today: General debugging
Evolving HPCToolkit John Mellor-Crummey Department of Computer Science Rice University Scalable Tools Workshop 7 August 2017
 Evolving HPCToolkit John Mellor-Crummey Department of Computer Science Rice University http://hpctoolkit.org Scalable Tools Workshop 7 August 2017 HPCToolkit 1 HPCToolkit Workflow source code compile &
Intel VTune Amplifier XE
 Intel VTune Amplifier XE Vladimir Tsymbal Performance, Analysis and Threading Lab 1 Agenda Intel VTune Amplifier XE Overview Features Data collectors Analysis types Key Concepts Collecting performance
Profiling and Workflow
 Profiling and Workflow Preben N. Olsen University of Oslo and Simula Research Laboratory preben@simula.no September 13, 2013 1 / 34 Agenda 1 Introduction What? Why? How? 2 Profiling Tracing Performance
HPCToolkit: Sampling-based Performance Tools for Leadership Computing
 HPCToolkit: Sampling-based Performance Tools for Leadership Computing John Mellor-Crummey Department of Computer Science Rice University johnmc@cs.rice.edu http://hpctoolkit.org CScADS 2009 Workshop on
VIRTUAL INSTITUTE HIGH PRODUCTIVITY SUPERCOMPUTING. BSC Tools Hands-On. Germán Llort, Judit Giménez. Barcelona Supercomputing Center
 BSC Tools Hands-On Germán Llort, Judit Giménez Barcelona Supercomputing Center 2 VIRTUAL INSTITUTE HIGH PRODUCTIVITY SUPERCOMPUTING Getting a trace with Extrae Extrae features Platforms Intel, Cray, BlueGene,
HPCC - Hrothgar. Getting Started User Guide TotalView. High Performance Computing Center Texas Tech University
 HPCC - Hrothgar Getting Started User Guide TotalView High Performance Computing Center Texas Tech University HPCC - Hrothgar 2 Table of Contents *This user guide is under development... 3 1. Introduction...
Guillimin HPC Users Meeting July 14, 2016
 Guillimin HPC Users Meeting July 14, 2016 guillimin@calculquebec.ca McGill University / Calcul Québec / Compute Canada Montréal, QC Canada Outline Compute Canada News System Status Software Updates Training
Introduction to OpenMP. OpenMP basics OpenMP directives, clauses, and library routines
 Introduction to OpenMP Introduction OpenMP basics OpenMP directives, clauses, and library routines What is OpenMP? What does OpenMP stands for? What does OpenMP stands for? Open specifications for Multi
Automatic trace analysis with the Scalasca Trace Tools
 Automatic trace analysis with the Scalasca Trace Tools Ilya Zhukov Jülich Supercomputing Centre Property Automatic trace analysis Idea Automatic search for patterns of inefficient behaviour Classification
SCIENTIFIC COMPUTING FOR ENGINEERS
 4/26/16 CS 594: SCIENTIFIC COMPUTING FOR ENGINEERS PAPI Performance Application Programming Interface Heike Jagode jagode@icl.utk.edu OUTLINE 1. Motivation What is Performance? Why being annoyed with Performance
Computer Organization: A Programmer's Perspective
 Profiling Oren Kapah orenkapah.ac@gmail.com Profiling: Performance Analysis Performance Analysis ( Profiling ) Understanding the run-time behavior of programs What parts are executed, when, for how long
Allinea DDT Debugger. Dan Mazur, McGill HPC March 5,
 Allinea DDT Debugger Dan Mazur, McGill HPC daniel.mazur@mcgill.ca guillimin@calculquebec.ca March 5, 2015 1 Outline Introduction and motivation Guillimin login and DDT configuration Compiling for a debugger
Debugging. P.Dagna, M.Cremonesi. May 2015
 Debugging P.Dagna, M.Cremonesi May 2015 Introduction Oneofthemostwidelyusedmethodstofindoutthereasonofa strange behavior in a program is the insertion of printf or write statements in the supposed critical
MPI Runtime Error Detection with MUST
 MPI Runtime Error Detection with MUST At the 27th VI-HPS Tuning Workshop Joachim Protze IT Center RWTH Aachen University April 2018 How many issues can you spot in this tiny example? #include #include
Performance Improvement. The material for this lecture is drawn, in part, from The Practice of Programming (Kernighan & Pike) Chapter 7
 Chapter 7") Performance Improvement The material for this lecture is drawn, in part, from The Practice of Programming (Kernighan & Pike) Chapter 7 1 For Your Amusement Optimization hinders evolution. -- Alan Perlis
Performance Improvement The material for this lecture is drawn, in part, from The Practice of Programming (Kernighan & Pike) Chapter 7 1 For Your Amusement Optimization hinders evolution. -- Alan Perlis
Tools for Intel Xeon Phi: VTune & Advisor Dr. Fabio Baruffa - LRZ,
 Tools for Intel Xeon Phi: VTune & Advisor Dr. Fabio Baruffa - fabio.baruffa@lrz.de LRZ, 27.6.- 29.6.2016 Architecture Overview Intel Xeon Processor Intel Xeon Phi Coprocessor, 1st generation Intel Xeon
EE 355 Lab 3 - Algorithms & Control Structures
 1 Introduction In this lab you will gain experience writing C/C++ programs that utilize loops and conditional structures. This assignment should be performed INDIVIDUALLY. This is a peer evaluated lab
Introduction to debugging. Martin Čuma Center for High Performance Computing University of Utah
 Introduction to debugging Martin Čuma Center for High Performance Computing University of Utah m.cuma@utah.edu Overview Program errors Simple debugging Graphical debugging DDT and Totalview Intel tools
ncsa eclipse internal training
 ncsa eclipse internal training This tutorial will cover the basic setup and use of Eclipse with forge.ncsa.illinois.edu. At the end of the tutorial, you should be comfortable with the following tasks:
"An Off-The-Wall, Possibly CHARMing View of Future Parallel Application Development
 "An Off-The-Wall, Possibly CHARMing View of Future Parallel Application Development Jim Browne University of Texas browne@cs.utexas.edu April 28, 2010 Charm Workshop Keynote 1 "An Off-The-Wall, Possibly
Accelerate HPC Development with Allinea Performance Tools
 Accelerate HPC Development with Allinea Performance Tools 19 April 2016 VI-HPS, LRZ Florent Lebeau / Ryan Hulguin flebeau@allinea.com / rhulguin@allinea.com Agenda 09:00 09:15 Introduction 09:15 09:45
Scalasca support for Intel Xeon Phi. Brian Wylie & Wolfgang Frings Jülich Supercomputing Centre Forschungszentrum Jülich, Germany
 Scalasca support for Intel Xeon Phi Brian Wylie & Wolfgang Frings Jülich Supercomputing Centre Forschungszentrum Jülich, Germany Overview Scalasca performance analysis toolset support for MPI & OpenMP
Detection and Analysis of Iterative Behavior in Parallel Applications
 Detection and Analysis of Iterative Behavior in Parallel Applications Karl Fürlinger and Shirley Moore Innovative Computing Laboratory, Department of Electrical Engineering and Computer Science, University
MPI Performance Snapshot. User's Guide
 MPI Performance Snapshot User's Guide MPI Performance Snapshot User s Guide Legal Information No license (express or implied, by estoppel or otherwise) to any intellectual property rights is granted by
Introduction to Performance Engineering
 Introduction to Performance Engineering Markus Geimer Jülich Supercomputing Centre (with content used with permission from tutorials by Bernd Mohr/JSC and Luiz DeRose/Cray) Performance: an old problem
Performance analysis with Periscope
 Performance analysis with Periscope M. Gerndt, V. Petkov, Y. Oleynik, S. Benedict Technische Universität petkovve@in.tum.de March 2010 Outline Motivation Periscope (PSC) Periscope performance analysis
SCALASCA v1.0 Quick Reference
 General SCALASCA is an open-source toolset for scalable performance analysis of large-scale parallel applications. Use the scalasca command with appropriate action flags to instrument application object
Parallel Debugging with TotalView BSC-CNS
 Parallel Debugging with TotalView BSC-CNS AGENDA What debugging means? Debugging Tools in the RES Allinea DDT as alternative (RogueWave Software) What is TotalView Compiling Your Program Starting totalview
High Performance Computing and Programming. Performance Analysis
 High Performance Computing and Programming Performance Analysis What is performance? Performance is a total effectiveness of a program What are the measures of the performance? execution time FLOPS memory
MPI Performance Snapshot
 User's Guide 2014-2015 Intel Corporation Legal Information No license (express or implied, by estoppel or otherwise) to any intellectual property rights is granted by this document. Intel disclaims all
Tools and Methodology for Ensuring HPC Programs Correctness and Performance. Beau Paisley
 Tools and Methodology for Ensuring HPC Programs Correctness and Performance Beau Paisley bpaisley@allinea.com About Allinea Over 15 years of business focused on parallel programming development tools Strong
Improving Applica/on Performance Using the TAU Performance System
 Improving Applica/on Performance Using the TAU Performance System Sameer Shende, John C. Linford {sameer, jlinford}@paratools.com ParaTools, Inc and University of Oregon. April 4-5, 2013, CG1, NCAR, UCAR
Profiling: Understand Your Application
 Profiling: Understand Your Application Michal Merta michal.merta@vsb.cz 1st of March 2018 Agenda Hardware events based sampling Some fundamental bottlenecks Overview of profiling tools perf tools Intel
Debugging and Profiling
 Debugging and Profiling Nate Woody 5/27/2009 www.cac.cornell.edu 1 Debugging Debugging is a methodical process of finding and reducing the number of bugs, or defects, in a computer program or a piece of
Welcome. HRSK Practical on Debugging, Zellescher Weg 12 Willers-Bau A106 Tel
 Center for Information Services and High Performance Computing (ZIH) Welcome HRSK Practical on Debugging, 03.04.2009 Zellescher Weg 12 Willers-Bau A106 Tel. +49 351-463 - 31945 Matthias Lieber (matthias.lieber@tu-dresden.de)
Debugging, benchmarking, tuning i.e. software development tools. Martin Čuma Center for High Performance Computing University of Utah
 Debugging, benchmarking, tuning i.e. software development tools Martin Čuma Center for High Performance Computing University of Utah m.cuma@utah.edu SW development tools Development environments Compilers
JURECA Tuning for the platform
 JURECA Tuning for the platform Usage of ParaStation MPI 2017-11-23 Outline ParaStation MPI Compiling your program Running your program Tuning parameters Resources 2 ParaStation MPI Based on MPICH (3.2)
Debugging process. The debugging process can be divided into four main steps: 1. Start your program, specifying anything that might affect its
 Debugging Introduction One of the most widely used methods to find out the reason of a strange behavior in a program is the insertion of printf or write statements in the supposed critical area. However
VAMPIR & VAMPIRTRACE INTRODUCTION AND OVERVIEW
 VAMPIR & VAMPIRTRACE INTRODUCTION AND OVERVIEW 8th VI-HPS Tuning Workshop at RWTH Aachen September, 2011 Tobias Hilbrich and Joachim Protze Slides by: Andreas Knüpfer, Jens Doleschal, ZIH, Technische Universität
Overview. Timers. Profilers. HPM Toolkit
 Overview Timers Profilers HPM Toolkit 2 Timers Wide range of timers available on the HPCx system Varying precision portability language ease of use 3 Timers Timer Usage Wallclock/C PU Resolution Language
Tutorial: Analyzing MPI Applications. Intel Trace Analyzer and Collector Intel VTune Amplifier XE
 Tutorial: Analyzing MPI Applications Intel Trace Analyzer and Collector Intel VTune Amplifier XE Contents Legal Information... 3 1. Overview... 4 1.1. Prerequisites... 5 1.1.1. Required Software... 5 1.1.2.
SGI Altix Getting Correct Code Reiner Vogelsang SGI GmbH
 SGI Altix Getting Correct Code Reiner Vogelsang SGI GmbH reiner@sgi.com Module Objectives After completing the module, you will able to Find caveats and hidden errors in application codes Handle debuggers
Debugging for the hybrid-multicore age (A HPC Perspective) David Lecomber CTO, Allinea Software
 David Lecomber CTO, Allinea Software") Debugging for the hybrid-multicore age (A HPC Perspective) David Lecomber CTO, Allinea Software david@allinea.com Agenda What is HPC? How is scale affecting HPC? Achieving tool scalability Scale in practice
Debugging for the hybrid-multicore age (A HPC Perspective) David Lecomber CTO, Allinea Software david@allinea.com Agenda What is HPC? How is scale affecting HPC? Achieving tool scalability Scale in practice
A Comparative Performance Evaluation of Different Application Domains on Server Processor Architectures
 A Comparative Performance Evaluation of Different Application Domains on Server Processor Architectures W.M. Roshan Weerasuriya and D.N. Ranasinghe University of Colombo School of Computing A Comparative
PAPI Software Specification
 PAPI Software Specification This software specification describes the PAPI 3.0 Release, and is current as of March 08, 2004. It consists of the following sections: Introduction to PAPI Constants Standardized
OpenACC Support in Score-P and Vampir
 Center for Information Services and High Performance Computing (ZIH) OpenACC Support in Score-P and Vampir Hands-On for the Taurus GPU Cluster February 2016 Robert Dietrich (robert.dietrich@tu-dresden.de)
Beginner's Guide for UK IBM systems
 Beginner's Guide for UK IBM systems This document is intended to provide some basic guidelines for those who already had certain programming knowledge with high level computer languages (e.g. Fortran,
Performance Measuring on Blue Horizon and Sun HPC Systems:
 Performance Measuring on Blue Horizon and Sun HPC Systems: Timing, Profiling, and Reading Assembly Language NPACI Parallel Computing Institute 2000 Sean Peisert peisert@sdsc.edu Performance Programming
CptS 360 (System Programming) Unit 4: Debugging
 Unit 4: Debugging") CptS 360 (System Programming) Unit 4: Debugging Bob Lewis School of Engineering and Applied Sciences Washington State University Spring, 2018 Motivation You re probably going to spend most of your code
CptS 360 (System Programming) Unit 4: Debugging Bob Lewis School of Engineering and Applied Sciences Washington State University Spring, 2018 Motivation You re probably going to spend most of your code
Debugging CUDA Applications with Allinea DDT. Ian Lumb Sr. Systems Engineer, Allinea Software Inc.
 Debugging CUDA Applications with Allinea DDT Ian Lumb Sr. Systems Engineer, Allinea Software Inc. ilumb@allinea.com GTC 2013, San Jose, March 20, 2013 Embracing GPUs GPUs a rival to traditional processors
IBM High Performance Computing Toolkit
 IBM High Performance Computing Toolkit Pidad D'Souza (pidsouza@in.ibm.com) IBM, India Software Labs Top 500 : Application areas (November 2011) Systems Performance Source : http://www.top500.org/charts/list/34/apparea
CIS 403: Lab 6: Profiling and Tuning
 CIS 403: Lab 6: Profiling and Tuning Getting Started 1. Boot into Linux. 2. Get a copy of RAD1D from your CVS repository (cvs co RAD1D) or download a fresh copy of the tar file from the course website.
ARCHER Single Node Optimisation
 ARCHER Single Node Optimisation Profiling Slides contributed by Cray and EPCC What is profiling? Analysing your code to find out the proportion of execution time spent in different routines. Essential
PLASMA TAU Guide. Parallel Linear Algebra Software for Multicore Architectures Version 2.0
 PLASMA TAU Guide Parallel Linear Algebra Software for Multicore Architectures Version 2.0 Electrical Engineering and Computer Science University of Tennessee Electrical Engineering and Computer Science
Parallel Programming and Optimization with GCC. Diego Novillo
 Parallel Programming and Optimization with GCC Diego Novillo dnovillo@google.com Outline Parallelism models Architectural overview Parallelism features in GCC Optimizing large programs Whole program mode
Profilers and performance evaluation. Tools and techniques for performance analysis Andrew Emerson
 Profilers and performance evaluation Tools and techniques for performance analysis Andrew Emerson 10/06/2016 Tools and Profilers, Summer School 2016 1 Contents Motivations Manual Methods Measuring execution