COGCC GIS Online Map Instructions - Internet Site April 10, 2018
|
|
|
- Helena Washington
- 5 years ago
- Views:
Transcription

1 COGCC GIS Online Map Instructions - Internet Site April 10, 2018 Table of Contents Page Section Page Section 1 Introduction 8 Clear Selection 2 Double Click 8 Buffer 3 Arrow Tip Information 9 Select within 3 Busy Indicator 10 Selection Results 3 Alternate Location for Commands 10 Intersect 4 Zoom Button 11 Add point 6 Zoom to Rectangle 12 Redline 6 Zoom In 20 Copy 6 Zoom Out 21 Print 6 Previous View 22 Lat/Long 6 Initial Map View 22 Help 7 Pan Mode 22 Appendix Redline Parameters 7 Refresh Map 7 Select Mode Introduction By using the various tools in this map you can zoom in and out, find specific features, select features that meet certain criteria, display information about selected features, print the current view of the map, and more. The screen is broken into three main panels, plus an upper tool/function bar and a lower informational bar
2 1. The Layers Pane (left panel) displays the layers and layer groups in the map. The layer groups can be expanded to display the individual layers, or they can be collapsed. To expand a layer group, click the + sign to the left of folder and to collapse the group, click the sign. 2. The Map Pane (center panel) displays the map at various user chosen scales with features displayed dependent upon the layers selected from the Layers Pane. As the map is zoomed in to larger scales, more layers become available for viewing. 3. The Task Pane (right panel) displays links to Disclaimer, Map Layer Info, Map Tools, Other Browsers, FAQs and map help Contacts. 4. The upper tool/function bar includes various commands and tools to query data, navigate, copy, print, measure, determine lat/long of a point, select features within another feature and add features to the map. To adjust the cursor function click the various icons on the toolbar. The selected function of the cursor will remain until another icon function is selected. See more detailed instructions below. 5. The lower informational bar Double Click o tracks the UTM coordinates of the cursor, o lists the number of features selected (see Selection Results below), o shows the map scale (see Zoom below to adjust the scale) and o lists the dimensions of the map in miles or feet, depending on the map scale. Several of the map features will display pop-up information windows by left double clicking the feature. In order for this to happen, pop-ups need to be allowed for the map website. Also, some browsers require CTRL+Left-Double Click on these features for the pop-up information. Using the select mode arrow cursor this function can be used on: The red well dot or purple or green BHL dots to bring up the well scout card. The light blue spacing layer to bring up the Spacing Orders summary for the selected section. The green pits symbol to bring up the Pit Information card. The green, orange or grey locations symbol to bring up the Location Information card. 2D and 3D Seismic Permits to bring up a search window. Enter the seismic project Unique ID and click Search. This will then bring up links to the seismic Form 20, Form 20A and seismic map documents. A Soil Survey area will link to the NRCS soil summary website. The various Miscellaneous Facility icons to bring up an electronic description of the facility. The green triangular Sample Site symbols to bring up the Environmental Sample Site Information summary. 2
 symbol to bring up a Inspection/Incident Inquiry summary of Inspection document links.")
3 The red, orange, yellow, white green or blue square Inspection Priority symbols to bring up a Inspection/Incident Inquiry summary of Inspection document links. The red, orange, green or purple open circle Inspection Priority Level (risk factor) symbol to bring up a Inspection/Incident Inquiry summary of Inspection document links. The red, orange or yellow open square Reclamation Inspection Priority Level symbol to bring up a Inspection/Incident Inquiry summary of Inspection document links. Light blue dots representing DWR Water Wells to bring up a summary of water well information. A yellow dot (COGCC o/g data) or a vivid pink dot (DWR data) symbol for Denver Basin Geophysical Well Logs. Other layers may be added from time to time with document connections. Arrow Tip Information Pausing the arrow cursor over some features will yield a map-tip window which contains information about the feature. It may take pausing for several seconds for the map-tip window to appear. The window will display for most layer features within the map. This example identifies the yellow area as the city of Fort Lupton. Busy Indicator When a command is initiated, such as a Pan or ZoomTo, the Busy Indicator appears just above the upper right portion on the map panel. It will oscillate for a few seconds until the task has been completed and then it will disappear. Alternate Locations for Commands Several of the commands available as buttons in the upper tool bar are also available choices from a menu when you right click over the map. 3

4 Right Click Menu Zoom Clicking the Zoom button brings up the Zoom GoTo dialog box. The Category dropdown list of options allows you to zoom to: City Location Oil/Gas Field County Parcel Township/Range Well API number 4

5 Select a Category from the dropdown list. Use the format example given in parentheses for your given category. In the Location box enter the information in the required format. Click the ZoomTo button The map frame will display the selected township. The scale of the map can be adjusted by using various Zoom buttons (see below) or Zoom Buttons by adjusting the scale in the lower right portion of the map frame. Just type in the right-hand portion of the scale ratio. In this example you would type in and then press Enter on the keyboard. 5


6 Zoom to Rectangle Select the Zoom to Rectangle tool and then left click and hold on the map to drag a box around the area you want to zoom to. Release the left mouse button and the map will then zoom to the area drawn. Zoom in Select the Zoom In tool and then click on an area of the map. The map will zoom in at a fixed zoom with the click point being the center of the map. Each time the map is clicked, a fixed zoo-in rate will occur. Zoom Out Select the Zoom Out tool and then click on an area of the map. The map will zoom out at a fixed zoom with the click point being the center of the map. Each time the map is clicked, a fixed zoom-out rate will occur. Previous View Initial Map View Select the Previous View tool and the map will return to the previous map frame view. Select the Initial Map View tool to return to the opening view of the entire state. This does not refresh the map. 6

7 Pan Mode direction. Select the Pan Mode tool and then left click and hold the cursor to drag the map to drag in any Refresh Map Selecting this tool refreshes the map relative to any updates in the database. The area of the map remains the same. Select Mode Clicking on the arrow changes the cursor to the select mode. A single left click on a feature (well, water well, etc.) will turn the feature dark blue indicating that it has been selected. Left click and drag a rectangle around multiple features to select all of the multiple features. The selection will be indicated by the color change to dark blue. A layer must be activated in the layers list in order to be selectable. For example in order to select water wells the DWR Wells layer must be activated. The total number of features selected will be displayed in the features selected area in the middle of the lower informational bar. To view the list of selections see the Selection Results section below on page 10. 7
.")
8 Clear Selection To clear all selections from the map use the Clear Selection button or left click in an open area on the map. Removal of the dark blue color indicates that these items are no longer selected. Buffer Use the buffer command to draw a buffer of a set distance around a selected item(s). Then you can select other features within the buffer and view a report as described below. Creating a buffer is a temporary operation, for selection and viewing only. Once the map session is closed, the buffer(s) disappears. To create a buffer 1. Select the feature or features to be buffered; the selected features will change to dark blue. 2. Select the Buffer command. 3. The Create a Buffer task will appear in the Task Pane on the right side of the viewer window Under Distance Around Features, specify the radius of the buffer in miles, kilometers, feet or meters. 5. Specify a name for the buffer. 6. If you have already created a buffer in this session, use the same name to overwrite the first buffer or a new name to create a separate buffer. 7. Optionally, select Merge Buffer Areas. 8

9 If you selected multiple features to buffer, selecting Merge Buffer Areas will combine the buffers for all the features into one buffer. If you do not select this option, each feature will have a separate buffer. 8. Use the options under Fill Style and Border Style to specify how you want the buffer to appear. If you do not desire any fill to appear within the buffer, set Transparency to 0%. 9. Click Done to create the buffer. 10. Results of the buffer are put into a new layer at the top of the layers panel to the left of the map. 11. To hide buffer layers, turn them off by un-checking box by the buffer name the layer. Select Within After a buffer has been created, certain features can be selected within that buffer. To select features within a buffer: 1. Select the buffer feature on the map with the arrow cursor; it will turn dark blue. 2. Choose the Select Within command. 3. The Select Within task will display in the Task Pane to the right of the map. 4. Under Restrict Results To Selected Layers, click one or more layers containing the features you want to select; use the CTRL key to add selected layers.. Currently, however, Wells (API Spot), directional Bottom Hole Locations (Form 5 Bottom Hole) and DWR Wells (Water Wells) are the only selectable features that will return results using Selection Results (see below). 5. Click Done. 4 In this example, all of the water wells will be selected within the buffer. To view the Selection Results see the instructions on page 10. 9

10 Selection Results Only wells and water wells are viewable in the Selection Results report. Once wells or water wells have turned dark blue indicating that they are selected features, a list of those wells can be generated by clicking the Selection Results button. This will generate a pop-up window which lists all of the wells in a Selected Items Report. To see additional information for the wells click on the blue API#/Well Name link for oil/gas wells or the blue Receipt/Permit number link for water wells. Intersect The Intersect function is a shortcut to see if any of a fixed number of map layers intersect and area of interest. Activate the Intersect button and then left click and drag a rectangle around the area of interest. The Intersect tool results are shown in the pop-up Indentify Layers window. An intersected layer will be shown in red and indicates that the area of interest intersects that layer. The actual extent of that layer can then be examined by activating that layer on the map. 10

11 Add Point The Add Point button allows you to post a marker (X) at a given location on the map. When you left click on the Add Point button, the Point Capture window appears. 2 1 From this window adding a point to the map can be performed by either: 1. Adding latitude and longitude in decimal degrees format (e.g ) to the boxes and then clicking the Add Point button. 2. Clicking the Add Point by Click button and then click the map where you want the point. A red X will then appear on the map. 11

12 The red X will exist on the map and displays as part of the Points layer at the top of the Layers panel. Redline The Redline function allows adding colored points, lines, polygons and text to the map. Left click the Redline button. The Redlining Disclaimer window appears. Note that the redlines can be saved only during the day they were created. Clicking the OK button displays the Manage Redline Groups function in the Task Panel on the right side of the map page. 12

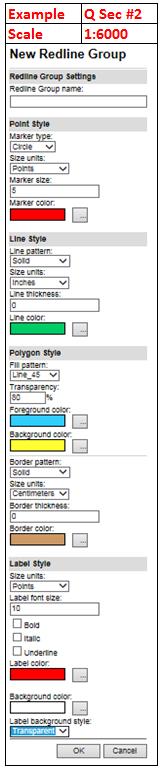
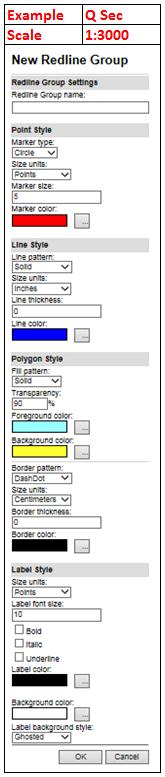
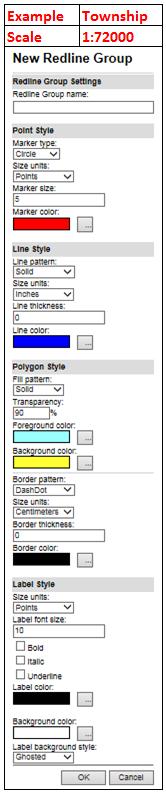
13 To start a new Redline Group click the New button in the Task panel. This loads the New Redline Group - Redline Group Settings window in the Task panel. This allows you to set preferences for colors, thickness, shapes, color transparency as well as font characteristics. 13


14 First enter a Redline Group name. For each shape category (point, line and polygon) enter your format choices. Select the font characteristics for labels and text boxes. Click OK. 14


15 The Manage Redline Groups pane now displays Available Redline Groups. Select your newly named group name and click Open. The selected group name is now in the Open Redline Groups section. Click Edit. 15

16 In the Add Redline window select the redline type that you want to create. For example if you want to add a line, select PolyLine. Click on the map for the starting point. Continue clicking on the map for as many line segments you want to be displayed. To finish the line: CTRL + Left Click. This then initiates the prompt window which allow you to add a label to the line should you desire. Enter the name here. Otherwise leave the space blank and click OK. 16

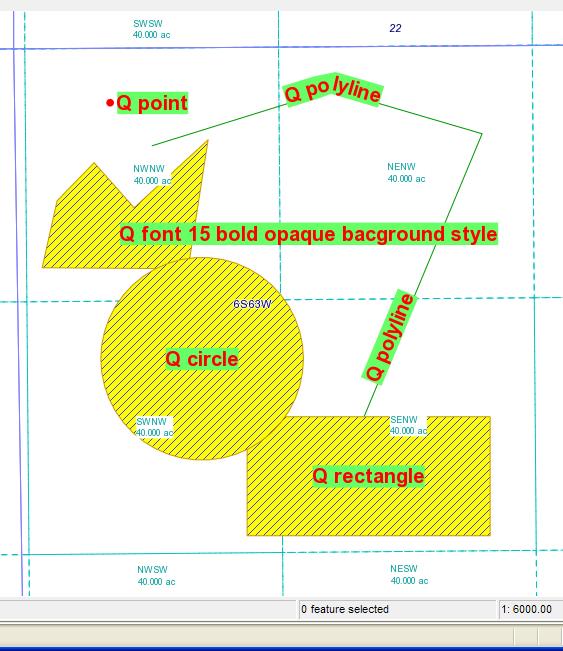
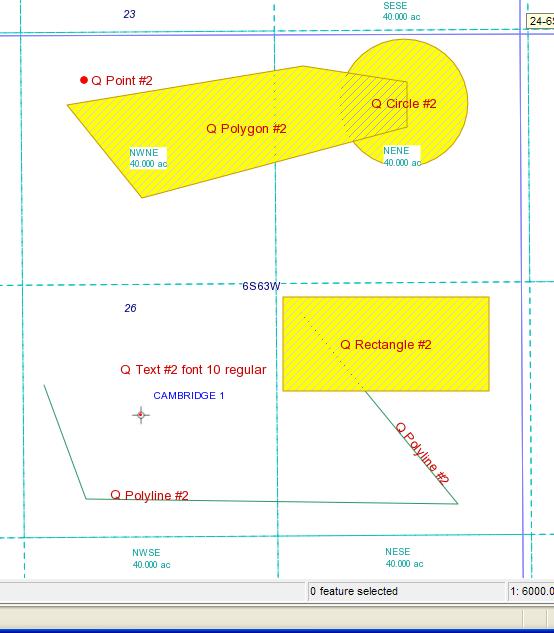
17 The labeled or unlabeled line then appears with the color/pattern that was defined for the Redline Group. Points, rectangles, circles, polygons and texts can be created in the same manner. To change text in a label or in a solo text, first highlight the Redline feature to be changed in the Modify Redlines section of the Task Pane. 17

18 Then type in the correction in the top Modify Redlines box and. click the Update Text button. The corrected text will then appear on the map. 18
19 Note: Once a Redline Group has been created, the color thickness, pattern, font, etc. cannot be modified. To change these characteristics a new Redline Group will need to be created with the formatting desired. When finished with the redlines, click the Close button at the bottom of the task pane. 19


20 Copy The copy command displays a pop-up window showing the map panel only. Webpage Copied View This copy can be pasted into another document, such as MS Word. With the copied view as the active window copy it by right-clicking over the copied map and select Copy or Copy Image from the list of choices and then paste the copy into the selected document. 20

21 Another alternative is to use the Snipping Tool in the Accessories program folder for MS Windows 7, 8 and 10. Print This command gives generates a PDF which you can save or use to print a hard copy. This command also gives the option of adding a descriptive map title, adding a legend as well as selecting paper orientation and paper size. Click the Print button. Set the desired parameters. Then click the Generate PDF button. The process of generating the PDF will take several seconds or more depending the speed of your processor. Then this window will appear: Now you have the option of clicking one of the two this link options in the window; one to generate a PDF and the other to generate a PNG or BMP image. You can print from either one. 21

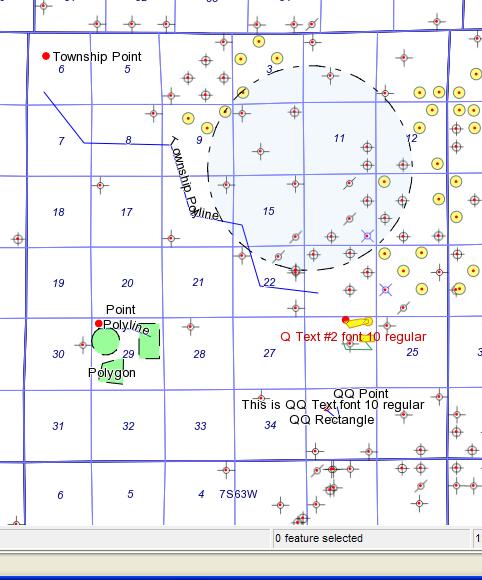
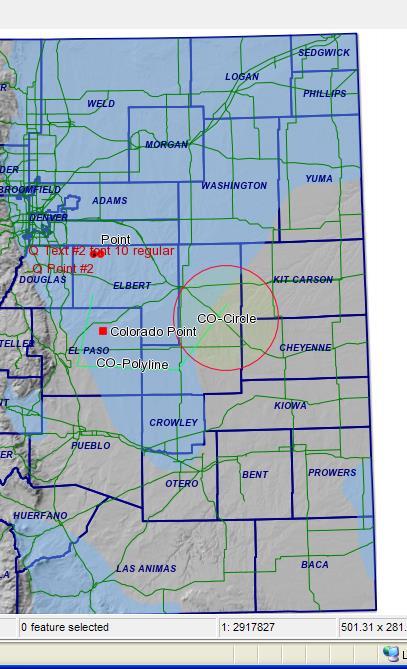
22 Lat/Long The Lat/Long function will display the latitude and longitude of a point selected on the map to six decimal degrees. Click the Lat/Long button. The cursor changes to a crosshair which you use to left click your point of interest on the map. A pop-up window will display the latitude and longitude of the point that was clicked on the map. Help Clicking the Help button changes the right-hand panel back to the MAPGUIDE HELP panel. APPENDIX Examples of Redline Input Parameters at Various Scales The following examples (pages 24-30) represent what various input parameters of MapGuide Redlines size and colors look like when input at various scales. They are meant to be used as a starting point for you to judge what best suits your purpose. You may want to go smaller or larger with point size, line size or font size to best display your features. Here are some points to consider as you become familiar with the new Redline tool: The Labels Style will determine the size of the Redline labels as well as any solo text you might create. If you want to add a text label with a different size, you will need to set up a separate Redline Group for that size text. If the label associated with the point that was created is too close to that point, adding spaces before the text during the Script Prompt will not move the text further to the right in the label. You will have to create the point without a text label and then add a separate text placed where you want it to begin. 22


23 Rectangle, polygon and circle will all draw with the same style that was set up for Polygon Style. FORMATTING EXAMPLES Example Section Scale 1:
24 24
25 25
26 26

27 QQ Scale 1:3000 (above example) when backed out to scale 1:12000 looks like this. Note the change in font size relative to the quarter-quarter section: 27
28 28
29 29
COGCC GIS Online Map Tools-Intranet Site July 12, 2011
 COGCC GIS Online Map Tools-Intranet Site July 12, 2011 Table of Contents Page Section Page Section 1 Introduction 7 Clear Selection 2 Double Click 7 Buffer 2 Arrow Tip Information 8 Select within 3 Busy
City of La Crosse Online Mapping Website Help Document
 City of La Crosse Online Mapping Website Help Document This document was created to assist in using the new City of La Crosse online mapping sites. When the website is first opened, a map showing the City
COMMISSION OF TEXAS MAY
 GIS Viewer RAILROAD COMMISSION OF TEXAS MAY 2017 Table of Contents GIS Viewer Basics... 1 Basics... 1 Screen Overview... 2 Tools... 5 Visibility... 5 Measure Tool... 7 Identify Tool... 10 Coordinates Tool...
PWC County Mapper XM User Instruction (AS OF 12/03/2009)
") PWC County Mapper XM User Instruction (AS OF 12/03/2009) MAP NAVIGATION There are several ways to navigate the map, you can use your keyboard/mouse combination, use the Navigation toolbar, use the slider
PWC County Mapper XM User Instruction (AS OF 12/03/2009) MAP NAVIGATION There are several ways to navigate the map, you can use your keyboard/mouse combination, use the Navigation toolbar, use the slider
1. NJDEP Landscape 3.3 Viewer Interface
 Using the Landscape Project through NJDEP Landscape 3.3 Viewer Google Chrome or Mozilla Firefox are recommended for the use of this app. Navigate to the NJDEP-DFW s Landscape Project web page at www.njfishandwildlife.com/ensp/landscape/
To the GeoView System Overview Online Training Course
 Welcome! To the GeoView System Overview Online Training Course The Alberta Department of Energy provides GeoView as a mapping system to enable users to find geographic information in Alberta. GeoView retrieves
Greenville County Internet Mapping System User s Guide
 Greenville County Internet Mapping System User s Guide Version 2.0 Greenville County Geographic Information Systems May 30, 2006 Table of Contents NAVIGATING TO THE ONLINE MAPPING APPLICATIONS...- 3 -
Mn/DOT MnCMAT Crash Analysis Application Help
 Mn/DOT MnCMAT Crash Analysis Application Contents Login... 5 User Login Dialog... 5 Login... 5 Request Access Dialog... 5 Forgotten Password Dialog... 6 Create/Open Project... 7 Create/Open Project Dialog...
OnCOR Silverlight Viewer Guide
 Getting Around There are many ways to move around the map! The simplest option is to use your mouse in the map area. If you hold the left button down, then click and drag, you can pan the map to a new
Guide to Mapping Website (Public) December 2016 GC_236594
 December 2016 GC_236594") Guide to Mapping Website (Public) December 2016 GC_236594 Table of Contents Guide to Mapping Website (Public)... 1 December 2016... 1 Quick Start... 3 Map Layers... 4 How do I?... 5 Draw on the Map...
Guide to Mapping Website (Public) December 2016 GC_236594 Table of Contents Guide to Mapping Website (Public)... 1 December 2016... 1 Quick Start... 3 Map Layers... 4 How do I?... 5 Draw on the Map...
LeeSpInS 2.0 Help Guide
 LeeSpInS 2.0 Help Guide http://leegis.leegov.com/leespins/ E-mail us at gis@leegov.com with any questions or issues using this site Navigation Tools Pan arrows scroll the map in the arrow direction or
Press the Plus + key to zoom in. Press the Minus - key to zoom out. Scroll the mouse wheel away from you to zoom in; towards you to zoom out.
 Navigate Around the Map Interactive maps provide many choices for displaying information, searching for more details, and moving around the map. Most navigation uses the mouse, but at times you may also
Full Search Map Tab. This map is the result of selecting the Map tab within Full Search.
 Full Search Map Tab This map is the result of selecting the Map tab within Full Search. This map can be used when defining your parameters starting from a Full Search. Once you have entered your desired
IntraMaps End User Manual
 IntraMaps End User Manual For IntraMaps Version 8 Date: 6 th July 2014 Contents Introduction... 4 What is IntraMaps?... 4 Application... 5 Main Toolbar... 6 View... 7 Original View:... 7 Pan:... 7 Zoom
Full Search Map Tab Overview
 FlexMLS Map Server Full Search Map Tab Overview The Full Search Map tab is a need to know module. It is accessible when you use Full Search under Search in the Main Menu tree of FlexMLS. This map can
Overview of ArcGIS Online Applications. Champaign County
 Overview of ArcGIS Online Applications Champaign County Champaign County GIS Consortium Updated: April 2017 Table of Contents ArcGIS Online Application Overview... 3 Map Interface Symbology and Terminology...
U N I V E R S I T Y O F K E N T U C K Y. efacts 2-click Interactive Building Information Map ~ Help Guide ~ Revised January 20, 2016
 U N I V E R S I T Y O F K E N T U C K Y efacts 2-click Interactive Building Information Map ~ Help Guide ~ Revised January 20, 2016 Contents BUILDING SEARCH... 3 A. FIND A CAMPUS LOCATION... 3 GRAPHICAL
HBS Training - IT Solutions. PlanWeb. Introduction
 HBS Training - IT Solutions PlanWeb Introduction CONTENTS Logging on to the system...3 The PlanWeb Window...5 The Tool Bar...6 The Status Bar...6 The Map Window...6 The Information Window...7 Changing
User Manual Mobile client User Interface Version 5.0. Powered by
 User Manual Mobile client User Interface Version 5.0 Powered by Cartographic browser Gomap 4 1 Access control 5 1.1 Public access 5 1.2 Secured access 5 1.3 Multiple applications 5 2 Organisation 6 3 Parameters
RAPIDMAP Geocortex HTML5 Viewer Manual
 RAPIDMAP Geocortex HTML5 Viewer Manual This site was developed using the evolving HTML5 web standard and should work in most modern browsers including IE, Safari, Chrome and Firefox. Even though it was
HBS Training - IT Solutions. PlanWeb. Intermediate
 HBS Training - IT Solutions PlanWeb Intermediate CONTENTS Logging on to the system...3 The PlanWeb Window...5 The Tool Bar...6 The Status Bar...6 The Map Window...6 The Information Window...7 Changing
Welcome to the Surface Water Data Viewer!
 1 Welcome to the Surface Water Data Viewer! The Surface Water Data Viewer is a mapping tool for the State of Wisconsin. It provides interactive web mapping tools for a variety of datasets, including chemistry,
St. Joseph County. GIS Department FetchGIS Web Map Tutorial
 St. Joseph County GIS Department FetchGIS Web Map Tutorial 2 Table of Contents Contents Slide #(s) Where to Find the Web Map 3 Disclaimer 4 Turning On and Off Map Layers 5 Searching for Parcels 6 More
Chapter 1 : Getting Started with Integrity... Chapter 2 : Interface Layout... Chapter 3 : Navigation... Chapter 4 : Printing...
 .0 User s Manual Table of Contents Chapter : Getting Started with Integrity... Chapter : Interface Layout... Chapter : Navigation... Chapter : Printing... Chapter : Quick Search and Results Pane... Results
PURPOSE AND BACKGROUND
 CROP ISOLATION MAP TABLE OF CONTENTS Click on any item below to jump to that section Purpose and Background Log In Initial Page Mapping Functions Zooming to a Location Show Pop-ups Show Pins Draw Field
Development Authority of the North Country (DANC) Internet Mapping Application Instructions Public Viewer 1. Purpose. 2. Logging-in. 3.
 Internet Mapping Application Instructions Public Viewer 1. Purpose. 2. Logging-in. 3.") Development Authority of the North Country (DANC) Internet Mapping Application Instructions Public Viewer 1. Purpose The purpose of this document is to outline basic functionality of the DANC Internet
Development Authority of the North Country (DANC) Internet Mapping Application Instructions Public Viewer 1. Purpose The purpose of this document is to outline basic functionality of the DANC Internet
TRAINING GUIDE. Lucity Webmap 2017r2
 TRAINING GUIDE Lucity Webmap 2017r2 Web Map The Lucity Web Map provides a way for users to see and work with their asset and work data. This allows them to see relationships between objects and plan work
Tutorial for Lane County Mapping Applications
 Tutorial for Lane County Mapping Applications Contents Overview... 2 Tools... 2 Navigation Tools... 3 Display Tools... 5 Information Tools... 6 Sharing Tools... 7 Common Tasks... 9 Identify or Show Data
Greater Bridgeport Regional Council Municipal GIS Viewer Training April 2015
 Greater Bridgeport Regional Council Municipal GIS Viewer Training April 2015 GBRC GIS Web Training Table of Contents Introduction........................................................... 3 Viewer Components.......................................................
Using the Kendall County GIS CAMA/Sales GIS Viewer
 Using the Kendall County GIS CAMA/Sales GIS Viewer Link to Viewer Gallery: http://gis.co.kendall.il.us/gisviewer_gallery.aspx Help and About Initial View Introduction Navigation Identify Tool Search Tool
Getting Started with VicMap
 Getting Started with VicMap This is a brief overview of some of the tools and features available on VicMap. At any time you can right click on the map and click Identify What s Here to find more information
Juniata County, Pennsylvania
 GIS Parcel Viewer Web Mapping Application Functional Documentation June 21, 2017 Juniata County, Pennsylvania Presented by www.worldviewsolutions.com (804) 767-1870 (phone) (804) 545-0792 (fax) 115 South
Step by Step How to Manual
 www.quintewestmaps.com Step by Step How to Manual Click on to accept the disclaimer and go to the web GIS Step by Step Web Based GIS Interface Layout of Web Based GIS Save your Favorite Map Views Link
Biodiversity GIS (BGIS) Internet Mapping User Guide
 Internet Mapping User Guide") Biodiversity GIS (BGIS) Internet Mapping User Guide http://bgis.sanbi.org Contents 1 Basic Introduction to BGIS Website (http://bgis.sanbi.org)... 6 1.1 LUDS... 6 1.2 Projects... 6 1.3 Services... 6 1.4
Biodiversity GIS (BGIS) Internet Mapping User Guide http://bgis.sanbi.org Contents 1 Basic Introduction to BGIS Website (http://bgis.sanbi.org)... 6 1.1 LUDS... 6 1.2 Projects... 6 1.3 Services... 6 1.4
NEW LOOK OF RAPIDMAP! Below is how the RapidMap interface will look when it is initially opened.
 NEW LOOK OF RAPIDMAP! Below is how the RapidMap interface will look when it is initially opened. MAP LAYERS When the arrow to the left of the Search For button is clicked, a Map Layers panel will slide
Open Source Cloud Map User Guide
 Open Source Cloud Map User Guide Table of Contents Map Page... 1 Static Mercator Map... 1 Customizable Map... 1 Title Bar... 2 Toolbar... 2 Non Toolbar Navigation... 3 Map Window... 3 Layers / Legend Window...
Lucas County Engineer s GIS Maps User Guide
 Lucas County Engineer s GIS Maps User Guide The Web Map Interface On the left hand side of the screen, you will see the Legend of the layers shown in the map. If you click on Details, you will see just
The Preparing for Success Online Mapping Tool
 The Preparing for Success Online Mapping Tool Baker Polito Administration The Executive Office of Housing and Economic Development and MassGIS Questions & Comments? Please contact MassWorks@state.ma.us
NJ-GeoWeb: Primer and Tutorial
 NJ-GeoWeb: Primer and Tutorial New Jersey Department of Environmental Protection Office of Information Resources Management Bureau of Geographic Information Systems PO Box 420 Mail Code 401-01 Trenton,
How to use the DuPage County Parcel Viewer Interactive Web Mapping Application.
 How to use the DuPage County Parcel Viewer Interactive Web Mapping Application. Parcel Viewer URL: URL: http://gis.dupageco.org/parcelviewer/ Initial View (And frequently asked questions) Parcel Search
FlexMLS Maps Quick Reference Guide
 FlexMLS Maps Quick Reference Guide Full Search Map Tab Features Define Search Areas box Map tab in Full Search Radius Search tool from an address Show/Hide Property List, Locate Address, and Define Search
Page 1 of 16 CONTENTS:
 Page 1 of 16 CONTENTS: HOME-BOX -- (PG.2) o PROPERTY OWNERSHIP o ADDRESS SEARCH o I WANT TO AERIAL IMAGERY AND BASE MAPS -- (PG.2) o IMAGERY WITH LABELS ON/OFF o TOPOGRAPHY ON/OFF o TRANSPARENCY ZOOM IN
Fusion. CBR Fusion MLS Level 1 Core Functions. Class Handout
 Fusion 1 CBR Fusion MLS Level 1 Core Functions Class Handout GETTING STARTED IN FUSION Logging On and Off To log on to Fusion MLS: 1. Type your user name in the User ID box. 2. Type your password in the
Table of Contents. Map Layout... 5 Layer List - Default... 6 Identify... 7 Search Method... 8
 Table of Contents Map Layout... 5 Layer List - Default... 6 Identify... 7 Search Method... 8 1. Targeted Search... 8 2. Query Tool... 11 A. Select Parcel by entering Parcel Number... 12 B. Select Parcel
Ottawa County Survey Data Map
 Ottawa County Engineer s Office User Guide for Ottawa County Survey Data Map Introduction: The Ottawa County Engineer s Office has been diligently working to better serve our constituents with access to
Bombardier Business Aircraft Customer Services. Technical Publications. SmartPubs Viewer 3.0 User Guide. Updated January 2013 [2013]
![Bombardier Business Aircraft Customer Services. Technical Publications. SmartPubs Viewer 3.0 User Guide. Updated January 2013 [2013]](/thumbs/90/103657167.jpg "Bombardier Business Aircraft Customer Services. Technical Publications. SmartPubs Viewer 3.0 User Guide. Updated January 2013 [2013]") Bombardier Business Aircraft Customer Services Technical Publications SmartPubs Viewer 3.0 User Guide Updated January 2013 [2013] Table of Contents Application Views... 5 Collection View... 5 Manual View...
Bombardier Business Aircraft Customer Services Technical Publications SmartPubs Viewer 3.0 User Guide Updated January 2013 [2013] Table of Contents Application Views... 5 Collection View... 5 Manual View...
Read and accept the following disclaimer:
 How to use the Person County Tax Parcel Viewer Visit gis.personcounty.net and click to view the Tax Parcel Viewer or go to gis.personcounty.net/taxparcelviewer Read and accept the following disclaimer:
Swan Creek BMP Retrofit Database User s Manual
 Swan Creek BMP Retrofit Database User s Manual Toledo Metropolitan Area Council of Governments Lucas County Soil and Water Conservation District September, 2012 This project was funded through the Lake
Guide to Bruce County Maps (Public) January 2018
 January 2018") Guide to Bruce County Maps (Public) January 2018 For any unanswered questions about Bruce County Maps not covered by this document, please contact Justin Kraemer at gis@brucecounty.on.ca or phone 519-534-2092
Guide to Bruce County Maps (Public) January 2018 For any unanswered questions about Bruce County Maps not covered by this document, please contact Justin Kraemer at gis@brucecounty.on.ca or phone 519-534-2092
To show toolbars, double-click in the banner at the top or click the tools icon
 8/15/2013 Welcome to Culver City s GIS Property Information Search 2.0. This instructional document provides an overview of most commonly used functionality in this streamlined, enhanced web map application.
Map Viewer User Guide
 Map Viewer User Guide Sea Level Scenario Sketch Planning Tool Version 2, 2017 University of Florida GeoPlan Center Introduction The purpose of this document is to guide users on how to use the Sea Level
ParcelQuest Quick Reference Guide
 ParcelQuest Quick Reference Guide Table of Contents BASIC SEARCHING Where is the Get Me Close search box? 3 Where is the Find My Parcels search area? 3 Where can I perform a Radius or Comp search? 4 How
Manitowoc County, WI Advanced Access GIS Viewer User Documentation
 Manitowoc County, WI Advanced Access GIS Viewer User Documentation Introduction Extensive time was put into developing this website both from a display, and from a printing and scaling perspective. This
Search Results Tabs. List Tab Options
 Search Results Tabs The Search Results screen is sectioned by tabs. These tabs contain information and tools that are vital in how you configure listing information to package and sell to your clients.
Create Geomark in Google Earth Tutorial
 Create Geomark in Google Earth Tutorial General business example a potential applicant / user wants to create an area of interest that can be shared electronically to another party eg: another agency,
REDI 5.0 User Manual
 REDI 5.0 User Manual OBJECTIVE: REDI (Regional Economic Development Information System) provides a quick, convenient and easy way of accessing the City of San Diego Business Incentive Zones (BIZ) information.
1. Move your mouse to the location you wish text to appear in the document. 2. Click the mouse. The insertion point appears.
 Word 2010 Text Basics Introduction Page 1 It is important to know how to perform basic tasks with text when working in a word processing application. In this lesson you will learn the basics of working
The Maryland-National Capital Park and Planning Commission. PGAtlas.com. System Specifications
 The Maryland-National Capital Park and Planning PGAtlas.com System Specifications Contents DOCUMENT CHANGE HISTORY... 3 1 INTRODUCTION... 4 1.1 APPLICATION DESCRIPTION... 4 1.2 INTENDED USERS... 4 2 APPLICATION
Enerdeq Browser Transition from PI/Dwights PLUS Data on CD
 IHS > Critical Information Product Enerdeq Browser Transition from PI/Dwights PLUS Data on CD October, 2013 2013 IHS, All Rights Reserved. All trademarks belong to IHS or its affiliated and subsidiary
Office of Geographic Information Systems
 Office of Geographic Information Systems Print this Page Fall 2012 - Working With Layers in the New DCGIS By Kent Tupper The new version of DCGIS has access to all the same GIS information that our old
Working with PDF s. To open a recent file on the Start screen, double click on the file name.
 Working with PDF s Acrobat DC Start Screen (Home Tab) When Acrobat opens, the Acrobat Start screen (Home Tab) populates displaying a list of recently opened files. The search feature on the top of the
Intro to GIS (requirements: basic Windows computer skills and a flash drive)
") Introduction to GIS Intro to GIS (requirements: basic Windows computer skills and a flash drive) Part 1. What is GIS. 1. System: hardware (computers, devices), software (proprietary or free), people. 2.
Introduction to GIS Intro to GIS (requirements: basic Windows computer skills and a flash drive) Part 1. What is GIS. 1. System: hardware (computers, devices), software (proprietary or free), people. 2.
NEBRASKA811 IMAP MANUAL AN INSTRUCTIONAL GUIDE TO VIEWING AND MAPPING DISTRICT POLYGONS ONLINE OCTOBER
 NEBRASKA811 IMAP MANUAL AN INSTRUCTIONAL GUIDE TO VIEWING AND MAPPING DISTRICT POLYGONS ONLINE 2013 OCTOBER 30 2013 TABLE OF CONTENTS Introduction 1 IMAP at-a-glance 2 Logging In 3 Understanding The Components
Instructions for Using the Interactive Map:
 Instructions for Using the Interactive Map: Basic Overview This interactive maps displays all major active projects and permits that are processed at Snohomish County's Planning and Development Services
Generating Vectors Overview
 Generating Vectors Overview Vectors are mathematically defined shapes consisting of a series of points (nodes), which are connected by lines, arcs or curves (spans) to form the overall shape. Vectors can
TRAINING GUIDE. Tablet Cradle to Mobile GIS
 TRAINING GUIDE Tablet Cradle to Mobile GIS Tablet Cradle to Mobile One of the critical components of mobile is the GIS piece, and also can be the most complex. The mobile GIS maps are designed to consume
IMAP MANUAL UTILITY NOTIFICATION CENTER AN INSTRUCTIONAL GUIDE TO VIEWING AND MAPPING DISTRICT POLYGONS ONLINE.
 UTILITY NOTIFICATION CENTER IMAP MANUAL AN INSTRUCTIONAL GUIDE TO VIEWING AND MAPPING DISTRICT POLYGONS ONLINE 2013 LAST UPDATE: JUNE 2013 TABLE OF CONTENTS Introduction 1 IMAP at-a-glance 2 Logging In
v Annotation Tools GMS 10.4 Tutorial Use scale bars, North arrows, floating images, text boxes, lines, arrows, circles/ovals, and rectangles.
 v. 10.4 GMS 10.4 Tutorial Use scale bars, North arrows, floating images, text boxes, lines, arrows, circles/ovals, and rectangles. Objectives GMS includes a number of annotation tools that can be used
Help Guide Rev
 Help Guide Rev. 1.0 07152014 Home Page The home page displays your vehicle(s) on a satellite map. The information box, showing vehicle information will already be opened. The information box displays your
MRMLS SmartMap CityGIS5 (More training available at
 MRMLS SmartMap CityGIS5 (More training available at http://www.imrmls.com/centsite/training.html) 3201 W. Temple Ave., Suite 250 Pomona, Ca 91768 800-925-1525 or http://www.imrmls.com/support Last Edited
Geography 281 Map Making with GIS Project Two: Map Design Issues in ArcMap
 Geography 281 Map Making with GIS Project Two: Map Design Issues in ArcMap This activity provides an introduction to the map design process. It takes you through a typical sequence from the initial decision
Tutorial 01 Quick Start Tutorial
 Tutorial 01 Quick Start Tutorial Homogeneous single material slope No water pressure (dry) Circular slip surface search (Grid Search) Intro to multi scenario modeling Introduction Model This quick start
TRAINING GUIDE. Mobile for Administrators Part 3 - GIS
 TRAINING GUIDE Mobile for Administrators Part 3 - GIS Mobile for Administrators - GIS One of the critical components of mobile is GIS, and it can also be the most complex. The mobile GIS maps are designed
SAGIS Property Map Viewer Instruction Manual Instructions for using the SAGIS Property Map Viewer. Published December 21, 2018.
 SAGIS Property Map Viewer Instruction Manual www.sagis.org/map Instructions for using the SAGIS Property Map Viewer. Published December 21, 2018. 1 Instructional Videos Click on a link to watch a video
Estuary Data Viewer User Guide
 1. Introduction 2. Page Layout 3. Navigation Tools 4. Table of Contents Tabs 5. Action Tools 6. System Requirements Estuary Data Viewer User Guide 1. Introduction Welcome to the Estuary Planner Data Viewer.
PRINTING GROWER FIELD MAPS OFF THE WEB
 PRINTING GROWER FIELD MAPS OFF THE WEB 12-01-09 I. FREE map printing options: A. Google Earth: Pros Very easy to use; easy to print map (either directly or via extraction to Word); easy to scale up or
End User Guide. 2.1 Getting Started Toolbar Right-click Contextual Menu Navigation Panels... 2
 TABLE OF CONTENTS 1 OVERVIEW...1 2 WEB VIEWER DEMO ON DESKTOP...1 2.1 Getting Started... 1 2.1.1 Toolbar... 1 2.1.2 Right-click Contextual Menu... 2 2.1.3 Navigation Panels... 2 2.1.4 Floating Toolbar...
National Monuments Service: Wreck Database Viewer
 National Monuments Service: Wreck Database Viewer Introduction HELP DOCUMENT Welcome to the Wreck Viewer map / search facility that provides access to the records of wrecks held by the National Monuments
Vizit Pro User Manual
 Vizit Pro User Manual 1 Table of Contents Vizit Pro User Manual... 1 Using Vizit Pro... 3 The Vizit Pro User Interface... 3 Toolbars... 4 File Tab Toolbar... 4 Edit Tab Toolbar... 5 Annotations Tab Toolbar...
TRAINING GUIDE. Tablet: Cradle to Mobile GIS
 TRAINING GUIDE Tablet: Cradle to Mobile GIS Tablet Cradle to Mobile One of the critical components of mobile is the GIS piece, and also can be the most complex. The mobile GIS maps are designed to consume
Draft FPC Hatchery Release Data Mapping Application
 Draft FPC Hatchery Release Data Mapping Application 1 Table of Contents To open the Hatchery Release Data Mapping Query 4 Quick Reference Instructions to Search for Hatchery Release Data 5 Notes about
for ArcSketch Version 1.1 ArcSketch is a sample extension to ArcGIS. It works with ArcGIS 9.1
 ArcSketch User Guide for ArcSketch Version 1.1 ArcSketch is a sample extension to ArcGIS. It works with ArcGIS 9.1 ArcSketch allows the user to quickly create, or sketch, features in ArcMap using easy-to-use
Peoria County Front Desk Map Application
 Peoria County Front Desk Map Application Quick Guide, 2017 At a First Glance This guide will tell users all they need to know about the Peoria County Front Desk application which can be found on the Peoria
Newaygo County Web Map
 Newaygo County Web Map Address/Parcel/Parcel Owner Search Map Overview Zoom Back to default extent Use your current location if allowable Widget Panel At the top of the map is a search function used for
Citizens MapViewer User Manual
 Citizens MapViewer User Manual This guide has been designed with step-by-step instructions to help familiarize you with using the city s Citizens MapViewer. Each of the controls (menus and buttons) is
Using Syracuse Community Geography s MapSyracuse
 Using Syracuse Community Geography s MapSyracuse MapSyracuse allows the user to create custom maps with the data provided by Syracuse Community Geography. Starting with the basic template provided, you
SMART Meeting Pro 4.2 personal license USER S GUIDE
 smarttech.com/docfeedback/170973 SMART Meeting Pro 4.2 personal license USER S GUIDE Product registration If you register your SMART product, we ll notify you of new features and software upgrades. Register
WAIPA DISTRICT COUNCIL. Maps Online 9. Updated January This document contains an overview of IntraMaps/Maps Online version 9.
 WAIPA DISTRICT COUNCIL Maps Online 9 Updated January 2018 This document contains an overview of IntraMaps/Maps Online version 9.0 Contents Starting Maps Online... 3 Menu Bar... 4 Tools... 5 View Tab...
Word Tips & Tricks. Status Bar. Add item to Status Bar To add an itme to the status bar, click on the item and a checkmark will display.
 Status Bar The status bar is located on the bottom of the Microsoft Word window. The status bar displays information about the document such as the current page number, the word count in the document,
Microsoft PowerPoint 2007 Beginning
 Microsoft PowerPoint 2007 Beginning Educational Technology Center PowerPoint Presentations on the Web... 2 Starting PowerPoint... 2 Opening a Presentation... 2 Microsoft Office Button... 3 Quick Access
BC Spatial Member Map Viewer. Version 2.0. User Guide. May 2015
 BC Spatial Member Map Viewer Version 2.0 User Guide May 2015 1 P a g e Revised: 16 June 2015 Contents Contents... 2 Introduction... 4 System Requirements... 5 BC Spatial Map Viewer... 6 I. Navigation Tools...
GIS DATA SUBMISSION USER GUIDE. Innovation and Networks Executive Agency
 Innovation and Networks Executive Agency GIS DATA SUBMISSION USER GUIDE Innovation and Networks Executive Agency (INEA) W910 Chaussée de Wavre 910 B-1049 Brussels, Belgium Tel: +32 (0)2 29 95252 Fax: +32
User Guide for. Logical. Creating a Regional Decision Support System for the Houston-Galveston Region
 User Guide for Logical Creating a Regional Decision Support System for the Houston-Galveston Region Eco-Logical User Guide The Eco-Logical GIS is a free, online decision-making mapping tool that can be
Getting Started with the NH Stone Wall Mapper January 2019
 Getting Started with the NH Stone Wall Mapper January 2019 Stone walls are significant cultural and historical features of the New England landscape. Creating a statewide inventory of existing stone walls
Remark Office OMR. Tutorials
 Remark Office OMR Tutorial Overview Tutorials We want you to be immediately successful with your new software. To that end, we highly recommend that you walk through the tutorials provided here before
DDX-R Quick Start Guide
 DDX-R Quick Start Guide Imaging Support 1-855-726-9995 www.scilvet.com Contents USING DDX-R... 2 Opening a Patient File... 2 Opening a New Patient File... 3 Screen Layout... 3 ACQUIRING IMAGES ON A PATIENT...
Please refer to for specifics and limitations with these operating systems.
 Appendix B ArcReader User Guide For the Southeast Ocean Based Renewable Energy Project INTRODUCTION The purpose of this document is to provide guidance and assistance to users with ArcReader, so that they
SMART Meeting Pro PE 4.1 software
 Help us make this document better smarttech.com/feedback/170973 SMART Meeting Pro PE 4.1 software USER S GUIDE Product registration If you register your SMART product, we ll notify you of new features
Map Viewer User Guide. January 2018
 January 2018 Revision History Map Viewer 3.0.1 Revision Date Author / Reviewer Description of Changes 1 April 6, 2017 RWE Addition of Known Issues, format changes. 2 April 11, 2017 RWE Revision for PROD
Getting Started with the NH Coastal Viewer March, 2015, v0
 Getting Started with the NH Coastal Viewer March, 2015, v0 The NH Coastal Viewer contains a comprehensive user interface with many tools and functions. This document summarizes some of the basic site functionality,