Florida Statewide Regional Evacuation Study Program
|
|
|
- Shanna Nora Jordan
- 5 years ago
- Views:
Transcription


1 Florida Statewide Regional Evacuation Study Program Methodology and Support Documentation Volume 8 Florida Division of Emergency Management All Florida Regional Planning Councils Includes Hurricane Evacuation Study
2 This page intentionally left blank.
3 TABLE OF CONTENTS Page Chapter I Introduction... I-1 Chapter II Evacuation Model Technical Document...II-1 A. Introduction...II-1 B. Geodatabase...II-3 C. General Model Flow...II-6 D. Initializing the Model...II-23 E. Trip Generation Number of Evacuating Trips...II-29 F. Trip Distribution...II-33 G. Highway Assignment...II-42 H. Transportation Interface for Modeling Evacuations (TIME)...II-62 I. Future Enhancements...II-86 Chapter III Demographic and Land Use Analysis Methodology... III-1 A. Guiding Principles for the Demographic Analysis... III-1 B. Socio-Economic Profile... III-1 C. Development of Small Area Data for Transportation Modeling... III-3 Chapter IV SRESP Surge Inundation Model Tool Methodology... IV-1 A. Origins of Methodology...IV-1 B. Surge Inundation Model Tool...IV-2 C. Underneath the Methodology...IV-4 Chapter V Geodatabase Design and Methodology...V-1 A. Introduction... V-1 B. Core GIS Data Components... V-2 C. Shelter Data Components... V-2 D. Future Land Use Data Components... V-2 E. Critical Facilities Data Components... V-3 F. Data Collaboration and Updates... V-3 G. Vulnerability Data Components... V-4 Appendix A Evacuation Transportation Model Data Dictionary...V-5 Appendix B Traffic Flow Rates for Emergency Evacuation in the Florida Keys...V-8 Appendix C Evacuation Transportation Model County and Region Codes...V-32 Methodology and Support Documentation i Page i
4 LIST OF FIGURES Page Figure II-1 Map of SRESP Evacuation Model Traffic Evacuation Zones...II-6 Figure II-2 Evacuation Model Network Database...II-14 Figure II-3 Reverse Lane Operations Plans in Florida...II-20 Figure II-4 General Model Flow...II-22 Figure II-5 Out-of-County and Family Trip Length Frequency Distribution for Tampa Bay...II-36 Figure II-6 Total Distance Traveled of evacuating Tampa Bay Friends and Family Trips...II-37 Figure II-7 SRESP Evacuation Model Response Curves...II-41 Figure II-8 Clearance Time Curve...II-44 Figure II-9 Average Peaking Characteristics by Functional Class...II-49 Figure II-10 Available Capacity at Peak Volume = 100% of Capacity...II-50 Figure II-11 Available Capacity at Peak Volume = 75% of Capacity...II-51 Figure II-12 Available Capacity at Peak Volume = 50% of Capacity Non-Evacuating Counties...II-53 Figure II-13 Available Capacity at Peak Volume = 20% of Capacity Evacuating Coastal Counties...II-54 Figure II-14 Queuing Delay Five Hours into an Evacuation from a Dynamic Assignment Model...II-58 Figure II-15 Queuing Delay Ten Hours into an Evacuation from a Dynamic Assignment Model...II-59 Figure II-16 Queuing Delay Fifteen Hours into an Evacuation from a Dynamic Assignment Model...II-60 Figure II-17 Queuing Delay Twenty Hours into an Evacuation from a Dynamic Assignment Model...II-61 Figure IV-1 SLOSH Display Output...IV-4 Figure IV-2 Surge Inundation Model Tool Flowchart...IV-8 Figure V-1 Typical Data Flow Process Diagram... V-1 Figure V-2 Regional Geodatabase Schema... V-3 Methodology and Support Documentation ii Page ii
5 LIST OF TABLES Page Table II-1 County Summary of Dummy TEZ...II-7 Table II-2 Two-Digit Facility Type...II-17 Table II-3 Two-Digit Area Type...II-19 Table II-4 EVACRGN and EAZ Values...II-28 Table II-5 Percentage of Out-of-County trips traveling between Regions during an Evacuation...II-32 Table II-6 Available Phases...II-39 Table III-1 Socio-Economic Indicator List 2000 Census Block Group Data... III-6 Table III-2 Recommended Fields for Preparation of Small Area Data Baseline Data for III-9 Methodology and Support Documentation iii Page iii
6 This page intentionally left blank. Methodology and Support Documentation iv Page iv
7 CHAPTER I INTRODUCTION This volume contains the detailed methodology used in developing various components of the Statewide Regional Evacuation Study Program (SRESP). The intent of this Volume is to provide methodologies not found elsewhere in the Study. For example, the methodology for Shelter Analysis can be found in Volume One, the Technical Data Report in Chapter 5: Regional Shelter Analysis. It is recognized that the components of the study, sheltering analysis, transportation analysis, etc. have an important impact on local evacuation strategies. As such, the methodologies are provided. The development of the methodologies utilized in the Study required coordination and input from all eleven regional planning councils in Florida, along with the Division of Emergency Management, Department of Transportation, Department of Community Affairs, and local county emergency management teams. At the statewide level, SRESP Work Group Meetings were typically held on a monthly basis to discuss the development of the various methodologies and receive feedback and input from the State agencies and RPCs. At the local and regional levels, input was received from local county emergency management, the regional planning council, local transportation planning agencies and groups, as well as other interested agencies. This volume contains the detailed methodologies for the following SRESP components: Evacuation Transportation Model Methodology (Chapter II) Demographic And Land Use Analysis Methodology (Chapter III) SRESP Surge Inundation Tool Methodology (Chapter IV) Geodatabase Design and Methodology (Chapter V) Methodology and Support Documentation Page I-1
8 This page intentionally left blank. Methodology and Support Documentation Page I-2
9 CHAPTER II EVACUATION MODEL TECHNICAL DOCUMENT A. Introduction A transportation evacuation model was developed as part of the Statewide Regional Evacuation Study Program (SRESP) to analyze evacuation trips under a variety of evacuation conditions and to report clearance times. This model serves as the backbone for all transportation analyses developed for this study and is the tool used to produce the data reported in Volumes 4 and 5 of this study. Wilbur Smith Associates (WSA) developed the evacuation model for the Northeast Florida Regional Council and the Florida Division of Emergency Management. This document discusses information relevant to understanding and executing the evacuation model. This documentation provides information on the final production version of the evacuation model as well as the TIME interface used to operate it. The evacuation model is developed in Cube with a custom built GIS based graphic user interface. The first portion of this document discusses the data that are used in the model. The following sections discuss model initialization, trip generation, trip distribution, segmentation, background traffic, and trip assignment. The final section provides a user s guide on working with the evacuation model using the TIME interface. Background to Transportation Modeling A traditional travel demand model is typically organized into four successive steps. Each step is responsible for handling a distinct aspect of the travel demand modeling activity. It is for this reason that these models are usually referred to as four-step models. The first step of the model is called trip generation. Trip generation is the step during which the model determines how many trips will be made by individuals in the modeled area. The second step of the model is known as trip distribution. It is during this step of the model that the model determines the destination of each trip in the modeled area. The third step of the model is mode choice. During mode choice, the model divides the total trips in the modeled area among the various modes of travel available in the model (such as auto, bus, rail, etc.). Finally, the fourth step of the model is highway assignment. The highway assignment step of the model is responsible for determining which segments of roadway in the modeled area each trip travels along to reach its destination. The purpose of highway assignment is primarily to determine how much traffic is traveling along a particular stretch of road during the analysis periods. The traffic that has been assigned to the model s highway network is often referred to as the model volume of a given highway link. Traditional four step models are typically designed to provide these model volumes for a 24 hour period. Such volumes are known as daily assignments. Many models have more recently begun to employ a technique known as time-of-day assignment. Time-of-day models divide a 24 hour day into smaller periods typically Methodology and Support Documentation Page II-1
10 corresponding to the morning and evening peak periods (a three hour period encompassing the morning or evening rush hours) and an off-peak period. The time-of-day model may be further disaggregated to distinguish between a midday off-peak period (from the morning peak period to the evening peak period) and an overnight period (from the evening peak period to the morning peak period). These assignments are known as time-of-day assignments. Time-of-day assignments for each of the modeled time periods may be aggregated to provide a daily assignment volume. Assignment volumes can be analyzed to provide useful information on forecasted travel patterns and areas of likely congestion. Along with volumes, other statistics that are typically derived from highway assignments include vehicle-miles-traveled, vehicle-hours-traveled, congested travel times and speeds, and level-of-service. The Unique Character of an Evacuation Traditional four-step models are designed to provide useful information to transportation planners. As such, they tend to represent travel behavior on a typical day. These models typically assume that a certain number of people get up in the morning and go to work each day. They assume that people will go shopping, eat at restaurants, and visit with friends each day. They assume that children will go to school each day. Evacuation events significantly deviate from this typical behavior. During an evacuation event, it is assumed that the ordinary trip making behavior of the residents in the modeled area is disrupted. Instead of going to work or shopping at the mall, individuals spend their time preparing to either weather the storm at home or evacuate. Trips that are made and are not for the purposes of an evacuation may generally be shorter trips closer to home. The most significant kind of trip that is made during an evacuation event is the evacuation trip itself. There are several distinct characteristics of evacuation trips that differentiate an evacuation model from a traditional four-step model: 1. Most evacuation trips begin within a very well defined window of opportunity as opposed to occurring naturally throughout the day. This window typically begins when an order to evacuate has been given; 2. Origins for evacuation trips are highly concentrated corresponding to areas threatened by storm surge flooding; 3. Destinations for evacuation trips are spread throughout the region, State, and beyond; 4. Items 2 and 3 above result in a relatively unidirectional flow of trips away from the threatened area and toward areas of safety; 5. A larger proportion of evacuation trips will exit the county or region than is typically assumed in a traditional four-step model; and, 6. Roadway segments that allow for inter-county or inter-regional travel are relatively few. As a result of the aforementioned items, an evacuation event can be stated as a phenomenon where a large number of vehicles coming from the same place are leaving at the same time, going in the same direction, and taking the same roads. This increases the likelihood of experiencing severe congestion along the highway system. This is particularly true at critical Methodology and Support Documentation Page II-2
11 points along the network such as bridges and freeway interchanges. Furthermore, the most valuable statistic pertaining to an evacuation is the amount of time it takes evacuees to get to a place where they are no longer in danger. Since the effects of congestion on the travel times of evacuees fluctuates as the amount of traffic increases and decreases, it becomes vital to be able to measure the progress of an evacuation over time. It is for these reasons that a model specific to the purpose of measuring evacuations has been developed for the State of Florida. The following sections of this report document the development and features of the SRESP evacuation model. B. Geodatabase Starting with Cube 5.0, the Cube software has been able to use data stored in a geodatabase as inputs to transportation models. This makes it possible to view and edit model data in GIS. Every scenario has its own dedicated geodatabse. Data changed for a given scenario does not impact any other scenario. The evacuation model stores three key inputs in a geodatabase: Traffic Evacuation Zones sub-county geographies that contain data concerning the population living there; Highway Network a transportation system database that contains data on every road included in the model; and, Evacuation Shelters a database containing the locations and capacities of each public shelter used in Florida to house evacuees seeking a safe haven from a storm. Data were stored for three separate analysis years: 2006, 2010, and The 2006 data were used to develop the base model and were not used to estimate evacuation clearance times for this study. Small Area Data The development of zone data for this model was an exhaustive exercise accomplished through the cooperation of the Regional Planning Councils (RPCs) and counties of the State of Florida. WSA worked with public sector planning staff at all levels to compile and organize a comprehensive database of zone data. This section discusses the type of data included in the Traffic Evacuation Zone (TEZ) database and how these data were developed, what the TEZ system is and how individual zones were created, and the relationship of the model-wide TEZ database that was developed to the subset of the TEZs that were used for each region s implementation of the evacuation model. Data were provided to WSA through the SRESP by the eleven Regional Planning Councils (RPC) located throughout the state. These data (labeled as small area data ) contain the demographic information crucial to modeling evacuation traffic. These data contain population and dwelling unit information that will identify where the individuals in the region reside. The planning assumptions developed from the behavioral analysis conducted for this study are applied to these demographic data by the SRESP Evacuation Model. This results in a set of evacuation trips being generated by the evacuation model. Methodology and Support Documentation Page II-3
12 The zone data are organized into a hierarchy of three tiers: 1. Small Area Data: This tier represents the level at which data were collected by the RPCs. This can either be MPO Traffic Analysis Zones or Census block groups depending on the preference of the RPCs. The RPCs were encouraged to use MPO Traffic Analysis Zones whenever possible. In some cases, an RPC collected the data at the parcel level and later aggregated it to the small area data level. The model input database does not maintain data at this level of detail; however, the small area data were aggregated without splits into the next tier of organization. An equivalency table has been maintained, making it possible for the RPCs to make adjustments to their small area data and update the model input file with ease. Data were developed for the following years: 2006, 2010, and Traffic Evacuation Zone (TEZ): This tier represents the level at which the model is first able to recognize data. Given the vast amount of small area data, it was necessary to aggregate these data into a level of geography that would make sense at a statewide scale. Though each TEZ may contain data from multiple small area data units, each small area data unit belongs to only one TEZ. Trip generation and distribution occurs at this level. The TEZs are smaller along the coast and larger inland where the need to evacuate is almost non-existent. The zone data input file is maintained at the TEZ level of detail. 3. Evacuation Assignment Zone (EAZ): Since this model makes use of Cube AVENUE s dynamic traffic assignment (DTA) capabilities, the burden of computing has to be taken into consideration. DTA is much more computationally intensive than static assignment techniques. One of the key factors impacting computer processing needs for DTA is the number of zones used in the assignment. In order to allow the model to run effectively, TEZs are aggregated into EAZs. EAZ aggregation occurs automatically within the model stream and is guided by an attribute in the TEZ database. Traffic Evacuation Zone (TEZ) Once the small area data had been submitted, WSA reviewed the small area geographies. Small area geographies needed to be aggregated into larger units known as Traffic Evacuation Zones (TEZ). These TEZs form the basic unit of analysis in the evacuation model similar to how traffic analysis zones form the basic unit of analysis in a standard travel demand model. The TEZ system was developed so that the small area geographies will nest completely within one TEZ or another. This eliminated any potential for split data and ensured that data in the TEZ system can always be updated with relative ease. An equivalency table has been maintained so that the relationships between the small area data and the TEZ system do not disappear. To the extent possible, this effort was automated in order to speed up the process of aggregating small area data into the TEZ structure. Some manual manipulation was required in order to ensure that the configuration of the zones conformed as much as possible to the highway network that is used to run the evacuation model. Also of critical concern was the need to conform to the boundaries of evacuation zones as defined by each county. Methodology and Support Documentation Page II-4
13 After the TEZ system was developed, WSA and the RPCs worked together to identify areas in the evacuation model where a greater amount of geographic disaggregation of the data would be beneficial. These TEZs were then split to accommodate the needed level of detail. Candidates for these splits were located mostly in coastal areas. All TEZs are at a minimum comprised of one entire unit of small area geography, either a census block group or MPO Traffic Analysis Zone. No unit of small area geography was split to make smaller TEZs. Figure II-1 shows the TEZ system. The final TEZ system for the evacuation model has 9,456 numbered zones ranging from 1 to 17,328. With only 9,456 zones being numbered in the TEZ system, this leaves an additional 7,872 zone numbers reserved for dummy zones. The zone numbering is consecutive in each county in Florida. TEZs corresponding to areas outside of Florida are the size of an entire county. TEZs in areas within Florida are smaller than any individual county. Dummy zone ranges have been built into each county in Florida. These ranges are described in Table II-1. With so many dummy zones available, the model will be able to accommodate a significant amount of expansion should the SRESP decide at some point in the future to increase the level of detail for the TEZ system. Data were developed for three analysis years: 2006, 2010, and The model automatically references the correct data based on the analysis year selected by the user when the scenario is set up. All data are based off of mid-census estimates and future year projections based off of Census 2000 data. Census 2010 data were not available at the time that the evacuation model was developed. Attributes of the TEZ System The TEZ system is maintained as a feature class within the model s geodatabase. This feature class contains attribute data that the model uses to perform trip generation and zone aggregation. These attributes are defined in Appendix A. Methodology and Support Documentation Page II-5

14 Figure II-1: Map of SRESP Evacuation Model Traffic Evacuation Zones Methodology and Support Documentation Page II-6
15 Table II-1: County Summary of Dummy TEZ County Model County Code Region Model Region Code Active TEZ Range Dummy TEZ Range Number of Available Dummy TEZ Alachua 21 North Central Florida Baker 32 Northeast Florida Bay 56 West Florida , , Bradford 22 North Central Florida Brevard 15 East Central Florida Broward 39 South Florida Calhoun 1 Apalachee Charlotte 42 Southwest Florida , , Citrus 63 Withlacoochee Clay 33 Northeast Florida Collier 43 Southwest Florida Columbia 23 North Central Florida DeSoto 10 Central Florida Dixie 24 North Central Florida Duval 34 Northeast Florida Escambia 57 West Florida Flagler 35 Northeast Florida Franklin 2 Apalachee Gadsden 3 Apalachee Gilchrist 25 North Central Florida Glades 44 Southwest Florida Gulf 4 Apalachee Hamilton 26 North Central Florida Hardee 11 Central Florida Hendry 45 Southwest Florida Hernando 64 Withlacoochee Highlands 12 Central Florida Methodology and Support Documentation Page II-7
16 County Model County Code Region Model Region Code Active TEZ Range Dummy TEZ Range Number of Available Dummy TEZ Hillsborough 48 Tampa Bay Holmes 58 West Florida Indian River 52 Treasure Coast Jackson 5 Apalachee Jefferson 6 Apalachee Lafayette 27 North Central Florida Lake 16 East Central Florida Lee 46 Southwest Florida Leon 7 Apalachee Levy 65 Withlacoochee Liberty 8 Apalachee Madison 28 North Central Florida Manatee 49 Tampa Bay Marion 66 Withlacoochee Martin 53 Treasure Coast Miami Dade 40 South Florida Monroe, Key West 68 South Florida None 0 Monroe, Lower 69 South Florida None 0 Keys Monroe, 41 South Florida None 0 Mainland Monroe, Middle 70 South Florida None 0 Keys Monroe, Upper 71 South Florida None 0 Keys Nassau 36 Northeast Florida Okaloosa 59 West Florida Okeechobee 13 Central Florida Orange 17 East Central Florida Osceola 18 East Central Florida Methodology and Support Documentation Page II-8
17 County Model County Code Region Model Region Code Active TEZ Range Dummy TEZ Range Number of Available Dummy TEZ Palm Beach 54 Treasure Coast Pasco 50 Tampa Bay , , Pinellas 51 Tampa Bay Polk 14 Central Florida Putnam 37 Northeast Florida Santa Rosa 60 West Florida Sarasota 47 Southwest Florida None 0 Seminole 19 East Central Florida St Johns 38 Northeast Florida St Lucie 55 Treasure Coast , , Sumter 67 Withlacoochee Suwannee 29 North Central Florida Taylor 30 North Central Florida Union 31 North Central Florida Volusia 20 East Central Florida Wakulla 9 Apalachee Walton 61 West Florida Washington 62 West Florida Baldwin, AL 72 Out of State None 0 Camden, GA 74 Out of State None 0 Glynn, GA 75 Out of State None 0 Mobile, AL 73 Out of State None 0 All Other Counties 76 Out of State , , , , , Total Dummy TEZ: 7867 Methodology and Support Documentation Page II-9
18 Network Data This section outlines the method of developing the highway network database for the Statewide Regional Evacuation Study Program (SRESP): Evacuation Model. This section discusses the data used as sources to develop the highway network database, the changes made to the network to accommodate evacuation modeling, the designation of speeds and capacities, and specific attributes that will be used in the model network. A dataset covering the highway system for the State of Florida was required to ensure consistency in data definitions and coding conventions. A statewide database allows the evacuation model to maintain consistent highway representation from region to region. This improves the reasonableness of modeling results between regions by making sure that roadway characteristics throughout Florida are consistently defined and represented within the highway network. The network database is maintained as a feature class within the model s geodatabase. The attributes associated with the network database are described in Appendix A. The network contains data for year 2006, 2010, and 2015 conditions. In order to edit the network database, it is necessary to work with the network data in the Cube environment. Various datasets were used to develop this highway network database as follows: 1. Florida Statewide Model Network The 2005 base year statewide model was used as basis for developing the evacuation model highway network. The statewide model was obtained from the Florida Department of Transportation (FDOT) Systems Planning Central Office. This network was developed for the most recent version of the Florida Statewide Model under development as of the writing of this document. This network was developed using a variety of sources that include, but are not limited to: Previous version of the statewide model s network; Florida Turnpike s Statewide Model network; TeleAtlas database for Florida; and, Metropolitan Planning Organization (MPO) highway data. 2. Evacuation Routes Evacuation routes in each Regional Planning Council (RPC) areas were obtained from the RPCs themselves. The RPCs relied on their constituent counties to provide them with information on which roads were to be included as evacuation routes. These routes will be designated in the highway network dataset using a separate data field. 3. Florida Highway Data Software (FHD) The 2006 Florida Highway Data software was obtained from FDOT. This software is used to view and query data extracted from the Roadway Characteristics Inventory (RCI) which includes link number of lanes, facility types, speed limits, etc. This information was critical for updating the 2005 dataset to 2006 conditions. This was vital for accommodating the 2006 base year designated by the Statewide Regional Evacuation Study Program (SRESP). 4. FDOT Quality/Level of Service Handbook The 2002 FDOT Quality/Level of Service Manual (QLOS) and the 2007 LOS Issue Papers (2002 FDOT QLOS addendum) were Methodology and Support Documentation Page II-10
19 obtained from the FDOT Systems Planning website. The QLOS handbook and the LOS tables were used to establish roadway capacities for evacuation purposes. These capacities are used during the assignment step of the model in order to provide reasonable congestion conditions that will impact the evacuation traffic. 5. Microsoft and Google aerials and maps - were used to identify and clarify roadway alignments. Whenever questions concerning the existence of particular facilities, their characteristics, or their alignments aerials were referenced. Aerials provide clear information on existing roadway conditions. Depending on the segment being reviewed, it is often possible to determine the number of lanes on a particular segment and whether or not a particular segment is paved. Changes to the Statewide Network The highway network database that was used to create the foundation of the highway network data base for the evacuation model was developed by referencing a large variety of data sources to ensure the most complete and accurate data set possible. Figure II-2 shows an image of the evacuation model s highway network. Due to the primary purpose of that data base some modifications to the data were necessary in order to make the data usable for evacuation modeling purposes. Some of the characteristics of the original database that had to be addressed are listed below: 2005 Base Year The original database was coded for a 2005 base year. Since the SRESP base year is 2006 it was necessary to update the data to 2006 conditions; Geographic Extent The Statewide Model highway network came with roadway data for the entire continental United States. The network detail was progressively more detailed as the network approached Florida. Since it was not necessary to include so much network in the evacuation model, the database was trimmed down to retain on the network in Florida and the following states: Georgia, Alabama, Mississippi, South Carolina, North Carolina, and Tennessee. Travel Demand Forecasting The original database was designed with typical travel demand forecasting purposes in mind. The focus for the statewide model was inter-city travel primarily through rural areas that are not covered by an MPO model. This meant that a number of facilities that might be vital for evacuation modeling but are of negligible concern for normal trip making activities were not present in the network. This problem is more acute in rural coastal areas were low levels of localized traffic are beyond the scope of a statewide travel demand forecasting model. Additional facilities had to be added to the network to accommodate evacuation traffic behavior; Daily Trip Activity The original database was designed to represent a statewide highway network operating in a typical fashion over a 24-hour period. This means that attributes in the original database are optimized to function for a model responsible for yielding daily trip volumes. Many attributes from the original data set were removed and new ones were added specifically tailored for evacuation modeling purposes; Methodology and Support Documentation Page II-11
20 Evacuation Routes - The original statewide model highway network database included most of the evacuation network identified by the counties. The evacuation roadway networks that were provided by the RPCs were overlaid on the highway network database and checked for any missing links. Maps depicting the highway network and the evacuation routes were distributed to all RPCs for their review. Based on this review the missing evacuation routes were coded into the highway network database. The facility data attributes which define the characteristics of a specific roadway were determined based on the characteristics of neighboring facilities in the network and similar facilities throughout the database. Some examples of these changes to the highway network database are discussed below. Example: Magnolia Drive between SR 20 (Apalachee Parkway) and SR 61 (Monroe Street) in Tallahassee was not included in the existing statewide model. This road is included as an evacuation route by the Apalachee Regional Planning Council. A new approximately 2.0 mile two lane link was coded connecting Monroe Street and Apalachee Parkway. Appropriate area types and facility types were designated to this roadway Example: Manasota Key Road in Charlotte and Sarasota County connecting the beach front properties was not included in the existing statewide model. This road is designated as an evacuation route by Southwest Florida Regional Planning Council. A new approximately 8 mile 2-lane link was coded. Appropriate facility and area types were assigned. Example: Hudson Avenue connecting Little Road and SR 52 in Pasco County is currently a 2- lane facility and is not included in the existing statewide model. This road is designated as an evacuation route by Tampa Bay Regional Planning Council. An 8-mile two-lane roadway with appropriate facility and area type was included in the evacuation model; One-Way Links - Though potentially problematic in typical travel demand forecasting models, evacuation models using dynamic traffic assignment are far less forgiving of roads that are incorrectly designated with regard to being one-way facilities. Not only is the status of a particular segment (i.e. whether or not it is a one-way facility) crucial, it is just as important to ensure that the road is headed in the correct direction. The highway network database was extensively reviewed for the correct coding of one-way links. Downtown areas and dense network areas were checked for one-way link coding. Microsoft and Google maps and aerials were used to identify the one-way links. Example: North Armenia Avenue from Swann Avenue to Martin Luther King Road in Tampa is currently a one-way pair. In the existing statewide model this road is represented as a one-way northbound only link. This link was adjusted to a two way link and the facility type was modified accordingly; Number of Lanes - The 2006 FHD software was used to verify the highway network database number of lanes for the state roads, US highways, and major county roads. For other roads Microsoft and Google aerial maps were used. For most of the roadway links, the highway network database has the appropriate number of lanes. The number of lanes was adjusted where appropriate to reflect the 2006 conditions. Example: SR 90 (SW 7th and SW 8th Streets) from SR 9 (SW 27th Ave) to SR 5 (Brickell Methodology and Support Documentation Page II-12
21 Avenue) in Miami is a one-way pair and is coded as four lanes in the existing statewide model. The number of lanes were crosschecked with the 2006 FHD software and recoded as a six lane facility. Area Types and Facility Types - Along with the number of lanes, attributes describing the area type and facility type of a roadway segment are instrumental in identifying the appropriate speed and capacity to use for that link. Facility types identify the purpose of a particular segment and are loosely related to a roadway segment s functional classification. The facility types determine whether a given stretch of road is an expressway, an arterial, a collector, or some other more specialized type of facility such as a ramp or a highoccupancy-vehicle lane. Area types distinguish the surrounding land use for a roadway segment. Such land uses include central-business-districts, residential, and rural. The area type and facility type attributes for each roadway segment were verified for their consistency with existing conditions. The area types were consistent in the highway network database model. The facility type attributes were appropriate for most of the roadway links with a few expectations. The roadway attributes were modified appropriately when a facility type abruptly changed from one two-digit type to other (example: from a collector to an arterial); and, Other Changes to the Network - The network attributes were modified to the specific needs of evacuation modeling and reporting purposes. The evacuation routes designated by the RPC were flagged for reporting purposes. The County name attribute and the RPC number attributes were checked and modified accordingly. Capacities Network capacities for the evacuation model are based on facility type and area type. The network facility type and the area type classification were retained from the existing statewide model highway network database. FDOT s 2002 Quality/Level of Service (QLOS) generalized level of service volume tables and the 2007 LOS Issue Papers (2002 FDOT QLOS addendum) were used for estimating the link capacity for each combination of facility type and area type. The generalized level of service volume tables were generated from conceptual planning software which is based on the 2000 edition of the Highway Capacity Manual (HCM). The conceptual planning software uses three types of characteristics: roadway, traffic, and control (signalization) to calculate the LOS volumes for each roadway class. The roadway variables include area type, number of through lanes, roadway class, left turn lanes, median type, etc. The traffic variables include planning analysis hour factor (K), directional distribution factor (D), peak hour factor (PHF), etc. The control variable include signal spacing s, arrival type, cycle length, effective green ratio (g/c), etc. Using statewide default values for each of these roadway characteristics, the generalized LOS volume tables were developed from the conceptual planning software. Methodology and Support Documentation Page II-13
22 Figure II-2: Evacuation Model Network Database The peak hour volume represents the most critical period for traffic operations and has the highest capacity requirements. Many urban routes are filled to capacity during each peak hour, and variation is therefore severely constrained. The peak hour directional volumes at LOS E, closely represents the maximum volume (capacity) that can be accommodated through a given roadway. The directionality of a roadway is hard to establish and generally the peak direction reverses during the morning and evening peak. Therefore, Florida s 2002 Peak Hour Two-Way Directional Volumes table was used with a 50/50 directional distribution to assign roadway capacities for a given facility and area type. In some cases the Peak Hour Two-Way LOS tables do not show the maximum services volumes at the LOS E. For example, the four-lane Class I arterial service volumes are only shown from LOS A to LOS D, This indicates that the maximum volume thresholds (capacity) are reached at LOS D and these volumes represent the capacity of the roadway. Methodology and Support Documentation Page II-14
23 The capacities that are used in the SRESP evacuation model have been developed to allow for reasonable modeling of traffic flow under extreme conditions. Unlike typical travel demand models where the purpose of capacity is to represent average or typical operating conditions on a stretch of road, an evacuation model needs to represent the maximum possible conditions that a stretch of road can handle before the flow of traffic is disrupted. The capacity is a measure of how many vehicles can flow past a particular point over a fixed period of time. The SRESP evacuation model uses hourly lane capacities reflecting Level-of-Service E conditions from the Florida Department of Transportation (FDOT) Quality/Level-of-Service (Q/LOS) Handbook. Because the FDOT Q/LOS Handbook represents capacities under average operating conditions and in order to represent maximum possible utilization of the highway network under extreme traffic flow conditions where many travelers are attempting to simultaneously leave an area as quickly as possible, these capacities are increased by 20% for freeways and 10% for all other facilities. This assumes some utilization of paved shoulders as evacuees attempt to maximize all available capacity and optimization of signal green times. A lookup table was created with facility type, area type, number of lanes, and capacities. The capacity attribute in the network were automatically assigned for any given link with a specific facility type, area type and number of lanes during the network preparation process. Capacities for all facilities in the evacuation model were developed with the same methodology with the exception of U.S. 1 in Monroe County. Due to the unique nature of evacuation analysis in the Florida Keys and a specific history of policy and methodology concerning evacuation modeling in this area, capacities for U.S. 1 did not follow the standard methodology used elsewhere in the SRESP evacuation model. The capacities used for this portion of U.S. 1 are consistent with the capacities defined in a Florida Department of Transportation Memorandum dated June 18, A copy of this memorandum is available in Appendix B. Speeds Speeds are typically used in travel demand models to establish the travel times needed to get from one point in the network to another. The evacuation model needs to use speeds in a slightly more sophisticated manner in order to determine how many vehicles are passing through a given link at any moment. The existing highway network database link speeds were verified for their reasonableness and their suitability for evacuation modeling purpose. The existing database speed is tied to the facility and area type of the link and these are updated through a lookup table during the network processing stage. The speed values of the existing database are reasonable and therefore retained in for evacuation modeling. Roadway Attributes The roadway attributes contain the highway characteristics for each link in the highway network. The attributes used in the evacuation model are described in Appendix A. Tables II-2 and II-3 give the standard values for facility types and area types respectively. The model network database contains facility type, area type, and number of lanes data for three analysis years 2006, 2010, and When the model is running, the model will reference the correct data for the analysis year. If the value of FTYPE_06, FTYPE_10, or FTYPE_15 is set to 0 for a given highway link, then that highway link will be omitted from the Methodology and Support Documentation Page II-15
24 scenario for year 2006, 2010, or 2015 respectively. The existing Florida Statewide Urban Transportation Modeling Structure (FSUTMS) standards that define link speeds and capacities in the speed/capacity file based on combinations of area type, facility type, and number of lanes, were retained for the evacuation model. In order to provide for greater variation in link speeds and to better reflect capacity values recommended in the FDOT Level of Service (LOS) Manual, two-digit codes for area types and facility types were used. Capacities have been subsequently updated to be consistent with the latest version of the Highway Capacity Manual for Year Reverse Lanes Operation Additional changes were made in order to accommodate reverse lane operation plan activation in an evacuation scenario. Most of the facilities that are subject to a reverse lane operation scenario are coded as a pair of one-way links. In order to accommodate the correct behavior for the plan, additional attributes were added to the network in order to allow for the correct calculation of capacity in the reverse lane direction. The exact configuration of reverse lane facilities reflects the contra-flow plans established by the State. Currently, seven such plans are complete or in development. They are: I-10 From Jacksonville to I-75; I-75 From Tampa to Wildwood; SR 528 (Beachline Expressway) From Brevard County to Orlando; Florida Turnpike From Lantana to Ocoee; I-4 From Tampa to Kissimmee; I-75 (Alligator Alley) From Naples to Fort Lauderdale; and, I-75 (Alligator Alley) From Fort Lauderdale to Naples. Figure II-3 shows the location of each reverse lane operation plan in Florida. In consultation with staff from the Florida Turnpike Enterprise, WSA set the capacity increase due to reverse lane operations at 66%. During a reverse lane operation scenario, the capacity of the reverse lane facility is increased by an additional 66% in the direction of the evacuation while the capacity of the facility in the direction running against the evacuation is reduced to zero. This capacity adjustment is consistent with tests done by Florida Turnpike Enterprise staff when attempting to develop their own reverse lane operation plan for the Florida Turnpike. In accordance with the Florida Department of Transportation policies which state that reverse lane operations are only in effect during daylight hours, when a reverse lane operation scenario is activated in the evacuation model these capacity adjustments are only in effect for the first twelve hours of the evacuation event. This is consistent with the evacuation model s base assumption that the evacuation begins at daybreak of the first morning of the evacuation event. At the end of this twelve hour period, the capacities in the direction of the evacuation are reduced to their normal (non-reverse lane operation) levels while the capacities in the direction against the flow of the evacuation remain at zero. This helps to simulate the time it takes to convert the reverse lane flows back to normal two-way operations. The capacities in the direction against the flow of evacuation return to their normal levels at daybreak on the second morning of the evacuation event. Methodology and Support Documentation Page II-16
25 Table II-2: Two-Digit Facility Type Facility Description 1X - Freeways and Expressways 11 Urban Freeway Group 1 (cities of 500,000 or more) 12 Other Freeway (not in Group 1) 15 Collector / Distributor Freeway Lanes / Facilities 16 Controlled Access Expressways 17 Controlled Access Parkways 2X - Divided Arterials 21 Divided Arterial Unsignalized (55 mph) 22 Divided Arterial Unsignalized (45 mph) 23 Divided Arterial Class I 24 Divided Arterial Class II 25 Divided Arterial Class III / IV 3X - Undivided Arterials 31 Undivided Arterial Unsignalized with Turn Bays 32 Undivided Arterial Class I with Turn Bays 33 Undivided Arterial Class II with Turn Bays 34 Undivided Arterial Class III / IV with Turn Bays 35 Undivided Arterial Unsignalized without Turn Bays 36 Undivided Arterial Class I without Turn Bays 37 Undivided Arterial Class II without Turn Bays 38 Undivided Arterial Class III / IV without Turn Bays 4X Collectors 41 Major Local Divided Roadway 42 Major Local Undivided Roadway with Turn Bays 43 Major Local Undivided Roadway without Turn Bays 44 Other Local Divided Roadway 45 Other Local Undivided Roadway with Turn Bays 46 Other Local Divided Roadway without Turn Bays 47 Low Speed Local Collector 48 Very Low Speed Local Collector 49 Truck Restricted Facilities 5X - Centroid Connectors 51 Basic Centroid Connector 52 External Station Centroid Connector 53 Dummy Zone Centroid Connectors Methodology and Support Documentation Page II-17
26 Table II-2: Two-Digit Facility Type (continued) Facility Description 6X - One-Way Facilities 61 One-Way Facilities Unsignalized 62 One-Way Facilities Class I 63 One-Way Facilities Class II 64 One-Way Facilities Class III / IV 65 Frontage Road Unsignalized 66 Frontage Road Class I 67 Frontage Road Class II 68 Frontage Road Class III / IV 7X Ramps 71 Freeway On / Off Ramp 72 Freeway On / Off Loop Ramp 73 Other On / Off Ramp 74 Other On / Off Loop Ramp 75 Freeway-Freeway Ramp 8X - HOV Facilities 81 Freeway Group 1 HOV Lane (Barrier Separated) 82 Other Freeway HOV Lane (Barrier Separated) 83 Freeway Group 1 HOV Lane (Non-Barrier Separated) 84 Other Freeway HOV Lane (Non-Barrier Separated) 85 Non Freeway HOV Lane 86 AM&PM Peak HOV Ramp 87 AM Peak Only HOV Ramp 88 PM Peak Only HOV Ramp 89 All Day HOV Ramp 9X - Toll Facilities 91 Freeway Group 1 Toll Facility 92 Other Freeway Toll Facility 93 Expressway / Parkway Toll Facility 94 Divided Arterial Toll Facility 95 Undivided Arterial Toll Facility 98 Acceleration / Deceleration Lanes - Toll Facility 99 Toll Plaza - Toll Facility Source: Florida Model Task Force. See Appendix B or more detailed definitions of facility types. Methodology and Support Documentation Page II-18
27 Area Type 1X - Central Business Districts Table II-3: Two-Digit Area Type Description 11 Urbanized Area (over 500,000) Primary City Central Business District 12 Urbanized Area (under 500,000) Central Business District 13 Other Urbanized Area Central Business District and Small City Downtown 14 Non-Urbanized Area Small City Downtown 2X - Central Business District Fringe Areas 21 All CBD Fringe Areas 3X - Other Urbanized Areas 31 Developed Portions of Urbanized Areas 32 Undeveloped Portions of Urbanized Areas 33 Transitioning Areas/Urban Areas over 5,000 Population 34 Residential Beach Area 4X - Outlying Business Districts 41 Major Outlying Business Districts OBD 42 Other Outlying Business Districts OBD 43 Beach Outlying Business Districts OBD 5X - Rural Areas 51 Developed Rural Areas/Small Cities under 5,000 Population 52 Undeveloped Rural Areas Source: Florida Department Model Task Force. See Appendix C for more detailed definitions of area types. Methodology and Support Documentation Page II-19


28 Figure II-3: Reverse Lane Operations Plans in Florida Methodology and Support Documentation Page II-20
29 C. General Model Flow The sequence of processes which occur while a model is running can be thought of as a stream with successive inputs being introduced into a set of programs. These programs then generate outputs that are then used as inputs into other programs. This sequence continues until the model has finished executing. If this sequence can be thought of as a stream, then the manner in which data are processed can be thought of as the model flow. The model flow for the evacuation model is somewhat similar to the model flow for traditional Four-Step travel demand models. Of the four steps that are common to traditional models, only trip generation, trip distribution, and trip assignment are used. These steps are further subdivided into a total of eight modeling steps. This ensures that the proper sequence of events occurs within the model to develop accurate and useful forecasts of evacuation traffic throughout Florida. The following eight steps are represented graphically in the flowchart in Figure II-4: 1. Identify evacuation conditions and initialize model; 2. Determine number of evacuation trips; 3. Split trips into destination purposes; 4. Distribute trips throughout study area; 5. Factor trip tables into time segment matrices; 6. Adjust background traffic; 7. Load trips onto highway network; and, 8. Post process model outputs. Methodology and Support Documentation Page II-21
30 Figure II-4: General Model Flow Identify evacuation conditions and initialize model Determine number of evacuation trips. Split trips into destination purposes. Adjust background traffic. Factor trip tables into time segment matrices. Distribute trips throughout study area. Load trips onto highway network. Post process model outputs. Methodology and Support Documentation Page II-22
31 D. Initializing the Model At the beginning of the model flow, the model needs to determine the hazard conditions representing the particular scenario that is being analyzed. This allows the model to accurately identify the areas that are subject to evacuation and to determine the intensity of the evacuation event. This process then establishes the appropriate rates that are used to determine the number of evacuation trips that are generated. When the model run first begins, data pertaining to the characteristics of the evacuation scenario are fed into the model stream and read by the model. These data are input by the model user when the scenario is first prepared in the model user interface. Information such as storm strength, the counties that will be evacuated, and the type of scenario can all be input by the model user when the scenario is first created. These data can also be modified if a particular scenario needs to be altered for some reason. The user can input scenario parameters in one of three places: Control File a file named Control.DBF found in the scenario folder Catalog Keys Cube catalog keys specifically defined for this model Miscellaneous Files a small set of scenario specific input files Each of these is discussed in more detail below. With the exception of the turn penalties file, each of these parameters can be modified using the Transportation Interface for Modeling Evacuations (TIME) developed for this model. Should a modeler attempt to run the evacuation model without using TIME, it will be necessary to locate and edit these files separately. Storm Conditions The model framework is designed to handle storm intensity as described by five standard storm categories. While having some association with the Saffir-Simpson Hurricane Scale, these intensities are designed to make reference to the anticipated level of storm surge that could be expected from a particular storm. These categories have a direct relationship to the evacuation zones that would be ordered to evacuate: Level A Level B Level C Level D Level E As a requirement of this study, all regions were required to run evacuation scenarios that covered all five of these categories. For those counties that define fewer than five evacuation zones, a set of equivalencies were developed by the county and RPC. As a result, for each scenario the model correctly accounts for the threatened population. The conditions of a particular storm event have a direct impact on the amount of evacuation traffic that is ultimately loaded onto the model s highway network. As part of the Statewide Regional Evacuation Study Program (SRESP), an extensive survey of individual s stated and Methodology and Support Documentation Page II-23
32 observed preferences for evacuation behavior has been conducted. A set of rates have been derived from this survey that identifies the number of evacuation trips that are likely to be generated depending on the strength of a particular storm and the location where individual households are located throughout the affected areas. Scenario Type The evacuation model is designed to accommodate both a 100% response scenario and a planning assumptions scenario. These two types of scenarios are described below: 100% Response This type of scenario can be used to analyze evacuation scenarios for growth management purposes. This scenario type assumes 100 percent compliance with an order to evacuate in the areas ordered to evacuate for site-built homes and 100 percent compliance throughout the entire county for mobile and manufactured homes. There is also an assumption that evacuations emanating from areas not ordered to evacuate (shadow evacuations) will be in accordance with the planning assumptions developed by the SRESP. Planning Assumptions This type of scenario can be used to assist emergency management by providing an estimate of a clearance time that can be used when considering when to order an evacuation. This scenario type is based on the evacuation participation rates developed from the behavioral analysis portion of the SRESP and as such is considered to represent the most likely response to an impending storm by local residents of the impacted area. Planning assumption scenarios implicitly assume that some individuals who are ordered to evacuate will not and that some individuals who are not ordered to evacuate will. The specific rates used for each county s planning assumptions are documented in Volume 5 of the SRESP report. Control File (Control.DBF) The creation of a scenario can entail the selection of a number of specific parameters that may change not only from scenario to scenario, but also from county to county within the same scenario. In order to minimize the number of catalog keys used in the evacuation model and enhance the flexibility and comprehensiveness of scenario specific parameters, a control file was developed. This control file is structured in the form of a look-up table that allows the user to modify specific values for parameters by county between scenarios. This table can be interacted with by opening the file in any software that can read a DBF file, including Cube Base. The file is located in the scenario folder for each scenario. The attributes and a description of each follow below. This information is also included in the data dictionary found in Appendix A: CNTY County code number representing a county in Florida. The values are specifically assigned for the purposes of this model. The values are reported in Appendix C of this report. EVAC This attribute determines whether or not an evacuation has been issued in this county. Methodology and Support Documentation Page II-24
33 1 An evacuation order is in effect, the nature of which is determined by the other attributes in the control file. 0 No evacuation order is in effect. If this value is zero, evacuation trips will NOT originate from this county. PCT100RP This attribute determines whether or not to implement a 100% response scenario in the county % of individuals living in site-built homes in a zone corresponding to the evacuation event level will evacuate. 100% of individuals living in mobile homes regardless of where in the county they live will evacuate. Some percentage of individuals corresponding to the participation rates developed from the SRESP behavioral response survey living in site-built homes but outside of the affected evacuation zones will evacuate as shadow evacuation. 0 Some percentage of individuals whether in site-built or mobile homes, either within or outside of the evacuation zone will evacuate in a manner consistent with the participation rates developed from the SRESP behavioral response survey. STRMCAT This attribute identifies the intensity of the evacuation event. 1 Level A 2 Level B 3 Level C 4 Level D 5 Level E RESPONSE This attribute identifies which evacuation response curve will be applied to this county. 1 6 hour curve 2 9 hour curve 3 12 hour curve 4 18 hour curve 5 24 hour curve 6 36 hour curve NOGO This attribute is used to determine whether or not the county is a suitable destination for out-of-county evacuation trips. This attribute can be used to test scenarios where evacuation traffic is carefully directed away from some parts of the state toward other parts. This will affect only evacuation traffic originating in a county within the RPC boundary area. Evacuation traffic originating in other counties will proceed according to their natural distributions without regard to this NOGO attribute. 1 Out-of-county evacuation trips may NOT be destined for this county 0 Out-of-county evacuation trips may be destined for this county Methodology and Support Documentation Page II-25
34 TRINCL This attribute is used to determine whether or not to include tourist population in the evacuation. 1 Tourists will be included in the evacuation population 0 Tourists will not be included in the evacuation population TROVRD This attribute is used to override the default tourist occupancies in the TEZ database. 1 Override default tourist occupancy data 0 Use default zone specific tourist occupancy rates include in the TEZ database TRRTE This attribute represents the percent occupancy of tourist dwelling units to use as an override. Unlike the default data which may be zone specific, this value is countywide. The values range from 0 to 100 in increments of 5. PHASE Indicates when an evacuation should begin in a given county. 1 Evacuation begins in hour 1 2 Evacuation begins in hour 3 3 Evacuation begins in hour 6 4 Evacuation begins in hour 9 5 Evacuation begins in hour 12 6 Evacuation begins in hour 15 7 Evacuation begins in hour 18 8 Evacuation begins in hour 21 9 Evacuation begins in hour Evacuation begins in hour 27 Catalog Keys Cube models make use of a set of universal variables that can be designed by the user and coded into the model. These particular variables are known as catalog keys and give the user the ability to develop parameters that can change from scenario to scenario. Below are the names and description of each key: YEAR This key is a two digit number representing the final two digits in a four digit year designation. For example, 06 would represent the year This key corresponds to the year that the scenario is taking place and is used to select the correct TEZ and network data. There are three options: Methodology and Support Documentation Page II-26
35 EVACRGN This key is a number representing the region for which the model is being used. This is meant to reflect the regional version of each model and is not meant to be altered by the model user. The value is based on a numeric code assigned to each region for the purpose of this model. The values of these codes are identified in Table II-4. TEZ This key is a number identifying the maximum TEZ number in the model. This should remain static. EAZ This key is a number identifying the maximum Evacuation Assignment Zone (EAZ) number in the model. This value should not be changed by the user. The number of EAZ for each regional assignment model is listed in Table II-4. UNIVERSITY This key is a number representing the number of students in residence at university group quarters according to which term is in session. This feature is not fully functional in the prototype but will be in the production version of the model. There are three values to this key: 2 Fall/Spring Session (100% in residence) 1 Summer Session (50% in residence) 0 Out of Session (0% in residence) SFOLDER This key is a character string describing a file path for a folder in which scenario specific inputs and outputs are located for any given scenario. GDB This is the name of a geodatabase containing scenario specific inputs and found in the folder described in the SFOLDER path. GENREP This indicates whether the model should run all the way through assignment or only through trip generation. 0 Run full model 1 Run trip generation only ANIMATE Indicates whether or not to create the packet log file so that packet animations can be created. If packet log files are created, they will be stored in the SRESP_EM\Base folder of the hard drive where the model is installed. All packet log files are identically named. This will cause new packet log files to overwrite pre-existing packet log files. The file is named EVACLOG.LOG. If the user wishes to save these files for multiple scenarios, the user must copy the existing EVACLOG.LOG file and save it elsewhere on their hard drive. Due to the size of the packet log file, it is recommended that this file be created only for smaller scenarios. Attempting to create a packet log file for a large scenario may result in the model crashing at the very end. 30 Create packet log file 99 Do not create packet log files. Methodology and Support Documentation Page II-27
36 Table II-4: EVACRGN and EAZ Values Region EVACRGN EAZ Apalachee Central East Central North Central Northeast South Southwest Tampa Bay Treasure Coast West Withlacoochee Miscellaneous Parameter Inputs The following files contain additional parameters that can be used to set up a scenario. Both of these files can be found in the scenario folder. CNTRFLW.DBF This file allows the user to determine which reverse lane operations plans are in effect for a given scenario. The model assumes that all reverse lane operations are only in effect for the first 12 hours of the evacuation event. This file is described in Appendix A. TURNS.PEN This is a standard CUBE turn penalty file. It allows the user to either penalize or prohibit specific movements in the model network. The format of this file is described in detail in the CUBE User s document. Methodology and Support Documentation Page II-28
37 E. Trip Generation - Number of Evacuating Trips After the model has finished initializing it will begin to calculate the number of evacuation trips that are generated. Estimating an appropriate number of trips is essential to ensuring that the behavior expressed on the highway network during trip assignment is reflective of likely conditions during a real world evacuation event. Use of Rates The planning assumptions developed by the behavioral analysis are stored in a master rates file that is referenced by the model in order to determine the number of evacuation trips that a particular scenario can be expected to generate. This is particularly true of the Planning Assumptions scenarios since these will base their trip making characteristics on the results of the planning assumptions. The 100% Response scenarios automatically override the planning assumption rates with values of 100 percent to reflect universal compliance with an order to evacuate for all mobile homes in the county and all site built homes in the evacuation zone. The exact rates that will be applied will be determined by the scenario type, storm category, and the counties that will be ordered to evacuate. These conditions are set by the model user in the model user interface when a scenario is first created and is processed by the model during the initialization step of the model. All of the rates used in the model are stored in the TripRatesMaster.dbf. Production Ends The evacuation model conducts a trip generation based on a set of participation rates developed by the SRESP. These participation rates were developed from an analysis of behavioral data collected as part of a survey conducted for this study. The rates are applied to the small area data in order to determine how many trips are evacuating. These calculations are performed at the TEZ level. The process is as follows: 1. Total dwelling units are multiplied by the percent occupancy to establish a number of occupied dwelling units. 2. The number of occupied dwelling units is multiplied by the percent of households in each evacuation zone to establish a number of occupied dwelling units in each evacuation zone. 3. For each evacuation zone, the number of occupied dwelling units in that evacuation zone is multiplied by the evacuation participation rate corresponding to the intensity of the event to establish the number of households that actually evacuate. 4. The number of evacuating households is multiplied by the auto ownership rate to establish the number of available vehicles for the evacuation. Methodology and Support Documentation Page II-29
38 5. The number of available vehicles is multiplied by the vehicle use rate in order to establish what percentage of available vehicles is actually used during an evacuation. This is the total number of evacuation vehicle trips. These total evacuation trips are further split into four purposes: Friends & Family, Public Shelter, Hotel/Motel, and Other. Each of these purposes is further divided based on whether the trip is destined to remain in-county or go out-of-county. Attraction Ends The other end of an evacuation trip, the attraction end, is calculated using a much more simplified methodology. Both public shelter and hotel/motel trips have clearly specified numbers of available destinations. Public shelters have clearly defined capacities. Since the trips in the model are being generated in terms of vehicle trips, a factor is used to convert the shelter capacities into an equivalent number of vehicles that could be expected to arrive at a specific shelter. A review of the behavioral data indicates average auto occupancy of 1.85 persons per vehicle headed toward a shelter: Maximum vehicles to shelter = Open shelter capacity / 1.85 persons per vehicle Hotels and motels both have a clearly defined set of available rooms for housing guests. In terms of the evacuation model each one of these rooms will be designated as a viable destination of an evacuation trip sheltering in a hotel or motel so long as the hotel or motel is not in an area ordered to evacuate. Trips destined to shelter with friends and family or in other unspecified destinations require a somewhat special treatment. Since it is not possible to determine the exact location of each friend or family member that an evacuating household may choose to shelter with, the model will need to assume that there is a relatively even distribution of attraction ends among friends and family. Therefore, every household in the model will be designated as a single attraction for these trips so long as the home is not in an area ordered to evacuate. Trips destined for other destinations not specified by the behavioral analysis include those evacuees sheltering in churches, work places, lodges, and other locations not recognized as a public shelter by the SRESP. Since it will not be possible to determine what exactly these locations are a similar process to that used for calculating friends and family attractions is employed. Every household in the model will generate one attraction for those trips headed to other shelter. This ensures that these trips are evenly distributed around the area with some clumping occurring in highly residential areas. Since churches are the typical other shelter that individuals evacuate to and since churches tend to locate in areas with high residential populations this results in reasonable destination locations for these evacuees. Trip attractions are balanced at a regional level based on distribution percentages derived from the behavioral survey. These percentages identify what percent of out-of-county trips originating from each region will travel to each other region and out-of-state. Since one Methodology and Support Documentation Page II-30
39 attraction is created for each dwelling unit and open shelter space in the model, this results in an extremely high number of attractions. If attractions were then balanced normally throughout the model, zones with very large numbers of attractions would dominate the model s trip distribution. While not necessarily a problem in and of itself, a disparity of zone scale throughout the model particularly in regard to zones outside of Florida would result in too many trips leaving Florida. By balancing the trips on a regional level, trips can be easier spread to zones with similar scales of data. Within a region, attractions are still balanced similar to how attractions are balanced in standard travel demand models. The regional distribution factors derived from the behavioral survey are shown in Table II-5. Within a region, attractions are still balanced similar to how attractions are balanced in standard travel demand models. This also applies to in-county evacuation trips. Methodology and Support Documentation Page II-31
40 Table II-5: Percentage of Out-of-County Trips Travelling between Regions during an Evacuation From: To: Apalachee Central East Central North Central Northeast South Southwest Tampa Treasure West Withlacoochee Out of Region Florida Florida Florida Florida Florida Florida Bay Coast Florida State Apalachee 31.19% 0.13% 1.10% 2.28% 2.11% 0.00% 0.13% 0.72% 0.30% 3.50% 0.76% 57.80% Central Florida 5.91% 9.82% 13.00% 4.41% 4.69% 0.00% 4.19% 5.91% 5.41% 0.73% 1.73% 44.20% East Central Florida 2.53% 1.71% 27.11% 5.41% 5.88% 1.53% 2.65% 6.70% 0.76% 1.41% 3.12% 41.20% North Central Florida 5.23% 0.73% 3.63% 15.17% 6.26% 0.31% 0.33% 3.09% 0.23% 1.26% 1.99% 61.80% Northeast Florida 3.72% 0.75% 4.21% 6.59% 10.33% 0.59% 0.59% 1.79% 0.16% 1.89% 1.99% 67.40% South Florida 1.99% 3.37% 20.91% 2.07% 3.37% 24.51% 5.75% 2.07% 8.96% 0.54% 3.06% 23.40% Southwest Florida 1.39% 5.23% 15.94% 3.91% 3.28% 4.60% 11.03% 8.38% 3.15% 0.76% 5.36% 37.00% Tampa Bay 3.21% 3.73% 14.12% 2.81% 4.48% 2.18% 1.32% 15.67% 2.01% 0.52% 7.35% 42.60% Treasure Coast 2.77% 1.52% 22.84% 3.04% 4.36% 4.49% 3.96% 9.37% 11.48% 0.20% 1.98% 34.00% West Florida 6.25% 0.24% 2.10% 0.90% 3.49% 0.42% 0.07% 0.31% 0.31% 8.68% 0.80% 76.40% Withlacoochee 2.39% 1.66% 12.35% 7.37% 3.27% 0.99% 0.67% 6.54% 0.47% 1.25% 15.00% 48.00% Methodology and Support Documentation Page II-32
41 Splitting Trips into Destination Purposes Once the number of evacuation trips has been determined it is necessary to divide the trips into various trip purposes. These purposes are based on the type of destination that an evacuee is headed to and the relative location of that destination. There are four types of destinations and two relative locations for a total of eight trip purposes. The eight purposes are listed below: Friends & Family In County Public Shelter In County Hotel/Motel In County Other In County Friends & Family Out of County Public Shelter Out of County Hotel/Motel Out of County Other Out of County Determining Trip Purposes The same behavioral analysis that establishes the evacuation and vehicle use rates used to determine the number of evacuation trips that are being generated by the model is also a source of data for determining the various destinations that these evacuation trips are headed to. Similar to the other two rates just mentioned, the planning assumptions developed for the SRESP also include rates that identify what percentage of the evacuees are destined for Friends & Family, Public Shelter, Hotel/Motel, and Other. The assumptions also provide rates on how many trips remain in the evacuating county and how many leave the county. These rates are also stored in the TripRatesMaster.dbf file. F. Trip Distribution After the model has determined how many evacuation trips there will be in a given scenario, split those trips into purposes, and balanced the trip ends for those purposes, the model then performs a trip distribution. The trip distribution step in the model connects each production end to a unique attraction end. The end result is a trip table containing origins and destinations for each trip in the model. Typically, origin zones are referred to by the letter I and destination zones are referred to by the letter J. An Origin-Destination matrix, also known as an OD matrix, is one of the principal inputs into trip assignment. This matrix tells the model where each trip is coming from and to where it is going. Overall Distribution Trips are distributed using a standard gravity model. Since there are currently insufficient data to accurately correlate specific evacuation origins to specific evacuation destinations, the model must make use of generalized assumptions for trip distribution. The data from the behavioral survey only captured destination data in the roughest terms. Respondents were only asked to identify destinations if they were evacuating out-of-county. If they responded positively, the survey only asked the respondents which city they evacuated to and nothing more specific. Methodology and Support Documentation Page II-33
42 Early attempts during model development to develop trip length frequency distribution curves resulted in highly normalized curves that tended to distribute higher percentages of evacuees to under populated areas of the state. In response to this, the model uses a flat friction factor for the gravity model and instead relies heavily on regional attraction balancing during trip generation to guide the trip distribution. In order to accomplish this, a trip distribution model is run for each region during the model run. This ensures that trips produced for each county are directed to their appropriate destinations as dictated by the distribution percentages derived from the behavioral response survey. In this way, trips are distributed among the various regions according to survey data and are distributed within regions according to where the highest population levels are. While this process is not particularly dynamic, the relatively short horizons that the model is designed to address along with the expected frequency of future data collection efforts means that this method is ideally suited for distributing trips in a logical manner. Figure II-5 shows the trip length frequency distribution of out-of-county friends and family trips leaving the Tampa Bay during an evacuation. Figure II-6 shows the total distances traveled by friends and family trips leaving the Tampa Bay region during an evacuation. Skims Unlike conventional models where networks are skimmed based on travel times, it is assumed that during an evacuation event, all sense of travel time is obscured by the intense congestion conditions that will be experienced by the evacuee. Consequently, the networks are skimmed based on distance. Distance based skims are more likely to provide an accurate consideration of choice of destination as travelers are more likely to base their trips on proximity to destination. Once the skims have been developed they are split into two separate files. One file is for incounty evacuations and only retains meaningful skims for zone pairs representing intra-county movements. The other file is for out-of-county evacuations and only retains meaningful skims for zone pairs representing inter-county movements. In each file, the undesirable movements are coded with a specific value by the model in order to exclude those movements from consideration in the gravity model. Matrix Manipulation Because the trip distribution model loops on itself once for each region, the model will produce 12 evacuation trip tables (the twelfth region corresponds to areas outside of Florida). The model will then combine these trip tables into a single trip table. This trip table represents all evacuation trips in the model regardless of origin and destination. Once the trip tables are combined, the model will need to compress the matrices in order to make them suitable for trip assignment. It is at this point that the model aggregates zone pairs from the TEZ scale to the EAZ scale mentioned previously in this document under the section on zone data. The result is that a 17,328 x 17,328 matrix is compressed into a much smaller matrix ranging from approximately 200 x 200 to 1,000 x 1,000 depending on the region. This creates a data set that the computer will be much better able to process during trip assignment. Methodology and Support Documentation Page II-34
43 Two additional matrix compressions are performed. One shows county to county flows. The other shows region to region flows. Neither of these matrices is used during the modeling process, but the data are made available for analysis purposes. The region to region flows are ultimately based on the distribution percentages derived from the behavioral survey. As such, they should have a direct correlation to observed behavior as reported by the behavioral response survey conducted by the SRESP. The county to county flows are based on population levels per TEZ within each region. Methodology and Support Documentation Page II-35
44 Figure II-5: Out-of-County Friends and Family Trip Length Frequency Distribution for Tampa Bay 3.0% Percent of Out of County Evacuation Trips 2.5% 2.0% 1.5% 1.0% 0.5% Out of County 0.0% Distance in Miles Methodology and Support Documentation Page II-36
45 Figure II-6: Total Distance Traveled of Evacuating Tampa Bay Friends and Family Trips 100% Percent of Trips Seeking Shelter with Friends and Families 90% 80% 70% 60% 50% 40% 30% 20% 10% 0% Total F&F Distance in Miles Methodology and Support Documentation Page II-37
46 Rounding After the matrices have been combined and compressed, the model proceeds to round the trip data in the matrix file. The reason for this is that Cube AVENUE has to generate a minimum of one packet for each matrix cell that contains at least some trip data, even if these data amount to less than one trip. This is possible since Cube uses floating point math to perform its calculations. Decimal values are common. Since this would result in a number of extremely small trip values being treated as complete trips, the numbers are rounded to the nearest whole number. This reduces the data burden on the computer and allows the assignment to function more efficiently. This also allows the model to simulate individual trips during the assignment at a one vehicle to one packet ratio, a ratio ideally suited for the purposes of evacuation modeling, and avoids the illogical phenomenon of tracking fractional trips through the network (such as a packet representing 0.25 trips). Time Segmentation The final step of the model prior to initiating the trip assignment sequence is to segment the trip table into discreet time periods. Both the trip generation and trip distribution steps of the model develop data at an event-wide scale. These trips need to be segmented according to when during the event they begin travelling on the road. To accomplish this, a set of factors representing various response curves are used by the model. The time segments are broken down into half hour intervals. Since the model covers a period of 96 hours, this comes out to a total of 192 segments. The longest curve included in the model represents 36 hours. Therefore, at most, trips will be populated for 72 separate matrices corresponding to 72 half-hour time segments. Phasing The evacuation model has been developed to accommodate inter-county phased evacuation in order to test scenarios in which different counties are ordered to evacuate at different times. If no phased evacuation is desired, the model treats all counties as if they are evacuating in Phase 1 and does not create any other phases. If a phased evacuation is desired, the model user can indicate so by designating a phase number for each county in the model user interface. There are ten available phase numbers so that each county can be included in its own phase. These phases are described in Table II-6. The model executes phasing by taking the selected evacuation response curve used for a particular scenario and off-setting it by an amount of time selected by the model user. For example, if the model user wants to test a two tiered evacuation in South Florida, the user may decide that Monroe County (the Florida Keys) should be ordered to evacuate 24 hours before Miami-Dade County. The model user would then place the Florida Keys in Phase 1 and Miami-Dade County in Phase 9. This would result in Miami-Dade County evacuation trips not beginning until 24 hours after the Florida Keys have begun their evacuation. Methodology and Support Documentation Page II-38
47 Table II-6: Available Phases Code Description 1 Evacuation begins in hour 1 2 Evacuation begins in hour 3 3 Evacuation begins in hour 6 4 Evacuation begins in hour 9 5 Evacuation begins in hour 12 6 Evacuation begins in hour 15 7 Evacuation begins in hour 18 8 Evacuation begins in hour 21 9 Evacuation begins in hour Evacuation begins in hour 27 Response Curves As part of the behavioral analysis a set of evacuation response curves have been developed. These curves represent the percentage of the evacuation trips that have begun their evacuation over time. These curves are used to load evacuation trips onto the highway network over time so that the compounding effects of a congested evacuation may be more clearly analyzed. Based on a review of the available response curves and discussions with the SRESP, the following two assumptions are held to be true for every scenario: 1. All evacuation scenarios begin the modeling period at a point in time consistent with when an order to evacuate has been given; and, 2. Ten percent of all evacuation trips have vacated the area prior to when an order to evacuate has been given and are already considered to have cleared the network. (For the 36 hour response curve, this is assumed to be only five percent due to the protracted nature of the response). These two assumptions are further supported by the following four assumptions that will need to be held true due to current limitations in the data and technology for conducting evacuation models: 1. Evacuation orders are issued at 7:00 AM; 2. Evacuation orders are issued on a Monday morning; 3. Evacuations occur during a standard work 4. Trips evacuating prior to an evacuation order left the previous evening; 5. All evacuation trips begin from the evacuee s home; and, 6. The response curves take into account all preparation time leading up to an evacuation such as the time it takes to: a. Gather together family members; b. Collect personal belongings; and, c. And secure the homestead. The model user can select from six reasonable response curves. These curves are shown in Figure II-7 and are listed below: Methodology and Support Documentation Page II-39
48 1. 6 hour response 2. 9 hour response hour response hour response hour response hour response Once the time segmentation is complete, the model begins the process of making adjustments to the highway network related to background traffic and start the highway assignment. Methodology and Support Documentation Page II-40
49 Figure II-7: SRESP Evacuation Model Response Curves Accumulated Response Percent Response HR 9HR 12HR 18HR 24HR 36HR Hours Methodology and Support Documentation Page II-41
50 G. Highway Assignment The purpose of highway assignment is primarily to determine how much traffic is traveling along a particular stretch of road during the analysis periods. The traffic that has been assigned to the model s highway network is often referred to as the model volume of a given highway link. Traditional four step models are typically designed to provide these model volumes for a 24 hour period. Such volumes are known as daily assignments. Many models have more recently begun to employ a technique known as time-of-day assignment. Time-of-day models divide a 24 hour day into smaller periods typically corresponding to the morning and evening peak periods (a three hour period encompassing the morning or evening rush hours) and an off-peak period. The time-of-day model may be further disaggregated to distinguish between a midday off-peak period (from the morning peak period to the evening peak period) and an overnight period (from the evening peak period to the morning peak period). These assignments are known as time-of-day assignments. Time-of-day assignments for each of the modeled time periods may be aggregated to provide a daily assignment volume. Assignment volumes can be analyzed to provide useful information on forecasted travel patterns and areas of likely congestion. Along with volumes, other statistics that are typically derived from highway assignments include vehicle-miles-traveled, vehicle-hours-traveled, congested travel times and speeds, and level-of-service. The Unique Character of an Evacuation Traditional four-step models are designed to provide useful information to transportation planners. As such, they tend to represent travel behavior on a typical day. These models typically assume that a certain number of people get up in the morning and go to work each day. They assume that people will go shopping, eat at restaurants, and visit with friends each day. They assume that children will go to school each day. Evacuation events significantly deviate from this typical behavior. During an evacuation event, it is assumed that the ordinary trip making behavior of the residents in the modeled area is disrupted. Instead of going to work or shopping at the mall, individuals spend their time preparing to either weather the storm at home or evacuate. Trips that are made and are not for the purposes of an evacuation may generally be shorter trips closer to home. The most significant kind of trip that is made during an evacuation event is the evacuation trip itself. There are several distinct characteristics of evacuation trips that differentiate an evacuation model from a traditional four-step model: 1. Most evacuation trips begin within a very well defined window of opportunity as opposed to occurring naturally throughout the day. This window typically begins when an order to evacuate has been given; 2. Origins for evacuation trips are highly concentrated corresponding to areas threatened by storm surge flooding; 3. Destinations for evacuation trips are spread throughout the region, State, and beyond; Methodology and Support Documentation Page II-42
51 4. Items 2 and 3 above result in a relatively unidirectional flow of trips away from the threatened area and toward areas of safety; 5. A larger proportion of evacuation trips will exit the county or region than is typically assumed in a traditional four-step model; and, 6. Roadway segments that allow for inter-county or inter-regional travel are relatively few. As a result of the aforementioned items, an evacuation event can be stated as a phenomenon where a large number of vehicles coming from the same place are leaving at the same time, going in the same direction, and taking the same roads. This increases the likelihood of experiencing severe congestion along the highway system. This is particularly true at critical points along the network such as bridges and freeway interchanges. Furthermore, the most valuable statistic pertaining to an evacuation is the amount of time it takes evacuees to get to a place where they are no longer in danger. Since the effects of congestion on the travel times of evacuees fluctuates as the amount of traffic increases and decreases, it becomes vital to be able to measure the progress of an evacuation over time. Capacity during Assignment The key focus when conducting a transportation analysis of an evacuation event is the evacuation traffic itself. A lot of effort is spent developing an accurate assessment of the nature of this evacuation traffic. Rigorous surveys are conducted to identify how the population of a given area will react under certain conditions. These data are further analyzed in order to determine the likelihood of evacuees traveling to specific destinations. Locations of population are compared against intensive studies of coastal topography to determine who lives in an area likely to be inundated during a storm event. All of this information is used to determine who would be evacuating in a given scenario, how long it takes for them to begin their evacuation, where they are coming from, and where they are going to go. This is the demand element of analyzing an evacuation event. Once the evacuation demand has been established, it is then necessary to determine the length of time that it takes for the evacuees to reach safety. This measure is often identified as a clearance time. The clearance time is the critical piece of information sought after an evacuation transportation analysis. The clearance time is a function of supply and demand. The demand element has just been described in the preceding paragraph. The supply element is the ability of the transportation system to handle a certain amount of traffic. This is known as network capacity. The higher the network capacity, the more traffic a transportation system can handle. The more traffic a transportation system can handle, the faster that traffic will move through the system. The faster that traffic moves through the system, the sooner the evacuees will reach safety. This can be summarized as follows: as supply increases and demand decreases the clearance times get shorter. Conversely, as supply decreases and demand increases the clearance times get longer. This is depicted below in Figure II-8. Methodology and Support Documentation Page II-43
52 Figure II-8: Clearance Time Curve Clearance Time Curve Demand Supply Typically, supply is determined by the nature of the transportation system. A transportation system is made up of all facilities used to move trips through an area. This can include not only roads, but also rail lines, canals, airways, etc. The SRESP evacuation model is only looking at the road system (also known as a highway network). The capacity of a road system is a function of the quantity and quality of the lane miles in the system. Each segment of road may be classified according to particular characteristics such as the designed purpose of the road, the type of land-use surrounding the segment, the presence of traffic signals, and so forth. These characteristics are typically represented by a set of network attributes used in travel demand models in the State of Florida such as facility type and area type. In general, roadway capacity is static in any particular scenario. When modeling travel demand for typical transportation planning purposes, roadway capacities are only altered in order to measure the impacts of a shift in supply to the forecast traffic. For example, lane widening, road closures, new road construction, and new freeway interchanges can all have dramatic impacts on traffic and are typically the focus of modeling transportation alternatives. Therefore, an analyst could determine what the relative impacts are for a region whether a road is widened or not. Such analyses typically look at planning horizons measured in decades and may consider projects that are completely hypothetical. Since transportation analyses for evacuation events are conducted with much more immediate horizons in mind and because these analyses are concerned with evacuation behavior on existing system conditions, the roadway capacity due to infrastructure is considered to be fundamentally static. There is, however, another factor that impacts the capacity of a roadway system. This other Methodology and Support Documentation Page II-44
53 factor is the cumulative effects of traffic consuming capacity as it travels along the highway network. The more traffic that enters the network, the less capacity there is available for new traffic to use. Eventually, enough capacity could be consumed that it would restrict the ability of traffic to flow through the network. It is this factor affecting the roadway capacity that an analysis of evacuation traffic is most concerned with. Background Traffic The traffic that consumes the roadway capacity of a transportation system during an evacuation can be divided into two groups. The first group is the evacuation traffic itself. Once the evacuation demand is determined, this information is converted into a number of vehicles evacuating over time. These evacuation trips are then placed on a representation of the highway network by a model. The model determines the speed at which these trips can move and proceeds to move the evacuation trips accordingly. The result is a set of clearance times. The process by which evacuation demand is developed and modeled for the purposes of this study are detailed in the other working papers developed as a part of this series. The second group of traffic is known as background traffic. Background traffic, as its name implies, is not the primary focus of an evacuation transportation analysis and is accounted for primarily to impede the movement of evacuation trips through the network. These trips represent individuals going about their daily business mostly unconcerned with the evacuation event. For the most part, background traffic represents trips that are relatively insensitive to an order to evacuate and are thus said to be occurring in the background. Even though background traffic is relatively insensitive to evacuation orders, it is important to account for background traffic since it can have a dramatic impact on available roadway capacity. This in turn can severely affect evacuation clearance times. One method that could be used to model background traffic would be to develop a separate set of trip tables that would reflect the background traffic trips. These trip tables would be loaded onto the network simultaneously with the evacuation traffic. While many individuals would consider this method ideal, there are significant obstacles that prohibit the implementation of this particular method, as identified below. 1. Reasonableness of Trip Tables: In order for this method to be effective, a set of reasonable trip tables would have to be generated. This would mean calculating typical daily travel demand throughout Florida. In theory, this could be accomplished using the Florida Statewide Model (FLSWM). Early decisions made in this study by the SRESP study group resulted in preferring demographic geography used by Florida s Regional Planning Councils (RPCs) to the FLSWM zone system. This created a significant disassociation of the evacuation model data from the FLSWM data. Furthermore, for the purposes of the evacuation model, it was necessary to disaggregate the zone data as much as was possible in order to be accurate in identifying threatened population. This resulted in making any association between the FLSWM trip tables and the evacuation model rather speculative. 2. Volume of trips: The sheer volume of trips that would have to be modeled would be enormous. The most intense evacuation scenario tested on the evacuation model during development considered a level E (the most severe) evacuation event with a 100% Methodology and Support Documentation Page II-45
54 participation rate for individuals in Hillsborough, Manatee, Pasco, and Pinellas Counties. The model estimated more than three quarters of a million evacuation trips for the event. Even though the amount of background traffic could be factored down in counties where an evacuation order was given, one would have to assume that travel behavior was more or less business as usual in non-evacuating counties. The FLSWM model estimates roughly 34.3 million automobile trips daily for year 2005 conditions for all of Florida. Depending on the region being modeled, very large portions of these 34.3 million trips would have to be modeled explicitly. This would depend on the geographic scope of the model for a given region. Furthermore, the evacuation model covers a 96 hour period. In practice, this could result with models attempting to use dynamic traffic assignment (DTA) to simulate tens of millions of trips. 3. Geographic scope: It is the intention of this analysis to be able to assess the impacts of evacuation traffic at an interregional level. As such, the evacuation model will need to be able to conduct DTA over extremely large geographic regions. The largest modeling area used in the evacuation model extends from Key West to St. Augustine and from Clearwater to Daytona. This encompasses three of the state s most traffic intensive areas: Tampa Bay, South Florida, and the greater Orlando area. Models like this could easily have over a thousand zones and close to 100K links. While numbers such as these have been typical for static metropolitan travel demand models for quite some time now, this pushes the limit of what is possible with DTA in a desktop computing environment. One of the stated objectives in developing the evacuation model was to create a tool that could be housed and executed at the RPCs with minimal additional expense. 4. Computing limitations: The model test that was mentioned above in item 2 ultimately took 48 hours to run. Initial tests could not even be completed given limitations inherent in the software and hardware at the time the tests were performed. Since then, the software developer has been highly responsive in upgrading their product. The model is now able to handle the conditions mentioned in item two. Though the software can now handle these conditions, explicitly modeling background traffic could multiply the amount of data that the model would have to process by more than a factor of 10. This would far exceed the enhanced capabilities of the software. Furthermore, this intense data situation begins to confront serious hardware and software limitations found at the desktop environment. While the computer industry as a whole is making significant progress that may render these concerns moot in the next couple of years, for the time being, they remain prohibitive obstacles in the way of explicitly modeling background traffic. In order to do so, the model would have to be severely restricted in scope so as to only account for one to three counties at a time at most. This has repeatedly been pointed out throughout the study by virtually all stakeholders as an inadequately small scale over which to conduct a transportation analysis of an evacuation event. It is for these reasons that background traffic could not be modeled explicitly. Though accounting for background traffic poses many technical challenges, the need to reflect the impact of background traffic is too vital to disregard the phenomenon of background traffic altogether. Another method that could provide a suitable representation of the impacts of background traffic had to be developed. Methodology and Support Documentation Page II-46
55 Methodology used to Account for Background Traffic There are two dynamics at work when evacuation traffic and background traffic interact with one another. The first is the effect of background traffic displacing evacuation traffic as background traffic attempts to use the same roads as the evacuation traffic. The second is the effect of evacuation traffic displacing background traffic. As vehicles move along the network and try to get onto certain roads they leave less room for other vehicles to use those same roads. As background traffic builds up there is less room for evacuation traffic to move, and vice versa. While the effect that evacuation traffic has on background traffic may be of some interest to those who are concerned with disruptions in daily trip making behavior during an evacuation event, for the purposes of this study we are much more interested in the effect that background traffic has on evacuation clearance times. The effect that background traffic has on evacuation traffic can be stated in terms of available capacity. The more background traffic there is on a segment of road, the less capacity is available for evacuation traffic to use. Following this logic, it becomes apparent that by causing the available capacity to fluctuate throughout the evacuation event, one is able to sufficiently account for the impact of background traffic. Therefore, the evacuation model uses a technique to fluctuate available network capacities throughout the evacuation event to represent the greater or lesser presence of background traffic consistent with observed daily behavior. Background Traffic Curves In order to properly represent background traffic, it was necessary to have an understanding of how traffic generally behaves over a 24 hour period. To accomplish this, data from the Florida Traffic Information DVD available from the Florida Department of Transportation was used. A sample of traffic count locations was taken from throughout the state with the intention of establishing suitable cross sections of hourly traffic behavior for various functional classes. Once these data were collected, sets of average peaking characteristics were developed for each functional class. These peaking characteristics represent how traffic builds up and then dissipates over time on a particular segment of road relative to the peak volume experienced by that segment of road. These are shown in Figure II-9, where the horizontal axis depicts the hour of the day and the vertical axis depicts the percentage of daily traffic. After these peaking characteristics were developed they were used to create curves that reflected the amount of capacity available on a given road segment assuming that peak volume was a certain percentage of available capacity. For example, a curve would demonstrate how much capacity was available throughout the day if peak volume represented 100 percent of capacity. This curve can be shown in Figure II-10, where the horizontal axis shows the hour of the day and the vertical axis shows the percentage of available capacity. As illustrated between the two figures, there is an inverse relationship between the chart shown in Figure II-9 and the chart in Figure II-10. Under the 100 percent assumption for background traffic, the hours containing the highest daily traffic (peak volume) in Figure II-9 corresponds to the hours of least available capacity (zero percent) in Figure II-10. The highest capacity availability occurs over the nighttime hours while the lowest capacity availability occurs at rush hour. Methodology and Support Documentation Page II-47
56 Since we must use averages to approximate peaking characteristics for functional classes regardless of where a particular facility is located, it is not reasonable to assume that the 100 percent of capacity assumption is reasonable for all cases. Therefore, multiple curves were developed that represent different capacity consumption assumptions. Figure II-11 illustrates a set of curves that assumes that peak volume consumes only 75 percent of capacity. As shown in the figure, there is generally a higher amount of available capacity throughout the day. As with Figure II-10, the horizontal axis depicts the hour of the day and the vertical axis shows the percentage of available capacity. By comparing Figure II-11 to Figure II-10, one will notice that the peaking phenomenon becomes more subdued as the curves tend to even out throughout the mid-day period. This would be reflective of a steady stream of traffic throughout the day. This phenomenon is ideally suited to reflecting a condition in which background traffic is competing with evacuation traffic. Instead of merely reducing the background traffic in total, the peaking characteristics are made less pronounced. This would reflect a situation in which background traffic vehicles do not completely force out the evacuation trips from the network, but rather begin trading movement opportunities with evacuees. For example, the curve in Figure II-11 assumes that the background traffic vehicles would yield to approximately one evacuation vehicle for every three background traffic vehicles at an intersection during rush hour whereas the curve in Figure II- 10 would assume that background traffic would never yield to evacuation traffic during rush hour. This is clearly illogical since even without extraordinary traffic management efforts during an evacuation standard traffic control devices such as traffic lights and stop signs would compel drivers to yield to one another. Methodology and Support Documentation Page II-48
57 Figure II-9: Average Peaking Characteristics by Functional Class 9 Percent of Daily Volume FC-01 FC-02 FC-06 FC-07 FC-08 FC-09 FC-11 FC-12 FC-14 FC-16 FC-17 FC Hour of Day Source: Florida Traffic Information DVD, Florida Department of Transportation, Methodology and Support Documentation Page II-49
58 Figure II-10: Available Capacity at Peak Volume = 100% of Capacity 100 Percent of Capacity Available FC-01 FC-02 FC-06 FC-07 FC-08 FC-09 FC-11 FC-12 FC-14 FC-16 FC-17 FC Hour of Day Source: Florida Traffic Information DVD, Florida Department of Transportation, Methodology and Support Documentation Page II-50
59 100 Figure II-11: Available Capacity at Peak Volume = 75% of Capacity 90 Percent of Capacity Available FC-01 FC-02 FC-06 FC-07 FC-08 FC-09 FC-11 FC-12 FC-14 FC-16 FC-17 FC Hour of Day Source: Florida Traffic Information DVD, Florida Department of Transportation, Methodology and Support Documentation Page II-51
60 One can assume that in a typical traffic situation, evacuation trips can expect at least a one-toone parity with background traffic concerning the use of a road. Because of this, a curve was developed that reflects peak volume at 50 percent of capacity. This reflects that even in the worst case situations, that evacuation traffic and background traffic are trading movements at a one-to-one ratio. For every background traffic vehicle that moves onto a road, one evacuation traffic vehicle can move onto the same road. This is the assumption that was used for background traffic in counties that are not under an order to evacuate and assumes that the residents of these counties are generally going about their daily business and are making only minor changes to their trip making behavior in response to the incoming evacuation traffic. This curve is shown in Figure II-12. The horizontal axis depicts the hour of the day and the vertical axis shows the percentage of available capacity. As was mentioned earlier, though it cannot be assumed that background traffic in nonevacuating counties can be reduced significantly, this cannot be said for evacuating counties. In evacuating counties, many of the areas that serve as origins and destinations for daily trip making activities may be under an order to evacuate thus eliminating those trip ends (and their associated trips) from consideration. Also, many residents in evacuating counties are more inclined to reduce their level of trip making activity, making shorter and fewer trips. Thus, a background traffic curve that assumes that peak volume is only 20 percent of capacity was developed to reflect this reduced level of activity. This is shown in Figure II-13. The horizontal axis depicts the hour of the day and the vertical axis shows the percentage of available capacity. Model Application The curves depicted in Figure II-12 and Figure II-13 were used to develop a set of factors for each functional class of road. Each link in the model s highway network is then associated with a specific functional class depending on the purpose, design, and context of that facility. The model makes use of a feature in Cube AVENUE known as DYNAMIC C. DYNAMIC C allows the model to adjust the capacities of the roads over time while the model is running. The factors are placed into a table that the model can reference and are cycled over a 96 hour period. As the model runs and the evacuation trips are moved throughout the network, more or less capacity becomes available depending on the type of road, the hour of the day, and which county the road is located in by applying the background traffic factors to the capacities of the roadway segments. The model assumes that the evacuation begins at 7:00 AM on a typical weekday. Methodology and Support Documentation Page II-52
61 Figure II-12: Available Capacity at Peak Volume = 50% of Capacity Non-Evacuating Counties 100 Percent of Capacity Available FC-01 FC-02 FC-06 FC-07 FC-08 FC-09 FC-11 FC-12 FC-14 FC-16 FC-17 FC Hour of Day Source: Florida Traffic Information DVD, Florida Department of Transportation, Methodology and Support Documentation Page II-53
62 Figure II-13: Available Capacity at Peak Volume = 20% of Capacity Evacuating Coastal Counties 100 Percent of Capacity Available FC-01 FC-02 FC-06 FC-07 FC-08 FC-09 FC-11 FC-12 FC-14 FC-16 FC-17 FC Hour of Day Source: Florida Traffic Information DVD, Florida Department of Transportation, Methodology and Support Documentation Page II-54
63 Dynamic Traffic Assignment An assignment technique that is beginning to be applied within transportation planning models is Dynamic Traffic Assignment (DTA). DTA works by assigning a certain number of vehicles to the highway network in a given interval of time. The model then tracks the progress of these trips through the network over the interval. Another set of vehicles is assigned during the following time interval. The model then tracks the progress of these trips through the network along with the progress of the trips loaded in the previous time interval. As vehicles begin to arrive at the same segments of roadway, they interact with one another to create congestion. When vehicles that were loaded to the network in subsequent intervals of time arrive at the congested links, they contribute to the congestion as well. This results in a slowing down of the traffic and eventually spill-backs and queuing delays. It is this time dependent feature of DTA that makes it well suited to evacuation modeling. By dynamically adjusting the travel times and speeds of the vehicles moving through the network as they respond to congestion the model is able to do the following: 1. The evacuation model is able to estimate the critical clearance time statistics needed for this study; 2. The model takes into account the impact of compounded congestion from multiple congestion points; 3. The model is able to adjust the routing of traffic throughout the network as a function of congestion as it occurs throughout the evacuation; and, 4. The model is capable of adjusting its capacities from time segment to time segment, making it possible to represent such phenomena as reverse lane operations. It is because of these features that DTA is the assignment technique used to model evacuation traffic for the SRESP. The DTA software that is used is known as Avenue and is part of the Cube suite of transportation modeling software used throughout the State of Florida. Figures II-14 through II-17 depict snapshots of a dynamic assignment at hour long intervals from the evacuation model prototype. The colored links in the images represent the queuing delay along the links at differing levels of intensity with green links having some minimal delay and red links have much more intense delay. Notice how the delay queues build up and spill back onto previous links over time and then later clear out. The model assigns a two volume sets. The first set contains only those trips that are destined to stay in the same county as where the trips originate. The second set contains only those trips that are destined for a county other than the one in which the trips originate. Parameters of the Evacuation Assignment The DTA for the evacuation model makes use of certain parameters which dictate how the assignment will function. These parameters will be established during prototype development and remain consistent throughout model implementation so that each region is calculating evacuation traffic and clearance times in the same way. The parameters that will be established are: Methodology and Support Documentation Page II-55
64 Capacity - One of the key variables in computing congestion and queuing in the assignment is capacity. Capacity determines how many vehicles can pass over a given highway link within a given interval of time. The SRESP evacuation model will use hourly lane capacities derived from the Florida Department of Transportation Quality/Level-of- Service Handbook. These capacities are initially set to represent Level-of-Service E conditions. These capacities are then further increased by an additional 20 percent for freeway links and 10 percent for non-freeway links. These increases in capacity are meant to reflect high volume usage, optimal green timing of signals, and the use of shoulder and emergency lanes. Storage - Another key variable in computing congestion and queuing in the assignment is storage. Storage determines how many vehicles can remain standing on a length of road at any moment in time. As the assignment proceeds, the model will move a number of vehicles along a link during a time interval equal to its capacity. Once the capacity threshold has been surpassed, the remainder of the trips will have to wait on the link until the next time interval. If the number of trips that have to wait exceeds the storage of the link, then the remainder of those trips will need to wait on the preceding link. As the model becomes more congested this storage effect cascades along the set of preceding links. This creates a backing up phenomenon as the excess vehicles spill-back onto the previous link. The evacuation model assumes that storage is set to 250 vehicles per lane per mile. This assumes approximately 21 feet of space are occupied by any given vehicle. Given the mix of vehicles on a roadway network (including compacts, SUVs, trailers, and trucks) this spacing appears to be reasonable for stand-still traffic. Time Intervals - In order to properly implement a DTA model, the assignment process needs to be segmented according to a set of time intervals. As the model runs, it calculates what is occurring during each interval of time. Vehicles will enter and exit the network during specific time intervals. It is by analyzing the activity occurring in the model in any given time interval that the model can derive statistics concerning clearance times. Time intervals can be set to any reasonable resolution, although some may be too large or too small to be practical for this evacuation model. In order to accommodate the demands of the study, the time interval resolution is set to one-half hour. One-half hour intervals provide sufficient detail to satisfy the planning needs of both emergency management and growth management concerns. The model calculates vehicle assignments over 192 such intervals for a total of 96 hours. This is sufficient to capture all evacuation activity during an event. This allows for sufficient time for the evacuation traffic to clear at both the county and regional level. Reverse Lane Operations - The State of Florida has recently published a series of reverse lane evacuation plans for major corridors throughout the state. The intention of these plans is to fully maximize the available capacity on a freeway by using all lanes to move evacuees away from danger. An example would be to use the west bound lanes of I-4 to move traffic to the east away from Tampa. The development of a reverse lane plan requires a detailed analysis of the traffic operations involved in implementing such a strategy and is well beyond the scope of this study; however, the evacuation model is able to account for the Methodology and Support Documentation Page II-56
65 impacts of reverse lane operations for general evacuation planning purposes related to emergency management and growth management. The model will emulate reverse lane operations by simultaneously increasing the capacity and storage of links headed away from the threatened area and eliminating the capacity of links headed toward the threatened area. The capacity of links headed away from the threatened area will increase by 66 percent, which is consistent with capacity increases used by Florida s Turnpike Enterprise. Past experience of reverse lane operations have shown that capacities do not double, as is commonly assumed, but increase by a lower percentage of about two thirds. A preset number of reverse lane operations will be coded into the highway network. These reverse lane operations will correspond to the published plans developed by the Florida Department of Transportation. The model network will make use of the following attributes to manage the reverse lane operations: CONTRA_PLN This attribute identifies to which reverse lane evacuation plan a highway link belongs. Links with a 0 in this attribute do not belong to any such plan. Links corresponding to both directions of a given facility are coded with identical CONTRA_PLN values; and, CONTRA_LNS This attribute identifies whether or not lanes are available during reverse lane operations. Links corresponding to the direction headed away from a threatened area should be coded with a positive number. Links corresponding to the direction headed toward the threatened area should be coded with a negative number. Sub-Area Extraction Because it was not possible to conduct a DTA over a statewide extent, the model automatically extracts a multi-county sub-area from the statewide database. This sub-area is used to assign evacuation trips onto the network. As part of the sub-area extraction process, the evacuation trip table is compressed into an alternative zone system known as the Evacuation Assignment Zones. Though the multiple TEZs are aggregated into fewer EAZs, the model retains all of the original access points to the highway network. Assigned volumes are stored in the LOADED.NET file. This file is described in Appendix A. Methodology and Support Documentation Page II-57


66 Figure II-14: Queuing Delay Five Hours into an Evacuation from a Dynamic Assignment Model Methodology and Support Documentation Page II-58
67 Figure II-15: Queuing Delay Ten Hours into an Evacuation from a Dynamic Assignment Model Figure 8.9: Queuing Delay Fifteen Hours into an Evacuation from a Dynamic Assignment Model Methodology and Support Documentation Page II-59
68 Figure II-16: Queuing Delay Fifteen Hours into an Evacuation from a Dynamic Assignment Model Methodology and Support Documentation Page II-60
69 Figure II-17: Queuing Delay Twenty Hours into an Evacuation from a Dynamic Assignment Model Methodology and Support Documentation Page II-61
70 H. Transportation Interface for Modeling Evacuations (TIME) The Transportation Interface for Modeling Evacuations (TIME) was developed to allow individuals who were not technical experts in either travel demand modeling or the Cube modeling software to set-up, manage, and execute evacuation model scenarios. Individuals who have some basic experience with Geographic Information System (GIS) software and are accustomed to working in a windows graphic user interface environment should have little difficulty using TIME. Many of the features designed for TIME were made deliberately restrictive to minimize the likelihood of user error. These features focus on making individual changes specific to a given scenario. Furthermore, access to key input data that are not intended to change between scenarios, such as evacuation participation rates, are restricted in TIME. Making changes to the model is possible beyond what TIME allows. Doing so requires that the individual making the changes be a knowledgeable and skilled travel demand modeler as making such changes can have drastic negative consequences to model performance. Basic GIS Icons The following icons are common ArcGIS icons that appear repeatedly throughout the GIS components of TIME. They are described here for convenience. Zoom-In: Clicking on this icon gives the user a zoom tool that allows the user to zoom closer into a view by either click on the view or dragging a box around the desired area. Zoom-Out: Clicking on this icon gives the user a zoom tool that allows the user to zoom further out of a view by either clicking on the view or dragging a box around the desired area. Pan: Clicking on this icon gives the user a tool that allows the user to move the view around by clicking and dragging on the view. Full Extent: Clicking on this icon zooms the user to an extent that covers the continental United States. Previous Extent: Clicking on this icon zooms the view to the last extent the user was looking at. Next Extent: Clicking on this icon zooms the view to the next extent the user was looking at. This icon becomes available only after the user has clicked the Previous Extent icon. Information: Clicking on this icon gives the user a tool that will open a window displaying the attribute data contained by the feature clicked. Select Feature: Clicking on this icon give the user a tool that will allow the user to select specific features in the view. Methodology and Support Documentation Page II-62

71 Installation Screen The installation screen appears when TIME is first installed on a computer. 1 : Install TIME Program Clicking on this initiates the installation of the TIME interface. Follow the instructions that appear on the screen in order to successfully install the TIME interface. The TIME interface must be installed before installing any other TIME components. (Required to run TIME) 2 : Install TIME Model and Database Clicking on this will install the evacuation model database needed to set-up evacuation model scenarios and execute the evacuation model. (Required to run TIME) Install Archive Files This is an optional installation feature that allows the user to install archived data from the SRESP Evacuation Study Transportation Analysis. This installs the outputs and key inputs for each scenario that was executed as part of the study. Users will not be able to run these scenarios, but they will be able to set-up new scenarios using the input scenarios from the archives as a starting point. Exit This allows you to exit the installer. TIME Desktop Icon: TIME After installation the TIME icon will appear on your desktop. Double-click on the icon to launch TIME. Methodology and Support Documentation Page II-63

72 Scenario Explorer The Scenario Explorer is the primary interface for TIME. Display Scenarios for Region This is a drop down menu that allows you to select any of the eleven regions in the evacuation model. Once a region is selected, all of the scenarios that currently exist for that region are displayed in the window beneath. The user can open a scenario by clicking on the scenario name. TIME will automatically open with whichever region was active the last time that the user closed TIME. New Click here to create a new scenario for the region selected. Exit Click here to exit TIME. Methodology and Support Documentation Page II-64
73 Create New Scenario This interface opens if the user clicks New from the Scenario Explorer. Region This informs the user as to the region in which the scenario is being created. New Scenario Name Input the name of the new scenario here. TIME will automatically create a folder with this name on the user s hard drive. Destination Scenario Path Browse to a specific location on the hard drive. TIME will create a folder with the scenario s name at the location specified here by the user. Scenario Description Enter a text description of the scenario for quick reference in this space. Scenario Comments Additional comments concerning the status of the scenario or a brief summary of the model results can be entered here. Create Clicking this will create a new scenario in TIME. Cancel This cancels the scenario creation process. Methodology and Support Documentation Page II-65

74 Scenario Summary This form appears in the Scenario Explorer after the user selects or creates a scenario and shows an overview of the scenario s current settings. The user can edit the scenario settings by interacting with this form. Save Save the scenario settings. Copy Create a new scenario by creating a copy of the open scenario. Delete Delete the open scenario. Reports View the model run report of the open scenario. This option is not available is the scenario has not yet been run. Run Start running the evacuation model. The model will be executed using the settings established in the Scenario Summary form. Name This displays the name of the scenario that is open. Location This displays the folder path for where the scenario is located on the hard drive. Description Edit the text description of the scenario by typing in this area. Comments Edit comments about the scenario by typing in this area. Behavioral Assumptions Select between two options of evacuation participation rates. These options are described in greater detail elsewhere in this document under the section on Scenario Types. o 100% Response o Planning Assumption Analysis Period Choose between three analysis years. Methodology and Support Documentation Page II-66
75 o 2006 o 2010 o 2015 Model Run Mode Select between two model run modes. o Run Trip Generation Only This mode sets up the scenario to run only the trip generation portion of the model. The results of this mode will provide information on the number of evacuation trips, the evacuating population, and the shelter demand by county in the region involved in the evacuation. This mode will not develop clearance times. This mode causes the model to take approximately 1.5 to 2 minutes to execute. o Run Full Model This mode sets up the scenario to run the entire evacuation model. The results of this mode will provide information on the number of evacuation trips, the evacuating population, the shelter demand, and the clearance times by county in the region involved in the evacuation. This mode causes the model to take between 2 to 48 hours to execute. Run times vary depending on the processing capabilities of the computer on which TIME is installed and the severity of the evacuation scenario being modeled. Save Animation Save a Cube Avenue log file. This file is necessary if the user wishes to view a packet animation of the evacuation. This option is recommended only for single county evacuation scenarios since the size of the file can cause the model to crash. This option appears only if the user selects the Run Full Model run mode. Active Reverse Lane Evacuation Plans Select one or more reverse lane evacuation plans to be active in the scenario. The user can choose not to include any reverse lane evacuation plans for a given scenario. Not all regions have reverse lane evacuation plans. Select All Plans Allows the user to select all visible reverse lane evacuation plans at once. University Population Select the size of the student population in residence at major universities and colleges around the state. o Out of Session (0% in residence) o Summer Session (50% in residence) o Fall/Spring Session (100% in residence) Evacuating Counties Shows the user how many counties are evacuating in the scenario. By clicking the Edit button, the user can choose which counties are evacuating. Shelters Select between three options. o All Open Opens all public shelters for the scenario. o o Primary Open Opens all primary shelters only for the scenario. Customized Select which shelters are opened for the scenario and modify existing shelter capacities. If Customized is selected, an Edit button will appear that will allow the user to modify the shelter settings as needed. Roadway Networks Modified Shows the user how many counties have had changes to the capacities of the roadway network made. By clicking the Edit button, the user can add or remove lanes from specific segments of road. Small Area Data Modified Shows the user how many counties have had changes to the TEZ data made. By clicking the Edit button, the user can make changes to the population data by TEZ. Counties Including Tourist Population Shows the user how many counties are including tourists in the evacuation. By clicking the Edit button, the user can modify how many tourists will be included in the evacuation. Methodology and Support Documentation Page II-67
76 No-Go Counties Shows the user how many counties have been designated as no-go counties. A no-go county will not receive any evacuation trips, though some trips may evacuate through these counties if needed to get to their final destinations. This option allows the user the ability to shut off portions of the state in order to test what might happen if evacuees could be successfully directed to evacuate in a particular direction. By clicking the Edit button, the user can designate specific counties as no-go counties. Exit Closes TIME. Methodology and Support Documentation Page II-68

77 Evacuation Model Settings (County) The Evacuation Model Settings window appears if you click the Edit button next to Evacuating Counties in the Scenario Summary form. This interface allows the user to determine which counties evacuate for a given scenario. County Names of the counties available to evacuate for a given scenario. Counties located within the region are at the top of the list and in bold type. Other counties are listed below. Evacuation Level Select an evacuation level ranging from A through E with E being the most intense. The level of the evacuation is consistent with the evacuation zone being ordered to evacuate. A null value will result in that county not evacuating for the scenario. Response Curve Select a response curve ranging from 6 hours to 36 hours. The response curve describes the period of time over which evacuees begin their journey. A county with an evacuation level set must have a response curve. Phasing Determine in which hour of the event the evacuation for a given county begins. The first county to evacuate in the scenario should always be set to hour 1. Counties can be set to evacuate simultaneously. OK Closes the Evacuation Model Settings window. Methodology and Support Documentation Page II-69

78 Shelter Settings This window appears after clicking the Edit button that appears when Shelters in the Scenario Summary form is set to Customized. This interface lets the user open and close select shelters and modify shelter capacities. Counties List of the counties for which shelters can be modified in the scenario. Selecting a county will zoom the map to that county. The user can only edit data in the county that has been selected. All Shelters Selecting this displays all available shelters for the scenario. Primary Only Selecting this displays available primary shelters for the scenario. Open/Close Shelters Opens a window that allows the user to open and close groups of shelters at a time. Shelter Map This tab shows a map of shelter locations for the scenario. Shelter List This tab shows a list of all the shelters for the selected county along with associated data for those shelters. Scenario Shelter Capacity Displays a running total of open shelter capacity. Edit Clicking this places the interface in edit mode and gives the user a tool that allows the user to open or close specific shelters as well as modify the capacities at those shelters. Exit Edit Takes the interface out of Edit mode. Appears only if the interface is in the Edit mode. Save Saves changes to the shelter database and closes the Shelter Settings window. Methodology and Support Documentation Page II-70
79 Open/Close Shelters This window opens if the Open/Close Shelters button in the Shelter Settings interface is clicked. Status Select whether to open or close shelters identified elsewhere in this window. Object Select whether to affect all shelters or only the primary shelters. Geography Select whether to affect shelters in all counties or only in the county currently selected in the Shelter Settings interface. OK Execute the opening or closing of shelters as defined in this window. Cancel Cancels the opening or closing of shelters as defined in this window. Methodology and Support Documentation Page II-71
80 Edit Shelter Capacity This window opens after the user clicks on a shelter in the Shelter Settings interface while the Edit button is selected. Open Indicates that the shelter is to be opened. Close Indicates that the shelter is to be closed. Shelter Name Displays the name of the shelter. Address Displays the address of the shelter. County Displays the name of the county in which the shelter is located. TEZ Displays the number of the evacuation model traffic evacuation zone in which the shelter is located. Type Indicates whether the shelter is a primary shelter or other shelter. Capacity Indicates the number of people that can be safely sheltered at this location. Save Saves the changes made to the shelter. Cancel Cancels changes made to the shelter. Methodology and Support Documentation Page II-72

81 Shelter List Tab This table opens if the user clicks on the Shelter List tab in the Shelter Settings interface. All fields can be sorted by clicking on the field name. This table provides an alternative way of interacting with the shelter database. Shelter Name Name of the shelter. Address Street address of the shelter. Capacity Number of people that can be safely sheltered at this location. This field is editable. TEZ The number of the evacuation model traffic evacuation zone in which the shelter is located. Shelter Type Indicates whether the shelter is a primary shelter or other shelter. County Name of the county in which the shelter is located. Active Indicates whether the shelter is open or closed. This field is editable. 0 = Closed 1 = Open Methodology and Support Documentation Page II-73

82 Network Information This interface opens when the user clicks the Edit button next to Roadway Network Modified in the Scenario Summary form. This opens a map of the highway network used in the evacuation model. Counties - List of the counties for which road segments can be modified in the scenario. Selecting a county will zoom the map to that county. The user can only edit data in the county that has been selected. Edit Places the interface into edit mode. This button appears only after the user has used the Select Feature tool to select a roadway segment. The user may only edit one segment at a time. Exit Edit Takes the interface out of Edit mode. Appears only if the interface is in Edit mode. Lanes Allows the user to edit the number of lanes on a roadway segment. The user must be in Edit mode and only one segment must be selected. The user may not set the number of lanes to zero. OK Accepts the changes made to the roadway network and returns the user to the Scenario Summary form. Methodology and Support Documentation Page II-74
83 Edit Lanes This window appears when the user clicks the Lanes button in the Network Information interface. Directionality for roads is indicated by the node numbers. The current version of TIME does not have a way of indicating which direction is which. Users are advised when increasing or decreasing lanes to do so in both directions simultaneously. Also, interstate highways and other freeways are coded in the network as a pair of parallel links. To modify lanes on these facilities it is necessary to select one direction at a time. The restrictive nature of this editing is meant to prevent user error by inadvertently select multiple segments and making unwanted edits to the network. The network can also be edited outside of TIME by opening the geodatabase in Cube. Cube will allow the user to edit multiple links simultaneously as well as identify the direction of each side of the road to be edited. Also, Cube will allow the user to make other edits to the network not currently permitted by TIME, such as deleting existing roads or adding new roads. Analysis Period Indicates which year of the highway network is being edited. This depends on the analysis period that is selected in the Scenario Summary form. Selection Count Indicates how many features have been selected. On a two-way segment of road, this value should be 2. On a one-way segment of road or on a freeway, this value should be 1. A Node The number of the A node in the highway network used by the model to track direction. B Node The number of the B node in the highway network used by the model to track direction. Lane Number of lanes in each direction. This field is editable. Values must range between 1 and 9. Values of 0 are prohibited. OK Accepts changes to the number of lanes for the roadway segment. Cancel Rejects changes to the number of lanes for the roadway segment. Methodology and Support Documentation Page II-75
84 Growth Management Considerations This interface opens when the user clicks the Edit button next to Small Area Data Modified in the Scenario Summary form. This interface allows the user to edit data related to the population for a given scenario. Counties - List of the counties for which small area data can be modified in the scenario. Selecting a county will zoom the map to that county. The user can only edit data in the county that has been selected. Edit Places the interface in Edit mode. The user can then edit data in a specific TEZ by clicking on the appropriate location in the map. Exit Edit Takes the interface out of Edit mode. Appears only if the interface is in Edit mode. OK Returns the user to the scenario summary form. Methodology and Support Documentation Page II-76

85 Edit TEZ This window opens when the user clicks on a TEZ in the Growth Management Considerations interface while in Edit mode. This window contains multiple tabs. Each tab allows the user to modify specific information in the TEZ database found in the scenario s geodatabase. All changes are specific to the TEZ selected. Only one TEZ can be edited at a single time. The TEZ database can be edited outside of TIME in Cube. Cube allows the user to make changes to multiple TEZs simultaneously. Furthermore, the user can also use ArcGIS or MS Access to make large scale changes very quickly, such as updating a county s population data with more recent information. PCAT Allows the user to determine what percent of the households in the TEZ are located in each evacuation zone. TEZs do not line up exactly with evacuation zones. PCAT allows the user great flexibility on determining the number of households located within the threatened area for a given scenario. TIME expects that all PCAT percentages will sum to 100. DTSB Number of site-built dwelling units in the TEZ for the years 2006, 2010, and PCTSO Percent of site-built dwelling units in the TEZ occupied for the years 2006, 2010, and D_MB Number of mobile homes in the TEZ for the years 2006, 2010, and PC_MO Percent of mobile homes in the TEZ occupied for the years 2006, 2010, and D_UNIV Number of university dwelling units (dorm rooms) in the TEZ for the years 2006, 2010, and VHTSB Number of vehicles per occupied site-built dwelling unit in the TEZ for the years 2006, 2010, and Methodology and Support Documentation Page II-77
86 VH_MB Number of vehicles per occupied mobile home in the TEZ for the years 2006, 2010, and HM_U Number of hotel, motel, or other tourist dwelling units in the TEZ for the years 2006, 2010, and HM_O Percent of occupied hotel, motel, or other tourist dwelling units in the TEZ for the years 2006, 2010, and Check Data Confirms that PCAT percentages sum to 100. Save Data Accept changes made to TEZ data. Appears only after the user has clicked Check Data and the data have been accepted. Cancel Reject changes made to the TEZ data. Methodology and Support Documentation Page II-78

87 Seasonal Population Settings This interface opens if the user clicks the Edit button next to Counties Including Tourist Population in the Scenario Summary form. The user will see data on seasonal population only for those counties that have been set to evacuate. The user can use this interface to determine whether or not to include tourists in the evacuation analysis. County Name of the county or counties evacuating in the scenario. Tourists Determines whether or not to include tourists in the evacuation analysis. Users have two options. o Include o Do Not Include Override Tourist Occupancy Rate? Allows the user to override the default tourist occupancy rates included in the TEZ database. o No o Yes Rates Sets the tourist occupancy rate for the entire county if the user has decided to override the TEZ database default tourist occupancy rates. TIME allows the user to select rates ranging from 0% to 100% in 5% increments. OK Returns the user to the Scenario Summary form. Methodology and Support Documentation Page II-79

88 No Go Counties This interface appears when the user clicks the Edit button next to No-Go Counties in the Scenario Summary form. This interface allows the user to select those counties that will be prohibited from receiving evacuees. Evacuation trips may sill pass through these counties if needed to reach destinations beyond the No-Go counties. It is expected that this feature will be used very infrequently and only to test hypothetical situations. The destinations calculated by the model reflect the best available data collected for the SRESP. These data reflect both the observed and stated preferences of the respondents. It is recognized by the study that state and local authorities have an extremely limited ability to compel an evacuee s choice of destination. While existing policies directing evacuees to head for specific areas of the state may have an influence on an evacuee s choice of destination, these influences have already been accounted for by the model. No-Go Counties and Regions Select any and all counties that will be designated as no-go counties for the scenario. Select All Designate all counties as no-go counties at once. If all counties are selected as no-go counties, then all evacuees will seek destinations outside of Florida. OK Returns the user to the Scenario Summary form. Methodology and Support Documentation Page II-80

89 Create new Scenario by copying This window appears when the user clicks the Copy button on the Scenario Summary form. It allows the user to create a new scenario by copying an existing one. This can be very convenient if the user intends to test multiple scenarios that are very similar to each and differ only slightly. This feature will copy all of the inputs from the existing scenario and place them into the new scenario. This includes all scenario parameters, such as which counties are evacuating and whether or not to include tourists, along with the geodatabase with all existing edits that have previously been made. Region Displays the name of the region in which the scenario will be created. Scenarios created by copying from an existing scenario are limited to being in the same region as the original. New Scenario Name - Input the name of the new scenario here. TIME will automatically create a folder with this name on the user s hard drive. Destination Scenario Path - Browse to a specific location on the hard drive. TIME will create a folder with the scenario s name at the location specified here by the user. Copy Creates the new scenario as a copy of the existing scenario. Cancel Returns the user to the Scenario Summary form without creating a new scenario. Methodology and Support Documentation Page II-81

90 Scenario Summary and Confirmation This window appears when the user clicks the Run button on the Scenario Summary form. It provides a brief summary of all of the settings the user has selected for this scenario before running the model. Print Scenario Settings Prints a hard copy of the scenario summary for the user to keep as part of their records. Run Model Launch Cube Voyager so that the evacuation model can be run. Cancel Returns the user to the Scenario Summary form without running the model. Methodology and Support Documentation Page II-82

91 Voyager Task Monitor This window appears when the user clicks the Run Model button in the Scenario Summary and Confirmation window. This is the Cube Voyager Task Monitor responsible for executing the evacuation model. Most of this interface is specific to running models in Cube and is not of interest to the user. Start Begins the evacuation model run. While the model is running, TIME will not be accessible to the user. Cancel Returns the user to the Scenario Summary form. Abort Stops the model from running. This button appears only after the user has clicked Start. After the model has begun running a series of spreadsheets will be opened by the model. The user may view the spreadsheets if desired. After the user has finished viewing the spreadsheets, they must be closed manually. Methodology and Support Documentation Page II-83
92 Once the spreadsheets have been closed, the task monitor will once again be visible. VOYAGER ReturnCode This indicates how the model performed. 0 = Model executed without errors 1 = Model executed without errors but with messages 2 = Model crashed. 3 = User scripted abort. (For the evacuation model this means that there is more shelter demand than there is shelter capacity open. The user must open more shelter capacity for the model to execute properly) Close Returns the user to the Scenario Summary form. View Print File Opens a text report detailing the model s performance throughout its run. Methodology and Support Documentation Page II-84

93 Current Scenario Reports This window opens when the user clicks the Reports button on the Scenario Summary form. Open Result Spreadsheets Opens the spreadsheets reporting the results of the scenario s most recent run. Because the report spreadsheets contain active formulas, multiple files have to be opened simultaneously. This button allows that to happen. The report spreadsheet should only be viewed by clicking this button. PDF Instructions for obtaining a shapefile Opens a document explaining how to export a shapefile from the loaded network file from the model. Exit Returns the user to the Scenario Summary form. Methodology and Support Documentation Page II-85
94 I. Future Enhancements The SRESP Evacuation Model was developed using the best data available at the time the model was developed. The data collected for this study represents the most comprehensive data set ever collected on the characteristics pertaining to evacuation trip making behavior for Florida. This model represents one of the largest scales attempted for mesoscopic dynamic traffic assignment and despite many enhancements made by the software vendor to Cube during the course of this study, there are still evacuation scenarios that may be desirable to analyze but which current commonly available computer technology does not make possible. As technology improves and becomes more readily available the following enhancements to the SRESP Evacuation Model should be pursued: Statewide Assignment It was hoped at the beginning of the study that evacuation models could be run using a statewide extent. This would have eliminated the need to extract sub-area models for the evacuation trip assignment. One of the limitations imposed for this model by the study is that the final product had to be a tool that could be executed from desktop computers the type of which were commonly found in use at public agency offices. As more advanced computers become available, a statewide extent should be possible. Future versions of the SRESP Evacuation Model should continue to pursue a statewide extent. No Assignment Aggregation As part of the need to execute the evacuation model as efficiently as possible, TEZs had to be aggregated into large zone geographies called EAZs. This resulted in some loss of data resolution. The aggregation plans for each county were designed to minimize this loss as much as possible with less aggregation along the coast and more aggregation inland. No aggregation would be preferable. As more advanced computers become commonly available, future versions of the SRESP Evacuation Model should eliminate the EAZ process. Dynamic Participation Recent work in academia has demonstrated that it is possible to created dynamic choice models for determining who evacuates and when. The current process uses static rates for participation along with static response curves. The benefit of a dynamic choice model is that the decision when to evacuate is made simultaneously with the decision to evacuate by individuals in the model. This means that individuals in the model can respond more realistically based on parameters more intuitive to emergency management staff, such as when an evacuation order is given and when landfall is expected. It was hoped that this technique could be employed for the current version of the SRESP Evacuation Model, but a lack of robust temporal data in the SRESP behavioral survey prevented this. Future behavioral analyses for evacuations should include questions intended to determine when an individual first began their evacuation journey. The answers provided should be as specific as possible. Enhanced Trip Distribution The coarse level of trip distribution data contained in the SRESP behavioral analysis made it difficult to develop any but the most rudimentary trip distribution model. The nature of trip distribution during an evacuation is different than that of normal every day trip making behavior. Additional questions concerning the respondent s destination should be asked. Detail at the zip-code level should be acquired at a minimum, Methodology and Support Documentation Page II-86
95 though more precise information would be preferable. The respondents should be asked how distant their destination was along with what time they arrived at their destination. This information could be used to determine a statistical probability that a particular TEZ would be more or less likely to receive evacuees. Cloud Computing When the SRESP Evacuation Model was first being developed the possibility of hosting the model on a server and giving users account access to the model to set up and run scenarios was discussed. This approach was rejected at the time in favor of a model that operates on a local machine. Issues related to the distribution and maintenance of the evacuation model may prompt those responsible for maintaining the model to revisit this option. Cube 6 will support a cloud computing platform. Models can be maintained and operated by logging into servers hosted by the software vendor. These machines are more powerful than what is typically available in most public agency offices. This would allow the SRESP Evacuation Model to make use of more advanced techniques without placing additional burden on end users computer resources. Future versions of the SRESP Evacuation Model should explore implementation in a cloud environment. Improved Dynamic Traffic Assignment The Cube software is always being enhanced. More sophisticated algorithms for executing dynamic traffic assignments are being developed every day. The SRESP Evacuation Model should be periodically updated to ensure that the most up-to-date algorithms are being implemented in the model. This will ensure that the evacuation model continues to provide the most accurate clearance times possible. Integration with Microscopic Modeling and Operational Analysis During the course of the study, it became apparent that there was a high demand for operational analysis tools that could be used by emergency management staff during an event. The SRESP Evacuation Model was never intended to be such a tool. There does exist an opportunity to integrate data from the SRESP Evacuation Model into operational analysis tools that could be of great benefit for emergency management staff. Future efforts should include attempts to synthesize data from the SRESP Evacuation Model and other data sources to create on operational analysis tool that could be used in real time to assist in decision making during an emergency. Refined Background Traffic The SRESP Behavioral Analysis focused explicitly on evacuation trips. Information concerning those people who were in evacuating counties but did not evacuate was not collected. This information is crucial to getting a better understanding of the character of background traffic. Previous studies tended to look at counties in isolation so simple assumptions about deteriorating background traffic over time were logical. For this study, since the areas being modeled were so huge, a different set of assumptions were used that could not assume uniformly deteriorating background traffic. Additional information concerning the characteristics of those individuals who do not evacuate would provide a greater understanding of how much normal travel behavior changes during an evacuation. Methodology and Support Documentation Page II-87
96 This page intentionally left blank. Methodology and Support Documentation Page II-88
97 CHAPTER III DEMOGRAPHIC AND LAND USE ANALYSIS METHODOLOGY A. Guiding Principles for the Demographic Analysis 1. The best available data should be used for creating housing unit counts and population estimates, housing unit and population projections, and demographic profiles. 2. All regional studies should use an April 1, 2006, baseline for housing unit and population estimates, with April 1, 2010 and April 1, 2015 projections for comparison. 3. Demographic estimates for both counties and small areas for the baseline, and the projections for 2010 and 2015, should be consistent with official county-level totals (current state estimates and projections from the University of Florida s Bureau of Economic and Business Research or adopted comprehensive plans with methodology approved by the Florida Department of Community Affairs). The regional evacuation study scope of work required the preparation of a socio-economic profile of the population of each county, as well as the collection of small-area data to support both the vulnerable population analysis and the transportation analysis. The socio-economic profile is based on 2000 Census block group data. The small-area geography used in the prevailing transportation model for the county, if there was one, determined the type of data that was collected for transportation modeling. All small-area data was incorporated into a Geographic Information System (GIS). B. Socio-Economic Profile Chapter I of the Technical Data Report includes the socio-economic profile for the RPC region as a whole, along with an appendix for each county-level profile. Template files for the regional summary (I-RegionalDemographicLandUseAnalysis.doc) and for the county appendices (I- CountyDemographicLandUseAnalysis.doc) were posted on the SRESP FTP site at ftp://ftp.floridaevac.org/uploads/tdr_templates/1_demographics/. Printable versions of the templates with the maps attached (I-RegionalDemographicLandUseAnalysis.pdf for South Florida and I-CountyDemographicLandUse_wMaps.pdf for Broward County) were posted in the same folder. The socio-economic profile for the region and each county is based on 2000 Census block group data. For the 40 counties that had data from the 2006 American Community Survey (ACS), a comparison was prepared between county summaries in 2000 and the corresponding county profiles for Where all of the counties in the region had data from the 2006 ACS (East Central Florida, Tampa Bay, Treasure Coast and South Florida), a 2006 comparison profile and analysis was included in Chapter I. The South Florida Regional Planning Council provided 2000 Census data to each RPC in a pair of region-specific files on the Demographic and Land Use Analysis Support Data 1 CD-ROM delivered at the GIS methodology meeting on March 19, 2007, in Tampa. The files are named CensusSF3HBGnn.xls and CensusSF3PBGnn.xls, where nn represents a unique 2-character Methodology and Support Documentation Page III-1
98 identifier for each RPC. The same data was made available on the SRESP FTP site in the folders for each RPC under ftp://ftp.floridaevac.org/gis/rpc/demographics/profiles/. The data is from Summary File 3 (SF3), at the block group (BG) level, with county totals, for every county in each of the 11 RPC regions; the files include base data taken directly from SF3, as well as a set of summarized and calculated variables to be used as socio-economic indicators. The specific SF3 tables from which the basic data were drawn, broken into housing unit and person characteristics, are identified on tabs (SF3HTables and SF3PTables) included in the spreadsheets. A list of the summarized and calculated variables was included for housing unit and person characteristics on two other tabs (HVariables and PVariables). The indicators were calculated for each block group and for the county totals, and are available on tabs (SRESPHData and SRESPPData) in the same spreadsheets. Step 1A (block group data for all counties) Each RPC incorporated the indicator data (SRESPHData and SRESPPData) for the region as a whole or for each county separately into a GIS, along with a 2000 Census block group boundary layer, and used the GIS to create thematic maps and analyze characteristics of the population, showing concentrations of potentially vulnerable populations. Table III-1 lists the indicators developed for thematic mapping and highlights in light green the ones that should be incorporated into the final Chapter I report and the county appendices. RPCs were advised to include additional maps as deemed appropriate. Once the counties in the region defined new evacuation zones, this data was used, along with updated small-area projections of housing units, to analyze vulnerable populations within each evacuation zone. Step 1B (county-level profile data for all counties) The South Florida Regional Planning Council provided county-level summary tables of housing unit and person characteristics of the population in 2000 on the Demographic and Land Use Analysis Support Data 2 CD-ROM that was distributed at the methodology meeting on May 8, The files are named nnrpcprofileh.xls and nnrpcprofilep.xls, where nn represents the same 2-character identifier for each RPC. The same data was posted on the SRESP FTP site in the folders for each RPC under ftp://ftp.floridaevac.org/gis/rpc/demographics/profiles/. Each RPC used these tables to prepare an analysis of the socio-economic characteristics of each county and the region. RPCs also used block group data to develop sub-county highlights, where appropriate, incorporating any maps generated in Step 1A. All of the summary tables were designed and included in the demographic analysis template files. Step 2A (40 counties with data from the 2006 American Community Survey) County-level summary tables of housing unit and person characteristics of the population in 2006, based on the American Community Survey (ACS), were included along with the 2000 tables in the same profile spreadsheets referenced in Step 1B. The profiles draw from 2006 ACS spreadsheets for each county that follow the naming scheme 2006ACSCounty.xls, where County is filled by the name of the county. The 2006 ACS data files were posted on the FTP site under ftp://ftp.floridaevac.org/gis/rpc/demographics/profiles/ in the folders for each RPC. The profile spreadsheets for each RPC, initially developed with 2005 ACS data, were updated to include the 2006 ACS data, along with the 2000 Census data, and posted on the FTP site. Each RPC prepared a descriptive summary of the characteristics of the population for each county as a whole in 2006, and compared it, where appropriate, with the characteristics of the population in 2000 (see the template file, I-CountyDemographicLandUseAnalysis.doc, which Methodology and Support Documentation Page III-2
99 includes an analysis of Broward County). Note that 2006 American Community Survey is from a relatively small sample, so comparisons should be made with caution. ACS data is published with a Margin of Error (MOE) statistic, which can be viewed in the source data file and in the profile tables it is important to consult the MOE before concluding that significant changes have taken place in 2006 with regard to the 2000 baseline. Step 2B (27 counties without data from the 2006 American Community Survey) If there was no 2006 ACS data available for a county in the region, the tables reserved for 2006 data in the profile were left blank. However, if significant demographic changes had occurred since the 2000 Census, for example as a result of major storms in recent years, RPCs were encouraged to use the best available data to discuss in the narrative the possible effects of those changes on the socio-economic characteristics of the population. C. Development of Small Area Data for Transportation Modeling Small-area data on housing units by type (permanent, mobile home and tourist), number of people and number of vehicles was based on either traffic analysis zones (TAZs) or 2000 Census block groups (BGs). Data from the 2000 Census required updating to a 2006 baseline, which was projected out to 2010 and The RPCs were instructed to make all projections consistent with the county-level mid-range projections based on April 1, 2006 (released in February 2007), prepared by the University of Florida s Bureau of Economic and Business Research (BEBR), unless an alternative set of projections had been approved by the Florida Department of Community Affairs (DCA). Step 3A RPCs were instructed to determine whether existing transportation models for the county use TAZs, BGs or other geography, by consulting with the following organizations (where applicable): County large county planning departments sometimes develop their own estimates and projections for small-area geography. Metropolitan Planning Organization (MPO) counties and MPOs work together to develop the basic data sets for transportation models for each planning area. Florida Department of Transportation (FDOT) for counties that are not within the jurisdiction of an MPO, default housing unit, population and vehicle projections for small areas are built into the statewide transportation model. In some cases, consulting firms may play a role in developing and maintaining transportation models for the county and/or the MPO. RPCs were asked to determine whether small-area demographic projections out to at least 2015 were already in use and represented a consensus of the above groups. If so, they were asked to determine whether the projections were consistent (at the county level) with those prepared by BEBR. If they were, these would constitute the preferred baseline. If there were consensus projections that were not consistent with BEBR, the RPC should determine whether they had been approved by DCA; otherwise, it was important to work with partners to revise the projections. If there were competing sets of projections, the RPCs were instructed to work with county staff to decide which set should serve as the starting point. Step 3B Based on the results in Step 3A, the RPCs defined the small-area geography that was used for Methodology and Support Documentation Page III-3
100 data collection for traffic modeling in the regional evacuation study. If projections for TAZs were being used in the applicable transportation model and were acceptable to all, they were the first choice. Otherwise, BGs should be used. If census tracts (CTs) were being used in the transportation model, data should be collected at the block group level and aggregated as needed for traffic modeling. Step 4 RPCs then reviewed the available datasets to acquire the best available small-area data for Required demographic information for BGs from 2000 Census Summary File 3 was provided for all counties for the demographic profiles and mapping. Additional data was provided from the 2000 Census Transportation Planning Package (CTPP) for TAZs (31 counties) or BGs (10 counties) 5 of the counties with BG data also have TAZ data on the 2000 CTPP disc, which leaves a total of 31 counties with neither. The purpose of working with the CTPP data, even for RPCs using BGs, was to obtain additional detail about the number of vehicles by type of unit, which is not available in Summary File CTPP data at the TAZ or BG level for 36 counties, along with summarized and calculated variables for all 67 counties and the State of Florida, was provided on the Demographic and Land Use Analysis Support Data 2 CD-ROM that was distributed at the methodology meeting on May 8, The same data was posted on the SRESP FTP site, in the folder ftp://ftp.floridaevac.org/gis/rpc/demographics/2000census/census_trans_package/. Total Number of Persons (Table 1-047) Household Size by Vehicles Available by Number of Units in Structure (Table 1-077) Total Number of Units (Table 1-083) Occupancy Status by Number of Units in Structure (Table 1-086) Vacancy Status (Table 1-087) Aggregate Number of Vehicles in Households (Table 1-109) Step 5A If consensus small-area projections did not exist, the RPCs were instructed to use building permit data from the county and municipal planning and zoning departments to identify new dwelling units built since This data was geocoded and tabulated for the level of geography used in the transportation model and produced updated estimates for the 2006 baseline, as well as projections for 2010 and Alternatively, or as a supplement, the RPC was instructed to use information from the county Property Appraiser database to analyze changes in the number and type of units since For each year and for each small-area geographic unit, the final transportation modeling inputs required included the number of occupied non-mobile home dwelling units, the number of occupied mobile home units, and the number of persons and vehicles per unit for each type. Similarly, for hotel/motel units, we required the number of units and the number persons and vehicles per unit. Step 5B RPCs were instructed to collect data on the current number of permitted mobile home parks from the Florida Department of Health s Environmental Health Inspected Facilities database ( and compare to the 2000 baseline. A copy of the March 16, 2007, version of this database (StateMHPMaster.xls), with 5,669 records for mobile home parks in the State of Florida, was included on the Methodology and Support Documentation Page III-4
101 Demographic and Land Use Analysis Support Data 1 CD-ROM that was distributed at the GIS methodology meeting on March 19, 2007, in Tampa. The same data was posted on the SRESP FTP site in the folder ftp://ftp.floridaevac.org/gis/state/demographics/. This data was used to geocode and tabulate for the level of geography used in the transportation model and produce updated estimates for 2006 and projections for 2010 and RPCs were alerted to verify whether any mobile home units had been converted or otherwise ceased to exist. Alternatively, or as a supplement, information from the county Property Appraiser database was used to analyze changes in the number of mobile home units since Step 5C RPCs were instructed to collect data on the current number of hotel and motel rooms from the lodging licenses database at the Florida Department of Business and Professional Regulation ( and compare to the 2000 baseline. A copy of the March 14, 2007, version of this database (HotelMotelFL.xls), with 37,412 records for the State of Florida, was included on the Demographic and Land Use Analysis Support Data 1 CD-ROM that was distributed at the GIS methodology meeting on March 19, 2007, in Tampa. The same data was posted on the SRESP FTP site in the folder ftp://ftp.floridaevac.org/gis/state/demographics/lodging/. Richard Butgereit (FDEM) geocoded this data and made a shapefile available on the FTP site in the same folder, along with a revised join file (new_lodge_join.dbf). The RPCs reviewed and tabulated this data for the level of geography used in the transportation model and produced updated estimates for 2006 and projections for 2010 and Alternatively, or as a supplement, they used information from the county Property Appraiser database to analyze changes in the number of hotel and motel units since Step 6 The RPCs then prepared a dataset for either TAZs or BGs with baseline data for transportation modeling that contained the following data for 2006, 2010 and 2015: Permanent units and occupancy rate, yielding occupied dwelling units Mobile home units and occupancy rate, yielding occupied mobile home units Hotel/Motel rooms Persons per unit for each of the above Vehicles per unit for each of the above A field list for the input files, with definitions, is included in Table III-2. Methodology and Support Documentation Page III-5
102 Table III-1 Socio-Economic Indicator List 2000 Census Block Group Data Variable Field Name Universe Description Housing Unit Indicators SRESPH06 AreaLand Geography Land Area (square miles) SRESPH07 AreaWater Geography Water Area (square miles) SRESPH08 POP100 Population Total resident population from the 100% count SRESPH09 HU100 Population Total housing units from the 100% count SRESPH10 TotalUnits Housing Total housing units SRESPH11 OccUnits Housing Occupied units SRESPH12 OwnerOcc Housing Owner-occupied units SRESPH13 RenterOcc Housing Renter-occupied units SRESPH14 TotalVacant Housing Vacant units SRESPH15 VacantTrans Housing Vacant units - for rent, for sale, rented/sold but not occupied SRESPH16 VacantSeas Housing Vacant units - seasonal SRESPH17 VacantMigr Housing Vacant units - migrant workers SRESPH18 %Renter Housing % Renter-occupied units SRESPH19 %Vacant Housing % Vacant units SRESPH20 %Season Housing % Vacant units - seasonal SRESPH21 PopOcc Population Population in occupied housing units SRESPH22 OwnerPop Population Population in owner-occupied units SRESPH23 RenterPop Population Population in renter-occupied units SRESPH24 HHAvgSize Household Average household size in occupied housing units SRESPH25 OwnerAvg Household Average household size in owner-occupied units SRESPH26 RenterAvg Household Average household size in renter-occupied units SRESPH27 SFUnits Housing Single-family units SRESPH28 MFUnits Housing Multi-family units SRESPH29 MHomes Housing Mobile homes SRESPH30 BoatsRVs Housing Boats, RVs, vans, etc. SRESPH31 OccSF Housing Occupied single-family units SRESPH32 OccMF Housing Occupied multi-family units SRESPH33 OccMH Housing Occupied mobile homes SRESPH34 OccBoats Housing Occupied boats, RVs, vans, etc. SRESPH35 SFSize Household Average household size in occupied single-family units SRESPH36 MFSize Household Average household size in occupied multi-family units SRESPH37 MHSize Household Average household size in occupied mobile homes SRESPH38 BRVSize Household Average household size in occupied boats, RVs, vans, etc. SRESPH39 %VacSF Housing % Vacant - Single-family units SRESPH40 %VacMF Housing % Vacant - Multi-family units SRESPH41 %VacMH Housing % Vacant - Mobile homes SRESPH42 %VacBRVs Housing % Vacant - Boats, RVs, vans, etc. SRESPH43 NoVehicle Household Households with no vehicle available SRESPH44 AvgVehicles Household Average number of vehicles per household SRESPH45 AvgVehOwn Household Average number of vehicles per owner-occupied household SRESPH46 AvgVehRen Household Average number of vehicles per renter-occupied household Methodology and Support Documentation Page III-6
103 Variable Field Name Universe Description Person Indicators SRESPP06 AreaLand Geography Land Area (square miles) SRESPP07 AreaWater Geography Water Area (square miles) SRESPP08 Density Population Population per gross square mile (land + water) SRESPP09 POP100 Population Total Resident Population from the 100% Count SRESPP10 HU100 Population Total Housing Units from the 100% Count SRESPP11 WhiteNH Population White alone, not Hispanic or Latino SRESPP12 BlackNH Population Black or African American alone, not Hispanic or Latino SRESPP13 OtherNH Population Other race alone and two or more races, not Hispanic or Latino SRESPP14 Hispanic Population Hispanic or Latino (all races) SRESPP15 %BlackNH Population % Black or African American alone, not Hispanic or Latino SRESPP16 %OtherNH Population % Other race alone and two or more races, not Hispanic or Latino SRESPP17 %Hispanic Population % Hispanic or Latino (all races) SRESPP18 Age<5 Population Age under 5 years SRESPP19 Age5to17 Population Age 5 to 17 years SRESPP20 Age18to24 Population Age 18 to 24 years SRESPP21 Age25to34 Population Age 25 to 34 years SRESPP22 Age35to44 Population Age 35 to 44 years SRESPP23 Age45to54 Population Age 45 to 54 years SRESPP24 Age55to64 Population Age 55 to 64 years SRESPP25 Age65to74 Population Age 65 to 74 years SRESPP26 Age75to84 Population Age 75 to 84 years SRESPP27 Age85+ Population Age 85 years and over SRESPP28 %Age<5 Population % Age under 5 years SRESPP29 %Age<18 Population % Age under 18 years SRESPP30 %Age65+ Population % Age 65 years and over SRESPP31 %Age85+ Population % Age 85 years and over SRESPP32 FamilyPop Population Population in family households SRESPP33 NonFamPop Population Population in nonfamily households SRESPP34 LiveAlone Population Living alone SRESPP35 GQInst Population Institutionalized population in group quarters SRESPP36 GQNonInst Population Noninstitutionalized population in group quarters SRESPP37 %NonFam Population % Population in nonfamily households SRESPP38 %GQ Population % Population in group quarters SRESPP39 %GQInst Population % Instituionalized population in group quarters SRESPP40 Alone65+ Population Population that is 65 years and over and is living alone % of the population that is 65 years and over and is SRESPP41 %Alone65+ Population living alone SRESPP42 SpeakEng Households Speak English SRESPP43 SpeakSpa Households Speak Spanish SRESPP44 SpeakOth Households Speak other languages SRESPP45 LingIsoSpa Households Linguistically isolated - Spanish Methodology and Support Documentation Page III-7
104 Variable Field Name Universe Description SRESPP46 LingIsoOth Households Linguistically isolated - other languages SRESPP47 %LingIso Households % Linguistically isolated SRESPP48 NativeFl Population Native - Born in state of residence SRESPP49 NativeUS Population Native - Born in other state in the United States SRESPP50 NativeNUS Population Native - Born outside the United States SRESPP51 ForBornCit Population Foreign born - Naturalized citizen SRESPP52 ForBornNCit Population Foreign-born - Not a citizen SRESPP53 %Foreign Population % Foreign-born SRESPP54 %NCitizen Population % Not a citizen SRESPP55 CivilPop5+ Population Civilian noninstitutionalized population, 5 years and older SRESPP56 Disab5to15 Population Civilian noninstitutionalized population with a disability, 5 to 15 years Civilian noninstitutionalized population with a disability, SRESPP57 Disab16to20 Population 16 to 20 years Civilian noninstitutionalized population with a disability, SRESPP58 Disab21to64 Population 21 to 64 years Civilian noninstitutionalized population with a disability, SRESPP59 Disab65to74 Population 65 to 74 years SRESPP60 Disab75+ Population Civilian noninstitutionalized population with a disability, 75 and over SRESPP61 %wdisability Population % Civilian noninstitutionalized population with a disability SRESPP62 %Disab65+ Population % Civilian noninstitutionalized population with a disability, 65+ SRESPP63 LaborForce Population Population 16 years and over in labor force SRESPP64 ArmedForce Population In armed forces SRESPP65 Employed Population Civilian employed SRESPP66 Unemployed Population Civilian unemployed SRESPP67 NLabForce Population Population 16 years and over not in labor force SRESPP68 %Unemp Population % Unemployed SRESPP69 %LabForce Population % In labor force (Labor Force Participation Rate) SRESPP70 MedianHHY Population Median household income in 1999 SRESPP71 PerCapitaY Population Per capita income in 1999 SRESPP72 PovDeterm Population Population for whom poverty status is determined SRESPP73 BelowPov Population Population with income in 1999 below poverty level SRESPP74 Pov<18 Population Population under 18 years of age below poverty level SRESPP75 Pov65+ Population Population 65 years of age and over below poverty level SRESPP76 %BelowPov Population % of total population with income in 1999 below poverty level SRESPP77 %Pov<18 Population % of population under 18 years of age below poverty level SRESPP78 %Pov65+ Population % of population 65 years of age and over below poverty level Methodology and Support Documentation Page III-8
105 Fiel d # Table III-2 Recommended Fields for Preparation of Small Area Data Baseline Data for 2006 Field Name Description 0 REGTAZ Unique ID for each geographic unit (TAZ or Census Block Group) 1 DSSB_06 Total Dwelling Unit Site-Built Homes Single Family (optional) 2 DMSB_06 Total Dwelling Unit Site-Built Homes Multi-Family (optional) 3 DTSB_06 Total Dwelling Unit Site-Built Homes Total 4 PCSSO_06 Percent of Site-Built Homes Occupied during Hurricane Season Single Family (optional) Percent of Site-Built Homes Occupied during Hurricane Season Multi-Family (optional) 5 PCMSO_06 6 PCTSO_06 Percent of Site-Built Homes Occupied during Hurricane Season Total 7 ODSSB_06 Occupied Site-Built Homes Single Family (optional) 8 ODMSB_06 Occupied Site-Built Homes Multi-Family (optional) 9 ODTSB_06 Occupied Site-Built Homes Total 10 PHSSB_06 Persons per Occupied Site-Built Home Single Family (optional) 11 PHMSB_06 Persons per Occupied Site-Built Home Multi-Family (optional) 12 PHTSB_06 Persons per Occupied Site-Built Home Total 13 PSSB_06 Population in Site-Built Homes Single Family (optional) 14 PMSB_06 Population in Site-Built Homes Multi-Family (optional) 15 PTSB_06 Population in Site-Built Homes Total 16 VHSSB_06 Vehicles per Occupied Site-Built Home Single Family (optional) 17 VHMSB_06 Vehicles per Occupied Site-Built Home Multi-Family (optional) 18 VHTSB_06 Vehicles per Occupied Site-Built Home Total 19 VSSB_06 Vehicles in Site-Built Homes Single Family 20 VMSB_06 Vehicles in Site-Built Homes Multi-Family 21 VTSB_06 Vehicles in Site-Built Homes Total 22 D_MB_06 Total Dwelling Unit Mobile Homes PC_MO_06 Percent of Mobile Homes Occupied during Hurricane Season O_MB_06 Occupied Mobile Homes PH_MO_06 Persons per Occupied Mobile Home P_MB_06 Population in Mobile Homes VH_MB_06 Vehicles per Occupied Mobile Home V_MB_06 Vehicles in Mobile Homes HM_U_06 Hotel-Motel Units HM_O_06 Hotel-Motel Occupancy Rates HM_OU_06 Occupied Hotel-Motel Units HM_PH_06 Persons per Occupied Hotel-Motel Unit HM_P_06 Population in Hotel-Motel Units HM_VH_06 Vehicles per Hotel-Motel Unit HM_V_06 Vehicles in Hotel-Motel Units GQ_P_06 Population in Group Quarters in 2006 (only those that would participate in a general evacuation) Vehicles in Group Quarters in 2006 (only those that would participate in a general evacuation) 37 GQ_V_06 38 SH_CP_06 Shelter Capacity (Number of Persons) 2006 Methodology and Support Documentation Page III-9
106 Observations: 1 Please prepare a separate data file for each of the study years: 2006 (baseline), 2010 and The suffix on the field names in each data file should reflect the reference year (06, 10 or 15). 2 These fields should be used to present data by Traffic Analysis Zone (TAZ) or Census Block Group. 3 The breakout between single-family and multi-family site-built homes should be used if data is available for the county. Otherwise, use the lines for total site-built homes. 4 The total number of site-built homes, mobile homes or hotel-motel units should be the starting point. Multiply the total number of units by the occupancy rate (2000 Census) to get occupied units (households). Multiply occupied units by persons per household (2000 Census) to get the number of people. Multiply occupied units by vehicles per household (2000 Census) to get the number of vehicles. 5 The number of persons and vehicles per hotel-motel unit may be based on typical transportation assumptions if no better data is available. Methodology and Support Documentation Page III-10
107 CHAPTER IV SRESP SURGE INUNDATION MODEL TOOL METHODOLOGY A. Origins of Methodology Starting from the original documentation from the Hurricane Center explanation of the SLOSH Model, the following will explain the methodology and use of the SRES Surge Inundation Modeling Toolset. SLOSH Model methodology: (Red text references new comments added) Surge elevation, or water height, is the output of the SLOSH model. At each SLOSH grid point, the water height is the maximum value that was computed at that point. The water height is calculated relative to mean sea level of 1929 (this is now NAVD 1988), also referred to as National Geodetic Vertical Datum (NGVD NAVD88), and not relative to the ground elevation. Height of water above terrain is not calculated because terrain height varies within a SLOSH grid square. For example, the altitude of a 1-mile grid square may be assigned a value of 1.8 meters (6 feet), but this value represents an average of land heights that may include values ranging from 0.9 to 2.7 meters (3 to 9 feet). In this case, a surge value of 2.5 meters (8 feet) in this square, implying, a 0.7 meters (2 feet) average depth of water over the grid s terrain, would include some terrain without inundation and other parts with as much as 1.5 meters (5 feet) of overlying water. Therefore, the depth of surge flooding above terrain at a specific site in the grid square is the result of subtracting the actual terrain height from the modelgenerated storm surge height in that square. This is in fact what the surge modeling does subtract detailed terrain to get an inundation layer which is combined to form the surge zones. Another tool in the set actually performs this explained step to get the actual depth of inundation per storm category. It should be noted that, even if the SLOSH model is supplied accurate data, the computed surges may contain errors of 20 percent of observed water levels. - Will Shaffer, National Weather Service (1991) What we needed for this project was a consistent uniform methodology to develop surge zones all across the state following the established steps, in a relatively short amount of time. The Tampa Bay region has been doing this type of surge analysis and Storm Tide Atlases since The 2000 Atlas was the first atlas to use GIS automation to develop surge zones. This was done using the new (at the time) ArcView product from ESRI and the Avenue development language. ArcGIS was used previously on a SUN workstation using AML language, but not in a completely encapsulated process. This was developed further in the 2005 Hurricane Evacuation Update. In the earlier days during the workstation Arc/Info days, the processing was completely fulfilled in the vector realm. The 2000 Update heralded the first raster based update for one of Tampa Bay region s counties. This was due to the delivery of LIDAR elevation data from a pilot project from the University of Florida. The raw data points were interpolated into detailed ESRI GRID Methodology and Support Documentation Page IV-1
108 format at a horizontal pixel resolution of 3 meters. The processing for Pinellas County was then processed in the raster realm and converted to vector polygons at the end. The other three counties (Pasco and Manatee) were processed using interpolated vector hypsography from USGS 7.5 minute quadrangles. The 2005 Evacuation Update was completed with processing completely in the raster realm. All counties except Hillsborough used LIDAR for elevation. Hillsborough County was also processed in the same way, however this was with survey elevation data at larger horizontal posting spaces. For this current project ( ), automation was a primary concern as well as consistency. First, all the regions (11) in the state had to upgrade to at least ArcGIS 9.3 with the Spatial Analyst extension. Then the previous methodology using ArcView Avenue code had to be ported to Visual Basic for Applications (VBA) to run inside the ArcMap session (this was done at the beginning of 2008). The objectives: Almost push-button completion of surge zone creation Flexibility with raster cell sizes Flexibility with using or not using Tropical Storms Flexibility with respect to Ocean-borne or Lake-borne surge (Okeechobee) Multiple tools to help the regional GIS modeler Choice of using VBA for the development language was easy. The fact it can be debugged and runs inside ArcMap makes troubleshooting fairly straightforward. This Toolset will be ported to.net or Python, but at the time-being, it is being used in ArcMap as an empty MXD with the toolbar pre-existing. This was by-far the easier way to distribute amongst the Regional Planning Councils. B. Surge Inundation Model Tool This is by far the most important tool in the Toolset the Surge Inundation Modeler (SIM). Once one has the elevation raster (digital elevation model DEM) and the SLOSH MOM basin (vector polygons), and the water surge source layer (vector polygons), processing can begin on the surge zones for creating your Storm Tide Atlas. Perhaps an explanation here about vector and raster processing, is in order. Vectors in the GIS world are either lines (polylines) or polygons. Rasters are the same technology as an image file, with pixels making up the complete image or file. The default raster format for ESRI products is the ESRI GRID format. Another format is the point, which is neither raster or vector, by nature. In fact, the point is really the bridge between the vector and raster format as a centroid of a polygon can be interpolated into a raster file. The Surge Inundation Modeling Toolset uses a windowed interface to ease the choices that need to be made in the surge modeling process. Methodology and Support Documentation Page IV-2

109 At the top are changeable options like output folder and raster cell size. On the bottom half are the processing steps and the One Step to run all unattended. This window allows for each step to be run individually or with one gesture to run unattended. Tool was originally set up this way for troubleshooting and debugging, it turns out it has come in handy for various issues that have been encountered throughout the state. The plan was to select areas to process and then join them together later. This presented itself as fairly tedious and by omitting those polygon joins afterward, the process becomes that much faster. In its original inception, Step 2 was necessary to create polygon footprints of areas that would be joined at a later time. A fast way to determine the extent of the area selected. The steps were originally kept for the reason of making depth layers, which would use Step 4 and the raster calculator. This has since become obsolete because of the addition of a completely separate Depth Tool. The future version of this Toolset with have an abbreviated list of steps in the window. These steps are still very useful for troubleshooting and recovery, however. The areas around the state have varying terrain and landforms. Many large counties like Miami-Dade had to be completed using the Steps as the One Step method bailed due to sheer number of polygons (the raster processing was at 5ft cell size) due to the conversion of raster to polygons. Because of development in VBA, the code was adapted after this to accommodate larger county size. Methodology and Support Documentation Page IV-3

110 C. Underneath the Methodology As stated in the first paragraph in this document, the SLOSH basins developed by the Hurricane Center (NOAA) use average values in their calculations for the terrain underneath the basin grid squares. One can view the basin SLOSH surge results alone in the SLOSH Display Program and see the results of that averaged terrain in the basin displayed on the screen. Figure IV-1 SLOSH Display output At a scale that is multi-county wide, or for a whole coastal state, the SLOSH Display program using the raw values in the basin is visually acceptable. If you need to zoom in for inundation at a city or block scale, you need something that will delineate inundation with the terrain. How do we get this? As mentioned in that first paragraph, the way to get depth of the surge is to subtract the elevation out of the raw basin surge values. This brings back the resolution that may or may not have been there in the first place. Because this study was commissioned with new elevation data (LIDAR) as part of its scope of work, the raw data going into the NOAA SLOSH model is actually derived from this improved elevation data. Even with less resolution data with interpolated 5ft contours or low resolution DEM, subtracting out these points, lines, rasters can be a marked improvement over the SLOSH basin averaged values as-is. Methodology and Support Documentation Page IV-4


 is not available for subtraction with elevation, so there is squared of boundaries of no surge.")
111 If we were to use the SLOSH basin data as-is, we might get something that looks like this for inundation: Since we all know that water and surge does not flow in squared off blocks, we definitely want to opt for something that at least looks like it flows as water. The way we do that is to interpolate those averaged values so there is a smooth variation when processing. This is just a matter of taking the centroids 1 of the MOM polygons and creating a surface that approximates the top of the surge surface. In the example below, the image on the left is what the SLOSH values in their raw form would produce here 99.9 (dry) is not available for subtraction with elevation, so there is squared of boundaries of no surge. The image on the right is what we get with interpolation with modeling calculations, where it actually hugs the coastline as it should. 1 Point that is the geographic center of a polygon Methodology and Support Documentation Page IV-5
112 So just what happens? Here is a simplified listing of what the process actually does once it is started: 1. SLOSH basin Squares (polygons) are selected for processing 2. Centroids for the selected polygons are created with SLOSH values 3. Values that are dry (99.9) are marked for change 4. Marked polygons are calculated with average of adjacent wet polygons 5. Selected Centroids are interpolated into raster surface using Spline interpolation 6. DEM raster is subtracted from SLOSH surface raster 7. Noise reduction is performed to eliminate small slivers and pockets of dry area 8. The reduced polygon output from the raster is dissolved by like inundated polygons 9. The water feature which simulates surge potential source is buffered 10. The surge polygon features are selected by buffered water to get contiguous polys 11. Contiguous polygons are exported to become the inundation layer for that category 12. When all storm categories are processed, they are combined together 13. The resultant combination shapefile is coded for all the category storms 14. The complete surge zone shapefile is symbolized on the display with approved colors Here is an excerpt from a portion of zone creation VBA code in the processing: That code above is between step 9 and 10, and was inserted into SIM in case selected SLOSH grid squares are far inland without intersecting surge source (Gulf, Atlantic, Intracoastal, and rivers). It was necessary because only contiguous inundated surge polygons are used, and inland selections may not intersect with surge source water features. Normally, the whole county is selected at once which negates the use of the above code. Methodology and Support Documentation Page IV-6


113 Step 4 may be an interesting step to elaborate on further. When one interpolates data, the interpolation method is important and can create different results. The IDW method is primarily good for getting an interpolation of a number of data points like temperatures and other nontangible values to create visualization. The Spline method is good for data that tends to be smooth like flat terrain or water features. Since we are modeling water features (surge), spline interpolation is just what is needed. The particular type of spline interpolation for this process is the tension version. In spline tension interpolation, by the nature of its definition, the surface has to intersect with the point creating that particular surface area in the immediate vicinity. Therefore, the Centroids of the category SLOSH values will have the resulting raster surface with the exact value where it originally was. If one were to interpolate the surface without any dry polygons or their Centroids, the spline surface will try to interpolate the missing data based on the most recent point values and trend towards the missing area. The problem of just selecting wet value polygons and interpolating with Inverse Distance Weighted (IDW), is that there is nothing stopping the interpolation engine from trending onward continuously, or worse, trending upward if it seems to be trending in that direction. In other words, if the terrain was relatively flat and got lower in elevation inland, the IDW model could have surge flowing forever. The SIM interpolation method with spline tension, forces the values to be exactly what the SLOSH basin values are at the centroid area, as modeled by NOAA. Beyond those areas where there not supposed to be surge, the SIM tool calculates the dry values to trend lower the same as gravity and momentum would interact with flowing water. The images below show the difference. First with the actual selected inundated SLOSH Centroids, and then what the output of interpolated SLOSH height would be with IDW, and then the SIM tool output using spline interpolation. This is done in step 4 from the list above (not step 4 in the Tool), we take the average of the surrounding non-dry SLOSH basin grid squares which smoothes and reduces the values the further away one gets from surge source. If you notice, we use the term SLOSH grid square, instead of SLOSH grid cell. This is because for the confusion it may cause because we are dealing with raster files and technology, in which pixels are sometimes described as cells. Methodology and Support Documentation Page IV-7
114 Figure IV-2 Surge Inundation Model Tool Flowchart Select your basin area SLOSH Polygon Input Data = Green Output Data = Yellow SRES Surge Tool Category Zone Module Choose Output Folder Choose Raster Cell Size Tide: Mean or High Calc Mean, Max & Min of Selected Replace with Min-(0.075*Min) Calc Average of Surrounding SLOSH Grids Yes Calc Model Values Iterate Thru Each SLOSH Grid Square Dry (99.9)? No Replace with SLOSH Value SLOSH Surface Raster Interpolate to Raster using Spline Tension Create Centroids From SLOSH Basin DEM Raster Subtract DEM From SLOSH Apply Majority Filter Export to Polygons Initial Surge Polys Per Category Sea/Surge Source Polys Buffer Outside of Sea Polys by 50 Feet Select by Location Surge That Intersects Buffered Sea Select Surge: Value = 1 Dissolve by Value Reduce Noise: Absorb Area < 0.25 Acre Contiguous Surge Polygons To Cat Layer Combine Methodology and Support Documentation Page IV-8
115 From Zone Module Cat 3 Cat 1 Union Cat plus Next Highest Cat Cat 1_2 Union Cat plus Next Highest Cat Cat 1_3 Cat 2 Cat 4 Union Cat plus Next Highest Cat Finished Displayed Surge Apply Defined Symbol Renderer Cat 1_4 Dissolve by Cat Singlepart Cat 5 Union Cat plus Next Highest Cat Select and Fill Cat Field with Associated Cat Number Add Cat Field Cat 1_5 Methodology and Support Documentation Page IV-9
116 This page intentionally left blank. Methodology and Support Documentation Page IV-10


117 CHAPTER V GEODATABASE DESIGN AND METHODOLOGY A. Introduction Gathering data and assembling it for separate agencies that will be part of a statewide project needs some sort of direction and format. To that end, a structured data schema and standards was developed for this project. Since this project has been in existence with earlier update versions from various Regional Planning Councils in the past, the use of relevant data with GIS is not a new concept and the various components were needed before. The challenge came from the project lasting about 3 years. In that time, data had evolved and data sources had changed. There were many areas in this project where data schema and makeup was dictated by the deliverables in the scope. The rest of the data could be considered ancillary or supplemental to support the core data. An example of this was the thrust towards the transportation analysis element. Small area data structures had to be designed to be homogenous across the state even though the sources would be different (TAZ vs. Census Block Group). These data structures fed directly into the transportation dataset with particular data elements. Figure V-1: Typical Data Flow Process Diagram Methodology and Support Documentation Page V-1

118 B. Core GIS Data Components The core GIS data components for this Study centered on Transportation and Vulnerability. As mentioned above, the transportation analysis used data from each region that was derived from small area population and demographic data. Because of this, demographic data was assembled into a schema using the best data available, which in most cases began with Census data, which was updated. The other component was vulnerability, which included FEMA NFIP data, Department of Agriculture Forestry and Fire data, and most importantly the modeled surge data derived from NOAA SLOSH data. The support or supplemental data sets included National Hydrological data from USGS, Wind data from FEMA HAZUS, FDOT Highway and Street data, and even NOAA Tornado touchdown data. C. Shelter Data Components In the first year of the Study, data gathering and assembling was an important element for this process. One such task was compiling shelter data from all the counties. This data had to be linked to a GIS point file for further use in vulnerability analysis at a later date. The data overlapped current efforts by the Emergency Management departments of the counties, so a format that utilized or mimicked the existing efforts was paramount. Another necessity was providing the data in a format usable to all the departments needed to fill it out. Not every Emergency Management department in the state had GIS capability. As a result, an elaborate export, distribution, and re-import process was developed to allow end-users the ability to use Excel spreadsheets. This involved the sharing function built-in to Excel, so multiple users can add and contribute to the spreadsheet and then the additions/changes can be merged back into the spreadsheet. Then the returned spreadsheet data would be merged back into a master data table which was joinable to the shelter point file (file Geodatabase). Because the Study involved eleven separate agencies (Regional Planning Councils) working as one, it was important to be using the same version of GIS software. The reason for this was there were changes in the versions of ESRI s ArcGIS software during this three-year period. Both the Geodatabase structure was changed/updated and the MXD (Mapping document) structure and format had changed. In the case of a planning council using version 9.0 or 9.1 (for instance), they would not be able to open a version 9.3 MXD document. We had to upgrade to the latest version of ArcGIS software as soon as 9.3 became available (which was in the second year of the project). D. Future Land Use Data Components One deliverable for the project was the Future Land Use for the state of Florida by region. To create a Geodatabase that encompassed vastly different areas of a state with local governments in various states of technology sophistication (read: GIS), this process proved daunting. A look-up table walkthrough was developed through consensus that would enable Methodology and Support Documentation Page V-2
119 the compositing of different sources and ideologies. The land use categories had to be boiled down to their least common denominator roots. The Florida Department of Community Affairs wanted this data re-traceable back to the source governments as much as humanly possible. To this end, we did not perform any dissolving in assembling our regional FLU profiles. Since this Geodatabase was a deliverable so early in the project, it was developed as a separate data set. E. Critical Facilities Data Components Critical facilities, which was a point data set, and used for vulnerability analysis, was an example of a dataset format used as it was developed and just corrected/updated. This data was designed by and delivered back to Florida Division of Emergency Management (FDEM). This data also went through an eveolution of sorts, due to technology changes and upgrades. The final updated source from FDEM came as an SDE data set. This, in turn, where applicable and possible was corrected and updated by the RPC in their region and returned. F. Data Collaboration and Updates A note here about deliverables and updates: Due to the long time span of this project, it was determined early on that a means to exchange data as soon as possible for sharing and review. This was accomplished in two ways. A project Sharepoint site was developed for meeting and document sharing and review. And for the data uploads and sharing, a private FTP site was created so data that was too large for s could be uploaded and downloaded. This became the mandatory method to exchange data sets after it was found to be so useful. In this way, even though FDEM was the agency we ultimately finished the project for, we were working side-by-side with data exchanges and updates years before the final deliverables were due. Figure V-2 Regional Geodatabase Schema Methodology and Support Documentation Page V-3
120 G. Vulnerability Data Components The bulk of the data used for this project came under the category of Vulnerability Analysis. Here is where the development of the surge zones which led to the evacuation zones, and transportation evacuation zones, etc. could be found. When working with so many polygon or point files, it really is best to combine the data sets into a Geodatabase. For this project, the database model wasn t dictated to be in a certain type of Geodatabase (file vs. personal vs. SDE), but it did have to conform to the basic schema outline as shown in Figure V-2, above. Creating the maps for the document and the Atlas plates were dramatically easier when utilizing the Geodatabase for the layer sources. Future updates to the data will be easier because of the database format as well. The following pages are exhibits, more-or-less describing the different examples of the geodatabase structures used in this project. Methodology and Support Documentation Page V-4
121 Exhibit A Geodatabase Designer Developed by The Applications Prototype Lab, ESRI Redlands Schema Creation Creation Date :08:00 Creator marsh on IT-GIS Geodatabase Workspace Type Personal Flavor Access Version Connection Properties DATABASE G:\project\hurricane\SRES_TB\SRES_maps\tbrpc\TBRPC_FLU.gdb ObjectClasses Spatial References Table Of Contents Listing of Tables and FeatureClasses. Listing of Standalong and FeatureDataset Spatial References. Back to Top Object Classes ObjectClass Name Type Geometry Subtype TBRPC Regional_Ply FeatureClass Polygon - Stand Alone ObjectClass(s) FLU_Summary Table - - SR Back to Top FLU_Summary Alias FLU_Summary Dataset Type Table FeatureType - Field Name Alias Type Precn.ScaleLengthEdit Null Req. Domain Fixed OBJECTID OBJECTID OID No No Yes No Local_FLU Local_FLU String Yes Yes No No Cnt_Local_ Cnt_Local_ Integer Yes Yes No No RPC_Code RPC_Code String Yes Yes No No State_Code State_Code String Yes Yes No No St_Descrip St_Descrip String Yes Yes No No Subtype Name Default Value Domain Methodology and Support Documentation Page V-5
122 ObjectClass Index Name Ascending Unique Fields FDO_OBJECTID Yes Yes OBJECTID Back to Top Regional_Ply Alias Regional_Ply Dataset Type FeatureClass FeatureType Simple Geometry:Polygon Average Number of Points:0 Has M:No Has Z:No Grid Size:9000 Field Name Alias Type Precn. Scale Length Edit Null Req. Domain Fixed OBJECTID OBJECTID OID No No Yes No Shape Shape Geometry Yes Yes Yes No FLUCODE FLUCODE String Yes Yes No No ID ID Integer Yes Yes No No SqMiles SqMiles Single Yes Yes No No Acres Acres Single Yes Yes No No Juris Juris String Yes Yes No No FIPS FIPS String Yes Yes No No Local_FLU Local_FLU String Yes Yes No No RPC RPC String Yes Yes No No State State String Yes Yes No No SRES_ID SRES_ID String Yes Yes No No Descrip Descrip String Yes Yes No No Subtype Name Default Value Domain ObjectClass Index Name Ascending Unique Fields FDO_OBJECTID Yes Yes OBJECTID FDO_Shape Yes No Shape Back to Top Methodology and Support Documentation Page V-6
123 Spatial References Dimension Minimum Precision TBRPC X Y M Z Coordinate System Description PROJCS["NAD_1983_UTM_Zone_17N",GEOGCS["GCS_North_American_1983",DATUM["D_North_American_1983",SPHEROID["GRS_1980", , ]],PRIMEM["Greenwich",0.0],UNIT["Degree", ]],PROJECTION["Transverse_Mercator"],PARAMETER["False_Eastin g", ],parameter["false_northing",0.0],parameter["central_meridian",- 81.0],PARAMETER["Scale_Factor",0.9996],PARAMETER["Latitude_Of_Origin",0.0],UNIT["Meter",1.0]] Back to Top Geodatabase Designer is prototype application and is not supported by ESRI. The commands assoicated with this application and the output generated by those commands are not to be used in a production environment. ESRI is not reponsible for errors, ommission or any damages resulting from the use of these commands and associated output. Use of this application is conditional on the acceptance of this statement. Methodology and Support Documentation Page V-7
124 Exhibit B Geodatabase Designer Developed by The Applications Prototype Lab, ESRI Redlands Schema Creation Creation Date :14:02 Creator marsh on IT-GIS Geodatabase Workspace Type Personal Flavor Version Connection Properties DATABASE Access G:\project\hurricane\2009\CFI\CriticalFacilities_Export_Full.mdb Domains ObjectClasses Spatial References Table Of Contents Listing of Coded Value and Range Domains. Listing of Tables and FeatureClasses. Listing of Standalong and FeatureDataset Spatial References. Back to Top Domains Domain Name Owner Domain Type BOOLEAN Coded Value COUNTY_FIPS Coded Value EMER_FUNCTION Coded Value FACILITY_TYPE Coded Value SHELTER_TYPE Coded Value STATUS Coded Value Back to Top BOOLEAN Owner Description Domain Type Field Type Merge Policy Split Policy Boolean Coded Value String Default Value Default Value Methodology and Support Documentation Page V-8
125 Domain Members Name Value YES YES NO NO Associations ObjectClass Subtype Field CFI_DBO_Shelters - ARC_4496 CFI_DBO_Shelters - General_ CFI_DBO_Shelters - PetFriendly CFI_DBO_Shelters - SpecialNeeds Back to Top COUNTY_FIPS Owner Description Official FIPS Code and County Name - Domain Type Coded Value Field Type String Merge Policy Default Value Split Policy Default Value Domain Members Name Value ALACHUA 001 BAKER 003 BAY 005 BRADFORD 007 BREVARD 009 BROWARD 011 CALHOUN 013 CHARLOTTE 015 CITRUS 017 CLAY 019 COLLIER 021 COLUMBIA 023 DESOTO 027 DIXIE 029 DUVAL 031 ESCAMBIA 033 FLAGLER 035 FRANKLIN 037 GADSDEN 039 GILCHRIST 041 GLADES 043 GULF 045 HAMILTON 047 HARDEE 049 Methodology and Support Documentation Page V-9
126 HENDRY 051 HERNANDO 053 HIGHLANDS 055 HILLSBOROUGH 057 HOLMES 059 INDIAN RIVER 061 JACKSON 063 JEFFERSON 065 LAFAYETTE 067 LAKE 069 LEE 071 LEON 073 LEVY 075 LIBERTY 077 MADISON 079 MANATEE 081 MARION 083 MARTIN 085 MONROE 087 NASSAU 089 OKALOOSA 091 OKEECHOBEE 093 ORANGE 095 OSCEOLA 097 PALM BEACH 099 PASCO 101 PINELLAS 103 POLK 105 PUTNAM 107 ST. JOHNS 109 ST. LUCIE 111 SANTA ROSA 113 SARASOTA 115 SEMINOLE 117 SUMTER 119 SUWANNEE 121 TAYLOR 123 UNION 125 VOLUSIA 127 WAKULLA 129 WALTON 131 WASHINGTON 133 DADE 025 MIAMI-DADE 086 Associations ObjectClass Subtype Field CFI_DBO_Communications - County CFI_DBO_Community_Resources - County CFI_DBO_Correctional_Facilities - County Methodology and Support Documentation Page V-10
127 CFI_DBO_Education - County CFI_DBO_Emergency_Services - County CFI_DBO_Energy - County CFI_DBO_Hazardous_Materials - County CFI_DBO_HealthCare_Facilities - County CFI_DBO_Infrastructure - County CFI_DBO_Logistics - County CFI_DBO_Military - County CFI_DBO_Shelters - County CFI_DBO_Transportation - County Back to Top EMER_FUNCTION Owner Description Emergency Function Domain Type Coded Value Field Type String Merge Policy Default Value Split Policy Default Value Domain Members Name Value COMMUNITY RESOURCES CR EDUCATION ED ENERGY ENR EMERGENCY SERVICES ES GOVERNMENT FACILITIES GOV HUMAN SERVICES HS INFRASTRUCTURE INF COMMUNICATIONS IT LOGISTICAL LOG MILITARY MIL PUBLIC HEALTH PB PUBLIC SAFETY PS TRANSPORTATION TRN Associations ObjectClass Subtype Field CFI_DBO_Communications - Emer_Function CFI_DBO_Community_Resources - Emer_Function CFI_DBO_Correctional_Facilities - Emer_Function CFI_DBO_Education - Emer_Function CFI_DBO_Emergency_Services - Emer_Function CFI_DBO_Energy - Emer_Function CFI_DBO_Hazardous_Materials - Emer_Function CFI_DBO_HealthCare_Facilities - Emer_Function CFI_DBO_Infrastructure - Emer_Function CFI_DBO_Logistics - Emer_Function Methodology and Support Documentation Page V-11
128 CFI_DBO_Military - Emer_Function CFI_DBO_Shelters - Emer_Function CFI_DBO_Transportation - Emer_Function Back to Top FACILITY_TYPE Owner Description Facility Type Domain Type Coded Value Field Type String Merge Policy Default Value Split Policy Default Value Domain Members Name Value ADULT FAMILY CARE HOME 52 AIRPORT AMBULATORY SURGICAL CENTER 14 ASSISTED LIVING FACILITY 11 ATTRACTION CALL CENTER CLINICAL LABORATORY 26 COAST GUARD COLLEGE COMMERCIAL PORTS COMMUNITY CENTER CORRECTIONAL FACILITY CRISIS STABILIZATION 17 UNIT DISASTER RECOVERY CENTER DISASTER RECOVERY CENTER-MOBILE ELECTRIC POWER PLANT ELECTRIC SUBSTATION EMERGENCY MEDICAL SERVICE EMERGENCY OPERATIONS CENTER END-STAGE RENAL DISEASE 18 FAITH-BASED FACILITY FIRE STATION Methodology and Support Documentation Page V-12
129 FUEL FACILITY - ALONG EVACUATION ROUTE FUEL FACILITY - DOT HAZARDOUS MATERIALS FACILITY HELIPORT/HELIPAD HOSPICE 22 HOSPITAL 23 HOSPITALS- VA 24 INTERMEDIATE CARE FACILITY 25 LAW ENFORCEMENT LIBRARY LOCAL GOVERNMENT FACILITY LOGISTICAL STAGING AREA MAJOR INTERSECTION NATIONAL GUARD NUCLEAR POWER PLANT POINT OF DISTRIBUTION PRIVATE SCHOOL PUBLIC SCHOOL PUBLIC WATER SUPPLY RADIO COMMUNICATIONS TOWER RELIEF AGENCY RESIDENTIAL TREATMENT FACILITY 32 SEAPLANE BASE SHELTER SKILLED NURSING FACILITY 35 SOLID WASTE FACILITY STADIUM STATE GOVERNMENT FACILITY TELEVISION TRANSITIONAL LIVING 34 FACILITY WASTEWATER FACILITY Associations ObjectClass Subtype Field Methodology and Support Documentation Page V-13
130 CFI_DBO_Communications - Facility_Type CFI_DBO_Community_Resources - Facility_Type CFI_DBO_Correctional_Facilities - Facility_Type CFI_DBO_Education - Facility_Type CFI_DBO_Emergency_Services - Facility_Type CFI_DBO_Energy - Facility_Type CFI_DBO_Hazardous_Materials - Facility_Type CFI_DBO_HealthCare_Facilities - Facility_Type CFI_DBO_Infrastructure - Facility_Type CFI_DBO_Logistics - Facility_Type CFI_DBO_Military - Facility_Type CFI_DBO_Shelters - Facility_Type CFI_DBO_Transportation - Facility_Type Back to Top SHELTER_TYPE Owner Description Shelter Types Domain Type Coded Value Field Type String Merge Policy Default Value Split Policy Default Value Domain Members Name Value HOST HOST GENERAL GENERAL RISK RISK SPECIAL NEEDS SPECIAL NEEDS PET FRIENDLY PET FRIENDLY EVACUATION EVACUATION MULTIPLE MULTIPLE Associations ObjectClass Subtype Field CFI_DBO_Shelters - SHELTER_TYPE Back to Top STATUS Owner Description Domain Type Field Type Merge Policy Split Policy Domain Members Name Status Coded Value String Default Value Default Value Value Methodology and Support Documentation Page V-14
131 OPEN OPEN CLOSED CLOSED Associations ObjectClass Subtype Field CFI_DBO_Shelters - Status Back to Top ObjectClasses ObjectClass Name Type Geometry Subtype Stand Alone ObjectClass(s) CFI_DBO_Communications FeatureClass Point - SR CFI_DBO_Community_Resources FeatureClass Point - SR CFI_DBO_Correctional_Facilities FeatureClass Point - SR CFI_DBO_Education FeatureClass Point - SR CFI_DBO_Emergency_Services FeatureClass Point - SR CFI_DBO_Energy FeatureClass Point - SR CFI_DBO_Hazardous_Materials FeatureClass Point - SR CFI_DBO_HealthCare_Facilities FeatureClass Point - SR CFI_DBO_Infrastructure FeatureClass Point - SR CFI_DBO_Logistics FeatureClass Point - SR CFI_DBO_Military FeatureClass Point - SR CFI_DBO_Shelters FeatureClass Point - SR CFI_DBO_Transportation FeatureClass Point - SR Group_Care_Facility_Types Table - - Hotel_Motel_Types Table - - Mobile_Home_RV_Parks_Types Table - - Back to Top CFI_DBO_Communications Alias Dataset Type CFI_DBO_Communications FeatureClass FeatureType Simple Geometry:Point Average Number of Points:0 Has M:No Has Z:No Grid Size:1000 Field Name Alias Type Precn.ScaleLengthEdit Null Req. Domain Fixed OBJECTID OBJECTID OID No No Yes Yes SHAPE SHAPE Geometry Yes Yes Yes Yes FeatureID FeatureID String Yes Yes No No GnisID GnisID Double Yes Yes No No Facility_Type Facility_Type String Yes Yes No No Methodology and Support Documentation Page V-15
132 Emer_Function Emer_Function String Yes No No No Name Name String Yes No No No Address Address String Yes No No No City City String Yes No No No County County String Yes Yes No No Zip Zip String Yes No No No Notes Notes String Yes Yes No No EditDate EditDate Date Yes Yes No No EditorName EditorName String Yes Yes No No X X Double Yes Yes No No Y Y Double Yes Yes No No USNG USNG String Yes Yes No No Subtype Name Default Value Domain ObjectClass Facility_Type FACILITY_TYPE Emer_Function EMER_FUNCTION County COUNTY_FIPS Index Name Ascending Unique Fields FDO_OBJECTID Yes Yes OBJECTID SHAPE_INDEX Yes Yes SHAPE Back to Top CFI_DBO_Community_Resources Alias Dataset Type CFI_DBO_Community_Resources FeatureClass FeatureType Simple Geometry:Point Average Number of Points:0 Has M:No Has Z:No Grid Size:1000 Field Name Alias Type Precn.ScaleLengthEdit Null Req. Domain Fixed OBJECTID OBJECTID OID No No Yes Yes SHAPE SHAPE Geometry Yes Yes Yes Yes FeatureID FeatureID String Yes Yes No No GnisID GnisID Double Yes Yes No No Facility_Type Facility_Type String Yes Yes No No Emer_Function Emer_Function String Yes No No No Name Name String Yes No No No Address Address String Yes No No No City City String Yes No No No County County String Yes Yes No No Zip Zip String Yes No No No Notes Notes String Yes Yes No No EditDate EditDate Date Yes Yes No No EditorName EditorName String Yes Yes No No X X Double Yes Yes No No Methodology and Support Documentation Page V-16
133 Y Y Double Yes Yes No No USNG USNG String Yes Yes No No Subtype Name Default Value Domain ObjectClass Facility_Type FACILITY_TYPE Emer_Function EMER_FUNCTION County COUNTY_FIPS Index Name Ascending Unique Fields FDO_OBJECTID Yes Yes OBJECTID SHAPE_INDEX Yes Yes SHAPE Back to Top CFI_DBO_Correctional_Facilities Alias Dataset Type CFI_DBO_Correctional_Facilities FeatureClass FeatureType Simple Geometry:Point Average Number of Points:0 Has M:No Has Z:No Grid Size:1000 Field Name Alias Type Precn.ScaleLengthEdit Null Req. Domain Fixed OBJECTID OBJECTID OID No No Yes Yes SHAPE SHAPE Geometry Yes Yes Yes Yes FeatureID FeatureID String Yes Yes No No GnisID GnisID Double Yes Yes No No Facility_Type Facility_Type String Yes Yes No No Emer_Function Emer_Function String Yes No No No Name Name String Yes No No No Address Address String Yes No No No City City String Yes No No No County County String Yes Yes No No Zip Zip String Yes No No No Notes Notes String Yes Yes No No EditDate EditDate Date Yes Yes No No EditorName EditorName String Yes Yes No No X X Double Yes Yes No No Y Y Double Yes Yes No No USNG USNG String Yes Yes No No Subtype Name Default Value Domain ObjectClass Facility_Type FACILITY_TYPE Emer_Function EMER_FUNCTION County COUNTY_FIPS Index Name Ascending Unique Fields FDO_OBJECTID Yes Yes OBJECTID SHAPE_INDEX Yes Yes SHAPE Back to Top Methodology and Support Documentation Page V-17
134 CFI_DBO_Education Alias Dataset Type CFI_DBO_Education FeatureClass FeatureType Simple Geometry:Point Average Number of Points:0 Has M:No Has Z:No Grid Size:1000 Field Name Alias Type Precn.ScaleLengthEdit Null Req. Domain Fixed OBJECTID OBJECTID OID No No Yes No Shape Shape Geometry Yes Yes Yes No FeatureID FeatureID String Yes Yes No No GnisID GnisID Double Yes Yes No No Facility_Type Facility_Type String Yes Yes No No Emer_Function Emer_Function String Yes Yes No No Name Name String Yes Yes No No Address Address String Yes Yes No No City City String Yes Yes No No County County String Yes Yes No No Zip Zip String Yes Yes No No Notes Notes String Yes Yes No No EditDate EditDate Date Yes Yes No No EditorName EditorName String Yes Yes No No X X Double Yes Yes No No Y Y Double Yes Yes No No USNG USNG String Yes Yes No No Subtype Name Default Value Domain ObjectClass Facility_Type FACILITY_TYPE Emer_Function County EMER_FUNCTION COUNTY_FIPS Index Name Ascending Unique Fields FDO_OBJECTID Yes Yes OBJECTID Shape_INDEX Yes Yes Shape Back to Top CFI_DBO_Emergency_Services Alias Dataset Type CFI_DBO_Emergency_Services FeatureClass FeatureType Simple Geometry:Point Average Number of Points:0 Has M:No Has Z:No Grid Size:1000 Field Name Alias Type Precn.ScaleLengthEdit Null Req. Domain Fixed OBJECTID OBJECTID OID No No Yes Yes SHAPE SHAPE Geometry Yes Yes Yes Yes FeatureID FeatureID String Yes Yes No No GnisID GnisID Double Yes Yes No No Facility_Type Facility_Type String Yes Yes No No Emer_Function Emer_Function String Yes No No No Methodology and Support Documentation Page V-18
135 Name Name String Yes No No No Address Address String Yes No No No City City String Yes No No No County County String Yes Yes No No Zip Zip String Yes No No No Notes Notes String Yes Yes No No EditDate EditDate Date Yes Yes No No EditorName EditorName String Yes Yes No No X X Double Yes Yes No No Y Y Double Yes Yes No No USNG USNG String Yes Yes No No Subtype Name Default Value Domain ObjectClass Facility_Type FACILITY_TYPE Emer_Function EMER_FUNCTION County COUNTY_FIPS Index Name Ascending Unique Fields FDO_OBJECTID Yes Yes OBJECTID SHAPE_INDEX Yes Yes SHAPE Back to Top CFI_DBO_Energy Alias Dataset Type CFI_DBO_Energy FeatureClass FeatureType Simple Geometry:Point Average Number of Points:0 Has M:No Has Z:No Grid Size:1000 Field Name Alias Type Precn.ScaleLengthEdit Null Req. Domain Fixed OBJECTID OBJECTID OID No No Yes Yes SHAPE SHAPE Geometry Yes Yes Yes Yes FeatureID FeatureID String Yes Yes No No GnisID GnisID Double Yes Yes No No Facility_Type Facility_Type String Yes Yes No No Emer_Function Emer_Function String Yes No No No Name Name String Yes No No No Address Address String Yes No No No City City String Yes No No No County County String Yes Yes No No Zip Zip String Yes No No No Notes Notes String Yes Yes No No EditDate EditDate Date Yes Yes No No EditorName EditorName String Yes Yes No No X X Double Yes Yes No No Y Y Double Yes Yes No No USNG USNG String Yes Yes No No Subtype Name Default Value Domain Methodology and Support Documentation Page V-19
136 ObjectClass Facility_Type FACILITY_TYPE Emer_Function EMER_FUNCTION County COUNTY_FIPS Index Name Ascending Unique Fields FDO_OBJECTID Yes Yes OBJECTID SHAPE_INDEX Yes Yes SHAPE Back to Top Methodology and Support Documentation Page V-20
137 CFI_DBO_Hazardous_Materials Alias Dataset Type CFI_DBO_Hazardous_Materials FeatureClass FeatureType Simple Geometry:Point Average Number of Points:0 Has M:No Has Z:No Grid Size:1000 Field Name Alias Type Precn.ScaleLengthEdit Null Req. Domain Fixed OBJECTID OBJECTID OID No No Yes Yes SHAPE SHAPE Geometry Yes Yes Yes Yes FeatureID FeatureID String Yes Yes No No Facility_Type Facility_Type String Yes Yes No No Emer_Function Emer_Function String Yes No No No Name Name String Yes No No No Address Address String Yes No No No City City String Yes No No No County County String Yes Yes No No Zip Zip String Yes No No No Notes Notes String Yes Yes No No EditDate EditDate Date Yes Yes No No X X Double Yes Yes No No Y Y Double Yes Yes No No USNG USNG String Yes Yes No No Facility_Desc Facility_Desc String Yes Yes No No USNG2 USNG2 String Yes Yes No No Subtype Name Default Value Domain ObjectClass Facility_Type FACILITY_TYPE Emer_Function EMER_FUNCTION County COUNTY_FIPS Index Name Ascending Unique Fields FDO_OBJECTID Yes Yes OBJECTID SHAPE_INDEX Yes Yes SHAPE Back to Top CFI_DBO_HealthCare_Facilities Alias Dataset Type CFI_DBO_HealthCare_Facilities FeatureClass FeatureType Simple Geometry:Point Average Number of Points:0 Has M:No Has Z:No Grid Size:1000 Field Name Alias Type Precn.ScaleLengthEdit Null Req. Domain Fixed OBJECTID OBJECTID OID No No Yes No Shape Shape Geometry Yes Yes Yes No FeatureID FeatureID String Yes Yes No No Methodology and Support Documentation Page V-21
138 GnisID GnisID Double Yes Yes No No Facility_Type Facility_Type String Yes Yes No No Emer_Function Emer_Function String Yes No No No Name Name String Yes Yes No No Address Address String Yes Yes No No City City String Yes Yes No No County County String Yes Yes No No Zip Zip String Yes Yes No No Notes Notes String Yes Yes No No EditDate EditDate Date Yes Yes No No EditorName EditorName String Yes Yes No No X X Double Yes Yes No No Y Y Double Yes Yes No No USNG USNG String Yes Yes No No Subtype Name Default Value Domain ObjectClass Facility_Type FACILITY_TYPE Emer_Function EMER_FUNCTION County COUNTY_FIPS Index Name Ascending Unique Fields FDO_OBJECTID Yes Yes OBJECTID Shape_INDEX Yes Yes Shape Back to Top CFI_DBO_Infrastructure Alias Dataset Type CFI_DBO_Infrastructure FeatureClass FeatureType Simple Geometry:Point Average Number of Points:0 Has M:No Has Z:No Grid Size:1000 Field Name Alias Type Precn.ScaleLengthEdit Null Req. Domain Fixed OBJECTID OBJECTID OID No No Yes Yes SHAPE SHAPE Geometry Yes Yes Yes Yes FeatureID FeatureID String Yes Yes No No GnisID GnisID Double Yes Yes No No Facility_Type Facility_Type String Yes Yes No No Emer_Function Emer_Function String Yes No No No Name Name String Yes No No No Address Address String Yes No No No City City String Yes No No No County County String Yes Yes No No Zip Zip String Yes No No No Notes Notes String Yes Yes No No EditDate EditDate Date Yes Yes No No EditorName EditorName String Yes Yes No No X X Double Yes Yes No No Methodology and Support Documentation Page V-22
139 Y Y Double Yes Yes No No USNG USNG String Yes Yes No No Subtype Name Default Value Domain ObjectClass Facility_Type FACILITY_TYPE Emer_Function EMER_FUNCTION County COUNTY_FIPS Index Name Ascending Unique Fields FDO_OBJECTID Yes Yes OBJECTID SHAPE_INDEX Yes Yes SHAPE Back to Top CFI_DBO_Logistics Alias Dataset Type CFI_DBO_Logistics FeatureClass FeatureType Simple Geometry:Point Average Number of Points:0 Has M:No Has Z:No Grid Size:1000 Field Name Alias Type Precn.ScaleLengthEdit Null Req. Domain Fixed OBJECTID OBJECTID OID No No Yes No Shape Shape Geometry Yes Yes Yes No FeatureID FeatureID String Yes Yes No No Facility_Type Facility_Type String Yes Yes No No Emer_Function Emer_Function String Yes Yes No No Name Name String Yes Yes No No Address Address String Yes Yes No No City City String Yes Yes No No County County String Yes Yes No No Zip Zip String Yes Yes No No Notes Notes String Yes Yes No No EditDate EditDate Date Yes Yes No No EditorName EditorName String Yes Yes No No X X Double Yes Yes No No Y Y Double Yes Yes No No USNG USNG String Yes Yes No No Status Status String Yes Yes No No Subtype Name Default Value Domain ObjectClass Facility_Type FACILITY_TYPE Emer_Function EMER_FUNCTION County COUNTY_FIPS Index Name Ascending Unique Fields FDO_OBJECTID Yes Yes OBJECTID Shape_INDEX Yes Yes Shape Methodology and Support Documentation Page V-23
140 Back to Top CFI_DBO_Military Alias Dataset Type CFI_DBO_Military FeatureClass FeatureType Simple Geometry:Point Average Number of Points:0 Has M:No Has Z:No Grid Size:1000 Field Name Alias Type Precn.ScaleLengthEdit Null Req. Domain Fixed OBJECTID OBJECTID OID No No Yes No Shape Shape Geometry Yes Yes Yes No FeatureID FeatureID String Yes Yes No No GnisID GnisID Double Yes Yes No No Facility_Type Facility_Type String Yes Yes No No Emer_Function Emer_Function String Yes Yes No No Name Name String Yes Yes No No Address Address String Yes Yes No No City City String Yes Yes No No County County String Yes Yes No No Zip Zip String Yes Yes No No Notes Notes String Yes Yes No No EditDate EditDate Date Yes Yes No No EditorName EditorName String Yes Yes No No X X Double Yes Yes No No Y Y Double Yes Yes No No USNG USNG String Yes Yes No No USNG2 USNG2 String Yes Yes No No Subtype Name Default Value Domain ObjectClass Facility_Type FACILITY_TYPE Emer_Function EMER_FUNCTION County COUNTY_FIPS Index Name Ascending Unique Fields FDO_OBJECTID Yes Yes OBJECTID Shape_INDEX Yes Yes Shape Back to Top Methodology and Support Documentation Page V-24
141 CFI_DBO_Shelters Alias CFI_DBO_Shelters Dataset Type FeatureClass FeatureType Simple Geometry:Point Average Number of Points:0 Has M:No Has Z:No Grid Size:1000 Field Name Alias Type Precn.ScaleLengthEdit Null Req. Domain Fixed OBJECTID OBJECTID OID No No Yes No Shape Shape Geometry Yes Yes Yes No RedCrossNSS_ID RedCrossNSS_ID Integer Yes Yes No No FeatureID FeatureID String Yes Yes No No Facility_Type Facility_Type String Yes Yes No No Emer_Function Emer_Function String Yes No No No Name Name String Yes Yes No No Address Address String Yes Yes No No City City String Yes Yes No No Countyid Countyid String Yes Yes No No County County String Yes Yes No No Zip5 Zip5 String Yes No No No Notes Notes String Yes Yes No No Editdate Editdate Date Yes Yes No No EditorName EditorName String Yes Yes No No X X Double Yes Yes No No Y Y Double Yes Yes No No USNG USNG String Yes Yes No No ARC_4496 ARC_4496 String Yes Yes No No General_ General String Yes Yes No No SpecialNeeds SpecialNeeds String Yes Yes No No PetFriendly PetFriendly String Yes Yes No No SHELTER_TYPE SHELTER_TYPE String Yes Yes No No Status Status String Yes Yes No No Subtype Name Default Value Domain ObjectClass Facility_Type FACILITY_TYPE Emer_Function EMER_FUNCTION County COUNTY_FIPS ARC_4496 False BOOLEAN General_ BOOLEAN SpecialNeeds BOOLEAN PetFriendly BOOLEAN SHELTER_TYPE SHELTER_TYPE Status STATUS Index Name Ascending Unique Fields FDO_OBJECTID Yes Yes OBJECTID Shape_INDEX Yes Yes Shape Methodology and Support Documentation Page V-25
142 Back to Top CFI_DBO_Transportation Alias Dataset Type CFI_DBO_Transportation FeatureClass FeatureType Simple Geometry:Point Average Number of Points:0 Has M:No Has Z:No Grid Size:1000 Field Name Alias Type Precn.ScaleLengthEdit Null Req. Domain Fixed OBJECTID OBJECTID OID No No Yes Yes SHAPE SHAPE Geometry Yes Yes Yes Yes FeatureID FeatureID String Yes Yes No No GnisID GnisID Double Yes Yes No No Facility_Type Facility_Type String Yes Yes No No Emer_Function Emer_Function String Yes No No No Name Name String Yes No No No Address Address String Yes No No No City City String Yes No No No County County String Yes Yes No No Zip Zip String Yes No No No Notes Notes String Yes Yes No No EditDate EditDate Date Yes Yes No No EditorName EditorName String Yes Yes No No X X Double Yes Yes No No Y Y Double Yes Yes No No USNG USNG String Yes Yes No No Subtype Name Default Value Domain ObjectClass Facility_Type FACILITY_TYPE Emer_Function EMER_FUNCTION County COUNTY_FIPS Index Name Ascending Unique Fields FDO_OBJECTID Yes Yes OBJECTID SHAPE_INDEX Yes Yes SHAPE Back to Top Group_Care_Facility_Types Alias Group_Care_Facility_Types Dataset Type Table FeatureType - Field Name Alias Type Precn.ScaleLengthEdit Null Req. Domain Fixed Code Code String Yes Yes No No Description Description String Yes Yes No No Subtype Name Default Value Domain Methodology and Support Documentation Page V-26
143 ObjectClass Index Name Ascending Unique Fields Code Yes No Code Back to Top Hotel_Motel_Types Alias Hotel_Motel_Types Dataset Type Table FeatureType - Field Name Alias Type Precn.ScaleLengthEdit Null Req. Domain Fixed Code Code Integer Yes Yes No No Description Description String Yes Yes No No Subtype Name Default Value Domain ObjectClass Index Name Ascending Unique Fields Code Yes No Code Back to Top Mobile_Home_RV_Parks_Types Alias Mobile_Home_RV_Parks_Types Dataset Type Table FeatureType - Field Name Alias Type Precn.ScaleLengthEdit Null Req. Domain Fixed Code Code String Yes Yes No No Description Description String Yes Yes No No Subtype Name Default Value Domain ObjectClass Index Name Ascending Unique Fields Code Yes No Code Back to Top Methodology and Support Documentation Page V-27
144 Spatial References Dimensio Minimum Precision n CFI_DBO_Correctional_Facilities X Y M 0 1 Z 0 1 Coordinate System Description PROJCS["FDEP Albers HARN",GEOGCS["GCS_North_American_1983_HARN",DATUM["D_North_American_1983_HAR N",SPHEROID["GRS_1980", , ]],PRIMEM["Greenwich",0.0],UNIT["Deg ree", ]],projection["albers"],parameter["false_easting", ],pa RAMETER["False_Northing",0.0],PARAMETER["Central_Meridian",- 84.0],PARAMETER["Standard_Parallel_1",24.0],PARAMETER["Standard_Parallel_2",31.5],PARA METER["Latitude_Of_Origin",24.0],UNIT["Meter",1.0]] CFI_DBO_Emergency_Services X Y M 0 1 Z 0 1 Coordinate System Description PROJCS["FDEP Albers HARN",GEOGCS["GCS_North_American_1983_HARN",DATUM["D_North_American_1983_HAR N",SPHEROID["GRS_1980", , ]],PRIMEM["Greenwich",0.0],UNIT["Deg ree", ]],projection["albers"],parameter["false_easting", ],pa RAMETER["False_Northing",0.0],PARAMETER["Central_Meridian",- 84.0],PARAMETER["Standard_Parallel_1",24.0],PARAMETER["Standard_Parallel_2",31.5],PARA METER["Latitude_Of_Origin",24.0],UNIT["Meter",1.0]] CFI_DBO_HealthCare_Facilities X Y M 0 1 Z 0 1 Coordinate System Description PROJCS["FDEP Albers HARN",GEOGCS["GCS_North_American_1983_HARN",DATUM["D_North_American_1983_HAR N",SPHEROID["GRS_1980", , ]],PRIMEM["Greenwich",0.0],UNIT["Deg ree", ]],projection["albers"],parameter["false_easting", ],pa RAMETER["False_Northing",0.0],PARAMETER["Central_Meridian",- 84.0],PARAMETER["Standard_Parallel_1",24.0],PARAMETER["Standard_Parallel_2",31.5],PARA METER["Latitude_Of_Origin",24.0],UNIT["Meter",1.0]] CFI_DBO_Hazardous_Materials X Y Methodology and Support Documentation Page V-28
145 M 0 1 Z 0 1 Coordinate System Description PROJCS["FDEP Albers HARN",GEOGCS["GCS_North_American_1983_HARN",DATUM["D_North_American_1983_HAR N",SPHEROID["GRS_1980", , ]],PRIMEM["Greenwich",0.0],UNIT["Deg ree", ]],projection["albers"],parameter["false_easting", ],pa RAMETER["False_Northing",0.0],PARAMETER["Central_Meridian",- 84.0],PARAMETER["Standard_Parallel_1",24.0],PARAMETER["Standard_Parallel_2",31.5],PARA METER["Latitude_Of_Origin",24.0],UNIT["Meter",1.0]] CFI_DBO_Education X Y M 0 1 Z 0 1 Coordinate System Description PROJCS["FDEP Albers HARN",GEOGCS["GCS_North_American_1983_HARN",DATUM["D_North_American_1983_HAR N",SPHEROID["GRS_1980", , ]],PRIMEM["Greenwich",0.0],UNIT["Deg ree", ]],projection["albers"],parameter["false_easting", ],pa RAMETER["False_Northing",0.0],PARAMETER["Central_Meridian",- 84.0],PARAMETER["Standard_Parallel_1",24.0],PARAMETER["Standard_Parallel_2",31.5],PARA METER["Latitude_Of_Origin",24.0],UNIT["Meter",1.0]] CFI_DBO_Shelters X Y M 0 1 Z 0 1 Coordinate System Description PROJCS["FDEP Albers HARN",GEOGCS["GCS_North_American_1983_HARN",DATUM["D_North_American_1983_HAR N",SPHEROID["GRS_1980", , ]],PRIMEM["Greenwich",0.0],UNIT["Deg ree", ]],projection["albers"],parameter["false_easting", ],pa RAMETER["False_Northing",0.0],PARAMETER["Central_Meridian",- 84.0],PARAMETER["Standard_Parallel_1",24.0],PARAMETER["Standard_Parallel_2",31.5],PARA METER["Latitude_Of_Origin",24.0],UNIT["Meter",1.0]] CFI_DBO_Communications X Y M 0 1 Z 0 1 Coordinate System Description PROJCS["FDEP Albers HARN",GEOGCS["GCS_North_American_1983_HARN",DATUM["D_North_American_1983_HAR N",SPHEROID["GRS_1980", , ]],PRIMEM["Greenwich",0.0],UNIT["Deg ree", ]],projection["albers"],parameter["false_easting", ],pa RAMETER["False_Northing",0.0],PARAMETER["Central_Meridian",- Methodology and Support Documentation Page V-29
146 84.0],PARAMETER["Standard_Parallel_1",24.0],PARAMETER["Standard_Parallel_2",31.5],PARA METER["Latitude_Of_Origin",24.0],UNIT["Meter",1.0]] CFI_DBO_Energy X Y M 0 1 Z 0 1 Coordinate System Description PROJCS["FDEP Albers HARN",GEOGCS["GCS_North_American_1983_HARN",DATUM["D_North_American_1983_HAR N",SPHEROID["GRS_1980", , ]],PRIMEM["Greenwich",0.0],UNIT["Deg ree", ]],projection["albers"],parameter["false_easting", ],pa RAMETER["False_Northing",0.0],PARAMETER["Central_Meridian",- 84.0],PARAMETER["Standard_Parallel_1",24.0],PARAMETER["Standard_Parallel_2",31.5],PARA METER["Latitude_Of_Origin",24.0],UNIT["Meter",1.0]] CFI_DBO_Transportation X Y M 0 1 Z 0 1 Coordinate System Description PROJCS["FDEP Albers HARN",GEOGCS["GCS_North_American_1983_HARN",DATUM["D_North_American_1983_HAR N",SPHEROID["GRS_1980", , ]],PRIMEM["Greenwich",0.0],UNIT["Deg ree", ]],projection["albers"],parameter["false_easting", ],pa RAMETER["False_Northing",0.0],PARAMETER["Central_Meridian",- 84.0],PARAMETER["Standard_Parallel_1",24.0],PARAMETER["Standard_Parallel_2",31.5],PARA METER["Latitude_Of_Origin",24.0],UNIT["Meter",1.0]] CFI_DBO_Infrastructure X Y M 0 1 Z 0 1 Coordinate System Description PROJCS["FDEP Albers HARN",GEOGCS["GCS_North_American_1983_HARN",DATUM["D_North_American_1983_HAR N",SPHEROID["GRS_1980", , ]],PRIMEM["Greenwich",0.0],UNIT["Deg ree", ]],projection["albers"],parameter["false_easting", ],pa RAMETER["False_Northing",0.0],PARAMETER["Central_Meridian",- 84.0],PARAMETER["Standard_Parallel_1",24.0],PARAMETER["Standard_Parallel_2",31.5],PARA METER["Latitude_Of_Origin",24.0],UNIT["Meter",1.0]] CFI_DBO_Community_Resources X Y M 0 1 Z 0 1 Methodology and Support Documentation Page V-30
147 Coordinate System Description PROJCS["FDEP Albers HARN",GEOGCS["GCS_North_American_1983_HARN",DATUM["D_North_American_1983_HAR N",SPHEROID["GRS_1980", , ]],PRIMEM["Greenwich",0.0],UNIT["Deg ree", ]],projection["albers"],parameter["false_easting", ],pa RAMETER["False_Northing",0.0],PARAMETER["Central_Meridian",- 84.0],PARAMETER["Standard_Parallel_1",24.0],PARAMETER["Standard_Parallel_2",31.5],PARA METER["Latitude_Of_Origin",24.0],UNIT["Meter",1.0]] CFI_DBO_Military X Y M 0 1 Z 0 1 Coordinate System Description PROJCS["FDEP Albers HARN",GEOGCS["GCS_North_American_1983_HARN",DATUM["D_North_American_1983_HAR N",SPHEROID["GRS_1980", , ]],PRIMEM["Greenwich",0.0],UNIT["Deg ree", ]],projection["albers"],parameter["false_easting", ],pa RAMETER["False_Northing",0.0],PARAMETER["Central_Meridian",- 84.0],PARAMETER["Standard_Parallel_1",24.0],PARAMETER["Standard_Parallel_2",31.5],PARA METER["Latitude_Of_Origin",24.0],UNIT["Meter",1.0]] CFI_DBO_Logistics X Y M 0 1 Z 0 1 Coordinate System Description PROJCS["FDEP Albers HARN",GEOGCS["GCS_North_American_1983_HARN",DATUM["D_North_American_1983_HAR N",SPHEROID["GRS_1980", , ]],PRIMEM["Greenwich",0.0],UNIT["Deg ree", ]],projection["albers"],parameter["false_easting", ],pa RAMETER["False_Northing",0.0],PARAMETER["Central_Meridian",- 84.0],PARAMETER["Standard_Parallel_1",24.0],PARAMETER["Standard_Parallel_2",31.5],PARA METER["Latitude_Of_Origin",24.0],UNIT["Meter",1.0]] Back to Top Geodatabase Designer is prototype application and is not supported by ESRI. The commands assoicated with this application and the output generated by those commands are not to be used in a production environment. ESRI is not reponsible for errors, ommission or any damages resulting from the use of these commands and associated output. Use of this application is conditional on the acceptance of this statement. Methodology and Support Documentation Page V-31
148 Exhibit C Geodatabase Designer Developed by The Applications Prototype Lab, ESRI Redlands Schema Creation Creation Date :16:05 Creator marsh on IT-GIS Geodatabase Workspace Type Personal Flavor Access Version Connection Properties DATABASE G:\project\hurricane\SRES_TB\SRES_maps\tbrpc\TBRPC_Regional.gdb Domains ObjectClasses Spatial References Table Of Contents Listing of Coded Value and Range Domains. Listing of Tables and FeatureClasses. Listing of Standalong and FeatureDataset Spatial References. Back to Top Domains Domain Name Owner Domain Type AnnotationStatus Coded Value BOOLEAN Coded Value BooleanSymbolValue Coded Value COUNTY_FIPS Coded Value ElevationRange Range EMER_FUNCTION Coded Value Evac Zones Coded Value FACILITY_TYPE Coded Value FlowLine Ftype Coded Value HorizontalAlignment Coded Value Resolution Coded Value SHELTER_TYPE Coded Value STATUS Coded Value Surge Zones Coded Value VerticalAlignment Coded Value Water Code Types Coded Value Back to Top AnnotationStatus Methodology and Support Documentation Page V-32
149 Owner Description Valid annotation state values. Domain Type Coded Value Field Type Small Integer Merge Policy Default Value Split Policy Duplicate Domain Members Name Value Placed 0 Unplaced 1 Back to Top BOOLEAN Owner Description Boolean Domain Type Coded Value Field Type String Merge Policy Default Value Split Policy Default Value Domain Members Name Value YES YES NO NO Associations ObjectClass Subtype Field CFI_DBO_Shelters - ARC_4496 CFI_DBO_Shelters - General_ CFI_DBO_Shelters - PetFriendly CFI_DBO_Shelters - SpecialNeeds Back to Top BooleanSymbolValue Owner Description Valid values are Yes and No. Domain Type Coded Value Field Type Small Integer Merge Policy Default Value Split Policy Duplicate Domain Members Name Value Yes 1 No 0 Back to Top COUNTY_FIPS Methodology and Support Documentation Page V-33
150 Owner Description Official FIPS Code and County Name - Domain Type Coded Value Field Type String Merge Policy Default Value Split Policy Default Value Domain Members Name Value ALACHUA 001 BAKER 003 BAY 005 BRADFORD 007 BREVARD 009 BROWARD 011 CALHOUN 013 CHARLOTTE 015 CITRUS 017 CLAY 019 COLLIER 021 COLUMBIA 023 DESOTO 027 DIXIE 029 DUVAL 031 ESCAMBIA 033 FLAGLER 035 FRANKLIN 037 GADSDEN 039 GILCHRIST 041 GLADES 043 GULF 045 HAMILTON 047 HARDEE 049 HENDRY 051 HERNANDO 053 HIGHLANDS 055 HILLSBOROUGH 057 HOLMES 059 INDIAN RIVER 061 JACKSON 063 JEFFERSON 065 LAFAYETTE 067 LAKE 069 LEE 071 LEON 073 LEVY 075 LIBERTY 077 MADISON 079 MANATEE 081 Methodology and Support Documentation Page V-34
151 MARION 083 MARTIN 085 MONROE 087 NASSAU 089 OKALOOSA 091 OKEECHOBEE 093 ORANGE 095 OSCEOLA 097 PALM BEACH 099 PASCO 101 PINELLAS 103 POLK 105 PUTNAM 107 ST. JOHNS 109 ST. LUCIE 111 SANTA ROSA 113 SARASOTA 115 SEMINOLE 117 SUMTER 119 SUWANNEE 121 TAYLOR 123 UNION 125 VOLUSIA 127 WAKULLA 129 WALTON 131 WASHINGTON 133 DADE 025 MIAMI-DADE 086 Associations ObjectClass Subtype Field CFI_DBO_Communications - County CFI_DBO_Community_Resources - County CFI_DBO_Correctional_Facilities - County CFI_DBO_Education - County CFI_DBO_Emergency_Services - County CFI_DBO_Energy - County CFI_DBO_Hazardous_Materials - County CFI_DBO_HealthCare_Facilities - County CFI_DBO_Infrastructure - County CFI_DBO_Logistics - County CFI_DBO_Military - County CFI_DBO_Shelters - County CFI_DBO_Transportation - County Shelters - Countyid Back to Top ElevationRange Methodology and Support Documentation Page V-35
152 Owner Description Domain Type Field Type Merge Policy Split Policy Domain Members Range Double Default Value Default Value Name Value MinValue -400 MaxValue 9000 Associations ObjectClass Subtype Field NHD_Lakes - Elevation Swamps - Elevation Back to Top EMER_FUNCTION Owner Description Emergency Function Domain Type Coded Value Field Type String Merge Policy Default Value Split Policy Default Value Domain Members Name Value COMMUNITY RESOURCES CR EDUCATION ED ENERGY ENR EMERGENCY SERVICES ES GOVERNMENT FACILITIES GOV HUMAN SERVICES HS INFRASTRUCTURE INF COMMUNICATIONS IT LOGISTICAL LOG MILITARY MIL PUBLIC HEALTH PB PUBLIC SAFETY PS TRANSPORTATION TRN Associations ObjectClass Subtype Field CFI_DBO_Communications - Emer_Function CFI_DBO_Community_Resources - Emer_Function CFI_DBO_Correctional_Facilities - Emer_Function CFI_DBO_Education - Emer_Function CFI_DBO_Emergency_Services - Emer_Function Methodology and Support Documentation Page V-36
153 CFI_DBO_Energy - Emer_Function CFI_DBO_Hazardous_Materials - Emer_Function CFI_DBO_HealthCare_Facilities - Emer_Function CFI_DBO_Infrastructure - Emer_Function CFI_DBO_Logistics - Emer_Function CFI_DBO_Military - Emer_Function CFI_DBO_Shelters - Emer_Function CFI_DBO_Transportation - Emer_Function Shelters - Emer_Function Back to Top Evac Zones Owner Description Evacuation Levels Domain Type Coded Value Field Type String Merge Policy Default Value Split Policy Default Value Domain Members Name Value Level A A Level B B Level C C Level D D Level E E No Evacuation X Associations ObjectClass Subtype Field EvacZones - Evac Shelters - Evac Back to Top FACILITY_TYPE Owner Description Facility Type Domain Type Coded Value Field Type String Merge Policy Default Value Split Policy Default Value Domain Members Name Value ADULT FAMILY CARE HOME 52 AIRPORT AMBULATORY SURGICAL CENTER 14 Methodology and Support Documentation Page V-37
154 ASSISTED LIVING FACILITY 11 ATTRACTION CALL CENTER CLINICAL LABORATORY 26 COAST GUARD COLLEGE COMMERCIAL PORTS COMMUNITY CENTER CORRECTIONAL FACILITY CRISIS STABILIZATION 17 UNIT DISASTER RECOVERY CENTER DISASTER RECOVERY CENTER-MOBILE ELECTRIC POWER PLANT ELECTRIC SUBSTATION EMERGENCY MEDICAL SERVICE EMERGENCY OPERATIONS CENTER END-STAGE RENAL DISEASE 18 FAITH-BASED FACILITY FIRE STATION FUEL FACILITY - ALONG EVACUATION ROUTE FUEL FACILITY - DOT HAZARDOUS MATERIALS FACILITY HELIPORT/HELIPAD HOSPICE 22 HOSPITAL 23 HOSPITALS- VA 24 INTERMEDIATE CARE FACILITY 25 LAW ENFORCEMENT LIBRARY LOCAL GOVERNMENT FACILITY LOGISTICAL STAGING AREA MAJOR INTERSECTION NATIONAL GUARD NUCLEAR POWER Methodology and Support Documentation Page V-38
155 PLANT POINT OF DISTRIBUTION PRIVATE SCHOOL PUBLIC SCHOOL PUBLIC WATER SUPPLY RADIO COMMUNICATIONS TOWER RELIEF AGENCY RESIDENTIAL TREATMENT FACILITY 32 SEAPLANE BASE SHELTER SKILLED NURSING FACILITY 35 SOLID WASTE FACILITY STADIUM STATE GOVERNMENT FACILITY TELEVISION TRANSITIONAL LIVING 34 FACILITY WASTEWATER FACILITY Associations ObjectClass Subtype Field CFI_DBO_Communications - Facility_Type CFI_DBO_Community_Resources - Facility_Type CFI_DBO_Correctional_Facilities - Facility_Type CFI_DBO_Education - Facility_Type CFI_DBO_Emergency_Services - Facility_Type CFI_DBO_Energy - Facility_Type CFI_DBO_Hazardous_Materials - Facility_Type CFI_DBO_HealthCare_Facilities - Facility_Type CFI_DBO_Infrastructure - Facility_Type CFI_DBO_Logistics - Facility_Type CFI_DBO_Military - Facility_Type CFI_DBO_Shelters - Facility_Type CFI_DBO_Transportation - Facility_Type Shelters - Facility_Type Back to Top Methodology and Support Documentation Page V-39
156 FlowLine Ftype Owner Description Domain Type Field Type Merge Policy Split Policy Domain Members Coded Value Integer Default Value Default Value Name Value Artificial Path 558 Canal-Ditch 336 Coastline 566 Connector 334 Pipeline 428 Shoreline 567 Stream-River 460 Associations ObjectClass Subtype Field NHD_Rivers - FType Back to Top HorizontalAlignment Owner Description Valid horizontal symbol alignment values. Domain Type Coded Value Field Type Small Integer Merge Policy Default Value Split Policy Duplicate Domain Members Name Value Left 0 Center 1 Right 2 Full 3 Back to Top Resolution Owner Description Domain Type Field Type Merge Policy Coded Value Integer Default Value Methodology and Support Documentation Page V-40
157 Split Policy Duplicate Domain Members Name Value Local 1 High 2 Medium 3 Associations ObjectClass Subtype Field NHD_Lakes - Resolution Swamps - Resolution Back to Top SHELTER_TYPE Owner Description Shelter Types Domain Type Coded Value Field Type String Merge Policy Default Value Split Policy Default Value Domain Members Name Value HOST HOST GENERAL GENERAL RISK RISK SPECIAL NEEDS SPECIAL NEEDS PET FRIENDLY PET FRIENDLY EVACUATION EVACUATION MULTIPLE MULTIPLE Associations ObjectClass Subtype Field CFI_DBO_Shelters - SHELTER_TYPE Shelters - Facility_Desc Back to Top STATUS Owner Description Domain Type Field Type Merge Policy Split Policy Domain Members Name OPEN CLOSED Associations Status Coded Value String Default Value Default Value Value OPEN CLOSED Methodology and Support Documentation Page V-41
158 ObjectClass Subtype Field CFI_DBO_Shelters - Status Back to Top Methodology and Support Documentation Page V-42
159 Surge Zones Owner Description Surge Inundation Zones Domain Type Coded Value Field Type Small Integer Merge Policy Default Value Split Policy Default Value Domain Members Name Value Category 1 1 Category 2 2 Category 3 3 Category 4 4 Category 5 5 Tropical Storm 9 Associations ObjectClass Subtype Field SurgeZones - Cat Back to Top VerticalAlignment Owner Description Valid symbol vertical alignment values. Domain Type Coded Value Field Type Small Integer Merge Policy Default Value Split Policy Duplicate Domain Members Name Value Top 0 Center 1 Baseline 2 Bottom 3 Back to Top Water Code Types Owner Description Domain Type Field Type Merge Policy Split Policy Domain Members Name For NHD Features Coded Value Integer Default Value Default Value Value Methodology and Support Documentation Page V-43
160 Foreshore 364 Canal Ditch 336 Sea Ocean 445 Sream River 460 Hazard Zone 373 Estuary 493 Lake Pond 390 Reservoir 436 Swamp Marsh 466 Associations ObjectClass Subtype Field NHD_Area - FTYPE NHD_Lakes - FType Swamps - FType Back to Top ObjectClasses ObjectClass Name Type Geometry Subtype Lines DOT_Detail_Rds FeatureClass Polyline - EvacRoutes_2008 FeatureClass Polyline - Major_Rds FeatureClass Polyline - NHD_Rivers FeatureClass Polyline - Tornado_Touchdown FeatureClass Polyline - Points Mobile_Homes FeatureClass Point - Reg_POR FeatureClass Point - Reg_Spot FeatureClass Point - Shelters FeatureClass Point - Vulnerable_CFI_302 FeatureClass Point - Vulnerable_CFI_Health FeatureClass Point - Vulnerable_CFI_Other FeatureClass Point - Polygons BlkGrp_05 FeatureClass Polygon - EvacZones FeatureClass Polygon - Fire_Danger FeatureClass Polygon - Fire_Interface FeatureClass Polygon - Fire_LOC FeatureClass Polygon - Hazus_Wind50 FeatureClass Polygon - NHD_Area FeatureClass Polygon - NHD_Lakes FeatureClass Polygon - Quick_Land FeatureClass Polygon - Reg_FIRM FeatureClass Polygon - SR SR SR Methodology and Support Documentation Page V-44
161 SAD_Final FeatureClass Polygon - SLOSH_Basin FeatureClass Polygon - SurgeZones FeatureClass Polygon - Swamps FeatureClass Polygon - TEA_Final FeatureClass Polygon - TEZ_Final FeatureClass Polygon - Source_CriticalFacilities CFI_DBO_Communications FeatureClass Point - CFI_DBO_Community_Resources FeatureClass Point - CFI_DBO_Correctional_Facilities FeatureClass Point - CFI_DBO_Education FeatureClass Point - CFI_DBO_Emergency_Services FeatureClass Point - CFI_DBO_Energy FeatureClass Point - CFI_DBO_Hazardous_Materials FeatureClass Point - CFI_DBO_HealthCare_Facilities FeatureClass Point - CFI_DBO_Infrastructure FeatureClass Point - CFI_DBO_Logistics FeatureClass Point - CFI_DBO_Military FeatureClass Point - CFI_DBO_Shelters FeatureClass Point - CFI_DBO_Transportation FeatureClass Point - Stand Alone ObjectClass(s) CensusSF3HBGTB Table - - CensusSF3PBGTB Table - - SAD_Data_jn Table - - Shelter_Master Table - - SR Back to Top BlkGrp_05 Alias Dataset Type BlkGrp_05 FeatureClass FeatureType Simple Geometry:Polygon Average Number of Points:0 Has M:No Has Z:No Grid Size:10000 Field Name Alias Type Precn.ScaleLengthEdit Null Req. Domain Fixed OBJECTID OBJECTID OID No No Yes No Shape Shape Geometry Yes Yes Yes No BLKGRP_JN BLKGRP_JN String Yes Yes No No CALC CALC Double Yes Yes No No Acre Acre Single Yes Yes No No Sq_Mile Sq_Mile Double Yes Yes No No Subtype Name Default Value Domain Methodology and Support Documentation Page V-45
162 ObjectClass Index Name Ascending Unique Fields FDO_OBJECTID Yes Yes OBJECTID FDO_Shape No No Shape Back to Top CensusSF3HBGTB Alias CensusSF3HBGTB Dataset Type Table FeatureType - Field Name Alias Type Precn.ScaleLengthEdit Null Req. Domain Fixed OBJECTID OBJECTID OID No No Yes No RPC RPC String Yes Yes No No COUNTY COUNTY String Yes Yes No No TRACT TRACT String Yes Yes No No BLKGRP BLKGRP String Yes Yes No No BGID BGID String Yes Yes No No AREALAND AREALAND Double Yes Yes No No AREAWATER AREAWATER Double Yes Yes No No POP100 POP100 Integer Yes Yes No No HU100 HU100 Integer Yes Yes No No TOTALUNITS TOTALUNITS Integer Yes Yes No No OCCUNITS OCCUNITS Integer Yes Yes No No OWNEROCC OWNEROCC Integer Yes Yes No No RENTEROCC RENTEROCC Integer Yes Yes No No TOTALVACAN TOTALVACAN Integer Yes Yes No No VACANTTRAN VACANTTRAN Integer Yes Yes No No VACANTSEAS VACANTSEAS Integer Yes Yes No No VACANTMIGR VACANTMIGR Integer Yes Yes No No RENTER RENTER Double Yes Yes No No VACANT VACANT Double Yes Yes No No SEASON SEASON Double Yes Yes No No POPOCC POPOCC Double Yes Yes No No OWNERPOP OWNERPOP Integer Yes Yes No No RENTERPOP RENTERPOP Integer Yes Yes No No HHAVGSIZE HHAVGSIZE Double Yes Yes No No OWNERAVG OWNERAVG Double Yes Yes No No RENTERAVG RENTERAVG Double Yes Yes No No SFUNITS SFUNITS Integer Yes Yes No No MFUNITS MFUNITS Double Yes Yes No No MHOMES MHOMES Integer Yes Yes No No BOATSRVS BOATSRVS Integer Yes Yes No No OCCSF OCCSF Integer Yes Yes No No OCCMF OCCMF Integer Yes Yes No No OCCMH OCCMH Integer Yes Yes No No Methodology and Support Documentation Page V-46
163 OCCBOATS OCCBOATS Integer Yes Yes No No SFSIZE SFSIZE Double Yes Yes No No MFSIZE MFSIZE Double Yes Yes No No MHSIZE MHSIZE Double Yes Yes No No BRVSIZE BRVSIZE Double Yes Yes No No VACSF VACSF Double Yes Yes No No VACMF VACMF Double Yes Yes No No VACMH VACMH Double Yes Yes No No VACBRVS VACBRVS Double Yes Yes No No NOVEHICLE NOVEHICLE Integer Yes Yes No No AVGVEHICLE AVGVEHICLE Double Yes Yes No No AVGVEHOWN AVGVEHOWN Double Yes Yes No No AVGVEHREN AVGVEHREN Double Yes Yes No No Subtype Name Default Value Domain ObjectClass Index Name Ascending Unique Fields FDO_OBJECTID Yes Yes OBJECTID Back to Top CensusSF3PBGTB Alias CensusSF3PBGTB Dataset Type Table FeatureType - Field Name Alias Type Precn.ScaleLengthEdit Null Req. Domain Fixed OBJECTID OBJECTID OID No No Yes No RPC RPC String Yes Yes No No COUNTY COUNTY String Yes Yes No No TRACT TRACT String Yes Yes No No BLKGRP BLKGRP String Yes Yes No No BGID BGID String Yes Yes No No AREALAND AREALAND Double Yes Yes No No AREAWATER AREAWATER Double Yes Yes No No DENSITY DENSITY Single Yes Yes No No POP100 POP100 Integer Yes Yes No No HU100 HU100 Integer Yes Yes No No WHITENH WHITENH Integer Yes Yes No No BLACKNH BLACKNH Integer Yes Yes No No OTHERNH OTHERNH Integer Yes Yes No No HISPANIC HISPANIC Integer Yes Yes No No BLACKNH_1 BLACKNH_1 Double Yes Yes No No OTHERNH_1 OTHERNH_1 Double Yes Yes No No HISPANIC_1 HISPANIC_1 Double Yes Yes No No AGE_5 AGE_5 Integer Yes Yes No No AGE5TO17 AGE5TO17 Integer Yes Yes No No AGE18TO24 AGE18TO24 Integer Yes Yes No No Methodology and Support Documentation Page V-47
164 AGE25TO34 AGE25TO34 Integer Yes Yes No No AGE35TO44 AGE35TO44 Integer Yes Yes No No AGE45TO54 AGE45TO54 Integer Yes Yes No No AGE55TO64 AGE55TO64 Integer Yes Yes No No AGE65TO74 AGE65TO74 Integer Yes Yes No No AGE75TO84 AGE75TO84 Integer Yes Yes No No AGE85_ AGE85_ Integer Yes Yes No No AGE_56 AGE_56 Double Yes Yes No No AGE_18 AGE_18 Double Yes Yes No No AGE65_ AGE65_ Double Yes Yes No No AGE851 AGE851 Double Yes Yes No No FAMILYPOP FAMILYPOP Integer Yes Yes No No NONFAMPOP NONFAMPOP Integer Yes Yes No No LIVEALONE LIVEALONE Integer Yes Yes No No GQINST GQINST Integer Yes Yes No No GQNONINST GQNONINST Integer Yes Yes No No NONFAM NONFAM Double Yes Yes No No GQ GQ Double Yes Yes No No GQINST_1 GQINST_1 Double Yes Yes No No ALONE65_ ALONE65_ Integer Yes Yes No No ALONE651 ALONE651 Double Yes Yes No No SPEAKENG SPEAKENG Integer Yes Yes No No SPEAKSPA SPEAKSPA Integer Yes Yes No No SPEAKOTH SPEAKOTH Integer Yes Yes No No LINGISOSPA LINGISOSPA Integer Yes Yes No No LINGISOOTH LINGISOOTH Integer Yes Yes No No LINGISO LINGISO Double Yes Yes No No NATIVEFL NATIVEFL Integer Yes Yes No No NATIVEUS NATIVEUS Integer Yes Yes No No NATIVENUS NATIVENUS Integer Yes Yes No No FORBORNCIT FORBORNCIT Integer Yes Yes No No FORBORNNCI FORBORNNCI Integer Yes Yes No No FOREIGN FOREIGN Double Yes Yes No No NCITIZEN NCITIZEN Double Yes Yes No No CIVILPOP5_ CIVILPOP5_ Double Yes Yes No No DISAB5TO15 DISAB5TO15 Integer Yes Yes No No DISAB16TO2 DISAB16TO2 Integer Yes Yes No No DISAB21TO6 DISAB21TO6 Integer Yes Yes No No DISAB65TO7 DISAB65TO7 Integer Yes Yes No No DISAB75_ DISAB75_ Integer Yes Yes No No WDISABILI WDISABILI Double Yes Yes No No DISAB65_ DISAB65_ Double Yes Yes No No LABORFORCE LABORFORCE Integer Yes Yes No No ARMEDFORCE ARMEDFORCE Integer Yes Yes No No EMPLOYED EMPLOYED Integer Yes Yes No No UNEMPLOYED UNEMPLOYED Integer Yes Yes No No NLABFORCE NLABFORCE Integer Yes Yes No No UNEMP UNEMP Double Yes Yes No No LABFORCE LABFORCE Double Yes Yes No No Methodology and Support Documentation Page V-48
165 MEDIANHHY MEDIANHHY Integer Yes Yes No No PERCAPITAY PERCAPITAY Integer Yes Yes No No POVDETERM POVDETERM Double Yes Yes No No BELOWPOV BELOWPOV Integer Yes Yes No No POV_18 POV_18 Integer Yes Yes No No POV65_ POV65_ Integer Yes Yes No No BELOWPOV_1 BELOWPOV_1 Double Yes Yes No No POV_18_19 POV_18_19 Double Yes Yes No No POV651 POV651 Double Yes Yes No No Subtype Name Default Value Domain ObjectClass Index Name Ascending Unique Fields FDO_OBJECTID Yes Yes OBJECTID Back to Top CFI_DBO_Communications Alias Dataset Type CFI_DBO_Communications FeatureClass FeatureType Simple Geometry:Point Average Number of Points:0 Has M:No Has Z:No Grid Size: Field Name Alias Type Precn.ScaleLengthEdit Null Req. Domain Fixed OBJECTID OBJECTID OID No No Yes Yes SHAPE SHAPE Geometry Yes Yes Yes Yes FeatureID FeatureID String Yes Yes No No GnisID GnisID Double Yes Yes No No Facility_Type Facility_Type String Yes Yes No No Emer_Function Emer_Function String Yes No No No Name Name String Yes No No No Address Address String Yes No No No City City String Yes No No No County County String Yes Yes No No Zip Zip String Yes No No No Notes Notes String Yes Yes No No EditDate EditDate Date Yes Yes No No EditorName EditorName String Yes Yes No No X X Double Yes Yes No No Y Y Double Yes Yes No No USNG USNG String Yes Yes No No Subtype Name Default Value Domain ObjectClass Facility_Type FACILITY_TYPE Emer_Function EMER_FUNCTION County COUNTY_FIPS Index Name Ascending Unique Fields FDO_OBJECTID Yes Yes OBJECTID Methodology and Support Documentation Page V-49
166 FDO_SHAPE No No SHAPE Back to Top CFI_DBO_Community_Resources Alias Dataset Type CFI_DBO_Community_Resources FeatureClass FeatureType Simple Geometry:Point Average Number of Points:0 Has M:No Has Z:No Grid Size: Field Name Alias Type Precn.ScaleLengthEdit Null Req. Domain Fixed OBJECTID OBJECTID OID No No Yes Yes SHAPE SHAPE Geometry Yes Yes Yes Yes FeatureID FeatureID String Yes Yes No No GnisID GnisID Double Yes Yes No No Facility_Type Facility_Type String Yes Yes No No Emer_Function Emer_Function String Yes No No No Name Name String Yes No No No Address Address String Yes No No No City City String Yes No No No County County String Yes Yes No No Zip Zip String Yes No No No Notes Notes String Yes Yes No No EditDate EditDate Date Yes Yes No No EditorName EditorName String Yes Yes No No X X Double Yes Yes No No Y Y Double Yes Yes No No USNG USNG String Yes Yes No No Subtype Name Default Value Domain ObjectClass Facility_Type FACILITY_TYPE Emer_Function EMER_FUNCTION County COUNTY_FIPS Index Name Ascending Unique Fields FDO_OBJECTID Yes Yes OBJECTID FDO_SHAPE No No SHAPE Back to Top CFI_DBO_Correctional_Facilities Alias CFI_DBO_Correctional_Facilities Geometry:Point Dataset Average Number of Points:0 FeatureClass Type Has M:No Has Z:No FeatureType Simple Grid Size: Field Name Alias Type Precn.ScaleLengthEdit Null Req.Domain Methodology and Support Documentation Page V-50
167 Fixed OBJECTID OBJECTID OID No No Yes Yes SHAPE SHAPE Geometry Yes Yes Yes Yes FeatureID FeatureID String Yes Yes No No GnisID GnisID Double Yes Yes No No Facility_Type Facility_Type String Yes Yes No No Emer_Function Emer_Function String Yes No No No Name Name String Yes No No No Address Address String Yes No No No City City String Yes No No No County County String Yes Yes No No Zip Zip String Yes No No No Notes Notes String Yes Yes No No EditDate EditDate Date Yes Yes No No EditorName EditorName String Yes Yes No No X X Double Yes Yes No No Y Y Double Yes Yes No No USNG USNG String Yes Yes No No Subtype Name Default Value Domain ObjectClass Facility_Type FACILITY_TYPE Emer_Function EMER_FUNCTION County COUNTY_FIPS Index Name Ascending Unique Fields FDO_OBJECTID Yes Yes OBJECTID FDO_SHAPE No No SHAPE Back to Top CFI_DBO_Education Alias Dataset Type CFI_DBO_Education FeatureClass FeatureType Simple Geometry:Point Average Number of Points:0 Has M:No Has Z:No Grid Size: Field Name Alias Type Precn.ScaleLengthEdit Null Req. Domain Fixed OBJECTID OBJECTID OID No No Yes No Shape Shape Geometry Yes Yes Yes No FeatureID FeatureID String Yes Yes No No GnisID GnisID Double Yes Yes No No Facility_Type Facility_Type String Yes Yes No No Emer_Function Emer_Function String Yes Yes No No Name Name String Yes Yes No No Address Address String Yes Yes No No City City String Yes Yes No No County County String Yes Yes No No Zip Zip String Yes Yes No No Methodology and Support Documentation Page V-51
168 Notes Notes String Yes Yes No No EditDate EditDate Date Yes Yes No No EditorName EditorName String Yes Yes No No X X Double Yes Yes No No Y Y Double Yes Yes No No USNG USNG String Yes Yes No No Subtype Name Default Value Domain ObjectClass Facility_Type FACILITY_TYPE Emer_Function EMER_FUNCTION County COUNTY_FIPS Index Name Ascending Unique Fields FDO_OBJECTID Yes Yes OBJECTID FDO_Shape No No Shape Back to Top CFI_DBO_Emergency_Services Alias Dataset Type CFI_DBO_Emergency_Services FeatureClass FeatureType Simple Geometry:Point Average Number of Points:0 Has M:No Has Z:No Grid Size: Field Name Alias Type Precn.ScaleLengthEdit Null Req. Domain Fixed OBJECTID OBJECTID OID No No Yes Yes SHAPE SHAPE Geometry Yes Yes Yes Yes FeatureID FeatureID String Yes Yes No No GnisID GnisID Double Yes Yes No No Facility_Type Facility_Type String Yes Yes No No Emer_Function Emer_Function String Yes No No No Name Name String Yes No No No Address Address String Yes No No No City City String Yes No No No County County String Yes Yes No No Zip Zip String Yes No No No Notes Notes String Yes Yes No No EditDate EditDate Date Yes Yes No No EditorName EditorName String Yes Yes No No X X Double Yes Yes No No Y Y Double Yes Yes No No USNG USNG String Yes Yes No No Subtype Name Default Value Domain ObjectClass Facility_Type FACILITY_TYPE Emer_Function EMER_FUNCTION County COUNTY_FIPS Index Name Ascending Unique Fields Methodology and Support Documentation Page V-52
169 FDO_OBJECTID Yes Yes OBJECTID FDO_SHAPE No No SHAPE Back to Top CFI_DBO_Energy Alias Dataset Type CFI_DBO_Energy FeatureClass FeatureType Simple Geometry:Point Average Number of Points:0 Has M:No Has Z:No Grid Size: Field Name Alias Type Precn.ScaleLengthEdit Null Req. Domain Fixed OBJECTID OBJECTID OID No No Yes Yes SHAPE SHAPE Geometry Yes Yes Yes Yes FeatureID FeatureID String Yes Yes No No GnisID GnisID Double Yes Yes No No Facility_Type Facility_Type String Yes Yes No No Emer_Function Emer_Function String Yes No No No Name Name String Yes No No No Address Address String Yes No No No City City String Yes No No No County County String Yes Yes No No Zip Zip String Yes No No No Notes Notes String Yes Yes No No EditDate EditDate Date Yes Yes No No EditorName EditorName String Yes Yes No No X X Double Yes Yes No No Y Y Double Yes Yes No No USNG USNG String Yes Yes No No Subtype Name Default Value Domain ObjectClass Facility_Type FACILITY_TYPE Emer_Function EMER_FUNCTION County COUNTY_FIPS Index Name Ascending Unique Fields FDO_OBJECTID Yes Yes OBJECTID FDO_SHAPE No No SHAPE Back to Top CFI_DBO_Hazardous_Materials Alias Dataset Type CFI_DBO_Hazardous_Materials FeatureClass FeatureType Simple Geometry:Point Average Number of Points:0 Has M:No Has Z:No Grid Size: Methodology and Support Documentation Page V-53
170 Field Name Alias Type Precn.ScaleLengthEdit Null Req. Domain Fixed OBJECTID OBJECTID OID No No Yes Yes SHAPE SHAPE Geometry Yes Yes Yes Yes FeatureID FeatureID String Yes Yes No No Facility_Type Facility_Type String Yes Yes No No Emer_Function Emer_Function String Yes No No No Name Name String Yes No No No Address Address String Yes No No No City City String Yes No No No County County String Yes Yes No No Zip Zip String Yes No No No Notes Notes String Yes Yes No No EditDate EditDate Date Yes Yes No No X X Double Yes Yes No No Y Y Double Yes Yes No No USNG USNG String Yes Yes No No Facility_Desc Facility_Desc String Yes Yes No No USNG2 USNG2 String Yes Yes No No Subtype Name Default Value Domain ObjectClass Facility_Type FACILITY_TYPE Emer_Function EMER_FUNCTION County COUNTY_FIPS Index Name Ascending Unique Fields FDO_OBJECTID Yes Yes OBJECTID FDO_SHAPE No No SHAPE Back to Top CFI_DBO_HealthCare_Facilities Alias Dataset Type CFI_DBO_HealthCare_Facilities FeatureClass FeatureType Simple Geometry:Point Average Number of Points:0 Has M:No Has Z:No Grid Size: Field Name Alias Type Precn.ScaleLengthEdit Null Req. Domain Fixed OBJECTID OBJECTID OID No No Yes No Shape Shape Geometry Yes Yes Yes No FeatureID FeatureID String Yes Yes No No GnisID GnisID Double Yes Yes No No Facility_Type Facility_Type String Yes Yes No No Emer_Function Emer_Function String Yes No No No Name Name String Yes Yes No No Address Address String Yes Yes No No City City String Yes Yes No No County County String Yes Yes No No Methodology and Support Documentation Page V-54
171 Zip Zip String Yes Yes No No Notes Notes String Yes Yes No No EditDate EditDate Date Yes Yes No No EditorName EditorName String Yes Yes No No X X Double Yes Yes No No Y Y Double Yes Yes No No USNG USNG String Yes Yes No No Subtype Name Default Value Domain ObjectClass Facility_Type FACILITY_TYPE Emer_Function EMER_FUNCTION County COUNTY_FIPS Index Name Ascending Unique Fields FDO_OBJECTID Yes Yes OBJECTID FDO_Shape No No Shape Back to Top CFI_DBO_Infrastructure Alias Dataset Type CFI_DBO_Infrastructure FeatureClass FeatureType Simple Geometry:Point Average Number of Points:0 Has M:No Has Z:No Grid Size: Field Name Alias Type Precn.ScaleLengthEdit Null Req. Domain Fixed OBJECTID OBJECTID OID No No Yes Yes SHAPE SHAPE Geometry Yes Yes Yes Yes FeatureID FeatureID String Yes Yes No No GnisID GnisID Double Yes Yes No No Facility_Type Facility_Type String Yes Yes No No Emer_Function Emer_Function String Yes No No No Name Name String Yes No No No Address Address String Yes No No No City City String Yes No No No County County String Yes Yes No No Zip Zip String Yes No No No Notes Notes String Yes Yes No No EditDate EditDate Date Yes Yes No No EditorName EditorName String Yes Yes No No X X Double Yes Yes No No Y Y Double Yes Yes No No USNG USNG String Yes Yes No No Subtype Name Default Value Domain ObjectClass Facility_Type FACILITY_TYPE Emer_Function EMER_FUNCTION County COUNTY_FIPS Methodology and Support Documentation Page V-55
172 Index Name Ascending Unique Fields FDO_OBJECTID Yes Yes OBJECTID FDO_SHAPE No No SHAPE Back to Top CFI_DBO_Logistics Alias Dataset Type CFI_DBO_Logistics FeatureClass FeatureType Simple Geometry:Point Average Number of Points:0 Has M:No Has Z:No Grid Size: Field Name Alias Type Precn.ScaleLengthEdit Null Req. Domain Fixed OBJECTID OBJECTID OID No No Yes No Shape Shape Geometry Yes Yes Yes No FeatureID FeatureID String Yes Yes No No Facility_Type Facility_Type String Yes Yes No No Emer_Function Emer_Function String Yes Yes No No Name Name String Yes Yes No No Address Address String Yes Yes No No City City String Yes Yes No No County County String Yes Yes No No Zip Zip String Yes Yes No No Notes Notes String Yes Yes No No EditDate EditDate Date Yes Yes No No EditorName EditorName String Yes Yes No No X X Double Yes Yes No No Y Y Double Yes Yes No No USNG USNG String Yes Yes No No Status Status String Yes Yes No No Subtype Name Default Value Domain ObjectClass Facility_Type FACILITY_TYPE Emer_Function EMER_FUNCTION County COUNTY_FIPS Index Name Ascending Unique Fields FDO_OBJECTID Yes Yes OBJECTID FDO_Shape No No Shape Back to Top CFI_DBO_Military Alias CFI_DBO_Military Dataset Type FeatureClass FeatureType Simple Geometry:Point Average Number of Points:0 Has M:No Has Z:No Methodology and Support Documentation Page V-56
173 Grid Size: Field Name Alias Type Precn.ScaleLengthEdit Null Req. Domain Fixed OBJECTID OBJECTID OID No No Yes No Shape Shape Geometry Yes Yes Yes No FeatureID FeatureID String Yes Yes No No GnisID GnisID Double Yes Yes No No Facility_Type Facility_Type String Yes Yes No No Emer_Function Emer_Function String Yes Yes No No Name Name String Yes Yes No No Address Address String Yes Yes No No City City String Yes Yes No No County County String Yes Yes No No Zip Zip String Yes Yes No No Notes Notes String Yes Yes No No EditDate EditDate Date Yes Yes No No EditorName EditorName String Yes Yes No No X X Double Yes Yes No No Y Y Double Yes Yes No No USNG USNG String Yes Yes No No USNG2 USNG2 String Yes Yes No No Subtype Name Default Value Domain ObjectClass Facility_Type FACILITY_TYPE Emer_Function EMER_FUNCTION County COUNTY_FIPS Index Name Ascending Unique Fields FDO_OBJECTID Yes Yes OBJECTID FDO_Shape No No Shape Back to Top CFI_DBO_Shelters Alias Dataset Type CFI_DBO_Shelters FeatureClass FeatureType Simple Geometry:Point Average Number of Points:0 Has M:No Has Z:No Grid Size: Field Name Alias Type Precn.ScaleLengthEdit Null Req. Domain Fixed OBJECTID OBJECTID OID No No Yes No Shape Shape Geometry Yes Yes Yes No RedCrossNSS_ID RedCrossNSS_ID Integer Yes Yes No No FeatureID FeatureID String Yes Yes No No Facility_Type Facility_Type String Yes Yes No No Emer_Function Emer_Function String Yes No No No Name Name String Yes Yes No No Address Address String Yes Yes No No Methodology and Support Documentation Page V-57
174 City City String Yes Yes No No Countyid Countyid String Yes Yes No No County County String Yes Yes No No Zip5 Zip5 String Yes No No No Notes Notes String Yes Yes No No Editdate Editdate Date Yes Yes No No EditorName EditorName String Yes Yes No No X X Double Yes Yes No No Y Y Double Yes Yes No No USNG USNG String Yes Yes No No ARC_4496 ARC_4496 String Yes Yes No No General_ General String Yes Yes No No SpecialNeeds SpecialNeeds String Yes Yes No No PetFriendly PetFriendly String Yes Yes No No SHELTER_TYPE SHELTER_TYPE String Yes Yes No No Status Status String Yes Yes No No Subtype Name Default Value Domain ObjectClass Facility_Type FACILITY_TYPE Emer_Function EMER_FUNCTION County COUNTY_FIPS ARC_4496 False BOOLEAN General_ BOOLEAN SpecialNeeds BOOLEAN PetFriendly BOOLEAN SHELTER_TYPE SHELTER_TYPE Status STATUS Index Name Ascending Unique Fields FDO_OBJECTID Yes Yes OBJECTID FDO_Shape No No Shape Back to Top CFI_DBO_Transportation Alias Dataset Type CFI_DBO_Transportation FeatureClass FeatureType Simple Geometry:Point Average Number of Points:0 Has M:No Has Z:No Grid Size: Field Name Alias Type Precn.ScaleLengthEdit Null Req. Domain Fixed OBJECTID OBJECTID OID No No Yes Yes SHAPE SHAPE Geometry Yes Yes Yes Yes FeatureID FeatureID String Yes Yes No No GnisID GnisID Double Yes Yes No No Facility_Type Facility_Type String Yes Yes No No Emer_Function Emer_Function String Yes No No No Name Name String Yes No No No Methodology and Support Documentation Page V-58
175 Address Address String Yes No No No City City String Yes No No No County County String Yes Yes No No Zip Zip String Yes No No No Notes Notes String Yes Yes No No EditDate EditDate Date Yes Yes No No EditorName EditorName String Yes Yes No No X X Double Yes Yes No No Y Y Double Yes Yes No No USNG USNG String Yes Yes No No Subtype Name Default Value Domain ObjectClass Facility_Type FACILITY_TYPE Emer_Function EMER_FUNCTION County COUNTY_FIPS Index Name Ascending Unique Fields FDO_OBJECTID Yes Yes OBJECTID FDO_SHAPE No No SHAPE Back to Top DOT_Detail_Rds Alias Dataset Type DOT_Detail_Rds FeatureClass FeatureType Simple Geometry:Polyline Average Number of Points:0 Has M:No Has Z:No Grid Size:590 Field Name Alias Type Precn.ScaleLengthEdit Null Req. Domain Fixed OBJECTID OBJECTID OID No No Yes No Shape Shape Geometry Yes Yes Yes No DYNAMAP_ID DYNAMAP_ID Double Yes Yes No No L_F_ADD L_F_ADD String Yes Yes No No L_T_ADD L_T_ADD String Yes Yes No No R_F_ADD R_F_ADD String Yes Yes No No R_T_ADD R_T_ADD String Yes Yes No No PREFIX PREFIX String Yes Yes No No PRETYPE PRETYPE String Yes Yes No No NAME NAME String Yes Yes No No TYPE TYPE String Yes Yes No No SUFFIX SUFFIX String Yes Yes No No FCC FCC String Yes Yes No No POSTAL_L POSTAL_L String Yes Yes No No POSTAL_R POSTAL_R String Yes Yes No No ACC ACC String Yes Yes No No NAME_TYPE NAME_TYPE String Yes Yes No No SHIELD SHIELD String Yes Yes No No HWY_NUM HWY_NUM String Yes Yes No No Methodology and Support Documentation Page V-59
176 SEG_LEN SEG_LEN Single Yes Yes No No SPEED SPEED Small Integer Yes Yes No No ONE_WAY ONE_WAY String Yes Yes No No F_ZLEV F_ZLEV Small Integer Yes Yes No No T_ZLEV T_ZLEV Small Integer Yes Yes No No FT_COST FT_COST Double Yes Yes No No TF_COST TF_COST Double Yes Yes No No FT_DIR FT_DIR String Yes Yes No No TF_DIR TF_DIR String Yes Yes No No NAME_FLAG NAME_FLAG Small Integer Yes Yes No No STATUS STATUS String Yes Yes No No CLASS CLASS Small Integer Yes Yes No No PRT_NAME PRT_NAME String Yes Yes No No ALTNAME ALTNAME String Yes Yes No No Subtype Name Default Value Domain ObjectClass Index Name Ascending Unique Fields FDO_OBJECTID Yes Yes OBJECTID FDO_Shape No No Shape Back to Top EvacRoutes_2008 Alias Dataset Type EvacRoutes_2008 FeatureClass FeatureType Simple Geometry:Polyline Average Number of Points:0 Has M:No Has Z:No Grid Size:550 Field Name Alias Type Precn.ScaleLengthEdit Null Req. Domain Fixed OBJECTID OBJECTID OID No No Yes No Shape Shape Geometry Yes Yes Yes No JOIN_COUNT JOIN_COUNT Integer Yes Yes No No DYNAMAP_ID DYNAMAP_ID Double Yes Yes No No L_F_ADD L_F_ADD String Yes Yes No No L_T_ADD L_T_ADD String Yes Yes No No R_F_ADD R_F_ADD String Yes Yes No No R_T_ADD R_T_ADD String Yes Yes No No PREFIX PREFIX String Yes Yes No No PRETYPE PRETYPE String Yes Yes No No NAME NAME String Yes Yes No No TYPE TYPE String Yes Yes No No SUFFIX SUFFIX String Yes Yes No No Methodology and Support Documentation Page V-60
177 FCC FCC String Yes Yes No No POSTAL_L POSTAL_L String Yes Yes No No POSTAL_R POSTAL_R String Yes Yes No No ACC ACC String Yes Yes No No NAME_TYPE NAME_TYPE String Yes Yes No No SHIELD SHIELD String Yes Yes No No HWY_NUM HWY_NUM String Yes Yes No No SEG_LEN SEG_LEN Double Yes Yes No No SPEED SPEED Small Integer Yes Yes No No ONE_WAY ONE_WAY String Yes Yes No No F_ZLEV F_ZLEV Small Integer Yes Yes No No T_ZLEV T_ZLEV Small Integer Yes Yes No No FT_COST FT_COST Double Yes Yes No No TF_COST TF_COST Double Yes Yes No No FT_DIR FT_DIR String Yes Yes No No TF_DIR TF_DIR String Yes Yes No No NAME_FLAG NAME_FLAG Small Integer Yes Yes No No STATUS STATUS String Yes Yes No No CLASS CLASS Small Integer Yes Yes No No PRT_NAME PRT_NAME String Yes Yes No No ALTNAME ALTNAME String Yes Yes No No LANES LANES Small Integer Yes Yes No No CONTRA CONTRA Small Integer Yes Yes No No CAPACITY CAPACITY Integer Yes Yes No No IN_USE IN_USE String Yes Yes No No U_TYPE U_TYPE String Yes Yes No No ROADWAY ROADWAY String Yes Yes No No ROAD_SIDE ROAD_SIDE String Yes Yes No No BEGIN_POST BEGIN_POST Double Yes Yes No No END_POST END_POST Double Yes Yes No No LANE_CNT LANE_CNT Double Yes Yes No No SHAPE_LENG SHAPE_LENG Double Yes Yes No No AZIM AZIM Double Yes Yes No No CARDINAL CARDINAL String Yes Yes No No Subtype Name Default Value Domain ObjectClass Index Name Ascending Unique Fields FDO_OBJECTID Yes Yes OBJECTID FDO_Shape No No Shape Back to Top Methodology and Support Documentation Page V-61
178 EvacZones Alias Dataset Type EvacZones FeatureClass FeatureType Simple Geometry:Polygon Average Number of Points:0 Has M:No Has Z:No Grid Size:1800 Grid Size:18000 Field Name Alias Type Precn.ScaleLengthEdit Null Req. Domain Fixed OBJECTID OBJECTID OID No No Yes No Shape Shape Geometry Yes Yes Yes No Evac Evac String Yes Yes No No tmp_lev tmp_lev String Yes Yes No No Orig_ID Orig_ID Integer Yes Yes No No Subtype Name Default Value Domain ObjectClass Evac Evac Zones Index Name Ascending Unique Fields FDO_OBJECTID Yes Yes OBJECTID FDO_Shape No No Shape Back to Top Fire_Danger Alias Dataset Type Fire_Danger FeatureClass FeatureType Simple Geometry:Polygon Average Number of Points:0 Has M:No Has Z:No Grid Size:14000 Grid Size:56000 Field Name Alias Type Precn.ScaleLengthEdit Null Req. Domain Fixed OBJECTID OBJECTID OID No No Yes No Shape Shape Geometry Yes Yes Yes No ID ID Double Yes Yes No No GRIDCODE GRIDCODE Double Yes Yes No No Lower Lower Small Integer Yes Yes No No Mid Mid Small Integer Yes Yes No No Upper Upper Small Integer Yes Yes No No Describe Describe String Yes Yes No No Subtype Name Default Value Domain ObjectClass Index Name Ascending Unique Fields FDO_OBJECTID Yes Yes OBJECTID Methodology and Support Documentation Page V-62
179 FDO_Shape No No Shape Back to Top Methodology and Support Documentation Page V-63
180 Fire_Interface Alias Dataset Type Fire_Interface FeatureClass FeatureType Simple Geometry:Polygon Average Number of Points:0 Has M:No Has Z:No Grid Size:3000 Field Name Alias Type Precn.ScaleLengthEdit Null Req. Domain Fixed OBJECTID_1 OBJECTID_1 OID No No Yes No Shape Shape Geometry Yes Yes Yes No OBJECTID OBJECTID Integer Yes Yes No No AREA AREA Double Yes Yes No No PERIMETER PERIMETER Double Yes Yes No No FLWUI_ FLWUI_ Integer Yes Yes No No FLWUI_ID FLWUI_ID Integer Yes Yes No No BLK00 BLK00 String Yes Yes No No ZSUM11PC ZSUM11PC Single Yes Yes No No ZSUM21PC ZSUM21PC Single Yes Yes No No ZSUM22PC ZSUM22PC Single Yes Yes No No ZSUM23PC ZSUM23PC Single Yes Yes No No ZSUM31PC ZSUM31PC Single Yes Yes No No ZSUM32PC ZSUM32PC Single Yes Yes No No ZSUM33PC ZSUM33PC Single Yes Yes No No ZSUM41PC ZSUM41PC Single Yes Yes No No ZSUM42PC ZSUM42PC Single Yes Yes No No ZSUM43PC ZSUM43PC Single Yes Yes No No ZSUM51PC ZSUM51PC Single Yes Yes No No ZSUM61PC ZSUM61PC Single Yes Yes No No ZSUM71PC ZSUM71PC Single Yes Yes No No ZSUM81PC ZSUM81PC Single Yes Yes No No ZSUM82PC ZSUM82PC Single Yes Yes No No ZSUM85PC ZSUM85PC Single Yes Yes No No ZSUM91PC ZSUM91PC Single Yes Yes No No ZSUM92PC ZSUM92PC Single Yes Yes No No WATER00 WATER00 Small Integer Yes Yes No No HDEN00 HDEN00 Double Yes Yes No No SHDEN00 SHDEN00 Double Yes Yes No No PDEN00 PDEN00 Double Yes Yes No No HHDEN00 HHDEN00 Double Yes Yes No No ALLOCHDEN9 ALLOCHDEN9 Double Yes Yes No No ALLOCSHDEN ALLOCSHDEN Double Yes Yes No No ALLOCPDEN9 ALLOCPDEN9 Double Yes Yes No No ALLOCHHDEN ALLOCHHDEN Double Yes Yes No No FOREST FOREST Single Yes Yes No No VEGETATION VEGETATION Single Yes Yes No No WUIALLOCHD WUIALLOCHD String Yes Yes No No WUIHDEN00 WUIHDEN00 String Yes Yes No No Methodology and Support Documentation Page V-64
181 WUICODE90 WUICODE90 Double Yes Yes No No WUICODE00 WUICODE00 Double Yes Yes No No STATE STATE String Yes Yes No No ZSUM12PC ZSUM12PC Single Yes Yes No No ZSUM83PC ZSUM83PC Single Yes Yes No No ZSUM84PC ZSUM84PC Single Yes Yes No No SHAPE_Leng SHAPE_Leng Double Yes Yes No No Subtype Name Default Value Domain ObjectClass Index Name Ascending Unique Fields FDO_OBJECTID_1 Yes Yes OBJECTID_1 FDO_Shape No No Shape Back to Top Fire_LOC Alias Dataset Type Fire_LOC FeatureClass FeatureType Simple Geometry:Polygon Average Number of Points:0 Has M:No Has Z:No Grid Size:700 Grid Size:11900 Field Name Alias Type Precn.ScaleLengthEdit Null Req. Domain Fixed OBJECTID OBJECTID OID No No Yes No Shape Shape Geometry Yes Yes Yes No ID ID Double Yes Yes No No GRIDCODE GRIDCODE Double Yes Yes No No Subtype Name Default Value Domain ObjectClass Index Name Ascending Unique Fields FDO_OBJECTID Yes Yes OBJECTID FDO_Shape No No Shape Back to Top Hazus_Wind50 Alias Dataset Type Hazus_Wind50 FeatureClass FeatureType Simple Geometry:Polygon Average Number of Points:0 Has M:No Has Z:No Grid Size: Field Name Alias Type Precn.ScaleLengthEdit Null Req. Domain Fixed OBJECTID OBJECTID OID No No Yes No Shape Shape Geometry Yes Yes Yes No Methodology and Support Documentation Page V-65
182 ID ID Double Yes Yes No No GRIDCODE GRIDCODE Double Yes Yes No No Subtype Name Default Value Domain ObjectClass Index Name Ascending Unique Fields FDO_OBJECTID Yes Yes OBJECTID FDO_Shape No No Shape Back to Top Major_Rds Alias Dataset Type Major_Rds FeatureClass FeatureType Simple Geometry:Polyline Average Number of Points:0 Has M:No Has Z:No Grid Size:580 Field Name Alias Type Precn.ScaleLengthEdit Null Req. Domain Fixed OBJECTID_1 OBJECTID_1 OID No No Yes No Shape Shape Geometry Yes Yes Yes No OBJECTID OBJECTID Integer Yes Yes No No DYNAMAP_ID DYNAMAP_ID Double Yes Yes No No L_F_ADD L_F_ADD String Yes Yes No No L_T_ADD L_T_ADD String Yes Yes No No R_F_ADD R_F_ADD String Yes Yes No No R_T_ADD R_T_ADD String Yes Yes No No PREFIX PREFIX String Yes Yes No No PRETYPE PRETYPE String Yes Yes No No NAME NAME String Yes Yes No No TYPE TYPE String Yes Yes No No SUFFIX SUFFIX String Yes Yes No No FCC FCC String Yes Yes No No POSTAL_L POSTAL_L String Yes Yes No No POSTAL_R POSTAL_R String Yes Yes No No ACC ACC String Yes Yes No No NAME_TYPE NAME_TYPE String Yes Yes No No SHIELD SHIELD String Yes Yes No No HWY_NUM HWY_NUM String Yes Yes No No SEG_LEN SEG_LEN Single Yes Yes No No SPEED SPEED Small Integer Yes Yes No No ONE_WAY ONE_WAY String Yes Yes No No F_ZLEV F_ZLEV Small Integer Yes Yes No No T_ZLEV T_ZLEV Small Integer Yes Yes No No FT_COST FT_COST Double Yes Yes No No TF_COST TF_COST Double Yes Yes No No Methodology and Support Documentation Page V-66
183 FT_DIR FT_DIR String Yes Yes No No TF_DIR TF_DIR String Yes Yes No No NAME_FLAG NAME_FLAG Small Integer Yes Yes No No STATUS STATUS String Yes Yes No No Shape_Leng Shape_Leng Double Yes Yes No No Subtype Name Default Value Domain ObjectClass Index Name Ascending Unique Fields FDO_OBJECTID_1 Yes Yes OBJECTID_1 FDO_Shape No No Shape Back to Top Mobile_Homes Alias Dataset Type Mobile_Homes FeatureClass FeatureType Simple Geometry:Point Average Number of Points:0 Has M:No Has Z:No Grid Size: Field Name Alias Type Precn.ScaleLengthEdit Null Req. Domain Fixed OBJECTID OBJECTID OID No No Yes No Shape Shape Geometry Yes Yes Yes No COUNTY COUNTY String Yes Yes No No PARCELID PARCELID String Yes Yes No No LUCODE LUCODE String Yes Yes No No LUDESC LUDESC String Yes Yes No No SITE_ADDR SITE_ADDR String Yes Yes No No UNIT UNIT String Yes Yes No No CITY CITY String Yes Yes No No ZIP ZIP String Yes Yes No No OWNER OWNER String Yes Yes No No MH_TYPE MH_TYPE Small Integer Yes Yes No No X_COORD X_COORD Double Yes Yes No No Y_COORD Y_COORD Double Yes Yes No No TAZ_ID TAZ_ID Integer Yes Yes No No FEAT_ID FEAT_ID String Yes Yes No No bldg bldg Small Integer Yes Yes No No Subtype Name Default Value Domain ObjectClass Index Name Ascending Unique Fields FDO_OBJECTID Yes Yes OBJECTID FDO_Shape No No Shape Back to Top Methodology and Support Documentation Page V-67
184 NHD_Area Alias Dataset Type NHD_Area FeatureClass FeatureType Simple Geometry:Polygon Average Number of Points:0 Has M:Yes Has Z:Yes Grid Size: Field Name Alias Type Precn.ScaleLengthEdit Null Req. Domain Fixed OBJECTID OBJECTID OID No No Yes No Shape Shape Geometry Yes Yes Yes No COMID COMID Integer Yes Yes No No FDATE FDATE Date Yes Yes No No RESOLUTION RESOLUTION Integer Yes Yes No No GNIS_ID GNIS_ID String Yes Yes No No GNIS_NAME GNIS_NAME String Yes Yes No No AREASQKM AREASQKM Double Yes Yes No No ELEVATION ELEVATION Double Yes Yes No No FTYPE FTYPE Integer Yes Yes No No FCODE FCODE Integer Yes Yes No No SHAPE_LENG SHAPE_LENG Double Yes Yes No No Subtype Name Default Value Domain ObjectClass FTYPE Water Code Types Index Name Ascending Unique Fields FDO_OBJECTID Yes Yes OBJECTID FDO_Shape No No Shape Back to Top NHD_Lakes Alias Dataset Type NHD_Lakes FeatureClass FeatureType Simple Geometry:Polygon Average Number of Points:0 Has M:No Has Z:Yes Grid Size:520 Grid Size:3120 Field Name Alias Type Precn.ScaleLengthEdit Null Req. Domain Fixed OBJECTID OBJECTID OID No No Yes No Shape Shape Geometry Yes Yes Yes No ComID ComID Integer Yes No No No FDate FDate Date Yes Yes No No Resolution Resolution Integer Yes No No No GNIS_ID GNIS_ID String Yes Yes No No GNIS_Name GNIS_Name String Yes Yes No No AreaSqKm AreaSqKm Double Yes Yes No No Elevation Elevation Double Yes Yes No No Methodology and Support Documentation Page V-68
185 ReachCode ReachCode String Yes Yes No No FType FType Integer Yes No No No FCode FCode Integer Yes Yes No No Subtype Name Default Value Domain ObjectClass ComID 0 - Resolution 2 Resolution Elevation ElevationRange FType Water Code Types FCode Index Name Ascending Unique Fields FDO_OBJECTID Yes Yes OBJECTID FDO_Shape No No Shape Back to Top Methodology and Support Documentation Page V-69
186 NHD_Rivers Alias Dataset Type NHD_Rivers FeatureClass FeatureType Simple Geometry:Polyline Average Number of Points:0 Has M:Yes Has Z:Yes Grid Size:970 Grid Size:3880 Field Name Alias Type Precn.ScaleLengthEdit Null Req. Domain Fixed OBJECTID OBJECTID OID No No Yes No Shape Shape Geometry Yes Yes Yes No ComID ComID Integer Yes Yes No No FDate FDate Date Yes Yes No No Resolution Resolution Integer Yes Yes No No GNIS_ID GNIS_ID String Yes Yes No No GNIS_Name GNIS_Name String Yes Yes No No LengthKM LengthKM Double Yes Yes No No ReachCode ReachCode String Yes Yes No No FlowDir FlowDir Integer Yes Yes No No WBAreaComI WBAreaComI Integer Yes Yes No No FType FType Integer Yes Yes No No FCode FCode Integer Yes Yes No No Enabled Enabled Small Integer Yes Yes No No Shape_Leng Shape_Leng Double Yes Yes No No Subtype Name Default Value Domain ObjectClass FType FlowLine Ftype Index Name Ascending Unique Fields FDO_OBJECTID Yes Yes OBJECTID FDO_Shape No No Shape Back to Top Quick_Land Alias Dataset Type Quick_Land FeatureClass FeatureType Simple Geometry:Polygon Average Number of Points:0 Has M:No Has Z:No Grid Size:76000 Field Name Alias Type Precn.ScaleLengthEdit Null Req. Domain Fixed OBJECTID OBJECTID OID No No Yes No Shape Shape Geometry Yes Yes Yes No AREA AREA Double Yes Yes No No PERIMETER PERIMETER Double Yes Yes No No BODY BODY Double Yes Yes No No Methodology and Support Documentation Page V-70
187 CNTY_LINE_ CNTY_LINE_ Double Yes Yes No No COUNTY COUNTY String Yes Yes No No TYPE TYPE String Yes Yes No No Subtype Name Default Value Domain ObjectClass Index Name Ascending Unique Fields FDO_OBJECTID Yes Yes OBJECTID FDO_Shape No No Shape Back to Top Reg_FIRM Alias Dataset Type Reg_FIRM FeatureClass FeatureType Simple Geometry:Polygon Average Number of Points:0 Has M:No Has Z:No Grid Size:18000 Field Name Alias Type Precn.ScaleLengthEdit Null Req. Domain Fixed OBJECTID OBJECTID OID No No Yes No Shape Shape Geometry Yes Yes Yes No FLD_ZONE FLD_ZONE String Yes Yes No No InPoly_FID InPoly_FID Integer Yes Yes No No SimPlyFlag SimPlyFlag Small Integer Yes Yes No No FloodPlain FloodPlain String Yes Yes No No description description String Yes Yes No No Sq_Miles Sq_Miles Double Yes Yes No No Subtype Name Default Value Domain ObjectClass Index Name Ascending Unique Fields FDO_OBJECTID Yes Yes OBJECTID FDO_Shape No No Shape Back to Top Reg_POR Alias Dataset Type Reg_POR FeatureClass FeatureType Simple Geometry:Point Average Number of Points:0 Has M:No Has Z:No Grid Size: Field Name Alias Type Precn.ScaleLengthEdit Null Req. Domain Fixed Methodology and Support Documentation Page V-71
188 OBJECTID_12 OBJECTID_12 OID No No Yes No Shape Shape Geometry Yes Yes Yes No OBJECTID OBJECTID Integer Yes Yes No No POR_ID POR_ID Integer Yes Yes No No NAME NAME String Yes Yes No No TIME_ID TIME_ID String Yes Yes No No DEM_ELEV DEM_ELEV Double Yes Yes No No C1D C1D Double Yes Yes No No C2D C2D Double Yes Yes No No C3D C3D Double Yes Yes No No C4D C4D Double Yes Yes No No C5D C5D Double Yes Yes No No C1SRG C1SRG Double Yes Yes No No C2SRG C2SRG Double Yes Yes No No C3SRG C3SRG Double Yes Yes No No C4SRG C4SRG Double Yes Yes No No C5SRG C5SRG Double Yes Yes No No USNG USNG String Yes Yes No No In_Evac In_Evac String Yes Yes No No Subtype Name Default Value Domain ObjectClass Index Name Ascending Unique Fields FDO_OBJECTID_12 Yes Yes OBJECTID_12 FDO_Shape No No Shape Back to Top Methodology and Support Documentation Page V-72
189 Reg_Spot Alias Dataset Type Reg_Spot FeatureClass FeatureType Simple Geometry:Point Average Number of Points:0 Has M:No Has Z:No Grid Size: Field Name Alias Type Precn.ScaleLengthEdit Null Req. Domain Fixed OBJECTID OBJECTID OID No No Yes No Shape Shape Geometry Yes Yes Yes No C5SPOT C5SPOT Double Yes Yes No No DATE_STAMP DATE_STAMP Date Yes Yes No No NOTES NOTES String Yes Yes No No RASTERVALU RASTERVALU Double Yes Yes No No Subtype Name Default Value Domain ObjectClass Index Name Ascending Unique Fields FDO_OBJECTID Yes Yes OBJECTID FDO_Shape No No Shape Back to Top SAD_Data_jn Alias SAD_Data_jn Dataset Type Table FeatureType - Field Name Alias Type Precn.ScaleLengthEdit Null Req. Domain Fixed OBJECTID OBJECTID OID No No Yes No CENSUSTAZ CENSUSTAZ Double Yes Yes No No STFID STFID Double Yes Yes No No REGTAZ REGTAZ String Yes Yes No No FIPS FIPS String Yes Yes No No ACRES ACRES Double Yes Yes No No CETAZJN CETAZJN String Yes Yes No No DTSB_06 DTSB_06 Double Yes Yes No No PCTSO_06 PCTSO_06 Double Yes Yes No No ODTSB_06 ODTSB_06 Double Yes Yes No No PHTSB_06 PHTSB_06 Double Yes Yes No No PTSB_06 PTSB_06 Double Yes Yes No No VHTSB_06 VHTSB_06 Double Yes Yes No No VTSB_06 VTSB_06 Double Yes Yes No No D_MB_06 D_MB_06 Double Yes Yes No No PC_MO_06 PC_MO_06 Double Yes Yes No No O_MB_06 O_MB_06 Double Yes Yes No No PH_MO_06 PH_MO_06 Double Yes Yes No No Methodology and Support Documentation Page V-73
190 P_MB_06 P_MB_06 Double Yes Yes No No VH_MB_06 VH_MB_06 Double Yes Yes No No V_MB_06 V_MB_06 Double Yes Yes No No HM_U_06 HM_U_06 Double Yes Yes No No HM_O_06 HM_O_06 Double Yes Yes No No HM_OU_06 HM_OU_06 Double Yes Yes No No HM_PH_06 HM_PH_06 Double Yes Yes No No HM_P_06 HM_P_06 Double Yes Yes No No HM_VH_06 HM_VH_06 Double Yes Yes No No HM_V_06 HM_V_06 Double Yes Yes No No SH_CP_06 SH_CP_06 Double Yes Yes No No GQ_P_06 GQ_P_06 Double Yes Yes No No GQ_VE_06 GQ_VE_06 Double Yes Yes No No DTSB_10 DTSB_10 Double Yes Yes No No PCTSO_10 PCTSO_10 Double Yes Yes No No ODTSB_10 ODTSB_10 Double Yes Yes No No PHTSB_10 PHTSB_10 Double Yes Yes No No PTSB_10 PTSB_10 Double Yes Yes No No VHTSB_10 VHTSB_10 Double Yes Yes No No VTSB_10 VTSB_10 Double Yes Yes No No D_MB_10 D_MB_10 Double Yes Yes No No PC_MO_10 PC_MO_10 Double Yes Yes No No O_MB_10 O_MB_10 Double Yes Yes No No PH_MO_10 PH_MO_10 Double Yes Yes No No P_MB_10 P_MB_10 Double Yes Yes No No VH_MB_10 VH_MB_10 Double Yes Yes No No V_MB_10 V_MB_10 Double Yes Yes No No HM_U_10 HM_U_10 Double Yes Yes No No HM_O_10 HM_O_10 Double Yes Yes No No HM_OU_10 HM_OU_10 Double Yes Yes No No HM_PH_10 HM_PH_10 Double Yes Yes No No HM_P_10 HM_P_10 Double Yes Yes No No HM_VH_10 HM_VH_10 Double Yes Yes No No HM_V_10 HM_V_10 Double Yes Yes No No SH_CP_10 SH_CP_10 Double Yes Yes No No GQ_P_10 GQ_P_10 Double Yes Yes No No GQ_VE_10 GQ_VE_10 String Yes Yes No No DTSB_15 DTSB_15 Double Yes Yes No No PCTSO_15 PCTSO_15 Double Yes Yes No No ODTSB_15 ODTSB_15 Double Yes Yes No No PHTSB_15 PHTSB_15 Double Yes Yes No No PTSB_15 PTSB_15 Double Yes Yes No No VHTSB_15 VHTSB_15 Double Yes Yes No No VTSB_15 VTSB_15 Double Yes Yes No No D_MB_15 D_MB_15 Double Yes Yes No No PC_MO_15 PC_MO_15 Double Yes Yes No No O_MB_15 O_MB_15 Double Yes Yes No No PH_MO_15 PH_MO_15 Double Yes Yes No No P_MB_15 P_MB_15 Double Yes Yes No No Methodology and Support Documentation Page V-74
191 VH_MB_15 VH_MB_15 Double Yes Yes No No V_MB_15 V_MB_15 Double Yes Yes No No HM_U_15 HM_U_15 Double Yes Yes No No HM_O_15 HM_O_15 Double Yes Yes No No HM_OU_15 HM_OU_15 Double Yes Yes No No HM_PH_15 HM_PH_15 Double Yes Yes No No HM_P_15 HM_P_15 Double Yes Yes No No HM_VH_15 HM_VH_15 Double Yes Yes No No HM_V_15 HM_V_15 Double Yes Yes No No SH_CP_15 SH_CP_15 Double Yes Yes No No GQ_P_15 GQ_P_15 Double Yes Yes No No GQ_VE_15 GQ_VE_15 String Yes Yes No No fix_flag fix_flag String Yes Yes No No Subtype Name Default Value Domain ObjectClass Index Name Ascending Unique Fields FDO_OBJECTID Yes Yes OBJECTID REGTAZ Yes No REGTAZ Back to Top SAD_Final Alias Dataset Type SmallAreaData FeatureClass FeatureType Simple Geometry:Polygon Average Number of Points:0 Has M:No Has Z:No Grid Size:6100 Field Name Alias Type Precn.ScaleLengthEdit Null Req. Domain Fixed OBJECTID OBJECTID OID No No Yes Yes SHAPE SHAPE Geometry Yes Yes Yes Yes Acres Acres Double Yes No No No CENSUSTAZ CENSUSTAZ String Yes No No No STFID STFID String Yes No No No REGTAZ REGTAZ String Yes No No No TAZ TAZ Small Integer Yes No No No FIPS FIPS String Yes No No No CeTAZJn CeTAZJn String Yes No No No ModelZone ModelZone String Yes No No No dyn_data dyn_data Single Yes No No No Shape_Leng Shape_Leng Double Yes No No No Subtype Name Default Value Domain ObjectClass Index Name Ascending Unique Fields FDO_OBJECTID Yes Yes OBJECTID FDO_SHAPE No No SHAPE Methodology and Support Documentation Page V-75
192 Back to Top Shelter_Master Alias Shelter_Master Dataset Type Table FeatureType - Field Name Alias Type Precn.ScaleLengthEdit Null Req. Domain Fixed OBJECTID OBJECTID OID No No Yes No GIS_ID GIS_ID String Yes Yes No No NAME NAME String Yes Yes No No ADDRESS ADDRESS String Yes Yes No No CITY CITY String Yes Yes No No COUNTY COUNTY String Yes Yes No No ZIP ZIP Double Yes Yes No No BLDGS BLDGS String Yes Yes No No REGION REGION Double Yes Yes No No PHONE PHONE String Yes Yes No No POC POC String Yes Yes No No POC_PHONE POC_PHONE String Yes Yes No No POC_ POC_ String Yes Yes No No ALT_POC ALT_POC String Yes Yes No No ALT_PHONE ALT_PHONE String Yes Yes No No PET_FRIEND PET_FRIEND Double Yes Yes No No PREMITFT2 PREMITFT2 Double Yes Yes No No PREMITCAP PREMITCAP Double Yes Yes No No EHPAFT2 EHPAFT2 Double Yes Yes No No EHPACAP EHPACAP Double Yes Yes No No RETFT2 RETFT2 Double Yes Yes No No RETCAP RETCAP Double Yes Yes No No TOTCAPGAIN TOTCAPGAIN Double Yes Yes No No FUND_SRC FUND_SRC String Yes Yes No No SPNFT2 SPNFT2 String Yes Yes No No SPNCAP SPNCAP Double Yes Yes No No GENPOPFT2 GENPOPFT2 String Yes Yes No No GENPOPCAP GENPOPCAP Double Yes Yes No No TOTRISKCAP TOTRISKCAP Double Yes Yes No No HOSTGENCAP HOSTGENCAP Double Yes Yes No No HOSTSPNCAP HOSTSPNCAP String Yes Yes No No HOSTTOTCAP HOSTTOTCAP String Yes Yes No No ELEVATION ELEVATION String Yes Yes No No USNG USNG String Yes Yes No No LAT LAT String Yes Yes No No LON LON String Yes Yes No No VERIFIED VERIFIED Double Yes Yes No No CHK_METH CHK_METH String Yes Yes No No NFIP NFIP String Yes Yes No No Methodology and Support Documentation Page V-76
193 IN_ZONE IN_ZONE String Yes Yes No No IJ_Grid IJ_Grid String Yes Yes No No SURGE1 SURGE1 String Yes Yes No No SURGE2 SURGE2 String Yes Yes No No SURGE3 SURGE3 String Yes Yes No No SURGE4 SURGE4 String Yes Yes No No SURGE5 SURGE5 String Yes Yes No No SCHBRD_NUM SCHBRD_NUM String Yes Yes No No ADA_COMPLY ADA_COMPLY String Yes Yes No No GENERATOR GENERATOR String Yes Yes No No KW_CAP KW_CAP String Yes Yes No No FUEL_TYPE FUEL_TYPE String Yes Yes No No FUEL_CAP FUEL_CAP String Yes Yes No No ABOVE_BELO ABOVE_BELO String Yes Yes No No KITCHEN KITCHEN String Yes Yes No No BREAKRM BREAKRM String Yes Yes No No COLD_STOR COLD_STOR String Yes Yes No No SLEEPFAC SLEEPFAC String Yes Yes No No SHOWERS SHOWERS String Yes Yes No No RESTROOMS RESTROOMS String Yes Yes No No COOL_ELE COOL_ELE String Yes Yes No No COOL_PRP COOL_PRP String Yes Yes No No COOL_NG COOL_NG String Yes Yes No No COOK_ELE COOK_ELE String Yes Yes No No COOK_PRP COOK_PRP String Yes Yes No No COOK_NG COOK_NG String Yes Yes No No MEDICAL MEDICAL String Yes Yes No No FOOD_STORE FOOD_STORE String Yes Yes No No MED_STORE MED_STORE String Yes Yes No No YR_CONST YR_CONST Double Yes Yes No No TYPE_CONST TYPE_CONST String Yes Yes No No NORM_FUNCT NORM_FUNCT String Yes Yes No No OCCUP_CAP OCCUP_CAP String Yes Yes No No LOCALCAP LOCALCAP Double Yes Yes No No UPDATE_ UPDATE_ String Yes Yes No No NOTES NOTES String Yes Yes No No IMG_VIEW IMG_VIEW String Yes Yes No No SPECIAL SPECIAL Double Yes Yes No No STATUS STATUS Double Yes Yes No No Subtype Name Default Value Domain ObjectClass Index Name Ascending Unique Fields FDO_OBJECTID Yes Yes OBJECTID Back to Top Shelters Alias Shelters Geometry:Point Methodology and Support Documentation Page V-77
194 Dataset Type FeatureClass FeatureType Simple Average Number of Points:0 Has M:No Has Z:No Grid Size: Field Name Alias Type Precn.ScaleLengthEdit Null Req. Domain Fixed OBJECTID OBJECTID OID No No Yes No Shape Shape Geometry Yes Yes Yes No FeatureID FeatureID String Yes Yes No No Facility_Type Facility_Type String Yes Yes No No Emer_Function Emer_Function String Yes Yes No No Name Name String Yes Yes No No Address Address String Yes Yes No No City City String Yes Yes No No Countyid Countyid String Yes Yes No No County County String Yes Yes No No Zip5 Zip5 String Yes Yes No No Notes Notes String Yes Yes No No Editdate Editdate Date Yes Yes No No X X Double Yes Yes No No Y Y Double Yes Yes No No USNG USNG String Yes Yes No No Facility_Desc Facility_Desc String Yes Yes No No Publish Publish String Yes Yes No No Surge Surge Small Integer Yes Yes No No Elev Elev Single Yes Yes No No Fire Fire String Yes Yes No No Flood Flood String Yes Yes No No Evac Evac String Yes Yes No No Phase Phase String Yes Yes No No Guide_Num Guide_Num Small Integer Yes Yes No No Cnty_Type Cnty_Type String Yes Yes No No NEAR_FID NEAR_FID Integer Yes Yes No No NEAR_ANGLE NEAR_ANGLE Double Yes Yes No No EVRoute_Mi EVRoute_Mi Single Yes Yes No No Subtype Name Default Value Domain ObjectClass Facility_Type FACILITY_TYPE Emer_Function EMER_FUNCTION Countyid COUNTY_FIPS Facility_Desc SHELTER_TYPE Evac Evac Zones Index Name Ascending Unique Fields FDO_OBJECTID Yes Yes OBJECTID FDO_Shape No No Shape Back to Top Methodology and Support Documentation Page V-78
195 SLOSH_Basin Alias Dataset Type SLOSH_Basin FeatureClass FeatureType Simple Geometry:Polygon Average Number of Points:0 Has M:No Has Z:No Grid Size:2100 Field Name Alias Type Precn.ScaleLengthEdit Null Req. Domain Fixed OBJECTID OBJECTID OID No No Yes Yes SHAPE SHAPE Geometry Yes Yes Yes Yes Poly_id Poly_id String Yes No No No i_index i_index Small Integer Yes No No No j_index j_index Small Integer Yes No No No c1_mean c1_mean Single Yes No No No c1_high c1_high Single Yes No No No c2_mean c2_mean Single Yes No No No c2_high c2_high Single Yes No No No c3_mean c3_mean Single Yes No No No c3_high c3_high Single Yes No No No c4_mean c4_mean Single Yes No No No c4_high c4_high Single Yes No No No c5_mean c5_mean Single Yes No No No c5_high c5_high Single Yes No No No Subtype Name Default Value Domain ObjectClass Index Name Ascending Unique Fields FDO_OBJECTID Yes Yes OBJECTID FDO_SHAPE No No SHAPE Back to Top SurgeZones Alias Dataset Type SurgeZones FeatureClass FeatureType Simple Geometry:Polygon Average Number of Points:0 Has M:No Has Z:No Grid Size:16000 Field Name Alias Type Precn.ScaleLengthEdit Null Req. Domain Fixed OBJECTID OBJECTID OID No No Yes Yes SHAPE SHAPE Geometry Yes Yes Yes Yes AREA AREA Double Yes Yes No No PERIMETER PERIMETER Double Yes Yes No No Cat Cat Small Integer Yes Yes No No Methodology and Support Documentation Page V-79
196 Acres Acres Double Yes Yes No No Subtype Name Default Value Domain ObjectClass Cat Surge Zones Index Name Ascending Unique Fields FDO_OBJECTID Yes Yes OBJECTID FDO_SHAPE No No SHAPE Back to Top Swamps Alias Dataset Type Swamps FeatureClass FeatureType Simple Geometry:Polygon Average Number of Points:0 Has M:No Has Z:Yes Grid Size:1100 Grid Size:9900 Field Name Alias Type Precn.ScaleLengthEdit Null Req. Domain Fixed OBJECTID OBJECTID OID No No Yes No Shape Shape Geometry Yes Yes Yes No ComID ComID Integer Yes No No No FDate FDate Date Yes Yes No No Resolution Resolution Integer Yes No No No GNIS_ID GNIS_ID String Yes Yes No No GNIS_Name GNIS_Name String Yes Yes No No AreaSqKm AreaSqKm Double Yes Yes No No Elevation Elevation Double Yes Yes No No ReachCode ReachCode String Yes Yes No No FType FType Integer Yes No No No FCode FCode Integer Yes Yes No No Subtype Name Default Value Domain ObjectClass ComID 0 - Resolution 2 Resolution Elevation ElevationRange FType 390 Water Code Types FCode Index Name Ascending Unique Fields FDO_OBJECTID Yes Yes OBJECTID FDO_Shape No No Shape Back to Top TEA_Final Methodology and Support Documentation Page V-80
197 Alias Dataset Type TEA_Final FeatureClass FeatureType Simple Geometry:Polygon Average Number of Points:0 Has M:No Has Z:No Grid Size:27000 Field Name Alias Type Precn.ScaleLengthEdit Null Req. Domain Fixed OBJECTID OBJECTID OID No No Yes Yes SHAPE SHAPE Geometry Yes Yes Yes Yes IND_ID IND_ID String Yes No No No TEA_NAME TEA_NAME String Yes No No No Src_Type Src_Type String Yes Yes No No Subtype Name Default Value Domain ObjectClass Index Name Ascending Unique Fields FDO_OBJECTID Yes Yes OBJECTID FDO_SHAPE No No SHAPE IND_ID Yes No IND_ID Back to Top Methodology and Support Documentation Page V-81
198 TEZ_Final Alias Dataset Type TEZ_Final FeatureClass FeatureType Simple Geometry:Polygon Average Number of Points:0 Has M:No Has Z:No Grid Size:7000 Field Name Alias Type Precn.ScaleLengthEdit Null Req. Domain Fixed OBJECTID OBJECTID OID No No Yes No Shape Shape Geometry Yes Yes Yes No SWTEZ SWTEZ Integer Yes Yes No No RGN RGN Integer Yes Yes No No CNTY CNTY Integer Yes Yes No No STORM STORM String Yes Yes No No FLOOD FLOOD String Yes Yes No No FIRE FIRE String Yes Yes No No PCAT1 PCAT1 Integer Yes Yes No No PCAT2 PCAT2 Integer Yes Yes No No PCAT3 PCAT3 Integer Yes Yes No No PCAT4 PCAT4 Integer Yes Yes No No PCAT5 PCAT5 Integer Yes Yes No No PCAT6 PCAT6 Integer Yes Yes No No DSSB_06 DSSB_06 Double Yes Yes No No DMSB_06 DMSB_06 Double Yes Yes No No DTSB_06 DTSB_06 Double Yes Yes No No PCSSO_06 PCSSO_06 Double Yes Yes No No PCMSO_06 PCMSO_06 Double Yes Yes No No PCTSO_06 PCTSO_06 Double Yes Yes No No ODSSB_06 ODSSB_06 Double Yes Yes No No ODMSB_06 ODMSB_06 Double Yes Yes No No ODTSB_06 ODTSB_06 Double Yes Yes No No PHSSB_06 PHSSB_06 Double Yes Yes No No PHMSB_06 PHMSB_06 Double Yes Yes No No PHTSB_06 PHTSB_06 Double Yes Yes No No PSSB_06 PSSB_06 Double Yes Yes No No PMSB_06 PMSB_06 Double Yes Yes No No PTSB_06 PTSB_06 Double Yes Yes No No VHSSB_06 VHSSB_06 Double Yes Yes No No VHMSB_06 VHMSB_06 Double Yes Yes No No VHTSB_06 VHTSB_06 Double Yes Yes No No VSSB_06 VSSB_06 Double Yes Yes No No VMSB_06 VMSB_06 Double Yes Yes No No VTSB_06 VTSB_06 Double Yes Yes No No D_MB_06 D_MB_06 Double Yes Yes No No PC_MO_06 PC_MO_06 Double Yes Yes No No O_MB_06 O_MB_06 Double Yes Yes No No PH_MO_06 PH_MO_06 Double Yes Yes No No P_MB_06 P_MB_06 Double Yes Yes No No Methodology and Support Documentation Page V-82
199 VH_MB_06 VH_MB_06 Double Yes Yes No No V_MB_06 V_MB_06 Double Yes Yes No No HM_U_06 HM_U_06 Double Yes Yes No No HM_O_06 HM_O_06 Double Yes Yes No No HM_OU_06 HM_OU_06 Double Yes Yes No No HM_PH_06 HM_PH_06 Double Yes Yes No No HM_P_06 HM_P_06 Double Yes Yes No No HM_VH_06 HM_VH_06 Double Yes Yes No No HM_V_06 HM_V_06 Double Yes Yes No No SH_CP_06 SH_CP_06 Double Yes Yes No No DSSB_10 DSSB_10 Double Yes Yes No No DMSB_10 DMSB_10 Double Yes Yes No No DTSB_10 DTSB_10 Double Yes Yes No No PCSSO_10 PCSSO_10 Double Yes Yes No No PCMSO_10 PCMSO_10 Double Yes Yes No No PCTSO_10 PCTSO_10 Double Yes Yes No No ODSSB_10 ODSSB_10 Double Yes Yes No No ODMSB_10 ODMSB_10 Double Yes Yes No No ODTSB_10 ODTSB_10 Double Yes Yes No No PHSSB_10 PHSSB_10 Double Yes Yes No No PHMSB_10 PHMSB_10 Double Yes Yes No No PHTSB_10 PHTSB_10 Double Yes Yes No No PSSB_10 PSSB_10 Double Yes Yes No No PMSB_10 PMSB_10 Double Yes Yes No No PTSB_10 PTSB_10 Double Yes Yes No No VHSSB_10 VHSSB_10 Double Yes Yes No No VHMSB_10 VHMSB_10 Double Yes Yes No No VHTSB_10 VHTSB_10 Double Yes Yes No No VSSB_10 VSSB_10 Double Yes Yes No No VMSB_10 VMSB_10 Double Yes Yes No No VTSB_10 VTSB_10 Double Yes Yes No No D_MB_10 D_MB_10 Double Yes Yes No No PC_MO_10 PC_MO_10 Double Yes Yes No No O_MB_10 O_MB_10 Double Yes Yes No No PH_MO_10 PH_MO_10 Double Yes Yes No No P_MB_10 P_MB_10 Double Yes Yes No No VH_MB_10 VH_MB_10 Double Yes Yes No No V_MB_10 V_MB_10 Double Yes Yes No No HM_U_10 HM_U_10 Double Yes Yes No No HM_O_10 HM_O_10 Double Yes Yes No No HM_OU_10 HM_OU_10 Double Yes Yes No No HM_PH_10 HM_PH_10 Double Yes Yes No No HM_P_10 HM_P_10 Double Yes Yes No No HM_VH_10 HM_VH_10 Double Yes Yes No No HM_V_10 HM_V_10 Double Yes Yes No No SH_CP_10 SH_CP_10 Double Yes Yes No No DSSB_15 DSSB_15 Double Yes Yes No No DMSB_15 DMSB_15 Double Yes Yes No No DTSB_15 DTSB_15 Double Yes Yes No No Methodology and Support Documentation Page V-83
200 PCSSO_15 PCSSO_15 Double Yes Yes No No PCMSO_15 PCMSO_15 Double Yes Yes No No PCTSO_15 PCTSO_15 Double Yes Yes No No ODSSB_15 ODSSB_15 Double Yes Yes No No ODMSB_15 ODMSB_15 Double Yes Yes No No ODTSB_15 ODTSB_15 Double Yes Yes No No PHSSB_15 PHSSB_15 Double Yes Yes No No PHMSB_15 PHMSB_15 Double Yes Yes No No PHTSB_15 PHTSB_15 Double Yes Yes No No PSSB_15 PSSB_15 Double Yes Yes No No PMSB_15 PMSB_15 Double Yes Yes No No PTSB_15 PTSB_15 Double Yes Yes No No VHSSB_15 VHSSB_15 Double Yes Yes No No VHMSB_15 VHMSB_15 Double Yes Yes No No VHTSB_15 VHTSB_15 Double Yes Yes No No VSSB_15 VSSB_15 Double Yes Yes No No VMSB_15 VMSB_15 Double Yes Yes No No VTSB_15 VTSB_15 Double Yes Yes No No D_MB_15 D_MB_15 Double Yes Yes No No PC_MO_15 PC_MO_15 Double Yes Yes No No O_MB_15 O_MB_15 Double Yes Yes No No PH_MO_15 PH_MO_15 Double Yes Yes No No P_MB_15 P_MB_15 Double Yes Yes No No VH_MB_15 VH_MB_15 Double Yes Yes No No V_MB_15 V_MB_15 Double Yes Yes No No HM_U_15 HM_U_15 Double Yes Yes No No HM_O_15 HM_O_15 Double Yes Yes No No HM_OU_15 HM_OU_15 Double Yes Yes No No HM_PH_15 HM_PH_15 Double Yes Yes No No HM_P_15 HM_P_15 Double Yes Yes No No HM_VH_15 HM_VH_15 Double Yes Yes No No HM_V_15 HM_V_15 Double Yes Yes No No SH_CP_15 SH_CP_15 Double Yes Yes No No D_UNIV D_UNIV Small Integer Yes Yes No No SPEC_GEN SPEC_GEN Small Integer Yes Yes No No ZIND ZIND Small Integer Yes Yes No No EAZ_1 EAZ_1 Small Integer Yes Yes No No EAZ_2 EAZ_2 Small Integer Yes Yes No No EAZ_3 EAZ_3 Small Integer Yes Yes No No EAZ_4 EAZ_4 Small Integer Yes Yes No No EAZ_5 EAZ_5 Small Integer Yes Yes No No Methodology and Support Documentation Page V-84
201 EAZ_6 EAZ_6 Small Integer Yes Yes No No EAZ_7 EAZ_7 Small Integer Yes Yes No No EAZ_8 EAZ_8 Small Integer Yes Yes No No EAZ_9 EAZ_9 Small Integer Yes Yes No No EAZ_10 EAZ_10 Small Integer Yes Yes No No EAZ_11 EAZ_11 Small Integer Yes Yes No No AREA AREA Double Yes Yes No No Shape_Leng Shape_Leng Double Yes Yes No No Subtype Name Default Value Domain ObjectClass Index Name Ascending Unique Fields FDO_OBJECTID Yes Yes OBJECTID FDO_Shape No No Shape SWTEZ Yes No SWTEZ Back to Top Tornado_Touchdown Alias Dataset Type Tornado_Touchdown FeatureClass FeatureType Simple Geometry:Polyline Average Number of Points:0 Has M:No Has Z:No Grid Size: Field Name Alias Type Precn.ScaleLengthEdit Null Req. Domain Fixed OBJECTID OBJECTID OID No No Yes No Shape Shape Geometry Yes Yes Yes No EventID EventID Integer Yes Yes No No FID_1 FID_1 Integer Yes Yes No No ONETOR_COU ONETOR_COU Double Yes Yes No No YEAR_COUNT YEAR_COUNT Double Yes Yes No No YEAR_ YEAR_ Double Yes Yes No No MONTH_ MONTH_ Double Yes Yes No No DAY_ DAY_ Double Yes Yes No No DATE_ DATE_ Date Yes Yes No No TIME_ TIME_ Double Yes Yes No No TIME_ZONE TIME_ZONE Double Yes Yes No No STATE STATE String Yes Yes No No FIPS FIPS Double Yes Yes No No STATE_NUMB STATE_NUMB Double Yes Yes No No F_SCALE F_SCALE Double Yes Yes No No INJURIES INJURIES Double Yes Yes No No Methodology and Support Documentation Page V-85
202 FATALITIES FATALITIES Double Yes Yes No No LOSS LOSS Double Yes Yes No No CROP_LOSS CROP_LOSS Double Yes Yes No No SLAT SLAT Double Yes Yes No No SLON SLON Double Yes Yes No No ELAT ELAT Double Yes Yes No No ELON ELON Double Yes Yes No No LENGTH LENGTH Double Yes Yes No No WIDTH WIDTH Double Yes Yes No No NS NS Double Yes Yes No No SN SN Double Yes Yes No No SG SG Double Yes Yes No No F1 F1 Double Yes Yes No No F2 F2 Double Yes Yes No No F3 F3 Double Yes Yes No No F4 F4 Double Yes Yes No No Subtype Name Default Value Domain ObjectClass Index Name Ascending Unique Fields FDO_OBJECTID Yes Yes OBJECTID FDO_Shape No No Shape Back to Top Methodology and Support Documentation Page V-86
203 Vulnerable_CFI_302 Alias Dataset Type CFI_Haz_302 FeatureClass FeatureType Simple Geometry:Point Average Number of Points:0 Has M:No Has Z:No Grid Size: Field Name Alias Type Precn.ScaleLengthEdit Null Req. Domain Fixed OBJECTID OBJECTID OID No No Yes Yes SHAPE SHAPE Geometry Yes Yes Yes Yes PRIME PRIME Integer Yes No No No FacilityNa FacilityNa String Yes No No No SICCode SICCode String Yes No No No SICCode2 SICCode2 String Yes No No No NAICSCode NAICSCode String Yes No No No RCRACode RCRACode String Yes No No No RCRACode2 RCRACode2 String Yes No No No NPDESCode NPDESCode String Yes No No No NPDESCode2 NPDESCode2 String Yes No No No UICCode UICCode String Yes No No No UICCode2 UICCode2 String Yes No No No DunBradstr DunBradstr String Yes No No No DunBrads_1 DunBrads_1 String Yes No No No TRICode TRICode String Yes No No No EPACode EPACode String Yes No No No EPACode2 EPACode2 String Yes No No No Address Address String Yes No No No City City String Yes No No No State State String Yes No No No Zipcode Zipcode String Yes No No No County County String Yes No No No LEPC LEPC Integer Yes No No No Latitude Latitude Double Yes No No No Longitude Longitude Double Yes No No No InactiveDa InactiveDa Date Yes Yes No No ActiveDate ActiveDate Date Yes Yes No No SalePendin SalePendin Small Integer Yes No No No ArchiveBox ArchiveBox String Yes No No No Sec304 Sec304 Small Integer Yes No No No Sec302 Sec302 Small Integer Yes No No No Date_ Date_ Date Yes Yes No No PaymentID PaymentID Integer Yes No No No Retraction Retraction Date Yes Yes No No Sec311 Sec311 Small Integer Yes No No No Methodology and Support Documentation Page V-87
204 Sec313 Sec313 Small Integer Yes No No No Sec112r Sec112r Small Integer Yes No No No Date1 Date1 Date Yes Yes No No rlevel rlevel String Yes No No No rexemptor rexemptor String Yes No No No OriginalDa OriginalDa Date Yes Yes No No ProgramLev ProgramLev Integer Yes No No No DeRegistra DeRegistra Date Yes Yes No No Parent Parent String Yes No No No ParentD_B ParentD_B String Yes No No No Comments Comments String Yes No No No SercCode SercCode String Yes No No No FirstLette FirstLette String Yes No No No HASiteVisi HASiteVisi Date Yes Yes No No NOAFlag NOAFlag Small Integer Yes No No No PlotSource PlotSource String Yes No No No USNG USNG String Yes No No No Surge Surge Small Integer Yes No No No Evac Evac String Yes No No No Flood Flood String Yes No No No Fire Fire String Yes No No No Elev Elev Single Yes No No No Subtype Name Default Value Domain ObjectClass Index Name Ascending Unique Fields FDO_OBJECTID Yes Yes OBJECTID FDO_SHAPE No No SHAPE Back to Top Vulnerable_CFI_Health Alias Dataset Type Vulnerable_CFI_Health FeatureClass FeatureType Simple Geometry:Point Average Number of Points:0 Has M:No Has Z:No Grid Size: Field Name Alias Type Precn.ScaleLengthEdit Null Req. Domain Fixed OBJECTID OBJECTID OID No No Yes Yes SHAPE SHAPE Geometry Yes Yes Yes Yes FeatureID FeatureID String Yes No No No GnisID GnisID Double Yes No No No CFI_Type Facility_T String Yes No No No Emer_Funct Emer_Funct String Yes No No No Methodology and Support Documentation Page V-88
205 Name Name String Yes No No No Address Address String Yes No No No City City String Yes No No No County County String Yes No No No Zip Zip String Yes No No No Notes Notes String Yes No No No EditDate EditDate Date Yes Yes No No EditorName EditorName String Yes No No No X X Double Yes No No No Y Y Double Yes No No No USNG USNG String Yes No No No DEM_Elev DEM_Elev Single Yes No No No Surge Surge Small Integer Yes No No No Evac Evac String Yes No No No Flood Flood String Yes No No No Fire Fire String Yes No No No Detail Detail String Yes No No No Facility_Type Facility_Type String Yes Yes No No Subtype Name Default Value Domain ObjectClass Index Name Ascending Unique Fields FDO_OBJECTID Yes Yes OBJECTID FDO_SHAPE No No SHAPE Back to Top Vulnerable_CFI_Other Alias Dataset Type CFI_Other FeatureClass FeatureType Simple Geometry:Point Average Number of Points:0 Has M:No Has Z:No Grid Size: Field Name Alias Type Precn.ScaleLengthEdit Null Req. Domain Fixed OBJECTID OBJECTID OID No No Yes Yes SHAPE SHAPE Geometry Yes Yes Yes Yes FeatureID FeatureID String Yes No No No GnisID GnisID Double Yes No No No CFI_Type Facility_T String Yes No No No Emer_Funct Emer_Funct String Yes No No No Name Name String Yes No No No Address Address String Yes No No No City City String Yes No No No County County String Yes No No No Zip Zip String Yes No No No Notes Notes String Yes No No No EditDate EditDate Date Yes Yes No No Methodology and Support Documentation Page V-89
206 EditorName EditorName String Yes No No No X X Double Yes No No No Y Y Double Yes No No No USNG USNG String Yes No No No DEM_Elev DEM_Elev Single Yes No No No Evac Evac String Yes No No No Surge Surge Small Integer Yes No No No Fire Fire String Yes No No No Flood Flood String Yes No No No Detail Detail String Yes No No No Subtype Name Default Value Domain ObjectClass Index Name Ascending Unique Fields FDO_OBJECTID Yes Yes OBJECTID FDO_SHAPE No No SHAPE Back to Top Spatial References Dimension Minimum Precision Lines X Y M Z Coordinate System Description PROJCS["NAD_1983_UTM_Zone_17N",GEOGCS["GCS_North_American_1983",DATUM["D_North_American_1983",SPHEROID["GRS_198 0", , ]],PRIMEM["Greenwich",0.0],UNIT["Degree", ]],PROJECTION["Transverse_Mercator"],PA RAMETER["False_Easting", ],PARAMETER["False_Northing",0.0],PARAMETER["Central_Meridian",- 81.0],PARAMETER["Scale_Factor",0.9996],PARAMETER["Latitude_Of_Origin",0.0],UNIT["Meter",1.0]],VERTCS["NAVD_1988",VDATUM["No rth_american_vertical_datum_1988"],parameter["vertical_shift",0.0],parameter["direction",1.0],unit["meter",1.0]] Points X Y M Z Coordinate System Description PROJCS["NAD_1983_UTM_Zone_17N",GEOGCS["GCS_North_American_1983",DATUM["D_North_American_1983",SPHEROID["GRS_198 0", , ]],PRIMEM["Greenwich",0.0],UNIT["Degree", ]],PROJECTION["Transverse_Mercator"],PA RAMETER["False_Easting", ],PARAMETER["False_Northing",0.0],PARAMETER["Central_Meridian",- 81.0],PARAMETER["Scale_Factor",0.9996],PARAMETER["Latitude_Of_Origin",0.0],UNIT["Meter",1.0]],VERTCS["NAVD_1988",VDATUM["No rth_american_vertical_datum_1988"],parameter["vertical_shift",0.0],parameter["direction",1.0],unit["meter",1.0]] Polygons X Y M Z Coordinate System Description PROJCS["NAD_1983_UTM_Zone_17N",GEOGCS["GCS_North_American_1983",DATUM["D_North_American_1983",SPHEROID["GRS_198 0", , ]],PRIMEM["Greenwich",0.0],UNIT["Degree", ]],PROJECTION["Transverse_Mercator"],PA RAMETER["False_Easting", ],PARAMETER["False_Northing",0.0],PARAMETER["Central_Meridian",- Methodology and Support Documentation Page V-90
207 81.0],PARAMETER["Scale_Factor",0.9996],PARAMETER["Latitude_Of_Origin",0.0],UNIT["Meter",1.0]],VERTCS["NAVD_1988",VDATUM["No rth_american_vertical_datum_1988"],parameter["vertical_shift",0.0],parameter["direction",1.0],unit["meter",1.0]] Source_CriticalFacilities X Y M Z Coordinate System Description PROJCS["NAD_1983_UTM_Zone_17N",GEOGCS["GCS_North_American_1983",DATUM["D_North_American_1983",SPHEROID["GRS_198 0", , ]],PRIMEM["Greenwich",0.0],UNIT["Degree", ]],PROJECTION["Transverse_Mercator"],PA RAMETER["False_Easting", ],PARAMETER["False_Northing",0.0],PARAMETER["Central_Meridian",- 81.0],PARAMETER["Scale_Factor",0.9996],PARAMETER["Latitude_Of_Origin",0.0],UNIT["Meter",1.0]],VERTCS["NAVD_1988",VDATUM["No rth_american_vertical_datum_1988"],parameter["vertical_shift",0.0],parameter["direction",1.0],unit["meter",1.0]] Back to Top Geodatabase Designer is prototype application and is not supported by ESRI. The commands assoicated with this application and the output generated by those commands are not to be used in a production environment. ESRI is not reponsible for errors, ommission or any damages resulting from the use of these commands and associated output. Use of this application is conditional on the acceptance of this statement. Methodology and Support Documentation Page V-91
208 This page intentionally left blank. Methodology and Support Documentation Page V-92
209 Appendix A Evacuation Transportation Model Data Dictionary Methodology and Support Documentation
210 File Name: BTC.dbf File Type: dbase file Scenario Specific: No I/O: Input Attribute Definition TIME Sequential numbers of half-hour time segments over a 96 hour period: starting segment is assumed to represent 7:00 AM on an average Monday FC1IN FC2IN FC6IN FC7IN FC8IN FC9IN FC11IN FC12IN FC14IN FC16IN FC17IN FC19IN Capacity adjustment factors for rural interstates inside of evacuating counties Capacity adjustment factors for rural other principal arterials inside of evacuating counties Capacity adjustment factors for rural minor arterials inside of evacuating counties Capacity adjustment factors for rural major collectors inside of evacuating counties Capacity adjustment factors for rural minor collectors inside of evacuating counties Capacity adjustment factors for rural local streets inside of evacuating counties Capacity adjustment factors for urban interstates inside of evacuating counties Capacity adjustment factors for urban non-interstate freeways inside of evacuating counties Capacity adjustment factors for urban other principal arterials inside of evacuating counties Capacity adjustment factors for urban minor arterials inside of evacuating counties Capacity adjustment factors for urban collectors inside of evacuating counties Capacity adjustment factors for urban local streets inside of evacuating counties Methodology and Support Documentation Page A-1
211 Attribute Definition FC1OUT FC2OUT FC6OUT FC7OUT FC8OUT FC9OUT FC11OUT FC12OUT FC14OUT FC17OUT FC19OUT FC99 Capacity adjustment factors for rural interstates outside of evacuating counties Capacity adjustment factors for rural other principal arterials outside of evacuating counties Capacity adjustment factors for rural minor arterials outside of evacuating counties Capacity adjustment factors for rural major collectors outside of evacuating counties Capacity adjustment factors for rural minor collectors outside of evacuating counties Capacity adjustment factors for rural local streets outside of evacuating counties Capacity adjustment factors for urban interstates outside of evacuating counties Capacity adjustment factors for urban non-interstate freeways outside of evacuating counties Capacity adjustment factors for urban other principal arterials outside of evacuating counties Capacity adjustment factors for urban collectors outside of evacuating counties Capacity adjustment factors for urban local streets outside of evacuating counties Capacity adjustments for centroid connectors Methodology and Support Documentation Page A-2
212 File Name: CNTRFLW.dbf File Type: dbase file Scenario Specific: Yes I/O: Input CPLAN ACTV Attribute Definition Code number indicating the specific reverse lane operations plan being referenced: 1=I-10 Westbound from Jacksonville, 2=SR 528 Westbound from Brevard County, 3=Florida Turnpike Northbound from Palm Beach County, 4=I-4 Eastbound from Tampa, 5=I-75 (Alligator Alley) Westbound from Broward County, 6=I-75 (Alligator Alley) Eastbound from Collier County, 7=I-75 Northbound from Tampa Code indicating whether a particular reverse lane operations plan is active: 1=Active, 0=Inactive Methodology and Support Documentation Page A-3
213 File Name: Control.dbf File Type: dbase file Scenario Specific: Yes I/O: Input CNTY EVAC Attribute Definition County numeric codes specifically developed for this model. Binary code determining whether or not an evacuation order is given: 1=evacuate, 0=do not evacuate PCT100RP Binary code determining whether or not to use 100% response rates for an evacuation: 1=100% response, 0=response rates from the SRESP behavioral survey STRMCAT Evacuation event level: 1=Level A, 2=Level B, 3=Level C, 4=Level D, 5=Level E RESPONSE NOGO TRINCL TROVRD Response curve to be used for the evacuation scenario: 1=6 hours, 2=9 hours, 3=12 hours, 4=18 hours, 5=24 hours, 6=36 hours Binary code determining whether the county is an acceptable out-of-county destination for evacuation trips: 1=Prohibit out-of-county destinations, 0=allow out-ofcounty destinations Binary code determining whether to include tourist population in the evacuation: 1=Include tourists, 0=do not include tourists Binary code determining whether to override default tourist occupancy rates: 1=override default rates, 0=use default rates included in the zone data TRRTE Percent occupancy of tourist dwelling units to be used if default rates are overridden: values range from in increments of 5 PHASE Determines when a particular county begins its evacuation relative to hour one of the evacuation event: 1=hour 1, 2=hour 3, 3=hour 6, 4=hour 9, 5=hour 12, 6=hour 15, 7=hour 18, 8=hour 21, 9=hour 24, 10=hour 27 Methodology and Support Documentation Page A-4
214 File Name: Network File Type: GeoDatabase feature Scenario Specific: Yes I/O: Input A Attribute A node number Definition B B node number SHAPE_LENGTH UID ONEWAY ROAD_NAME STATE DISTRICT_1 Length of shape feature in meters Unique identification number Whether facility is one-way coded: 1=one-way, 0=twoway Name of road Name of State FDOT district numbers; out of state links are numbered 10 and above FTYPE_06 Facility types for 2006 ATYPE_06 Area types for 2006 LANE_06 Number of lanes for 2006 COUNTY_TXT COUNTY_NUM RPC_TXT RPC_NUM EVAC_RTE CAP County name County code number developed for this model Region name Region code number developed for this model Whether the link is part of an evacuation route: 1=evacuation route, 0=not an evacuation route Place holder for hourly lane capacities DENSITY Vehicles per lane per mile at standstill conditions (This attribute is overridden by a hard coded default in the Methodology and Support Documentation Page A-5
215 Attribute model) Definition CONTRA_PLN CONTRA_LNS Number identifying the one-way flow operations plan that the link belongs to Lanes available under one-way flow operations: -1 =no lanes available, >0 =1.66 adjustment to standard capacity during one-way flow operations FTYPE_15 Facility types for 2015 ATYPE_15 Area types for 2015 LANE_15 Number of lanes for 2015 FTYPE_10 Facility types for 2010 ATYPE_10 Area types for 2010 LANE_10 Number of lanes for 2010 RGN_1 RGN_2 RGN_3 RGN_4 RGN_5 RGN_6 RGN_7 Identifies links present in the regional assignment model for the Apalachee region: 1=link is included, 0=link is not included Identifies links present in the regional assignment model for the Central Florida region: 1=link is included, 0=link is not included Identifies links present in the regional assignment model for the East Central Florida region: 1=link is included, 0=link is not included Identifies links present in the regional assignment model for the North Central Florida region: 1=link is included, 0=link is not included Identifies links present in the regional assignment model for the Northeast Florida region: 1=link is included, 0=link is not included Identifies links present in the regional assignment model for the South Florida region: 1=link is included, 0=link is not included Identifies links present in the regional assignment model for the Southwest Florida region: 1=link is included, Methodology and Support Documentation Page A-6
216 Attribute 0=link is not included Definition RGN_8 RGN_9 RGN_10 RGN_11 EZONE FLKEYCAP FLKEYBAK MSEG MMKEYCAP MMKEYLN Identifies links present in the regional assignment model for the Tampa Bay region: 1=link is included, 0=link is not included Identifies links present in the regional assignment model for the Treasure Coast region: 1=link is included, 0=link is not included Identifies links present in the regional assignment model for the West Florida region: 1=link is included, 0=link is not included Identifies links present in the regional assignment model for the Withlacoochee region: 1=link is included, 0=link is not included Identifies the evacuation zone that the link is in: 1=Zone A, 2=Zone B, 3=Zone C, 4=Zone D, 5=Zone E, 6=inland of evacuation zones Hourly lane capacity for links in the Florida Keys Indicates whether the link should use the background traffic curves for US 1 in the Florida Keys: 1=use Florida Keys specific curve, 0=do not use Florida Keys specific curve Segment ID number consistent with segments of US 1 in Monroe County identified in the FDOT memo dated xxxxx (see Apendix X) Hourly lane capacity for links in the Florida Keys found in the Miller Model (these are here for comparative purposes only) Number of lanes for links in the Florida Keys found in the Miller Model (these are here for comparative purposes only) Methodology and Support Documentation Page A-7
217 File Name: LOADED.NET File Type: Cube Binary Network Scenario Specific: Yes I/O: Output A Attribute A node number Definition B B node number UID ONEWAY SPEED ROAD_NAME STATE DISTRICT_1 Unique identification number Whether facility is one-way coded: 1=one-way, 0=twoway Place holder for free-flow speeds Name of road Name of State FDOT district numbers FTYPE_06 Facility types for 2006 ATYPE_06 Area types for 2006 LANE_06 Number of lanes for 2006 COUNTY_TXT COUNTY_NUM RPC_TXT RPC_NUM EVAC_RTE CAP DENSITY County name County code number developed for this model Region name Region code number developed for this model Whether the link is part of an evacuation route: 1=evacuation route, 0=not an evacuation route Hourly lane capacity Vehicles per lane per mile at standstill conditions (This attribute is overridden by a hard coded default in the model) Methodology and Support Documentation Page A-8
218 CONTRA_PLN CONTRA_LNS Attribute Definition Number identifying the one-way flow operations plan that the link belongs to Lanes available under one-way flow operations: -1 =no lanes available, >0 =1.66 adjustment to standard capacity during one-way flow operations FTYPE_15 Facility types for 2015 ATYPE_15 Area types for 2015 LANE_15 Number of lanes for 2015 FTYPE_10 Facility types for 2010 ATYPE_10 Area types for 2010 LANE_10 Number of lanes for 2010 DISTANCE RGN_1 RGN_2 RGN_3 RGN_4 RGN_5 RGN_6 RGN_7 Distance in miles Identifies links present in the regional assignment model for the Apalachee region: 1=link is included, 0=link is not included Identifies links present in the regional assignment model for the Central Florida region: 1=link is included, 0=link is not included Identifies links present in the regional assignment model for the East Central Florida region: 1=link is included, 0=link is not included Identifies links present in the regional assignment model for the North Central Florida region: 1=link is included, 0=link is not included Identifies links present in the regional assignment model for the Northeast Florida region: 1=link is included, 0=link is not included Identifies links present in the regional assignment model for the South Florida region: 1=link is included, 0=link is not included Identifies links present in the regional assignment model Methodology and Support Documentation Page A-9
219 Attribute Definition for the Southwest Florida region: 1=link is included, 0=link is not included RGN_8 RGN_9 RGN_10 RGN_11 EZONE FLKEYCAP FLKEYBAK MSEG MMKEYCAP MMKEYLN FFTIME UROADFACTOR Identifies links present in the regional assignment model for the Tampa Bay region: 1=link is included, 0=link is not included Identifies links present in the regional assignment model for the Treasure Coast region: 1=link is included, 0=link is not included Identifies links present in the regional assignment model for the West Florida region: 1=link is included, 0=link is not included Identifies links present in the regional assignment model for the Withlacoochee region: 1=link is included, 0=link is not included Identifies the evacuation zone that the link is in: 1=Zone A, 2=Zone B, 3=Zone C, 4=Zone D, 5=Zone E, 6=inland of evacuation zones Hourly lane capacity for links in the Florida Keys Indicates whether the link should use the background traffic curves for US 1 in the Florida Keys: 1=use Florida Keys specific curve, 0=do not use Florida Keys specific curve Segment ID number consistent with segments of US 1 in Monroe County identified in the FDOT memo dated xxxxx (see Apendix X) Hourly lane capacity for links in the Florida Keys found in the Miller Model (these are here for comparative purposes only) Number of lanes for links in the Florida Keys found in the Miller Model (these are here for comparative purposes only) Free flow travel time in minutes Capacity adjustment factor used to establish a new capacity for use in the model s volume delay function to set the tolerance travelers have for congestion before Methodology and Support Documentation Page A-10
220 Attribute Definition diverting to seek a faster route CONFAC BPRCOEFFICIENT BPREXPONENT FC TIME_16 VC_16 CSPD_16 VDT_16 VHT_16 VSMP_16 Capacity conversion factor used to convert hourly capacities to daily capacities The coefficient of the Bureau of Public Roads volume delay function (this attribute is disregarded in the model) The exponent of the Bureau of Public Roads volume delay function (this attribute is disregarded in the model) Functional class Average event congested travel time in minutes Volume-to-capacity ratio (not a valid attribute in AVENUE assignments) Average event congested speed Event vehicle-miles traveled Event vehicle-hours traveled Event total evacuation vehicles TIMES*_16 Travel time in minutes per time segment (the * represents the time segment and ranges from in sequential order) SPEEDS*_16 VS*_16 QUEUEVS*_16 BLOCKVS*_16 VITS*_16 Speed per time segment (the * represents the time segment and ranges from in sequential order) Number of vehicles for all volume sets entering the link per time segment (the * represents the time segment and ranges from in sequential order) Number of vehicles queuing on the link per time segment (the * represents the time segment and ranges from in sequential order) Number of vehicles in the queue remaining on the link after the simulation has ended per time segment (should be 0)(the * represents the time segment and ranges from in sequential order) Number of vehicles passing through or queuing on the Methodology and Support Documentation Page A-11
221 V1S*_16 Attribute Definition link per time segment (the * represents the time segment and ranges from in sequential order) Number of vehicles for volume set 1 (the model only uses one volume set) entering the link per time segment (the * represents the time segment and ranges from in sequential order) Methodology and Support Documentation Page A-12
222 File Name: MasterResponse.dbf File Type: dbase file Scenario Specific: No I/O: Input HOUR 6HR 9HR 12HR 18HR 24HR 36HR Attribute Definition Number of half-hour time segment for a 36 hour period Factors for a 6 hour response curve Factors for a 9 hour response curve Factors for a 12 hour response curve Factors for an 18 hour response curve Factors for a 24 hour response curve Factors for a 36 hour response curve Methodology and Support Documentation Page A-13
223 File Name: OOCMaster.dbf File Type: dbase file Scenario Specific: No I/O: Input RGN SHLTR FRFAM Attribute Definition Region code number specific to this model Percent of out-of-county trips destined for public shelter Percent of out-of-county trips destined for friends and family HOTMOT Percent of out-of-county trips destined for hotel/motel OTHER Percent of out-of-county trips destined for other destinations NOGO Attribute not used Methodology and Support Documentation Page A-14
224 File Name: PA_DIST_*.dbf File Type: dbase file Scenario Specific: Yes I/O: Output Attribute OBJECTID Z Record number TEZ number Definition FFICP PSICP HMICP OTICP FFOCP PSOCP HMOCP OTOCP RGN CNTY FFICA PSICA HMICA OTICA FFOCA PSOCA HMOCA OTOCA Friends and family in-county productions Public shelter in-county productions Hotel/motel in-county productions Other in-county productions Friends and family out-of-county productions Public shelter out-of -county productions Hotel/motel out-of -county productions Other out-of -county productions Region code County code Friends and family in-county attractions Public shelter in-county attractions Hotel/motel in-county attractions Other in-county attractions Friends and family out-of-county attractions Public shelter out-of -county attractions Hotel/motel out-of -county attractions Other out-of -county attractions Methodology and Support Documentation Page A-15
225 File Name: Shelters File Type: GeoDatabase Feature Scenario Specific: Yes I/O: Input Attribute OBJECTID NAME Record number Name of shelter Definition ADDRESS CITY ZIP CAPACITY STATUS SWTEZ COUNTY TYPE CNTY_NAME Active Street address where shelter is located City where shelter is located Five digit ZIP code Amount of people that can take refuge at the shelter given in terms of beds Code indicating the type of shelter: 1=Primary shelter, 2=Other shelter The number of the TEZ in which the shelter is located Code indicating the county in which the shelter is located Text indicating whether the shelter is PRIMARY or OTHER Name of the county in which the shelter is located Code indicating whether the shelter is open or closed: 1=Open, 0=Closed Methodology and Support Documentation Page A-16
226 File Name: TEZ File Type: GeoDatabase Feature Scenario Specific: Yes I/O: Input Attribute OBJECTID SWTEZ RGN CNTY Record number TEZ number Region code County code Definition STORM FLOOD FIRE PCAT1 PCAT2 PCAT3 PCAT4 PCAT5 PCAT6 DSSB_06 DMSB_06 DTSB_06 PCSSO_06 PCMSO_06 PCTSO_06 Percent of households in a storm surge area (attribute is not used) Percent of households in an inland flood area (attribute is not used in the model) Percent of households in an area expected to be affected by forest fire (attribute is not used in the model) Percent of households in evacuation zone A Percent of households in evacuation zone B Percent of households in evacuation zone C Percent of households in evacuation zone D Percent of households in evacuation zone E Percent of households not located in an evacuation zone Number of site-built dwelling units 2006 single family Number of site-built dwelling units 2006 multi-family Number of site-built dwelling units 2006 total Percent of site-built dwelling units occupied during 2006 single family Percent of site-built dwelling units occupied during 2006 multi-family Percent of site-built dwelling units occupied during 2006 total Methodology and Support Documentation Page A-17
227 Attribute ODSSB_06 ODMSB_06 ODTSB_06 PHSSB_06 PHMSB_06 PHTSB_06 PSSB_06 PMSB_06 PTSB_06 VHSSB_06 VHMSB_06 VHTSB_06 VSSB_06 VMSB_06 VTSB_06 Definition Number of occupied site-built dwelling units 2006 single family Number of occupied site-built dwelling units 2006 multi-family Number of occupied site-built dwelling units 2006 total Persons per occupied site-built dwelling unit 2006 single family Persons per occupied site-built dwelling unit 2006 multi-family Persons per occupied site-built dwelling unit 2006 total Population in occupied site-built dwelling units 2006 single family Population in occupied site-built dwelling units 2006 multi-family Population in occupied site-built dwelling units 2006 total Vehicles per occupied site-built dwelling unit 2006 single family Vehicles per occupied site-built dwelling unit 2006 multi-family Vehicles per occupied site-built dwelling unit 2006 total Number of vehicles in occupied site-built dwelling units 2006 single family Number of vehicles in occupied site-built dwelling units 2006 multi-family Number of vehicles in occupied site-built dwelling units 2006 total D_MB_06 Number of mobile homes 2006 PC_MO_06 Percent of mobile homes occupied during 2006 O_MB_06 Number of occupied mobile homes 2006 PH_MO_06 Persons per occupied mobile home 2006 P_MB_06 Population in occupied mobile homes 2006 VH_MB_06 Vehicles per occupied mobile home 2006 V_MB_06 Number of vehicles in occupied mobile homes 2006 HM_U_06 Number of hotel-motel units 2006 Methodology and Support Documentation Page A-18
228 Attribute Definition HM_O_06 Hotel-motel occupancy rates 2006 HM_OU_06 Number of occupied hotel-motel units 2006 HM_PH_06 Persons per occupied hotel-motel unit 2006 HM_P_06 Population in occupied hotel-motel units 2006 HM_VH_06 Vehicles per occupied hotel-motel unit 2006 HM_V_06 Number of vehicles in occupied hotel-motel units 2006 SH_CP_06 Shelter capacity (number of persons) 2006 DSSB_10 DMSB_10 DTSB_10 PCSSO_10 PCMSO_10 PCTSO_10 ODSSB_10 ODMSB_10 ODTSB_10 PHSSB_10 PHMSB_10 PHTSB_10 PSSB_10 PMSB_10 PTSB_10 VHSSB_10 VHMSB_10 Number of site-built dwelling units 2010 single family Number of site-built dwelling units 2010 multi-family Number of site-built dwelling units 2010 total Percent of site-built dwelling units occupied during 2010 single family Percent of site-built dwelling units occupied during 2010 multi-family Percent of site-built dwelling units occupied during 2010 total Number of occupied site-built dwelling units 2010 single family Number of occupied site-built dwelling units 2010 multi-family Number of occupied site-built dwelling units 2010 total Persons per occupied site-built dwelling unit 2010 single family Persons per occupied site-built dwelling unit 2010 multi-family Persons per occupied site-built dwelling unit 2010 total Population in occupied site-built dwelling units 2010 single family Population in occupied site-built dwelling units 2010 multi-family Population in occupied site-built dwelling units 2010 total Vehicles per occupied site-built dwelling unit 2010 single family Vehicles per occupied site-built dwelling unit 2010 multi-family Methodology and Support Documentation Page A-19
229 Attribute VHTSB_10 VSSB_10 VMSB_10 VTSB_10 Definition Vehicles per occupied site-built dwelling unit 2010 total Number of vehicles in occupied site-built dwelling units 2010 single family Number of vehicles in occupied site-built dwelling units 2010 multi-family Number of vehicles in occupied site-built dwelling units 2010 total D_MB_10 Number of mobile homes 2010 PC_MO_10 Percent of mobile homes occupied during 2010 O_MB_10 Number of occupied mobile homes 2010 PH_MO_10 Persons per occupied mobile home 2010 P_MB_10 Population in occupied mobile homes 2010 VH_MB_10 Vehicles per occupied mobile home 2010 V_MB_10 Number of vehicles in mobile homes 2010 HM_U_10 Number of hotel-motel units 2010 HM_O_10 Hotel-motel occupancy rates 2010 HM_OU_10 Number of occupied hotel-motel units 2010 HM_PH_10 Persons per occupied hotel-motel unit 2010 HM_P_10 Population in occupied hotel-motel units 2010 HM_VH_10 Vehicles per occupied hotel-motel unit 2010 HM_V_10 Number of vehicles in occupied hotel-motel units 2010 SH_CP_10 Shelter capacity (number of persons) 2010 DSSB_15 DMSB_15 DTSB_15 PCSSO_15 Number of site-built dwelling units 2015 single family Number of site-built dwelling units 2015 multi-family Number of site-built dwelling units 2015 total Percent of site-built dwelling units occupied during 2015 single family Methodology and Support Documentation Page A-20
230 Attribute PCMSO_15 PCTSO_15 ODSSB_15 ODMSB_15 ODTSB_15 PHSSB_15 PHMSB_15 PHTSB_15 PSSB_15 PMSB_15 PTSB_15 VHSSB_15 VHMSB_15 VHTSB_15 VSSB_15 Definition Percent of site-built dwelling units occupied during 2015 multi-family Percent of site-built dwelling units occupied during 2015 total Number of occupied site-built dwelling units 2015 single family Number of occupied site-built dwelling units 2015 multi-family Number of occupied site-built dwelling units 2015 total Persons per occupied site-built dwelling unit 2015 single family Persons per occupied site-built dwelling unit 2015 multi-family Persons per occupied site-built dwelling unit 2015 total Population in occupied site-built dwelling units 2015 single family Population in occupied site-built dwelling units 2015 multi-family Population in occupied site-built dwelling units 2015 total Vehicles per occupied site-built dwelling unit 2015 single family Vehicles per occupied site-built dwelling unit 2015 multi-family Vehicles per occupied site-built dwelling unit 2015 total Number of vehicles in occupied site-built dwelling units 2015 single family Number of vehicles in occupied site-built dwelling units 2015 multi-family VMSB_15 PC_MO_15 Percent of mobile homes occupied during 2015 O_MB_15 Number of occupied mobile homes 2015 PH_MO_15 Persons per occupied mobile home 2015 P_MB_15 Population in occupied mobile homes 2015 VH_MB_15 Vehicles per occupied mobile home 2015 V_MB_15 Number of vehicles in mobile homes 2015 HM_U_15 Number of hotel-motel units 2015 HM_O_15 Hotel-motel occupancy rates 2015 Methodology and Support Documentation Page A-21
231 Attribute Definition HM_OU_15 Number of occupied hotel-motel units 2015 HM_PH_15 Persons per occupied hotel-motel unit 2015 HM_P_15 Population in occupied hotel-motel units 2015 HM_VH_15 Vehicles per occupied hotel-motel unit 2015 HM_V_15 Number of vehicles in occupied hotel-motel units 2015 SH_CP_15 Shelter capacity (number of persons) 2015 D_UNIV EAZ_1 EAZ_2 EAZ_3 EAZ_4 EAZ_5 EAZ_6 EAZ_7 EAZ_8 EAZ_9 EAZ_10 EAZ_11 Number of college dormitory rooms EAZ number used to aggregate assignment zones for the Apalachee region model EAZ number used to aggregate assignment zones for the Central Florida region model EAZ number used to aggregate assignment zones for the East Central Florida region model EAZ number used to aggregate assignment zones for the North Central Florida region model EAZ number used to aggregate assignment zones for the Northeast Florida region model EAZ number used to aggregate assignment zones for the South Florida region model EAZ number used to aggregate assignment zones for the Southwest Florida region model EAZ number used to aggregate assignment zones for the Tampa Bay region model EAZ number used to aggregate assignment zones for the Treasure Coast region model EAZ number used to aggregate assignment zones for the West Florida region model EAZ number used to aggregate assignment zones for the Withlacoochee region model Methodology and Support Documentation Page A-22
232 File Name: TripRatesMaster.dbf File Type: dbase file Scenario Specific: No I/O: Input Attribute CNTY HOME RATE ZNCAT CAT1 CAT2 CAT3 CAT4 CAT5 IND Definition County code number Determines whether home type is site-built or mobile home: 1=site-built, 2=mobile home Determines the type of rate described in the CAT1 through CAT5 columns: 1=evacuation rate, 2=public shelter destination rate, 3=out-of-county destination rate, 4=vehicle use rate, 5=friends and family destination rate, 6=hotel/motel destination rate, 7=other destination rate Evacuation zone category: 1=Zone A, 2=Zone B, 3=Zone C, 4=Zone D, 5=Zone E Rates taking affect during an evacuation Level A event (expressed as hundredths [e.g 55=0.55]) Rates taking affect during an evacuation Level B event (expressed as hundredths [e.g 55=0.55]) Rates taking affect during an evacuation Level C event (expressed as hundredths [e.g 55=0.55]) Rates taking affect during an evacuation Level D event (expressed as hundredths [e.g 55=0.55]) Rates taking affect during an evacuation Level E event (expressed as hundredths [e.g 55=0.55]) Indexing code not used by the model Methodology and Support Documentation Page A-23
233 Statewide Regional Evacuation Study Program Appendix B Traffic Flow Rates for Emergency Evacuation in the Florida Keys Methodology and Support Documentation
234
235
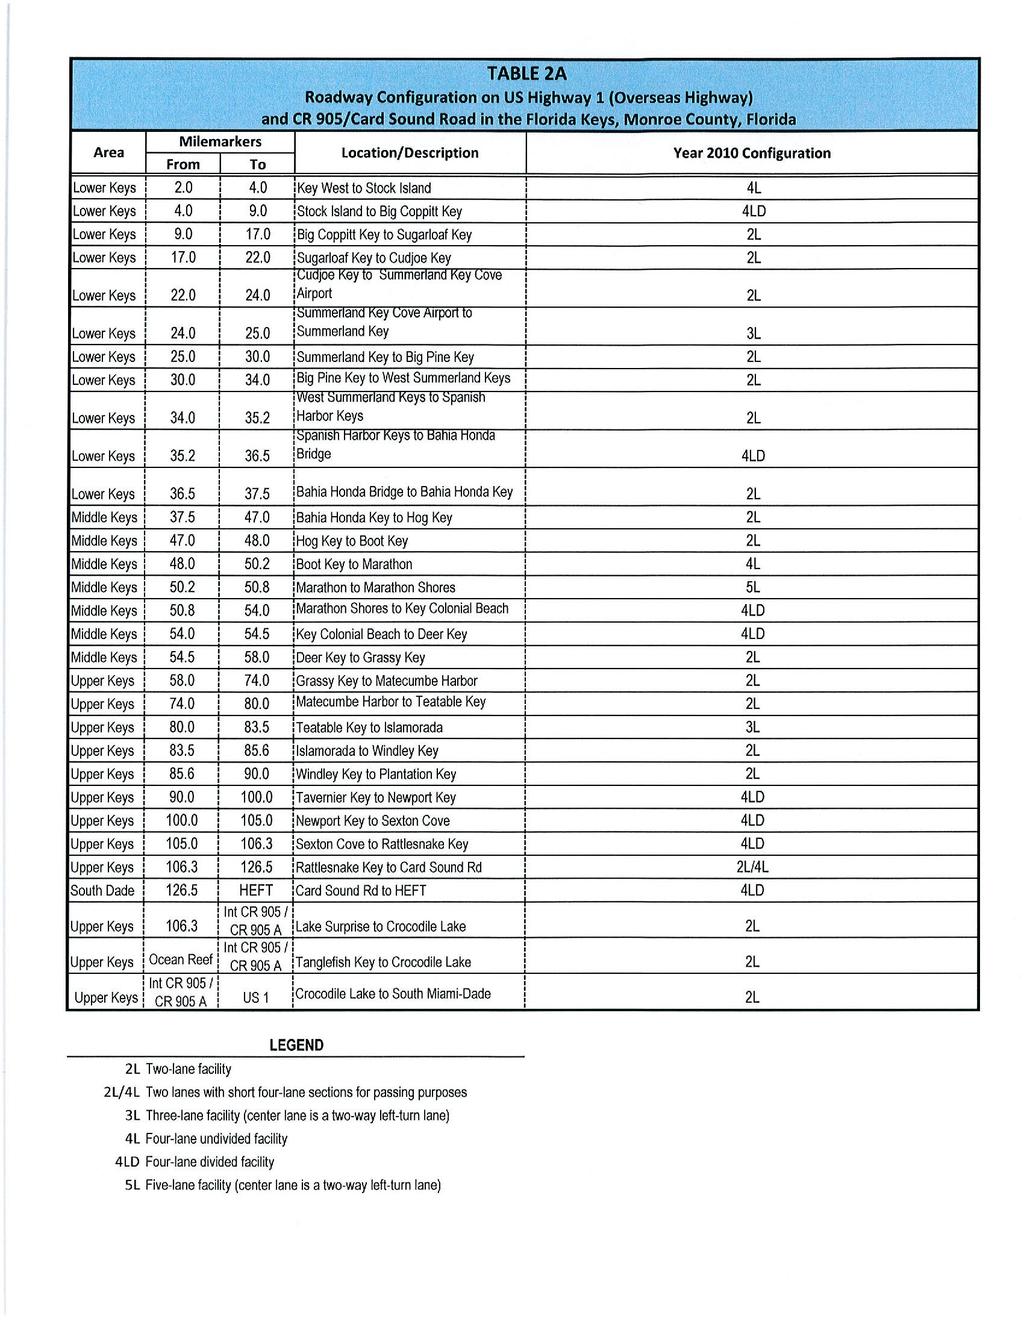
236
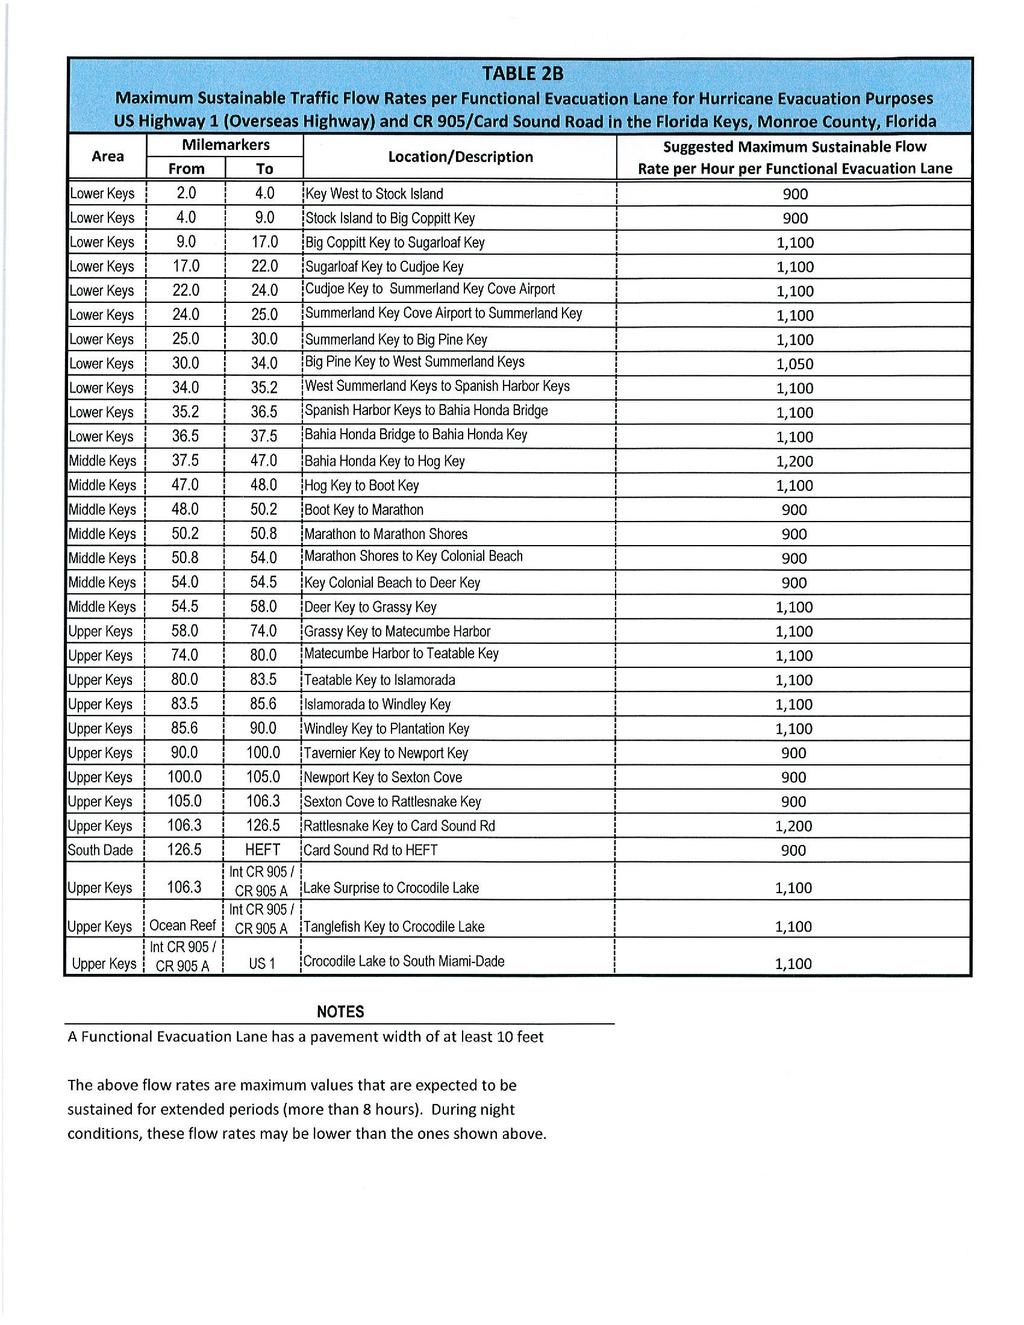
237
238 Statewide Regional Evacuation Study Program This page intentionally left blank. Methodology and Support Documentation
239 Appendix C Evacuation Transportation Model County and Region Codes Methodology and Support Documentation
240 County Codes for the SRESP Evacuation Model Code 1 Calhoun 2 Franklin 3 Gadsden 4 Gulf 5 Jackson 6 Jefferson 7 Leon 8 Liberty 9 Wakulla 10 DeSoto 11 Hardee 12 Highlands 13 Okeechobee 14 Polk 15 Brevard 16 Lake 17 Orange 18 Osceola 19 Seminole 20 Volusia 21 Alachua 22 Bradford 23 Columbia 24 Dixie 25 Gilchrist 26 Hamilton 27 Lafayette 28 Madison 29 Suwannee 30 Taylor 31 Union 32 Baker 33 Clay 34 Duval 35 Flagler 36 Nassau 37 Putnam 38 St Johns 74 Camden, GA 75 Glynn, GA 39 Broward County Methodology and Support Documentation Page C-1
241 Code 40 Miami-Dade 41 Monroe 68 Key West 69 Lower Keys 70 Middle Keys 71 Upper Keys 42 Charlotte 43 Collier 44 Glades 45 Hendry 46 Lee 47 Sarasota 48 Hillsborough 49 Manatee 50 Pasco 51 Pinellas 52 Indian River 53 Martin 54 Palm Beach 55 St Lucie 56 Bay 57 Escambia 58 Holmes 59 Okaloosa 60 Santa Rosa 61 Walton 62 Washington 72 Baldwin, AL 73 Mobile, AL 63 Citrus 64 Hernando 65 Levy 66 Marion 67 Sumter County Methodology and Support Documentation Page C-2
242 Region Codes for the SRESP Evacuation Model Code 1 Apalachee 2 Central 3 East Central 4 North Central 5 Northeast 6 South 7 Southwest 8 Tampa Bay 9 Treasure Coast 10 West 11 Withlacoochee Region Methodology and Support Documentation Page C-3
243 This page intentionally left blank.
 through")


-279-0880, Fax: (904)-279-0881, E-mail:")


244 Funding was provided by the Florida Legislature with funding from the Federal Emergency Management Agency (FEMA) through the Florida Division of Emergency Management. Florida Division of Emergency Management David Halstead, Director 2555 Shumard Oak Boulevard, Tallahassee, Florida Web site: Prepared and published by Northeast Florida Regional Council, 6850 Belfort Oaks Place, Jacksonville, Florida Tel: (904) , Fax: (904) , Web site: Jeffrey Alexander, Statewide Program Manager, Northeast Florida Regional Council Marshall Flynn, IS/GIS Manager, Tampa Bay Regional Planning Council Richard Ogburn, Asst. to the Director, Research & Budget, South Florida Regional Planning Council Robert Hamm P.E., Tallahassee Division Manager, Wilbur Smith Associates
Florida Courts E-Filing Authority Board. April Readiness Report
 Florida Courts E-Filing Authority Board Monday, April 30, 2012 efiling Project Team eportal Usage Statistics January 1, 2011 March 31, 2012: Cases Filed = 116,535 7,769 per month Documents Filed = 136,371
STATE OF FLORIDA CONTRACT NUMBER: ORDERING INSTRUCTIONS
 ORDERING INSTRUCTIONS COMPANY: TOSHIBA AMERICA BUSINESS SOLUTIONS, INC. FEDERAL IDENTIFICATION NUMBER: 33-0865305 CONTRACT Primary contact person responsible for answering questions regarding the contract
Tip Sheets for Running the Macro
 Steps to Request Files from Data Manager to Export to Macro 1. LOG ON Go to: http://www.bdi2datamanager.com Use your administrator log-in and password or another log-in that has administrative privileges
Florida Birth-to-Five Child Outcomes Measurement System
 TATS Tips For Running the Macro-LES 2017-2018 What IS a Macro? A Macro is a series of commands and functions that are stored and can be run whenever you need to perform the task. (Microsoft Office) The
Florida Birth-to-Five Child Outcomes Measurement System
 TATS Tips For Running the Macro-LEA 2017-2018 What IS a Macro? A Macro is a series of commands and functions that are stored and can be run whenever you need to perform the task. (Microsoft Office) The
CAPITAL PROJECTS PLAN
 CAPITAL PLAN 2009-2010 STATE UNIVERSITY SYSTEM (SUS) ITEM 14 SUS MAINTENANCE 00 0407 10 106 UF 10,067,558 00 0407 10 104 FSU 3,869,171 00 0407 10 101 FAMU 1,336,857 00 0407 10 108 USF 3,684,068 00 0407
Liaison Contact Information Brad Martin
 11 Plantation Rd. DeBary, FL 32713 (800) 6538-4097 (386) 575-2000 sunshine811.com Thank you for your interest in becoming a member of Sunshine 811. Membership is mandatory per s.556.104 of the Underground
An Assessment of Congestion in the Kansas City Region using the MARC Travel Demand Model
 An Assessment of Congestion in the Kansas City Region using the MARC Travel Demand Model The Congestion Management Process Federal Regulations state that all metropolitan planning organizations must carry
ENHANCED PARKWAY STUDY: PHASE 3 REFINED MLT INTERSECTION ANALYSIS
 ENHANCED PARKWAY STUDY: PHASE 3 REFINED MLT INTERSECTION ANALYSIS Final Report Prepared for Maricopa County Department of Transportation Prepared by TABLE OF CONTENTS Page EXECUTIVE SUMMARY ES-1 STUDY
Pavement Management Graphic Reporting System Using Existing IBM Hardware and SAS Software
 286 TRANSPORTATION RESEARCH RECORD 1311 Pavement Management Graphic Reporting System Using Existing IBM Hardware and SAS Software BRUCE T. DIETRICH The use of interactive computerized color graphics to
Traffic Impact Analysis Shotwell Road Residential Clayton, NC
 Shotwell Road Residential Clayton, NC TABLE O CONTENTS 1. INTROUCTION...1 1.1. Site Location and Study Area...1 1.2. Proposed Land Use and Site Access...2 1.3. Adjacent Land Uses...2 1.4. Existing Roadways...2
FLORIDA DEPARTMENT OF JUVENILE JUSTICE Slot Utilization/Residential Programs Report June 19, 2018
 FLORIDA DEPARTMENT OF JUVENILE JUSTICE Slot Utilization/Residential Programs Report June 19, 2018 Circuit Circuit 1 Escambia Boys Base Non-Secure 28 27 1 0 3 6 100.00% 07/12/2018 Circuit 1 Okaloosa Youth
APPENDIX E TRANSPORTATION
 APPENDIX E TRANSPORTATION 2011 PATRON SURVEYS VISSIM MODEL CALIBRATION AND VALIDATION Environmental and Planning Consultants 440 Park Avenue South 7th Floor New York, NY 10016 tel: 212 696-0670 fax:
Travel Demand Modeling and Project Coding Procedures
 Travel Demand Modeling and Project Coding Procedures Revised July 2008 As described in the Final Transportation Conformity Rule (section 93.122), travel demand models used to generate emission estimates
Northwest Needs Improvements Survey
 PW5 NW 107th Ave One thousand feet N of NW 122nd St Okeechobee Rd Widen bridge over Miami Canal PW6 NW 82nd Ave NW 8th St NW 12th St Construct new 4-lane road PW7 NW 87 Ave NW 36th St NW 58th St Add 2-lanes
APPENDIX D. Traffic Impact Analysis
 APPENDIX D Traffic Impact Analysis TRAFFIC IMPACT ANALYSIS CALEXICO SOLAR FARM I County of Imperial, California July 8, 2011 LLG Ref. 3-11-2034 Prepared by: Cara Leone Transportation Planner II Under the
Traffic Impact Study for the TAVA Homes Project at 1584 East Santa Clara Avenue in the City of Santa Ana
 Traffic Impact Study for the TAVA Homes Project at 1584 East Santa Clara Avenue in the City of Santa Ana March 2011 Prepared for: URS Corporation 2020 E. First Street, Suite #400 Santa Ana, CA 92705 Tel:
City of Tampa Transportation Impact Fee Update Study. Presentation to Mayor Iorio February 23, 2009
 City of Tampa Transportation Impact Fee Update Study Presentation to Mayor Iorio February 23, 2009 Presentation Overview ground Overview Impact Fee Districts Population and Employment Growth Transit Service
CITY OF KIRKLAND TRAFFIC IMPACT ANALYSIS GUIDELINES
 CITY OF KIRKLAND TRAFFIC IMPACT ANALYSIS GUIDELINES SEPA TRANSPORTATION CONCURRENCY - ROAD IMPACT FEES Introduction Revised February 2004 These guidelines describe how to prepare a traffic study, or Traffic
GORE BUILDING. 238 N. Massachusetts Avenue, Lakeland, FL 33801
 GORE BUILDING 238 N. Massachusetts Avenue, Lakeland, FL 33801 CDB LOCATION REDEVELOPMENT PROJECT MUNN PARK HISTORIC DISTRICT INCENTIVES AVAILABLE ADJACENT PARKING INCLUDED BK698301 Phone: (863) 683-3425
Downtown Boise Multimodal Center
 Treasure Valley High Capacity Transit Study Downtown Boise Multimodal Center Environmental Assessment June 2009 Prepared by the Federal Transit Administration and Valley Regional Transit. U.S. Department
Los Angeles County Metropolitan Transportation Authority (Metro) Arterial Performance Measures Framework
 Arterial Performance Measures Framework") Los Angeles County Metropolitan Transportation Authority (Metro) Arterial Performance Measures Framework Anita Vandervalk-Ostrander Iteris, Inc. Santa Ana, California, USA Steven Gota, Deputy Executive
Los Angeles County Metropolitan Transportation Authority (Metro) Arterial Performance Measures Framework Anita Vandervalk-Ostrander Iteris, Inc. Santa Ana, California, USA Steven Gota, Deputy Executive
TOLL-FLA ( ) FAX: (U.S. Only)
 FAX: (U.S. Only)") 1-888-TOLL-FLA (1-888-865-5352) FAX: 1-888-265-1725 (U.S. Only) Call Center Hours of Operation: Monday Friday, 7:00AM 7:00PM Saturday, 8:30AM 5:00PM Closed Sundays www.sunpass.com User Manual Revised January
1-888-TOLL-FLA (1-888-865-5352) FAX: 1-888-265-1725 (U.S. Only) Call Center Hours of Operation: Monday Friday, 7:00AM 7:00PM Saturday, 8:30AM 5:00PM Closed Sundays www.sunpass.com User Manual Revised January
NORTH HOUSTON HIGHWAY IMPROVEMENT PROJECT (NHHIP): SEGMENT 3
: SEGMENT 3") NORTH HOUSTON HIGHWAY IMPROVEMENT PROJECT (NHHIP): SEGMENT 3 Varuna A. Singh August 17, 2018 NHHIP OVERVIEW Project divided into three segments: Segment 1: I-45: from Beltway 8 to I-610 (9 mi) 45 Segment
NORTH HOUSTON HIGHWAY IMPROVEMENT PROJECT (NHHIP): SEGMENT 3 Varuna A. Singh August 17, 2018 NHHIP OVERVIEW Project divided into three segments: Segment 1: I-45: from Beltway 8 to I-610 (9 mi) 45 Segment
Electric Vehicle Infrastructure Location Identification Tool and Visualization Map. User Guide 1 INTRODUCTION
 Electric Vehicle Infrastructure Location Identification Tool and Visualization Map User Guide 1 INTRODUCTION The Infrastructure Location Identification Tool ( Tool ) and Visualization Map ( Map ) represent
STUDY REPORT #1 ADDENDUM
 STUDY REPORT #1 ADDENDUM 1.0 PURPOSE OF ADDENDUM This document is an addendum to Study Report #1: Sub-System Planning Alternatives. The purpose of this addendum is to bridge the gap between the initial
DISTRICT 1A Escambia, Santa Rosa. DISTRICT 1B Walton, Okaloosa
 8/7/2008 1 of 8 pages Randall Reese, M.D., Medical Pensacola Pediatrics, P.A. 1368 Country Club Road Gulf Breeze, FL 32563 (850) 934-9876 FAX (850) 916-0736 Email: randallreese@earthlink.net Satellite
Strategic Intermodal System Funding Strategy
 Strategic Intermodal System Funding Strategy FIRST FIVE YEAR PLAN Multimodal FY 201 /201 through FY 201 /201 Capacity Projects on the Strategic Intermodal System State of Florida Department of Transportation
Guidelines for Traffic Counting. May 2013
 Guidelines for Traffic Counting May 2013 Guidelines for Traffic Counting Matthew Rodwell Hastings District Council Abbreviations ADT AADT HCV HPMV NZTA RAMM RCA TMS VKT Average Daily Traffic Annual Average
Executive Summary. City of Goodyear. Prepared for: Prepared by: November, 2008 Copyright 2008, Kimley-Horn and Associates, Inc.
 Goodyear Intelligent Transportation Systems Strategic Plan Executive Summary Prepared for: City of Goodyear Prepared by: 191376000 Copyright 2008, Kimley-Horn and Associates, Inc. I. INTRODUCTION The City
I-95 Express Toll Lanes
 I-95 Express Toll Lanes MD Transportation Authority Regional Transportation Alliance May 6, 2013 1 Maryland Transportation Authority (MDTA) The Authority is an independent state agency that owns, finances
Lakeland, Florida Entitled 44 Acre Site: Retail / Multi-Family
 Lakeland, Florida Entitled 44 Acre Site: Retail / Multi-Family Internal street, utilities storm retention system in place hauger Property information Outparcels, Major Retail, and Multi-Family entitled
Using Geographical Information Systems to Enhance Public Finance Analyses
 Using Geographical Information Systems to Enhance Public Finance Analyses Presented by: Tindale-Oliver & Associates, Inc. Presentation Overview 1 2 Introduction City of Tampa Background 3 4 Project Funding
MAJOR PROJECTS STRATEGY
 MAJOR PROJECTS STRATEGY Texas Transportation Commission October 25, 2017 Outline and Goals Current TexasClearLanes initiatives to mitigate congestion for non-tolled projects Review Unified Transportation
The Freeway Performance Measurement System (PeMS) (PeMS Version 3)
 (PeMS Version 3)") The Freeway Performance Measurement System (PeMS) (PeMS Version 3) Table of Contents Background Capabilities Your Feedback Appendix 1 Background What is PeMS? The Freeway Performance Measurement System
The Freeway Performance Measurement System (PeMS) (PeMS Version 3) Table of Contents Background Capabilities Your Feedback Appendix 1 Background What is PeMS? The Freeway Performance Measurement System
Integrating Travel Demand Management into the Long-Range Planning Process 2017 AMPO
 Integrating Travel Demand Management into the Long-Range Planning Process 2017 AMPO October 19, 2017 Chattanooga 2045 RTP Chattanooga 2045 RTP addresses both transportation supply and demand Continued
Managing DC Work Zones: DDOT s Citywide Transportation Management Plan
 Managing DC Work Zones: DDOT s Citywide Transportation Management Plan ARTBA National Work Zone Management Conference September 20, 2016 1 Outline Citywide Transportation Management Plan (TMP) Citywide
SIMULATION AND ANALYSIS OF ARTERIAL TRAFFIC OPERATIONS ALONG THE US 61 CORRIDOR IN BURLINGTON, IOWA FINAL REPORT
 SIMULATION AND ANALYSIS OF ARTERIAL TRAFFIC OPERATIONS ALONG THE US 61 CORRIDOR IN BURLINGTON, IOWA FINAL REPORT Principal Investigator Tom Maze Principal Contributor Ali Kamyab Sponsored by the Engineering
Gaston County GIS. Interactive Mapping Website
 Gaston County GIS Interactive Mapping Website The Gaston County GIS mapping website optimizes the available window viewing area and has interactive tools, collapsible menus and movable windows. This map
Cedar Rapids ITS Deployment Project
 Cedar Rapids ITS Deployment Project Concept of Operations July 29, 2011 Table of Contents Section 1 Introduction Purpose Goal of ITS Deployments Section 2 Needs Assessment General Background Stakeholders
West Seattle and Ballard Link Extensions. Downtown Open House and Neighborhood Forum September 11, 2018
 West Seattle and Ballard Link Extensions Downtown Open House and Neighborhood Forum September 11, 2018 Agenda Why we re here today Alternatives development overview What we heard in Level 1 Level 2 alternatives
Concept Definition Report Adaptive Urban Signal Control Integration (AUSCI) Project. Executive Summary -- August 1995
 Project. Executive Summary -- August 1995") Executive Summary -- August 1995 This summary highlights the work performed as part of the AUSCI Concept Definition Report. Additional supporting and background material is presented in a separate document
Executive Summary -- August 1995 This summary highlights the work performed as part of the AUSCI Concept Definition Report. Additional supporting and background material is presented in a separate document
Looking Ahead. A Context for the Next Twenty Year Needs Assessment. July 2013
 Looking Ahead A Context for the Next Twenty Year Needs Assessment July 2013 A Larger Context for Twenty Year Needs Growing transit demand and complexity of travel paths and times Growing economy changing
A geographically-targeted digital advertising campaign, referred to as the Digital Advertising Campaign.
 The Original Florida Tourism Task Force 2009 NW 67th Place Gainesville, FL 32653-1603 Request for Proposals The Original Florida Tourism Task Force 2017 Marketing Project The Original Florida Tourism Task
Rutgers Interactive Lane Closure Application (RILCA) for Work Zone Planning User Manual. New Jersey Highway Authority. Garden State Parkway
 for Work Zone Planning User Manual. New Jersey Highway Authority. Garden State Parkway") Rutgers Interactive Lane Closure Application (RILCA) for Work Zone Planning User Manual Prepared for Garden State Parkway New Jersey Highway Authority April 2007 Developed by: Rutgers University Intelligent
Rutgers Interactive Lane Closure Application (RILCA) for Work Zone Planning User Manual Prepared for Garden State Parkway New Jersey Highway Authority April 2007 Developed by: Rutgers University Intelligent
Escambia-Santa Rosa Regional ATMS. Escambia-Santa Rosa Regional Advanced Traffic Management System (ATMS) Florida Alabama TPO
 Florida Alabama TPO") Escambia-Santa Rosa Regional ATMS Escambia-Santa Rosa Regional Advanced Traffic Management System (ATMS) Florida Alabama TPO TCC/CAC Meeting: April 11, 2016 TPO Meeting: April 13, 2016 Ben Faust, P.E.
Escambia-Santa Rosa Regional ATMS Escambia-Santa Rosa Regional Advanced Traffic Management System (ATMS) Florida Alabama TPO TCC/CAC Meeting: April 11, 2016 TPO Meeting: April 13, 2016 Ben Faust, P.E.
West of Hudson Regional Transit Access Study
 West of Hudson Regional Transit Access Study Open House Presentation June 1, 2009 1 Agenda 1. Progress to Date 2. Level 1 Screening Analysis 3. Level 2 Screening Criteria 4. Next Steps 5. Questions and
Expenditures Report, March 2017.xlsx
 3/1/2017 91.50 Demko, Todd Check 3/2/2017 9,656.08 Florida Department of Revenue Check 3/2/2017 14,116.49 Heart of Florida United Way, Inc. Check 3/2/2017 11,349.66 Children of Inmates, Inc. Check 3/2/2017
Verification Plan: Mitchell Hammock Road. Adaptive Traffic Signal Control System. Prepared by: City of Oviedo. Draft 1: June 2015
 Verification Plan: Mitchell Hammock Road Adaptive Traffic Signal Control System Red Bug Lake Road from Slavia Road to SR 426 Mitchell Hammock Road from SR 426 to Lockwood Boulevard Lockwood Boulevard from
Des Moines Area Regional Transit Non Rider Survey
 Moines Area Regional Transit Non Rider Survey helping organizations make better decisions since 1982 Findings Report Submitted to the Moines Area Regional Transit Authority by: ETC Institute 725 W. Frontier
Getting Results from Regional Traffic Incident Management Teams
 Getting Results from Regional Traffic Incident Management Teams Polk County, Florida TIM Team 2008 By: Don Olson and Arland T. (Ted) Smith Florida Department of Transportation District One If this incident
Florida Procedures for the Launch of GED Computer-Based Testing
 Eligibility to Test As of November 2012, all test takers in Florida are eligible to take both paper-based and computer-based versions of the exam. If a candidate has already tested on a paper-based format
Data Entry Style Guide for FL-ATIS RELEASE VERSION 1.6 (FINAL) MARCH 31, 2011
 MARCH 31, 2011") RELEASE VERSION 1.6 (FINAL) MARCH 31, 2011 Table of Contents 1. Roadway Description... 3 2. EM Location Long Name... 6 3. Cities and Metro Areas... 10 4. EM Reference Point Long Name... 13 5. Exit Number
RELEASE VERSION 1.6 (FINAL) MARCH 31, 2011 Table of Contents 1. Roadway Description... 3 2. EM Location Long Name... 6 3. Cities and Metro Areas... 10 4. EM Reference Point Long Name... 13 5. Exit Number
SIS 2045 ABM Zonal DATA Projections
 1-1 SIS 2045 ABM Zonal DATA Projections 1-2 Added Benefits Beyond the SIS Study Preview of 2045 LRTP Updates Provide some insight into the potential issues that may be encountered in the zonal data development
Speed Limit and Safety Nexus Studies for Automated Enforcement Locations in the District of Columbia DC Miles South of Pennsylvania Avenue SE
 Speed Limit and Safety Nexus Studies for Automated Enforcement Locations in the District of Columbia DC 295.4 Miles South of Pennsylvania Avenue SE Study Area and Location District PSA Ward ANC Phase Description
2017 STP PROJECT APPLICATION (OREGON)
") Project Title Section 1. Applicant Information Name of Lead Agency/ Organization Address Phone Number Name & Title of Contact Person Email Address Certified Local Public Agency (Yes/No) Section 2. Project
Project Title Section 1. Applicant Information Name of Lead Agency/ Organization Address Phone Number Name & Title of Contact Person Email Address Certified Local Public Agency (Yes/No) Section 2. Project
Town Center - Mixed Use Site 44+ Acres
 Town Center - Mixed Use Site 44+ Acres Lakeland, Florida Property information Outparcels, Major Retail, and Multi-Family entitled Infrastructure in place: All Utilities, Spine Road, Master Retention At
SHRP2 C10: Jacksonville
 SHRP2 C10: Jacksonville Partnership to Develop an Integrated Advanced Travel Demand Model and a Fine grained Timesensitive Network Presented by: Stephen Lawe Key Agency Partners: Florida Department of
THE SOUTHERN GATEWAY MANAGED LANES PROJECT. Public Meetings Summer 2015 June 23, June 25, July 7, July 9
 THE SOUTHERN GATEWAY MANAGED LANES PROJECT Public Meetings Summer 2015 June 23, June 25, July 7, July 9 History & Background Began in 2001 as a Major Investment Study (MIS), Schematic, and Environmental
Honorable Mayor and Members of the City Council. Memorandum of Understanding: Interstate 80 Integrated Corridor Mobility (I-80 ICM) Project
 Project") Office of the City Manager CONSENT CALENDAR May 1, 2012 To: From: Honorable Mayor and Members of the City Council Christine Daniel, Interim City Manager Submitted by: Andrew Clough, Director, Public Works
Office of the City Manager CONSENT CALENDAR May 1, 2012 To: From: Honorable Mayor and Members of the City Council Christine Daniel, Interim City Manager Submitted by: Andrew Clough, Director, Public Works
Hurricane Michael Preparation and Response. Christine Ashburn Chief Communications, Legislative & External Affairs
 Hurricane Michael Preparation and Response Christine Ashburn Chief Communications, Legislative & External Affairs Traditional Media Three press releases were sent to advise the press and stakeholders of
An Analysis of TDM Impacts on a Corridor Segment Research Findings
 An Analysis of TDM Impacts on a Corridor Segment Research Findings Phil Winters, CUTR TDM Program Director Liren Zhou, Graduate Research Assistant Sachin Rai, ITS Research Associate Nevine Georggi, TDM
DIXIE REGIONAL ITS ARCHITECTURE EXECUTIVE SUMMARY
 DIXIE REGIONAL ITS ARCHITECTURE EXECUTIVE SUMMARY SUBMITTED TO: and the Dixie Regional ITS Stakeholders Draft Report August 14, 2006 SUBMITTED BY: DRAFT FINAL REPORT Table of Contents 1.0 INTRODUCTION...
Addendum: Final Design Noise Analysis Study Noise Sensitive Area (NSA) 11 Post March 15, 2016 Open House Response to Comments
 11 Post March 15, 2016 Open House Response to Comments") Final Design Township of Lower Makefield, Bucks County, Pennsylvania Township of Ewing, Mercer County, New Jersey Addendum: Final Design Noise Analysis Study Noise Sensitive Area (NSA) 11 Post March 15,
Final Design Township of Lower Makefield, Bucks County, Pennsylvania Township of Ewing, Mercer County, New Jersey Addendum: Final Design Noise Analysis Study Noise Sensitive Area (NSA) 11 Post March 15,
CHARLESTON TRADE CENTER Up to 2.9 Million Available SF For Lease or Build to Suit Berkeley County, SC
 The Keith Corporation and JLL present: CHARLESTON TRADE CENTER Up to 2.9 Million Available SF For Lease or Build to Suit Berkeley County, SC Charleston Trade Center offers: Class A Industrial Campus Unparalleled
EXTENDING RED/PURPLE LINE REVENUE SERVICE TO EAST SIDE OF DOWNTOWN LOS ANGELES/ARTS DISTRICT
 16 One Gateway Plaza Los Angeles, CA 90012-2952 213.922.2000 Tel metro. net PLANNING AND PROGRAMMING COMMITTEE MARCH 18, 2015 SUBJECT: ACTION: EXTENDING RED/PURPLE LINE REVENUE SERVICE TO EAST SIDE OF
TRAFFIC IMPACT ANALYSIS. MIDWAY SOLAR FARM II County of Imperial, California January 11, 2011
 TRAFFIC IMPACT ANALYSIS MIDWAY SOLAR FARM II County of Imperial, California January 11, 2011 LLG Ref. 3-10-2013 Prepared by: Cara Leone Transportation Planner II Under the Supervision of: Chris Mendiara
Traffic Impact Study for the Girard Winery Project
 October 16, 2014 Ms. Heather McCollister 1512 D Street Napa, CA 94559 Traffic Impact Study for the Girard Winery Project Dear Ms. McCollister; Whitlock & Weinberger Transportation, Inc. (W-Trans) has completed
Ministry of Transportation and Infrastructure jurisdiction (337 km) Federal Parks Canada jurisdiction (103 km)
 Federal Parks Canada jurisdiction (103 km)") nfrastructure jurisdiction (337 km) HGHWAY 1 KAMLOOPS TO ALBERTA FOUR-LANNG PROGRAM Welcome Thank you for attending this community engagement on the Trans- Canada Highway 1 West Project, part of the Highway
nfrastructure jurisdiction (337 km) HGHWAY 1 KAMLOOPS TO ALBERTA FOUR-LANNG PROGRAM Welcome Thank you for attending this community engagement on the Trans- Canada Highway 1 West Project, part of the Highway
Council of State Governments. Takoma Langley Transit Center Purple Line Project Briefing. October 28, 2013
 Council of State Governments Takoma Langley Transit Center Purple Line Project Briefing October 28, 2013 Takoma Langley Transit Center Purpose and Need Provide a safe, attractive and efficient facility
Managed Lane owner decision needed San Mateo County s options Understanding revenues & costs Pros & cons of County s options Proposed next steps
 San Mateo County Transportation Authority Meeting August 2, 2018 1 OVERVIEW Managed Lane owner decision needed San Mateo County s options Understanding revenues & costs Pros & cons of County s options
Snohomish County Tomorrow Steering Committee
 Snohomish County Tomorrow Steering Committee Agenda Bill Action Item 3.c. Date: February 27, 2013 Subject: 2012 Buildable Lands Report Exhibits: SCT Planning Advisory Committee Feb 14, 2013 Recommendation;
Appendix D Supportive Transportation Materials
 Appendix D Supportive Transportation Materials D.1. Stakeholder Input and Coordination As noted in Section 1.7 of the main Master Plan document, there have been several opportunities for stakeholders to
Rural Expressway Intersection Characteristics that Contribute to Reduced Safety Performance
 Rural Expressway Intersection Characteristics that Contribute to Reduced Safety Performance Garrett D. Burchett Center for Transportation Research and Education Iowa State University 2901 South Loop Drive,
MOST TRUSTED ADVISER IN THE TOLL INDUSTRY
 MOST TRUSTED ADVISER IN THE TOLL INDUSTRY The HNTB Companies Infrastructure Solutions HNTB Toll Clients Alamo Regional Mobility Authority Bay Area Toll Authority Burlington County Bridge Commission Cameron
Appendix M. Lifeline Sector Coordination
 Appendix M. Lifeline Sector Coordination Regional Water Supply Resiliency Project Phase 2 Summary Report July 2018 This page intentionally left blank. Regional Water Supply Resiliency Project Phase 2 Summary
Metrobus 30s Line Enhancements
 Customer Service, Operations and Safety Committee Action Item III-C February 14, 2008 Metrobus 30s Line Enhancements Washington Metropolitan Area Transportation Authority Board Action/Information Summary
SAND: Simulator and Analyst of Network Design 1.0
 SAND: Simulator and Analyst of Network Design 0 OUTLINE Introduction Model Structure Interface User Instructions Click here for a PDF version of this file. INTRODUCTION Simulator and Analyst of Network
Bluetooth Travel Time Technology Evaluation Using the BlueTOAD TM
 Bluetooth Travel Time Technology Evaluation Using the BlueTOAD TM E01271 PennDOT District 6-0 ITS & Support Open End Contract Work Order #1 Submitted To: Pennsylvania Department of Transportation Engineering
First Coast Outer Beltway
 First Coast Outer Beltway Public-Private Partnership Forum May 5, 2010 Introduction The purpose of this Forum is to have an exchange of information between FDOT and the Public- Private Partnership industry.
CHILD WELFARE PRE-SERVICE TRAINING PROVIDERS March Pre-Service Provider CPI & FSC Pre-Service Provider CPI Pre-Service Provider - FSC
 1 Lakeview Center Contact: Gary Holloway Jr. UWF Child Welfare Training Town and Country Plaza Address: 3300 N. Pace Boulevard Suite 519 Pensacola, FL 32505 Phone: 850-598-0421 Email: GHolloway@uwf.edu
M50 Demand Management Study
 Study Briefing paper to the Strategic Policy Committees (Transport) of : Dun Laoghaire Rathdown County Council, Dublin City Council Fingal County Council South Dublin Co Council 5 th June 2013 December
Creating Dallas-Fort Worth s Transportation System: Celebrating Partnerships and Milestones
 Creating Dallas-Fort Worth s Transportation System: Celebrating Partnerships and Milestones Presentation to the Texas Transportation Commission August 27, 2014 Presenters Mike Cantrell Commissioner, Dallas
Texas Clear Lanes. Congestion Relief Initiative
 Texas Clear Lanes Congestion Relief Initiative March 2016 Governor Greg Abbott s Charge In September 2015, Governor Greg Abbott challenged the Texas Transportation Commission (Commission) and the (TxDOT)
District (K-12) ITV Contacts
 ITV Contacts") District (K-12) s Alachua County Schools (10) Joe Baldry Television Production Manager 3700 N.E. 53rd Avenue Gainesville FL 32609-2000 Phone: 352/995-6860 x267 352/955-6872 Email: baldrygj@sbac.edu Baker
District (K-12) s Alachua County Schools (10) Joe Baldry Television Production Manager 3700 N.E. 53rd Avenue Gainesville FL 32609-2000 Phone: 352/995-6860 x267 352/955-6872 Email: baldrygj@sbac.edu Baker
An Analysis of TDM Impacts on a Corridor Segment
 An Analysis of TDM Impacts on a Corridor Segment Phil Winters, CUTR TDM Program Director Liren Zhou, Graduate Research Assistant Sachin Rai, ITS Research Associate Nevine Georggi, TDM Research Associate
Calipatria Solar Farm TIA
 Calipatria Solar Farm TIA Prepared for: 7SM 8ME, LLC 71SM 8ME, LLC c/o 8minutenergy Renewables LLC Prepared by: Fehr & Peers March 25, 211 IE1-37 TABLE OF CONTENTS Executive Summary... i Project Trip Estimates...
2018 State and Federal Legislative Program
 2018 State and Federal Legislative Program STATE TRANSPORTATION FUNDING The passage of HB 2313 (2013) was the result of bipartisan cooperation throughout the Commonwealth. The regional funding provided
MARTA BOARD OF DIRECTORS OCTOBER 4, 2018
 MARTA BOARD OF DIRECTORS OCTOBER 4, 2018 TODAY S AGENDA o Key driver of the program o Recommended plan o Project summaries o Next steps 2 KEY DRIVER: PUBLIC INPUT o Atlanta City Design o Atlanta s Transportation
November 28, 2012 ALTERNATIVES ANALYSIS PUBLIC MEETING
 November 28, 2012 ALTERNATIVES ANALYSIS PUBLIC MEETING Project Background Description of the Project Alternatives Analysis Process Project Progress Activity Stations Comments Adjourn 2 VIA spent 2 years
Design Considerations for Real-time Arterial Performance Measurement Systems Using Transit Bus Probes
 Design Considerations for Real-time Arterial Performance Measurement Systems Using Transit Bus Probes Abraham Emmanuel & David Zavattero Chicago Department of Transportation Project Goals Estimate traffic
Highway Performance Monitoring System
 Highway Performance Monitoring System Version 1.0 June 2011 Quick Start Guide for Version 8.0 Federal Highway Administration Table of Contents Chapter 1 Introduction... 1 Chapter 2 HPMS Workflow... 2 Chapter
PROJECT TIMELINE. Next steps. Plan. Start of Service
 PROJECT TIMELINE 2018 2019 2020 2021 2022 2023 WE ARE HERE Plan Develop Build Develop design options for termini, station locations, and transit operations Conduct environmental research Assess funding
Using ArcGIS Server and ArcGIS Mobile for Disaster Response Putnam County, Florida
 Using ArcGIS Server and ArcGIS Mobile for Disaster Response Putnam County, Florida Victoria Smith GIS Programmer/Analyst 1 Adjacent counties Clay County, Florida - north St. Johns County, Florida - northeast
2014 UNIFIED TRANSPORTATION PROGRAM (UTP) UPDATE
 UPDATE") 2014 UNIFIED TRANSPORTATION PROGRAM (UTP) UPDATE Texas Transportation Commission June 26, 2014 Proposed amendments under consideration Funding-level adjustments Project list updates Projects under consideration
2014 UNIFIED TRANSPORTATION PROGRAM (UTP) UPDATE Texas Transportation Commission June 26, 2014 Proposed amendments under consideration Funding-level adjustments Project list updates Projects under consideration
Climate Change/Extreme Weather Vulnerability Risk Assessment:
 Climate Change/Extreme Weather Vulnerability Risk Assessment: Federal Highway Administration (FHWA) Pilot Study for the Dallas-Fort Worth Region June 4, 2014 2014 TxDOT Transportation Planning Conference
Utilization of TSMO Practices in Highway Construction Work Zones: A Case Study
 Utilization of TSMO Practices in Highway Construction Work Zones: A Case Study James Webb, P.E., Iowa Department of Transportation Liz Finarty, P.E., Iowa Department of Transportation James Armstrong,
Central Corridor. - Central Corridor. Management Committee, Light Rail Transit. Rail-Volution - Weaving Transit into Existing Communities
 - Central Corridor Rail-Volution - Weaving Transit into Existing Communities Management Committee, October 31, 2009 June Improving 11, 2008 mobility Easing congestion Strengthening our communities Twin
Intelligent Transportation Systems (ITS)
") Intelligent Transportation Systems (ITS) Systems Engineering (SE) Requirement Intelligent Transportation Systems (ITS) means electronics, communications, or information processing used singly or in combination
Intelligent Transportation Systems (ITS) Systems Engineering (SE) Requirement Intelligent Transportation Systems (ITS) means electronics, communications, or information processing used singly or in combination