INFOREX SA. Financial Information Services. FX Quick Reference Guide
|
|
|
- Evan McKenzie
- 5 years ago
- Views:
Transcription
1 INFOREX SA Financial Information Services FX Quick Reference Guide

2 I N F O R E X S A R E A L - T I M E F I N A N C I A L I N F O R M A T I O N S E R V I C E S FX Quick Reference Guide Inforex SA 44 Kolokotroni Str. 5 th Floor Athens Phone Fax
3 Table of Contents Introduction 1 C H A P T E R 3 C H A P T E R 1 FX2000 MAIN MENU FX2000 Main Menu 2 Ready-made Price Windows 5 How to Call a pre-defined layout 6 How To Save/Delete/Rename a layout 7 TECHNICAL ANALYSIS How to Add an Indicator 22 How to Change Parameters 24 How to Change Period 25 How To Change Chart-type 26 How To Draw Trend lines 26 ASE Ticker 8 ASE Ups and Downs 9 Session Statistics 10 C H A P T E R 4 DATA SPEED & CONNECTION 27 Waiting Order Analysis 10 ASE Splits 11 Balance Sheets Analysis 12 Greek News 13 AFX News 15 C H A P T E R 2 PRICE WINDOW How To Create a Price Window 16 Settings of the Price Window 19 How To Display Level 2 Data Window 20

4 Introduction Accessing, Displaying Real-Time Prices FX2000 is an easy-to-use and very sophisticated real-time financial information, news displaying and analysis platform which works with digital satellite technology. F X2000 displays information on a Layout basis. Layouts are consisted of multiple windows which may be a price window, chart window, news window etc. 1

5 Chapter 1 FX2000 Main Menu FX2000 is managed from the FX2000 Main Menu at the left topmost corner of the screen. Here, you may find the domestic & international markets categorized and the main functionalities of the system. 2
6 The system comes with a set of predefined layouts. I.e. if you like to see Athens Stock Exchange Main Market security prices, clicking the ASE Stock Market \ ASE Main Stock Market options from the FX2000 menu will be enough. FX2000 Main Menu Option ASE Stock Market ASE Bond Market ASE Indices ASE Categories ADEX ASE Ticker ASE Ticker (Blocks) Cyprus Stock Exchanges ADEX Ticker ASE Ups/Downs Session Statistics Function Displays the price windows for ASE Main, ASE Parallel, ASE New Stock and ASE Stock Rights Markets. Displays the price windows for ASE Main Bond and Block Bond Markets. Displays the price windows for ASE main and sectoral (category) indices. Also securities bound to a certain sectoral indice (category) are displayed separately. Displays a dialog box in which all the ASE categories are listed. User can select a category from the list and the securities in that category are displayed in a price window. Displays the ADEX Index/Stock/Stock Future & Option price windows. Displays all trades from ASE. The user can filter the trades according to the security, minimum volume and turnover. Displays all block trades from ASE. The user can filter the block trades according to the security, minimum volume and turnover. Displays the price windows for CSE Markets. Displays all trades from ADEX Displays most traded securities in volume, most gainers and most losers. Displays session statistics window covering the number of securities decreased, increased and stable and the turnover associated. Level 2 Price Distribution Displays all bid and ask volumes at each price distribution, including during pre-session levels 3
7 Waiting Order Analysis ASE Clock ASE Splits Balance Sheet Analysis Greek News Turkish Markets Money Markets International Indices AFX News English News Select Report Price Window Spreadsheet Window Real-time Portfolio Ticker Settings Displays a special analysis generally used a market indicator for ASE securities; all the 3 buying and selling levels of stocks (pending orders) are calculated in volume cumulatively. After potential buying power is compared with potential selling power. Displays the latest time stamp received from the ASE. Displays all the splits in detail (capital increases and dividend payments) happened in ASE. Displays multiple financial statements of a single company for different periods, multiple financial statements of the selected securities for a certain period and selected values from financial statements for a certain period for the selected stocks. Displays ASE Corporate News and Greek News from sources like Athens News Agency, Euro2day, and Inforex News Center. Displays all the Turkish Domestic markets. Displays the price windows for international currencies and spot rates, LIBOR EURIBOR rates. Displays the international indices price window. Displays DJI News Displays Anatolian Agency News in English Not Used. Displays an empty price window which can be customized with the securities selected and price fields (columns) added. Price windows can be configured multi-columned. Displays an Excel-like spreadsheet window on which special calculations in real-time can be made. Not Used. Displays a ticker window on which the selected securities are scrolled from right to left in the specified period. Main settings related to the operating of the system are gathered here. Technical settings for the data receipt, 4

8 licences, language settings etc. are entered from this option. Data Transfer Data Rate Exit Program Export & import facilities for data transfer (MetaStock, Advanced Gate, TXT file etc). First option to check if the data receipt stops. Normally, the Successful Packets option should increase. Exiting the system. Ready Price windows from the Main Menu (i) ASE Main Stock Market (ii) ASE Summary Bar (iii) ASE Indices 5
 and a dialog box in which the pre-defined layouts are")
9 How to Call a Pre-defined Layout? Layouts are called from the Main Toolbar. To open a pre-defined layout, press the Saved Layouts button (shown in red rectangular area) and a dialog box in which the pre-defined layouts are listed. Double-click on the layout you would like to load to the screen. 6
10 How to Save / Delete / Rename a Layout? After preparing a layout which contains multiple windows, to save this layout for the first time, Display the sub-menu of any window and select File \ Save Layout As. Enter a name for your layout and press OK. If you made a change in one of your existing layouts, to save the layout in the same name, Press the Save Layout button in the Main Toolbar or, Display the sub-menu of any window and select File \ Save Layout. To rename the layout, Display the sub-menu of any window and select File \ Rename Layout As. To clear all the windows in the screen and create a new layout, Display the sub-menu of any window and select File \ New Layout or File \ Clear Layout. 7

11 ASE Ticker ASE Ticker window is called from FX2000 Menu. It displays all the trades for all stocks listed in ASE. The Time, Security, Trade Price, %Daily Difference, Trade Volume, Turnover in Euro and if the trade is from bid or ask fields are displayed. Rows can be colored depending on, if the trade is from the bid price / ask price, if the trade price is higher / lower than previous trade price or if the trade price is 8

12 higher / lower than yesterday s closing price. Higher prices are highlighted green, lowers are highlighted red. Trades can be filtered according to the security, minimum Volume or minimum Turnover. As the general functionality of the system, the data on the window can be exported to other programs in Excel or text format. Retail trades can be displayed by selecting ASE Ticker (Retail) and block trades can be displayed by selecting ASE Ticker (Blocks) from the FX2000 menu. ASE Ups & Downs Window This windows displays the top gainers and losers in ASE. 9


13 Session Statistics This windows displays the number and turnover of increasing / decreasing / remaining same securities with a pie chart. It is used mostly as a general market indicator. Waiting Order Analysis This property is a unique functionality of FX2000. The window displays the buying and selling power of securities individually in one table in terms of lots and turnover. The values are comparable with each other, therefore it is very to determine at first sight which security has a buying or selling pressure. Also, the total sum of buying orders and selling orders are calculated. From these two indicators a Net Sum is calculated which is used as a general market indicator for determining the market direction. 10

14 ASE Splits ASE stock splits are displayed in these window historically. 11

15 Balance Sheet Analysis ASE stock splits are displayed in these window historically. 12


16 Greek News Local Greek News are displayed in the following window. If you double click on any news headline, you would get the full story. 13


17 When there is a related news for a specific stock each day, then the stock symbol is highlighted that day in the price window. Either with a right click or F6 button, you can reach all the related news of that stock. Once you read the related news, the highlight on the stock disappears. If some of the headlines are read, then these headlines have a different color to the rest of the headlines. In the above case, you can see that headlines that are already read have grey coloring instead of black. 14

18 AFX News AFX International News are displayed in the following window. If you double click on any news headline, you would get the full story. Flash news are highlighted in blue, and as you can see above, you can filter all news according to country, industry or news criteria. 15
19 Chapter 2 How to Create a Price Window? Layouts are mainly consisted of price windows. There are 3 ways to create a price window. (i) Copying a pre-defined price window already existing in a different layout (ii) Creating a new price window from zero and customizing it (iii) Calling a pre-defined market price window from FX2000 menu and customizing it. (i) To copy a price window that already exists in a layout, Right click in the price window you want to copy and select View Settings \Copy options. The window will be copied to the memory. Open the layout that you want to add the copied price window to and again select View Settings \ Paste option from the sub-menu which is displayed by pressing the right button. (ii) To create a new price window from zero and to customize it, Select Price Window option from the FX2000 menu and a default Price Window will be displayed on the screen. 16


20 From the window sub-menu (right click) choose Select Security option to add the securities you want to see in the price window from the dialog box displayed. Choose Select Column option from the sub-menu and a dialog box with the list of available price fields will be displayed. You can add / delete the price fields from here. 17
21 Once the security & column setup of the new price window is finished, you can arrange color, font and multi-column structure of the price window from its sub-menu. (iii) To call a pre-defined price window from FX2000 menu and customize it. From FX2000 Main Menu, select the pre-defined price window (i.e. to create a price window covering the stocks from ASE, you can display ASE Stock Market \ ASE Main Stock Market on the screen) On the pre-defined price window add / delete the securities and the price fields as mentioned above in 2. 18

22 Settings of the Price Window The View Settings of a price window covers color and font settings, row height, displaying / removing horizontal / vertical gridlines and scrollbars, displaying rectangular frames for symbol column, setting the price window to be moved with one click if the header of the window is not displayed, displaying the symbols in a periodical loop, auto-fitting the column widths, hiding / displaying window or price field headers, sorting, displaying symbols in a single column or multi columns, and formatting the numbers displayed. To add / delete a symbol (stock) to or from a price window, Select the symbol from the price window simply by clicking on it, to add a new symbol press CRTL+A and enter the symbol from the keyboard. To remove symbol, select the symbol and press CTRL+S. 19

23 How to display Level2 Data Window Double click on the figures of the symbol or select Level 2 Data option from the sub-menu of the price window. From the sub menu of a price window you can display, Option Level 2 Data Show Retail Detail Custom Detail Traded Value Function Calls the Level 2 Data window in which 3 levels of ASE market depth data are displayed. Also selected price fields and all the trades are displayed. Shows all the retail transactions below Calls the Detail window in which the daily session statistics of a symbol is displayed. Calls a window in which selected price fields can be displayed. Displays Traded Value window in which volumes occurred at price levels are shown. This window is mostly used for determining intraday support and resistance levels. Level 2 Price Distribution Shows Level 2 Price distribution 20
24 Time & Sales Chart Intraday Chart Related News Balance Sheet Splits Future Splits Historical Statistics Security Info Company Profile Last Prices Displays the Time & Sales window in which all the trades are shown. Displays chart for technical analysis. Displays intraday chart Displays the news related with the stock if there is any. Displays financial figures of a security. Displays splits which occur after a capital increase or a dividend payment. Displays future splits that are announced by the company. Calls a window in which daily, weekly, monthly and yearly statistics are displayed. Displays a window in which general trading information about the security is shown. Displays company profile. Displays a ticker window in which last trades are shown. 21


25 Chapter 3 Technical Analysis You can customize all technical analysis charts, with your own indicators, moving averages and trend lines, etc. You can either add an indicator with a right click or with the indicator tool bar. How to Add an Indicator You can access the Indicator tool bar from the Main Tool Bar at the top. 22


26 You can drag and drop the indicators from the Indicator tool bar into the technical analysis chart. 23

27 How to Change Parameters of an Indicator From Right-Click in Technical Analysis, you can change parameters of the indicators you have previously chosen. You get a window like below, and you can customize the indicator with your own parameters. 24


28 How to Change Period From Right-Click, you can change the period of your Chart. 25


29 How to Change Chart-type How to Draw Trend lines 26

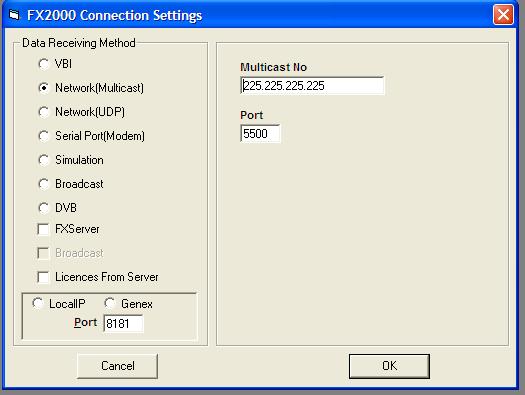
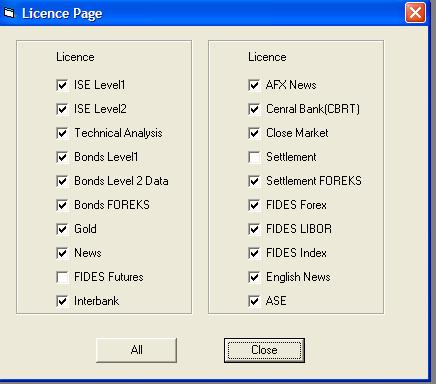
30 Chapter 4 Data Speed and Connection Click on the button to see your data. You must make sure that your error rate is 0.00% and unsuccessful packets are less than 50. If this is not the case, please call Technical Support Desk of Inforex at You must also make sure that the ASE Clock is correct. This is the best way to confirm that you are receiving data. If for any reason, the ASE Clock has stopped, then you must again call the Support Desk at Inforex and they will most likely to ask you to check two windows, which are displayed on the next page. The first one is Connection Settings, which you access with a Right Click anywhere on the program via Settings. The second one is Licenses window, which is again accessed via a Right Click anywhere on the program via Settings. You must talk through the Connection Settings with the Support Desk of Inforex, and at the Licences window, you must click the ALL button, and make sure that some of the licences are ticked, and the Close the window. 27

31 28
32 29
33 30
Desktop Platform. FXPlus. User Guide Inforex Α.Ε All Rights Reserved
 Desktop Platform FXPlus User Guide EN 2014 Inforex Α.Ε All Rights Reserved EN FXPlus-User Manual Copyright 2014 Inforex S.A. All Rights Reserved No part of this document can be reproduced, transferred,
KBC Securities Trader
 KBC Securities Trader Welcome! This guide introduces you to the main functionality and possibilities of KBC Securities Trader. For more detailed information on each window, press F1 for Help or right-click
Proquote Web User Guide
 Proquote Web User Guide Version 1.0 07/03/2013 Table of Contents 1 Accessing Proquote Web... 3 2 Proquote Web Homepage... 3 2.1 Homepage Contents... 3 3 List Menu... 4 3.1 Stocks... 4 3.1.1 Stock Detail...
Perfect Analysis A User Guide
 Perfect Analysis A User Guide COVERAGE Perfect Analysis is a financial analysis, reporting and charting service providing data on over 120,000 globally listed companies. The database provides historic
Highlights in TeleTrader Professional 10.7
 Highlights in TeleTrader Professional Request historical data in Microsoft Excel using Excel Add-in Improved Quick Quote document with market depth and configurable columns News Flash rows available in
USER MANNUAL. Version 1.9.6
 USER MANNUAL Version 1.9.6 Table of Contents 1. About this Document... 3 2. Manuscript Composition... 4 3. Getting Started... 4 3.1 BIPL Direct Login... 4 3.1.1 To log on to BIPL Direct... 5 3.1.2 Server
Creating a Spreadsheet by Using Excel
 The Excel window...40 Viewing worksheets...41 Entering data...41 Change the cell data format...42 Select cells...42 Move or copy cells...43 Delete or clear cells...43 Enter a series...44 Find or replace
MICROSOFT EXCEL BIS 202. Lesson 1. Prepared By: Amna Alshurooqi Hajar Alshurooqi
 MICROSOFT EXCEL Prepared By: Amna Alshurooqi Hajar Alshurooqi Lesson 1 BIS 202 1. INTRODUCTION Microsoft Excel is a spreadsheet application used to perform financial calculations, statistical analysis,
Quote & News With TraderConnect PR
 1 Quote & News With TraderConnect PR RO TM www.n2nconnect.com helpdesk@n2nconnect.com Quote & News With TraderConnect PRO TM 2 Information in this document is deemed accurate at the time of publishing.
BTS Trading Station. Quick Reference Guide Cash Markets
 BTS Trading Station Quick Reference Guide Cash Markets Contents Quick Reference Guide 1.0 Getting Started 4 1.1 Application Layout 4 1.2 User Login and Password Management 4 1.3 Default Set Up 5 1.4 Virtual
Starting Excel application
 MICROSOFT EXCEL 1 2 Microsoft Excel: is a special office program used to apply mathematical operations according to reading a cell automatically, just click on it. It is called electronic tables Starting
Reports. Chapter V. In This Chapter
 Chapter V. Reports In This Chapter 1. Reports Overview 260 Explanation of the Reports window 260 Features of reports 262 2. Using Reports functions 264 Generating reports 264 Viewing reports 269 Printing
JSGCL TRADING TERMINAL. User Manual Getting Started
 JSGCL TRADING TERMINAL User Manual Getting Started Table of Contents 1 ABOUT THIS DOCUMENT... 5 1.1 Document Composition... 5 2 INTRODUCTION... 6 3 GETTING STARTED... 7 3.1 Login... 7 3.1.1 Login Window...
TECH REAL MT4 USER GUIDE
 TECH REAL MT4 USER GUIDE 1. MetaTrader 4 Interface 2 2. Trading Instrument 3-7 3. Trading Categories 8 4. Trading 9-16 5. Stop-loss Position 17-18 6. Chart 19 7. File 20 8. View 21-35 9. Insert 36 10.
You can retrieve the chart by inputting the symbol of stock, warrant, index futures, sectoral
 Chart Menu Chart menu displays graphical data with histories and 16 major technical analysis tools and Trend Line. You can click at the tool you like. Chart will be changed according to your selection.
COMPUTER TECHNOLOGY SPREADSHEETS BASIC TERMINOLOGY. A workbook is the file Excel creates to store your data.
 SPREADSHEETS BASIC TERMINOLOGY A Spreadsheet is a grid of rows and columns containing numbers, text, and formulas. A workbook is the file Excel creates to store your data. A worksheet is an individual
THE EXCEL ENVIRONMENT... 1 EDITING...
 Excel Essentials TABLE OF CONTENTS THE EXCEL ENVIRONMENT... 1 EDITING... 1 INSERTING A COLUMN... 1 DELETING A COLUMN... 1 INSERTING A ROW... DELETING A ROW... MOUSE POINTER SHAPES... USING AUTO-FILL...
What is DealBook WEB?
 What is DealBook WEB? DealBook WEB helps you trade quickly from anywhere you can connect to the Internet. A browser-based application, DealBook WEB provides a simple platform for beginning traders as well
Maybank2u.com Online Stocks User Guide
 I INTRODUCTION...1 UNIVERSAL FEATURES...2 CALENDAR FEATURE...2 SEARCH FEATURE...2 RESET BUTTON...2 PRINT BUTTON...2 BACK BUTTON...2 EXIT BUTTON...2 HOME...3 LIVE QUOTES...5 SCREEN INTRODUCTION...5 SCREEN
Microsoft How to Series
 Microsoft How to Series Getting Started with EXCEL 2007 A B C D E F Tabs Introduction to the Excel 2007 Interface The Excel 2007 Interface is comprised of several elements, with four main parts: Office
Office Applications II Lesson Objectives
 Office Applications II Lesson Unit 1: MICROSOFT EXCEL SPREADSHEETS BASICS What is a Spreadsheet and What Are Its Uses? Define spreadsheets Define the Microsoft Excel application List business, consumer,
ZeroWeb Manual. Securities offered to you by TradeZero America, Inc. Page 1 of 11
 ZeroWeb Manual Securities offered to you by TradeZero America, Inc Page 1 of 11 Contents WATCH LIST...3 CHARTS...4 LEVEL 2, TIME and SALES, ORDER ENTRY...6 SHORT LIST and LOCATES...7 NEW WINDOWS and LAYOUT...8
FEBRUARY 27, 2017 TRADECAST CLIENT PAKISTAN STOCK EXCHANGE LIMITED CATALYST IT SOLUTIONS CATALYST IT SOLUTIONS
 FEBRUARY 27, 2017 TRADECAST CLIENT PAKISTAN STOCK EXCHANGE LIMITED CATALYST IT SOLUTIONS CATALYST IT SOLUTIONS TRADECAST CLIENT USER GUIDE VERSION 1.2 CATALYST IT SOLUTIONS 1 DISCLAIMER CATALYST IT SOLUTIONS
TRADING WORKSTATION [NEW] ADDITIONAL FEATURE LIST
![TRADING WORKSTATION [NEW] ADDITIONAL FEATURE LIST](/thumbs/85/92107386.jpg "TRADING WORKSTATION [NEW] ADDITIONAL FEATURE LIST") ABSTRACT The intend of this document is to provide the information regarding additional features incorporated in the latest release of New Trading Workstation. TRADING WORKSTATION [NEW] ADDITIONAL FEATURE
ABSTRACT The intend of this document is to provide the information regarding additional features incorporated in the latest release of New Trading Workstation. TRADING WORKSTATION [NEW] ADDITIONAL FEATURE
Microsoft Access II 1.) Opening a Saved Database Music Click the Options Enable this Content Click OK. *
 Opening a Saved Database Music Click the Options Enable this Content Click OK. *") Microsoft Access II 1.) Opening a Saved Database Open the Music database saved on your computer s hard drive. *I added more songs and records to the Songs and Artist tables. Click the Options button next
Microsoft Access II 1.) Opening a Saved Database Open the Music database saved on your computer s hard drive. *I added more songs and records to the Songs and Artist tables. Click the Options button next
FactSet Quick Start Guide
 FactSet Quick Start Guide Table of Contents FactSet Quick Start Guide... 1 FactSet Quick Start Guide... 3 Getting Started... 3 Inserting Components in Your Workspace... 4 Searching with FactSet... 5 Market
Excel 2010: Getting Started with Excel
 Excel 2010: Getting Started with Excel Excel 2010 Getting Started with Excel Introduction Page 1 Excel is a spreadsheet program that allows you to store, organize, and analyze information. In this lesson,
The HOME Tab: Cut Copy Vertical Alignments
 The HOME Tab: Cut Copy Vertical Alignments Text Direction Wrap Text Paste Format Painter Borders Cell Color Text Color Horizontal Alignments Merge and Center Highlighting a cell, a column, a row, or the
Making EXCEL Work for YOU!
 Tracking and analyzing numerical data is a large component of the daily activity in today s workplace. Microsoft Excel 2003 is a popular choice among individuals and companies for organizing, analyzing,
Creating an Excel resource
 Excel Mobile Excel Mobile is a Microsoft application similar to Excel, but designed to run on handhelds. This mobile version of Excel is a spreadsheet application that allows you to manipulate numbers,
GCSE CCEA GCSE EXCEL 2010 USER GUIDE. Business and Communication Systems
 GCSE CCEA GCSE EXCEL 2010 USER GUIDE Business and Communication Systems For first teaching from September 2017 Contents Page Define the purpose and uses of a spreadsheet... 3 Define a column, row, and
Excel 2013 for Beginners
 Excel 2013 for Beginners Class Objective: This class will familiarize you with the basics of using Microsoft Excel. Class Outline: Introduction to Microsoft Excel 2013... 1 Microsoft Excel...2-3 Getting
Table of Contents CLIENT INTERNET ACCESS...4. Mobile Devices...4. Browser Compatibility...4 SYSTEM NAVIGATION Header Links...
 WebLink User Guide Table of Contents CLIENT INTERNET ACCESS...4 Mobile Devices...4 Browser Compatibility...4 SYSTEM NAVIGATION... 9 Header Links... 9 Navigation Bar... 9 USER OPTIONS... 9 Change Password...
WELCOME TO WEBLINK Accessing WebLink...6. Registration Process...6. Log In Process After Registration On-Line Help...
 WebLink User Guide Table of Contents WELCOME TO WEBLINK... 1 Internet Explorer Browser Settings...3 WebLink Features... 5 Accessing WebLink...6 Registration Process...6 Log In Process After Registration...
Excel 2013 Intermediate
 Excel 2013 Intermediate Quick Access Toolbar... 1 Customizing Excel... 2 Keyboard Shortcuts... 2 Navigating the Spreadsheet... 2 Status Bar... 3 Worksheets... 3 Group Column/Row Adjusments... 4 Hiding
Using Microsoft Excel
 Using Microsoft Excel Table of Contents The Excel Window... 2 The Formula Bar... 3 Workbook View Buttons... 3 Moving in a Spreadsheet... 3 Entering Data... 3 Creating and Renaming Worksheets... 4 Opening
3/31/2016. Spreadsheets. Spreadsheets. Spreadsheets and Data Management. Unit 3. Can be used to automatically
 MICROSOFT EXCEL and Data Management Unit 3 Thursday March 31, 2016 Allow users to perform simple and complex sorting Allow users to perform calculations quickly Organizes and presents figures that can
Learning Microsoft Excel Module 1 Contents. Chapter 1: Introduction to Microsoft Excel
 Module 1 Contents Chapter 1: Introduction to Microsoft Excel The Microsoft Excel Screen...1-1 Moving the Cursor...1-3 Using the Mouse...1-3 Using the Arrow Keys...1-3 Using the Scroll Bars...1-4 Moving
Excel 2013 Part 2. 2) Creating Different Charts
 Creating Different Charts") Excel 2013 Part 2 1) Create a Chart (review) Open Budget.xlsx from Documents folder. Then highlight the range from C5 to L8. Click on the Insert Tab on the Ribbon. From the Charts click on the dialogue
Excel 2013 Part 2 1) Create a Chart (review) Open Budget.xlsx from Documents folder. Then highlight the range from C5 to L8. Click on the Insert Tab on the Ribbon. From the Charts click on the dialogue
CME E-quotes Wireless Application for Android Welcome
 CME E-quotes Wireless Application for Android Welcome This guide will familiarize you with the application, a powerful trading tool developed for your Android. Table of Contents What is this application?
Microsoft Excel 2010 Part 2: Intermediate Excel
 CALIFORNIA STATE UNIVERSITY, LOS ANGELES INFORMATION TECHNOLOGY SERVICES Microsoft Excel 2010 Part 2: Intermediate Excel Spring 2014, Version 1.0 Table of Contents Introduction...3 Working with Rows and
How to Download Data from the Bloomberg Terminal
 How to Download Data from the Bloomberg Terminal Author: Chengbo Fu Department of Accounting and Finance This tutorial demonstrates how to download data from the Bloomberg terminal. It consists of two
Gloucester County Library System. Excel 2010
 Gloucester County Library System Excel 2010 Introduction What is Excel? Microsoft Excel is an electronic spreadsheet program. It is capable of performing many different types of calculations and can organize
BaSICS OF excel By: Steven 10.1
 BaSICS OF excel By: Steven 10.1 Workbook 1 workbook is made out of spreadsheet files. You can add it by going to (File > New Workbook). Cell Each & every rectangular box in a spreadsheet is referred as
EXCEL 2003 DISCLAIMER:
 EXCEL 2003 DISCLAIMER: This reference guide is meant for experienced Microsoft Excel users. It provides a list of quick tips and shortcuts for familiar features. This guide does NOT replace training or
Morningstar Add-In (Microsoft Excel ) Release Notes
 Release Notes") Morningstar Add-In (Microsoft Excel ) Release Notes Release 7.8 Auto-complete search suggestions for Time Series Create Favorite List for frequently-used feeds in Time Series New on and off peak average
Morningstar Add-In (Microsoft Excel ) Release Notes Release 7.8 Auto-complete search suggestions for Time Series Create Favorite List for frequently-used feeds in Time Series New on and off peak average
Microsoft Excel 2010 Basic
 Microsoft Excel 2010 Basic Introduction to MS Excel 2010 Microsoft Excel 2010 is a spreadsheet software in the new Microsoft 2010 Office Suite. Excel allows you to store, manipulate and analyze data in
QST Mobile Application for Android
 QST Mobile Application for Android Welcome This guide will familiarize you with the application, a powerful trading tool developed for your Android. Table of Contents What is this application? Logging
Excel. Spreadsheet functions
 Excel Spreadsheet functions Objectives Week 1 By the end of this session you will be able to :- Move around workbooks and worksheets Insert and delete rows and columns Calculate with the Auto Sum function
Basic Excel. Helen Mills OME-RESA
 Basic Excel Helen Mills OME-RESA Agenda Introduction- Highlight Basic Components of Microsoft Excel Entering & Formatting Data, Numbers, & Tables Calculating Totals & Summaries Using Formulas Conditional
Trading Terminal Version 2.0.2_15
 Trading Terminal Version 2.0.2_15 User Manual Getting Started ABBASI AND COMPANY 6-Shadman Race Course Road, Lahore, Pakistan. Ph: +92-42-36282700 Fax: +92-42-36282727 Web: www.abbasiandcompany.com Copyright
Skittles Excel Project
 Skittles Excel Project Entering Your Data and Creating Data Displays 1. Open Microsoft Excel 2. Create a table for your Skittles colors: a. In cell A1 type in a title for your chart b. In cell A2 type
[ScalpTool Technical User Guide]
![[ScalpTool Technical User Guide]](/thumbs/75/72275317.jpg "[ScalpTool Technical User Guide]") [ScalpTool Technical User Guide] Revision History Version Date Revision Description 1.0 8/21/2011 First revision 1.1 4/2/2012 Add images in some commands ii Table of Contents ScalpTool Table of Contents
[ScalpTool Technical User Guide] Revision History Version Date Revision Description 1.0 8/21/2011 First revision 1.1 4/2/2012 Add images in some commands ii Table of Contents ScalpTool Table of Contents
For Microsoft Office XP or Student Workbook. TECHNOeBooks Project-based Computer Curriculum ebooks.
 TECHNOConsultant For Microsoft Office XP or 2003 Student Workbook TECHNOeBooks Project-based Computer Curriculum ebooks www.bepublishing.com Copyright 1993 2010. TechnoKids Inc. in partnership with B.E.
SaxoTraderPRO Intro guide
 SaxoTraderPRO Intro guide Table of Content SETTING UP THE WORKSPACE... page 3 SAVING AND MANAGING WORKSPACES... page 7 WATCHLIST MANAGEMENT... page 8 OPENING ONE OR MANY CHART MODULES... page 10 TRADE
Telemet IQ. Telemet Orion s Microsoft Excel Add-In
 Telemet IQ Telemet Orion s Microsoft Excel Add-In Executive Summary Telemet puts research, analytics and real-time market data at your fingertips. Telemet IQ, bundled with the Telemet Orion investment
Getting Started with BarchartX
 Getting Started with BarchartX April 2007 Getting Started with BarchartX I ve signed up for BarchartX (or, signed up for a free trial). Now what? Within minutes, you will receive an email from Barchart
NetAdvantage. User s Guide
 NetAdvantage User s Guide Welcome to NetAdvantage. This user guide will show you everything you need to know to access and utilize the wealth of information available from S&P NetAdvantage. This is an
Ms excel. The Microsoft Office Button. The Quick Access Toolbar
 Ms excel MS Excel is electronic spreadsheet software. In This software we can do any type of Calculation & inserting any table, data and making chart and graphs etc. the File of excel is called workbook.
Rev. C 11/09/2010 Downers Grove Public Library Page 1 of 41
 Table of Contents Objectives... 3 Introduction... 3 Excel Ribbon Components... 3 Office Button... 4 Quick Access Toolbar... 5 Excel Worksheet Components... 8 Navigating Through a Worksheet... 8 Making
Mergent Horizon. A User s Guide
 Mergent Horizon A User s Guide Welcome to Mergent Horizon. This user guide will show you everything you need to know to access and utilize the wealth of information available from Mergent Horizon. This
Introduction to Excel 2013 Part 2
 Introduction to Excel 2013 Part 2 Open a file Select File from the Menu bar, select Open from the drop down menu, navigate to the place where the file was stored, double-left click on the file name. Modify
Application of Skills: Microsoft Excel 2013 Tutorial
 Application of Skills: Microsoft Excel 2013 Tutorial Throughout this module, you will progress through a series of steps to create a spreadsheet for sales of a club or organization. You will continue to
WEEK NO. 12 MICROSOFT EXCEL 2007
 WEEK NO. 12 MICROSOFT EXCEL 2007 LESSONS OVERVIEW: GOODBYE CALCULATORS, HELLO SPREADSHEET! 1. The Excel Environment 2. Starting A Workbook 3. Modifying Columns, Rows, & Cells 4. Working with Worksheets
Excel Main Screen. Fundamental Concepts. General Keyboard Shortcuts Open a workbook Create New Save Preview and Print Close a Workbook
 Excel 2016 Main Screen Fundamental Concepts General Keyboard Shortcuts Open a workbook Create New Save Preview and Print Close a Ctrl + O Ctrl + N Ctrl + S Ctrl + P Ctrl + W Help Run Spell Check Calculate
Microsoft Excel 2016 / 2013 Basic & Intermediate
 Microsoft Excel 2016 / 2013 Basic & Intermediate Duration: 2 Days Introduction Basic Level This course covers the very basics of the Excel spreadsheet. It is suitable for complete beginners without prior
USER MANUAL. Contents. Analytic Reporting Tool Basic for SUITECRM
 USER MANUAL Analytic Reporting Tool Basic for SUITECRM Contents ANALYTIC REPORTING TOOL FEATURE OVERVIEW... 2 PRE-DEFINED REPORT LIST AND FOLDERS... 3 REPORT AND CHART SETTING OVERVIEW... 5 Print Report,
Technical Charting With TraderConnect PR
 1 Technical Charting With TraderConnect PR RO TM www.n2nconnect.com helpdesk@n2nconnect.com Technical Charting With TraderConnect PRO TM 2 Information in this document is deemed accurate at the time of
Microsoft Office Excel
 Microsoft Office 2007 - Excel Help Click on the Microsoft Office Excel Help button in the top right corner. Type the desired word in the search box and then press the Enter key. Choose the desired topic
Table of Contents CLIENT INTERNET ACCESS...4. Mobile Devices...4. Browser Compatibility...4 SYSTEM NAVIGATION Header Links...
 WebLink Guide November 2017 Table of Contents CLIENT INTERNET ACCESS...4 Mobile Devices...4 Browser Compatibility...4 SYSTEM NAVIGATION... 9 Header Links... 9 Navigation Bar... 9 USER OPTIONS... 9 Change
INDEX. A) Various functionalities of the chart 2. B) The Menu Bar 4. C) How to create a portfolio 5. Quick Reference 1) Adding a new chart 7
 Various functionalities of the chart 2. B) The Menu Bar 4. C) How to create a portfolio 5. Quick Reference 1) Adding a new chart 7") INDEX Topic Page No A) Various functionalities of the chart 2 B) The Menu Bar 4 C) How to create a portfolio 5 Quick Reference 1) Adding a new chart 7 2) Modifying an existing chart To change the timeframe
INDEX Topic Page No A) Various functionalities of the chart 2 B) The Menu Bar 4 C) How to create a portfolio 5 Quick Reference 1) Adding a new chart 7 2) Modifying an existing chart To change the timeframe
UBS-SFA Online. User guide. Page 1 of 36
 UBS-SFA Online User guide Page 1 of 36 Contents 1. Introduction... 3 2. Logging in... 4 2.1 How to log in... 4 2.2 Changing the PIN on your token... 4 3. Finances Check on your portfolio(s) and assets...
ZagTrader Mobile User Guide Version 1.01
 ZagTrader Mobile User Guide Version 1.01 Ghassan Al Masri ZagTrader 6/9/2014 Table of Content - Installation... 3 - Watchlist... 5 - Quote... 6 *Overview... 7 *Chart... 8 *News... 9 *Gainers/Losers...
FXCC MT4 MultiTerminal User Guide
 FXCC MT4 MultiTerminal User Guide Content 1. Installation 2. Terminal 2.1. File Menu 2.2. Edit Menu 2.3. View Menu 2.4. Tools Menu 2.4.1. Options Tabs 2.5. Windows 2.6. Help 3. Meta Trader User Interface
Kenora Public Library. Computer Training. Introduction to Excel
 Kenora Public Library Computer Training Introduction to Excel Page 2 Introduction: Spreadsheet programs allow users to develop a number of documents that can be used to store data, perform calculations,
i Maximum Number of Windows Open: 4 (incl. HK-Share & A-Share)
") 2.12 Watch List 2.12.1 Watch List (HK) In the Watch List (HK Stock), you may create multiple portfolios to monitor a number of stocks, warrants, indexes, or futures in one window at the same time. Each
2.12 Watch List 2.12.1 Watch List (HK) In the Watch List (HK Stock), you may create multiple portfolios to monitor a number of stocks, warrants, indexes, or futures in one window at the same time. Each
Day : Date : Objects : Open MS Excel program * Open Excel application. Select : start. Choose: programs. Choose : Microsoft Office.
 Day : Date : Objects : Open MS Excel program * Open Excel application. Select : start Choose: programs Choose : Microsoft Office Select: Excel *The interface of Excel program - Menu bar. - Standard bar.
Gloucester County Library System EXCEL 2007
 Gloucester County Library System EXCEL 2007 Introduction What is Excel? Microsoft E x c e l is an electronic s preadsheet program. I t is capable o f performing many diff e r e n t t y p e s o f c a l
Microsoft Excel Level 1
 Microsoft Excel 2010 Level 1 Copyright 2010 KSU Department of Information Technology Services This document may be downloaded, printed, or copied for educational use without further permission of the Information
Quick Reference Summary
 Microsoft Excel 2010 Quick Reference Summary Microsoft Excel 2010 Quick Reference Summary 3-D Chart, Rotate EX 462 3-D Rotation button (Chart Tools Layout tab Background, change rotation (Format Chart
Creating Reports in Access 2007 Table of Contents GUIDE TO DESIGNING REPORTS... 3 DECIDE HOW TO LAY OUT YOUR REPORT... 3 MAKE A SKETCH OF YOUR
 Creating Reports in Access 2007 Table of Contents GUIDE TO DESIGNING REPORTS... 3 DECIDE HOW TO LAY OUT YOUR REPORT... 3 MAKE A SKETCH OF YOUR REPORT... 3 DECIDE WHICH DATA TO PUT IN EACH REPORT SECTION...
Table of Contents 2 QST MOBILE APPLICATION FOR IPHONE
 Table of Contents What is this application? Logging in Login screen Login options Entering and viewing contracts Pages Contracts About Quote Detail page Contract Details Symbol Search Block Trades Charts
Microsoft Excel Important Notice
 Microsoft Excel 2013 Important Notice All candidates who follow an ICDL/ECDL course must have an official ICDL/ECDL Registration Number (which is proof of your Profile Number with ICDL/ECDL and will track
BusinessObjects Frequently Asked Questions
 BusinessObjects Frequently Asked Questions Contents Is there a quick way of printing together several reports from the same document?... 2 Is there a way of controlling the text wrap of a cell?... 2 How
Working with Data in Microsoft Excel 2010
 Working with Data in Microsoft Excel 2010 This document provides instructions for using the sorting and filtering features in Microsoft Excel, as well as working with multiple worksheets in the same workbook
Microsoft Excel Keyboard Shortcuts
 Microsoft Excel Keyboard Shortcuts Here is a complete list of keyboard shortcuts for Microsoft Excel. Most of the shortcuts will work on all Excel versions on Windows based computer. Data Processing Shortcuts
CHAPTER 4: MICROSOFT OFFICE: EXCEL 2010
 CHAPTER 4: MICROSOFT OFFICE: EXCEL 2010 Quick Summary A workbook an Excel document that stores data contains one or more pages called a worksheet. A worksheet or spreadsheet is stored in a workbook, and
Excel 2007 New Features Table of Contents
 Table of Contents Excel 2007 New Interface... 1 Quick Access Toolbar... 1 Minimizing the Ribbon... 1 The Office Button... 2 Format as Table Filters and Sorting... 2 Table Tools... 4 Filtering Data... 4
Spreadsheet and Graphing Exercise Biology 210 Introduction to Research
 1 Spreadsheet and Graphing Exercise Biology 210 Introduction to Research There are many good spreadsheet programs for analyzing data. In this class we will use MS Excel. Below are a series of examples
MS Excel Advanced Level
 MS Excel Advanced Level Trainer : Etech Global Solution Contents Conditional Formatting... 1 Remove Duplicates... 4 Sorting... 5 Filtering... 6 Charts Column... 7 Charts Line... 10 Charts Bar... 10 Charts
Objectives. Objectives. Plan Ahead. Starting Excel 3/9/2010. Excel Chapter 3. Microsoft Office 2007
 Objectives Microsoft Office 2007 Excel Chapter 3 What-If Analysis, Charting, and Working with Large Worksheets Rotate text in a cell Create a series of month names Copy, paste, insert, and delete cells
Spreadsheet definition: Starting a New Excel Worksheet: Navigating Through an Excel Worksheet
 Copyright 1 99 Spreadsheet definition: A spreadsheet stores and manipulates data that lends itself to being stored in a table type format (e.g. Accounts, Science Experiments, Mathematical Trends, Statistics,
SaxoTraderPRO Intro guide
 SaxoTraderPRO Intro guide Table of Content SETTING UP THE WORKSPACE... page 3 SAVING AND MANAGING WORKSPACES (latest edition).............. page 7 WATCHLIST MANAGEMENT... page 8 OPENING ONE OR MANY CHART
Erlanger 2000 (E2K) Research and Analytics Platform Initial Installation and Quick Start User Guide
 Research and Analytics Platform Initial Installation and Quick Start User Guide") Erlanger 2000 (E2K) Research and Analytics Platform Initial Installation and Quick Start User Guide I. Installation Phil Erlanger Research Co., Inc. (PER) or Quantitative Partners, Inc. (QPI) will guide
Erlanger 2000 (E2K) Research and Analytics Platform Initial Installation and Quick Start User Guide I. Installation Phil Erlanger Research Co., Inc. (PER) or Quantitative Partners, Inc. (QPI) will guide
Basic Microsoft Excel Skills
 Basic Microsoft Excel Skills Note : This tutorial is based upon Microsoft Excel 2000. If you are using MSExcel 1997 or 2002, there may be some operations which look slightly different (e.g. graphs), but
Freestyle Reports DW DIG Crosstabs, Hotspots and Exporting
 Exporting a Report You can export a report into other file formats. Acrobat (.pdf) Before exporting a report to.pdf format, make sure the columns in your report provide ample space for their contents.
Open. Select the database and click. Print. Set printing options using the dropdown menus, then click the
 The Original Quick Reference Guides Microsoft Access 2010 Access is a tool for creating and managing databases collections of related records structured in an easily accessible format such as a table,
Excel. Excel Options click the Microsoft Office Button. Go to Excel Options
 Excel Excel Options click the Microsoft Office Button. Go to Excel Options Templates click the Microsoft Office Button. Go to New Installed Templates Exercise 1: Enter text 1. Open a blank spreadsheet.
Working with Data and Charts
 PART 9 Working with Data and Charts In Excel, a formula calculates a value based on the values in other cells of the workbook. Excel displays the result of a formula in a cell as a numeric value. A function
How to Create Excel Dashboard used in Solutions Conference By Matt Mason
 How to Create Excel Dashboard used in Solutions Conference 2017 By Matt Mason The following is a step by step procedure to create the Dashboard presented by Matt Mason in the Excel Tips and Tricks session